Embed Size (px)
Citation preview

MASTER'S THESIS
Sensor Communication in Smart Citiesand Regions: An Efficient IoT-BasedRemote Health Monitoring System
Manh Khoi Ngo2015
Master of Science (120 credits)Computer Science and Engineering
Luleå University of TechnologyDepartment of Computer science, Electrical and Space engineering

Luleå University of TechnologyDepartment of Computer Science, Electrical and Space EngineeringPERCCOM Master Program
Master’s Thesis inPERvasive Computing & COMmunications
for sustainable development
Ngo Manh Khoi
SENSOR COMMUNICATION IN SMART CITIES ANDREGIONS: AN EFFICIENT IOT-BASED REMOTE HEALTH
MONITORING SYSTEM
2015
Supervisors: Professor Christer Åhlund - (Luleå University of Technology)Dr. Karan Mitra - (Luleå University of Technology)Dr. Saguna Saguna - (Luleå University of Technology)
Examiners: Professor Eric Rondeau - (Universite de Lorraine)Professor Jari Porras - (Lappeenranta University of Technology)Associate Professor Karl Andersson - (Luleå University ofTechnology)

This thesis is prepared as part of an European Erasmus Mundus programPERCCOM - Pervasive Computing & COMmunications for sustainable develop-ment.
This thesis has been accepted by partner institutions of the consortium (cf. UDL-DAJ,no1524, 2012 PERCCOM agreement).
Successful defense of this thesis is obligatory for graduation with the following nationaldiplomas:
• Master in Complex Systems Engineering (University of Lorraine);
• Master of Science in Technology (Lappeenranta University of Technology);
• Degree of Master of Science (120 credits) - Major: Computer Science and Engi-neering, Specialisation: Pervasive Computing and Computers for sustainable de-velopment (Luleå University of Technology).

ABSTRACT
Luleå University of TechnologyDepartment of Computer Science, Electrical and Space EngineeringPERCCOM Master Program
Ngo Manh Khoi
Sensor communication in Smart cities and regions: An efficient IoT-based remotehealth monitoring system
Master’s Thesis inPERvasive Computing & COMmunicationsfor sustainable development
2015
92 pages, 53 figures, 27 tables, and 3 appendices.
Examiners: Professor Eric Rondeau - (Universite de Lorraine)Professor Jari Porras - (Lappeenranta University of Technology)Associate Professor Karl Andersson - (Luleå University of Technology)
Keywords: Smart City, Sensor Communication, Internet of Things, Smart Region, Proto-col Communication, Experimentation, Prototype, Case study
Recent advances in Information and Communication Technology (ICT), especially thoserelated to the Internet of Things (IoT), are facilitating smart regions. Among many ser-vices that a smart region can offer, remote health monitoring is a typical application ofIoT paradigm. It offers the ability to continuously monitor and collect health-related datafrom a person, and transmit the data to a remote entity (for example, a healthcare serviceprovider) for further processing and knowledge extraction. An IoT-based remote healthmonitoring system can be beneficial in rural areas belonging to the smart region wherepeople have limited access to regular healthcare services. The same system can be benefi-cial in urban areas where hospitals can be overcrowded and where it may take substantialtime to avail healthcare. However, this system may generate a large amount of data. In

order to realize an efficient IoT-based remote health monitoring system, it is imperativeto study the network communication needs of such a system; in particular the bandwidthrequirements and the volume of generated data. The thesis studies a commercial productfor remote health monitoring in Skellefteå, Sweden. Based on the results obtained viathe commercial product, the thesis identified the key network-related requirements of atypical remote health monitoring system in terms of real-time event update, bandwidthrequirements and data generation. Furthermore, the thesis has proposed an architecturecalled IReHMo - an IoT-based remote health monitoring architecture. This architectureallows users to incorporate several types of IoT devices to extend the sensing capabili-ties of the system. Using IReHMo, several IoT communication protocols such as HTTP,MQTT and CoAP has been evaluated and compared against each other. Results showedthat CoAP is the most efficient protocol to transmit small size healthcare data to the re-mote servers. The combination of IReHMo and CoAP significantly reduced the requiredbandwidth as well as the volume of generated data (up to 56 percent) compared to thecommercial product. Finally, the thesis conducted a scalability analysis, to determinethe feasibility of deploying the combination of IReHMo and CoAP in large numbers inregions in north Sweden.
4

ACKNOWLEDGEMENT
The work of this thesis has been carried out at Pervasive and Mobile Computing ResearchGroup, Department of Computer Science, Electrical and Space Engineering, Lulea Uni-versity of Technology under supervision of Professor Christer Åhlund. This research wasfully financially supported by Erasmus Mundus PERCCOM Master Program and the Eu-ropean Commission.
I wish to thank Professor Christer Åhlund, Dr. Karan Mitra and Dr. Saguna Saguna fortheir guidance and support throughout this work. Their supervision and expertise withinthe field has been an inspiration during this time and has made my work both enjoyableand stimulating. They have given me motivations, helps and suggestions for my thesisthroughout my last semester in Skelleftea. This report is the result of a long process, withmany tiring days, late nights working with sensors and codes, sleepless nights, joyfulmoments of getting good results, sadness when something went wrong suddenly. Thisthesis is dedicated to my dear supervisors.
I would like to thank Professor Eric Rondeau, Professor Jari Porras, Professor Olaf Droege-horn, Professor Karl Andersson and Professor Evgeny Osipov for their academic supportfor my whole PERCCOM program. They have given me solid knowledge, practical ex-perience in different fields of ICT as well as research work. The knowledge I got frommy professors will be an important asset for my future career.
My parents and my fiancee, Bich Diep, are the ones I often talked to when I felt mosttired or frustrated. They always encouraged me to go forward, relieved me of worries andsadness. Without them, it was impossible for me to finish this thesis work.
Skellefteå, May 15, 2015
Ngo Manh Khoi
6
CONTENTS
1 INTRODUCTION 131.1 Introduction . . . . . . . . . . . . . . . . . . . . . . . . . . . . . . . . . 131.2 Research challenge . . . . . . . . . . . . . . . . . . . . . . . . . . . . . 161.3 Thesis objective . . . . . . . . . . . . . . . . . . . . . . . . . . . . . . . 161.4 Research contribution . . . . . . . . . . . . . . . . . . . . . . . . . . . . 171.5 Thesis outline . . . . . . . . . . . . . . . . . . . . . . . . . . . . . . . . 17
2 BACKGROUND AND LITERATURE REVIEW 192.1 Smart cities and Internet of Things . . . . . . . . . . . . . . . . . . . . . 192.2 Network communication in Smart cities . . . . . . . . . . . . . . . . . . 262.3 Networking protocols for Internet of Things in Smart city . . . . . . . . . 29
2.3.1 Hypertext Transfer Protocol . . . . . . . . . . . . . . . . . . . . 292.3.2 Constrained Application Protocol . . . . . . . . . . . . . . . . . 322.3.3 Message Queue Telemetry Transport . . . . . . . . . . . . . . . 362.3.4 Comparison between protocols . . . . . . . . . . . . . . . . . . . 40
2.4 State of the art in home automation . . . . . . . . . . . . . . . . . . . . . 412.5 eHealth systems and architectures . . . . . . . . . . . . . . . . . . . . . 432.6 Chapter conclusion . . . . . . . . . . . . . . . . . . . . . . . . . . . . . 46
3 IoT-BASED SYSTEM FOR HOME AUTOMATION AND HEALTHCARE 473.1 The existing Telia eHealth system . . . . . . . . . . . . . . . . . . . . . 473.2 openHAB default implementation . . . . . . . . . . . . . . . . . . . . . 493.3 The proposed IoT-based remote health monitoring architecture . . . . . . 493.4 Actual implementation . . . . . . . . . . . . . . . . . . . . . . . . . . . 523.5 Chapter Conclusion . . . . . . . . . . . . . . . . . . . . . . . . . . . . . 53
4 RESULTS 554.1 Telia eHealth installation at Luleå University of Technology . . . . . . . 55
4.1.1 Periodic traffic pattern . . . . . . . . . . . . . . . . . . . . . . . 554.1.2 Sensor data . . . . . . . . . . . . . . . . . . . . . . . . . . . . . 59
4.2 openHAB default implementation . . . . . . . . . . . . . . . . . . . . . 644.2.1 Periodic traffic pattern . . . . . . . . . . . . . . . . . . . . . . . 644.2.2 Sensor data . . . . . . . . . . . . . . . . . . . . . . . . . . . . . 65
4.3 CoAP-based IReHMo implementation . . . . . . . . . . . . . . . . . . . 664.3.1 Architecture of the implementation . . . . . . . . . . . . . . . . 664.3.2 The measurement results . . . . . . . . . . . . . . . . . . . . . . 68
4.4 HTTP-based IReHMo implementation . . . . . . . . . . . . . . . . . . . 70

7
4.4.1 Architecture of the implementation . . . . . . . . . . . . . . . . 704.4.2 The measurement results . . . . . . . . . . . . . . . . . . . . . . 71
4.5 Scalability analysis . . . . . . . . . . . . . . . . . . . . . . . . . . . . . 724.5.1 Bitrate of different events . . . . . . . . . . . . . . . . . . . . . 724.5.2 eHealth scenarios . . . . . . . . . . . . . . . . . . . . . . . . . . 774.5.3 Experiments measuring the available upload and download band-
width . . . . . . . . . . . . . . . . . . . . . . . . . . . . . . . . 794.5.4 The scalability of the systems . . . . . . . . . . . . . . . . . . . 81
5 CONCLUSIONS AND FUTURE WORK 845.1 Conclusion . . . . . . . . . . . . . . . . . . . . . . . . . . . . . . . . . 845.2 Future work . . . . . . . . . . . . . . . . . . . . . . . . . . . . . . . . . 85
REFERENCES 87
APPENDICESAppendix 1: openHAB installation in WindowsAppendix 2: openHAB installation in Linux

8
List of Figures
1 The relation among people, technology, economy and healthcare. . . . . 152 General SmartSantander architecture. . . . . . . . . . . . . . . . . . . . 213 The sensor board used in RESCATAME project [20]. . . . . . . . . . . . 214 The solution diagram of RESCATAME [20]. . . . . . . . . . . . . . . . . 225 IoT infrastructure from three different viewpoints [21] . . . . . . . . . . 236 HTTP stack . . . . . . . . . . . . . . . . . . . . . . . . . . . . . . . . . 297 HTTP session . . . . . . . . . . . . . . . . . . . . . . . . . . . . . . . . 308 HTTP status code [40] . . . . . . . . . . . . . . . . . . . . . . . . . . . 319 CoAP stack. . . . . . . . . . . . . . . . . . . . . . . . . . . . . . . . . 3210 CoAP messaging models[41]. . . . . . . . . . . . . . . . . . . . . . . . 3211 Two GET requests with piggybacked responses[41]. . . . . . . . . . . . . 3312 A GET requests with a separate response[41]. . . . . . . . . . . . . . . . 3413 A requests and a response carried in NON messages[41]. . . . . . . . . . 3414 The format of a CoAP message[41]. . . . . . . . . . . . . . . . . . . . . 3515 CoAP observe functionality[41]. . . . . . . . . . . . . . . . . . . . . . . 3516 The general architecture of MQTT[45]. . . . . . . . . . . . . . . . . . . 3617 MQTT QoS 0 - At most once[44]. . . . . . . . . . . . . . . . . . . . . . 3818 MQTT QoS 1 - At least once[44]. . . . . . . . . . . . . . . . . . . . . . 3819 MQTT QoS 2 - Exactly once[44]. . . . . . . . . . . . . . . . . . . . . . 3920 MQTT message format. . . . . . . . . . . . . . . . . . . . . . . . . . . 3921 Components of home automation system. . . . . . . . . . . . . . . . . . 4122 Comparison between Zigbee and Z-wave. . . . . . . . . . . . . . . . . . 4323 eHealth architecture proposed in [49]. . . . . . . . . . . . . . . . . . . . 4424 The structure of the telemonitoring service in [49]. . . . . . . . . . . . . 4625 The architecture of the Telia installation at LTU. . . . . . . . . . . . . . 4726 The architecture of the openHAB implementation. . . . . . . . . . . . . 4927 The proposed architecture. . . . . . . . . . . . . . . . . . . . . . . . . . 5128 The encryption and decryption process. . . . . . . . . . . . . . . . . . . 5329 IReHMo actual implementation. . . . . . . . . . . . . . . . . . . . . . . 5330 Periodic traffic pattern 1. . . . . . . . . . . . . . . . . . . . . . . . . . . 5631 Periodic traffic pattern 2. . . . . . . . . . . . . . . . . . . . . . . . . . . 5632 Screenshot showing pattern 1 and 2 . . . . . . . . . . . . . . . . . . . . 5733 Periodic traffic pattern 3. . . . . . . . . . . . . . . . . . . . . . . . . . . 5734 Periodic traffic pattern 4. . . . . . . . . . . . . . . . . . . . . . . . . . . 5835 Periodic traffic pattern 5. . . . . . . . . . . . . . . . . . . . . . . . . . . 5936 Periodic traffic pattern 6. . . . . . . . . . . . . . . . . . . . . . . . . . . 59

9
37 Packet exchange triggered by door opening event. . . . . . . . . . . . . 6038 Packet exchange for the video stream. . . . . . . . . . . . . . . . . . . . 6339 The periodic message exchange between openHAB and monitoring com-
puter. . . . . . . . . . . . . . . . . . . . . . . . . . . . . . . . . . . . . 6540 The openHAB frame as displayed to the user. . . . . . . . . . . . . . . . 6641 Fragmentation due to big XML file size exceeding MTU. . . . . . . . . . 6742 The architecture of the CoAP-based IReHMo implementation. . . . . . . 6743 Packet exchange for GET request in CON mode. . . . . . . . . . . . . . 6844 Packet exchange for GET request in NON mode. . . . . . . . . . . . . . 6845 Packet exchange for PUT request in CON mode. . . . . . . . . . . . . . 6946 Packet exchange for PUT request in NON mode. . . . . . . . . . . . . . 6947 Observe in CON mode. . . . . . . . . . . . . . . . . . . . . . . . . . . 6948 Observe in NON mode. . . . . . . . . . . . . . . . . . . . . . . . . . . 7049 The architecture of the HTTP-based IReHMo implementation. . . . . . . 7150 The process of exchanging HTTP packets for getting a sensor reading. . 7251 The details of exchanging HTTP packets for getting a sensor reading. . . 7252 Comparison between bitrate of different events in the uplink. . . . . . . . 7653 Comparison between bitrate of different events in the downlink. . . . . . 7654 Comparison between total bitrate of different events. . . . . . . . . . . . 7755 The set up of the experiments. . . . . . . . . . . . . . . . . . . . . . . . 8056 Coverage map from Telia website. . . . . . . . . . . . . . . . . . . . . . 82

10
List of Tables
1 Short explanation of HTTP methods [40]. . . . . . . . . . . . . . . . . . 302 The structure of HTTP messages [40] . . . . . . . . . . . . . . . . . . . 313 Short explanation of CoAP methods [41]. . . . . . . . . . . . . . . . . . 334 CoAP response codes [41]. . . . . . . . . . . . . . . . . . . . . . . . . . 365 MQTT control packets [44]. . . . . . . . . . . . . . . . . . . . . . . . . 376 The set of devices. . . . . . . . . . . . . . . . . . . . . . . . . . . . . . 487 Data generated from pattern 1 and 2. . . . . . . . . . . . . . . . . . . . . 568 Data generated from pattern 3. . . . . . . . . . . . . . . . . . . . . . . . 579 Data generated from pattern 4. . . . . . . . . . . . . . . . . . . . . . . . 5810 Data generated from pattern 5 and 6. . . . . . . . . . . . . . . . . . . . . 6011 Data generated from door opening event. . . . . . . . . . . . . . . . . . . 6112 Data generated by a video frame. . . . . . . . . . . . . . . . . . . . . . . 6413 Summary of data generated by sensor single events. . . . . . . . . . . . . 6414 Data generated by openHAB periodic packet exchange. . . . . . . . . . . 6515 Bitrate of the periodic traffic patterns in Telia installation. . . . . . . . . . 7316 Bitrate of sensor single events in Telia installation. . . . . . . . . . . . . 7317 Bitrate of voice and video communication. . . . . . . . . . . . . . . . . . 7418 Bitrate to transmit a sensor value in CON mode. . . . . . . . . . . . . . . 7419 Bitrate to transmit a sensor value in NON mode. . . . . . . . . . . . . . . 7520 Bandwidth required to transmit a sensor value using HTTP. . . . . . . . . 7521 Instantaneous bandwidth requirement of an openHAB frame. . . . . . . . 7522 The required bandwidth in the worst case of scenario 1,2 and 3 . . . . . . 7823 The required bandwidth in the worst case of scenario 1,2 and 3 when
IReHMo and CoAP are used . . . . . . . . . . . . . . . . . . . . . . . . 7924 The saving of IReHMo and CoAP compared with Telia installation. . . . 7925 The average available bandwidth. . . . . . . . . . . . . . . . . . . . . . . 8026 Scalability analysis of the Telia installation. . . . . . . . . . . . . . . . . 8327 Reduced bandwidth requirement by IReHMo and CoAP. . . . . . . . . . 83

11
ABBREVIATIONS AND SYMBOLS3G Third generation of mobile telecommunication technology4G Fourth generation of mobile telecommunication technologyACK AcknowledgementADSL Asymmetric digital subscriber lineAMQP Advanced Message Queuing ProtocolCoAP Constrained Application ProtocolCON ConfirmableEDGE Enhanced Data rates for GSM EvolutioneNodeB E-UTRAN Node BGPRS General packet radio serviceGSM Global System for Mobile CommunicationsHTML HyperText markup LanguageHTTP Hypertext Transfer ProtocolIaaS Infrastructure as a ServiceICT Information and communications technologyIEEE Institute of Electrical and Electronics EngineersIoT Internet of ThingsIP Internet ProtocolIPv4 Internet Protocol version 4IPv6 Internet Protocol version 6IReHMo IoT-based Remote Health MonitoringJSON JavaScript Object NotationLTE Long-Term EvolutionLTU Luleå University of TechnologyM2M Machine to MachineMAC Media Access ControlMQTT Message Queue Telemetry TransportMTC Machine Type CommunicationNFC Near field communicationNON Non-confirmablePaaS Platform as a ServicePB PetabytePERCCOM Pervasive Computing & Communication for sustainable development

12
PRACH Physical random access channelQoS Quality of ServiceRAN Radio Access NetworkRFID Radio-frequency identificationRST ResetRTT Round-trip delay timeSaaS Software as a ServiceSSL Secure Sockets layerTCP Transmission Control ProtocolUDP User Datagram ProtocolUE User EquipmentUMTS Universal Mobile Telecommunication SystemURI Uniform resource identifierURL Uniform resource locatorUSB Universal Serial BusWiMAX Worldwide Interoperability for Microwave AccessWLAN Wireless local Area NetworkWSN Wireless Sensor NetworkxDSL Digital Subscriber LineXML Extensible Markup Language

13
1 INTRODUCTION
This chapter described the contexts that a remote health monitoring system fits in. Theyinclude the smart city paradigm and its crucial domains as well as the advances of modernICT technologies. The chapter details the research challenge that the author faced, aswell as the thesis objectives and contribution. The chapter concluded by pointing out theoutline of the thesis.
1.1 Introduction
The world population is growing at a very fast pace. According to United States CensusBureau, the world population was at 7.243 billion people (as of 16 May 2015)1. Accordingto an United Nations report, the world population will peak at 9.22 billion in 2075 2.
In contrast, the resource are not unlimited, there are certain shortage of some of the mostimportant natural resources worldwide such as fresh water, fossil fuel, natural gas, pre-cious metal. Furthermore, what makes the situation worse is the uneven distribution ofthe population, in fact more than 50 percent of the world population concentrates in citiesand metropolitan areas. The difference in population density is thousand-fold. As a re-sult, there exist some megacities with population exceeding 10 million like Tokyo, Lagos,Shanghai and New York[1]. Undoubtedly, there are a number of problems associatedwith metropolitan areas like those, such as heavy pollution, congestion, inefficient use ofenergy and resources.
In order to cope with the situation, several initiatives have been made. Noticeably, theUnited Nations defined the term "Sustainable development" to make a reference modeland guidance for all human activities on Earth. According to the United Nations WorldCommission on Environment and Development report in 1987 (Brundtland Report), sus-tainable development is defined as "development that meets the needs of the present with-out compromising the ability of future generations to meet their own needs"[2]. Sincethen, there were a lot of concepts and ideologies trying to materialize the idea of "sustain-able development" or "sustainability".
As a small part of the gigantic sustainable development framework, the Smart city andSmart region framework comes up at a time when scientists, government authorities andthe public joined together to address the aforementioned problems. In many cases, the
1World Population clock - http://www.census.gov/popclock/2The Outlook for Food Security, http://12.000.scripts.mit.edu/mission2014/the-outlook-for-food-
security @MIT

14
term "Smart city" also covers Smart region [3, 4, 5]. Although there isn’t a single defini-tion, Smart city is usually about the use of information and communication technologies(ICT) to enhance performance and wellbeing of the people, to lower resource consump-tion of the whole city or region, and to interact more effectively and actively with thecitizens.
Typically, the Smart city domain can be divided into several subdomains but not limitedto smart economy, smart people, smart governance, smart mobility, smart environmentand smart living [6]. In each domain, there are several properties that describe it in moredetails.
On the other hand, Internet of Things (IoT) is one of the most promising technologies inInformation and Communication Technology (ICT) for the last decades. At the center ofthe IoT paradigm lies the idea of adding more identifying, sensing, computing and com-munication capabilities to physical devices that previously not designed for this purpose.In this way, the enhancement allows devices to communicate with each other, as well asother services and systems, thus gaining new information and obtaining new functional-ities. The main hardware technology enablers of Internet of Things are Radio-frequencyidentification (RFID), Near field communication(NFC) and Sensor Networks; the soft-ware enablers of IoT are middleware and search/browsing [7]. What IoT really does is totransform data into information, knowledge and finally wisdom. As a result, humans canbuild a holistic view of the object of interest and act accordingly. Especially in the fieldof sustainability, IoT helps to collect different environmental parameters effortlessly, andeventually turns them into statistics, knowledge and actions. There is a long list of existingIoT applications, and the list is still going on. IoT is currently present in energy manage-ment, environmental management, healthcare, transport & traffic management, logistics,and inventory management. All applications of Internet of Things can be grouped intofour main application domains: transportation & logistics, healthcare, smart environment(home, office, plant) and personal & social [8].
IoT is an important factor in the Big Data movement. Due to its extensive coverageof sensors and the demand to sense continuously, IoT is expected to generate data thatis huge in terms of volume and velocity. The data velocity challenge poses a big loadon data management technologies, since the data arrival rate can be millions of elementper second. As a result of this, the next challenge coming from IoT is real-time dataprocessing, since much of the value of IoT is the ability to respond to a trigger in real-time. The volume of data from IoT applications can be staggering. An example shows thata simple sensing and monitoring application containing 100 sensors collecting telemetrydata might produce raw data of 4 PB per year 3. Furthermore, the number of IoT devices
3The ’Internet of things’ will mean really, really big data -

15
is increasing rapidly. According to various reports, the estimated number of IoT devicesis likely to increase from 4.9 billion in 2015 to between 25-50 billion by 2020 [9, 10, 11].In another report, it is predicted that by 2019, there will be 780 million wearable devicesand 2.2 billion smartphones [12].
Considering IoT as a technology platform and Smart city as a high-level society devel-opment paradigm, they converge in many areas, for example environmental monitoring,smart transportation, home automation & smart home, resource management, securityand healthcare. Among them, healthcare emerges as the center of People, Technologyand Economy triangle as depicted in figure 1. Furthermore, healthcare is an importantbenchmark in smart living, one of the six pivotal domains of the smart city framework.
Figure 1. The relation among people, technology, economy and healthcare.
Leveraging the latest innovations in science and technology, the healthcare system en-hances the well-being of a particular person as well as the population while at the sametime reduces the burden on the state welfare system. The reason is that preventive health-care usually detects illness and anomalies much sooner than the time the problem actuallyoccurs, and it is able to prevent injuries and sudden accidents. The installation cost of anIoT system is much smaller compared with the later expenses from medicine and hospital-ization. The following motivating scenario described the advantages of a modern remotehealthcare monitoring system.
Helge and Kari Farsund, an elderly couple in Oslo (Norway), is using a remote healthcaremonitoring system to fight against Mrs Farsund’s Alzheimer problem4. The system allowscaregivers to know if a person is in the room or open a door, and sends alarms if the stove ison for too long or a person walks out in the middle of the night. The latter is of significant
http://www.infoworld.com/article/2611319/computer-hardware/the–internet-of-things–will-mean-really–really-big-data.html
4Tomorrow’s cities: Sensor networks for the elderly @BBC - http://www.bbc.com/news/technology-22984876

16
importance, since sub-zero winters in Oslo means some Alzhemer patients can freeze todeath. Caregivers can communicate with Mr. and Mrs. Farsund through Skype on a wall-mounted screen. Moneywise, this IoT system brings a big saving for the government,who previously spent 1,000,000 NOK per year for a caregiver at patient’s house; now thesystem costs 15,000 NOK. Furthermore, in Europe and North America, elderly peopletend to prefer staying in their own house rather than in hospital or elderly house; this factis reflected in the demographic information of Västerbotten, a region in Northern Sweden.With an aging population worldwide and an increasing demand in healthcare and earlyintervention, there is a high demand for such systems.
1.2 Research challenge
The communication network has to constantly cope with the exponential increase of de-vices and user demand. On the other hand, the network capacity is bounded by techno-logical limits and financial expenses. In many cases, the capacity of the communicationnetwork lags behind the demand from people and their devices. In the existing networkinfrastructure, the congestion is high in urban areas while the capacity is limited in ruralareas. This poses big challenges for the wide deployment of eHealth services. In contrast,as more people are aware about preventive healthcare, the number of health monitoringapplications and IoT devices will grow significantly. These devices will produce "Bigdata" that need to be transmitted, processed and analyzed in real time. Transmitting largequantities of healthcare data in real-time will pose new challenges and requirements onthe communication network infrastructure, including bandwidth and delay. Furthermore,healthcare data consists of different types, such as simple data from the body (temper-ature, breath rate, glucose level) to complex data (Electrocardiography - ECG or EKGsignal, Electroencephalography - EEG signal). Another classification of healthcare datais based on its timeliness, whether the data needs to be received instantly for diagnosispurposes or small delays are acceptable. The key research challenge addressed in thisthesis is to efficiently transmit healthcare data within the limit of the existing networkinfrastructure, both in urban and rural areas.
1.3 Thesis objective
The thesis aims to understand the communication requirements of a remote health moni-toring system, specifically the bandwidth and the volume of generated data. Based on this

17
understanding, the thesis aims to propose an architecture that efficiently collect healthcaredata, pre-process the data and transmit it to the servers for further processing. Moreover,IoT communication protocols should be evaluated and compared. Finally the most suit-able network communication protocol should be incorporated in the architecture.
1.4 Research contribution
This thesis studied the communication-related aspects of Internet of Things devices andsystems in the context of eHealth for Smart regions, specifically to understand the band-width requirement and volume of data generated. Based on the performance of an existingcommercial trial5, the thesis studied and identified its strengths and weaknesses in termsof networking aspects. As a next step, the thesis proposed an architecture that addressedthe drawback of existing systems while maintaining their strengths. This proposed ar-chitecture allows users to bind together various types of home automation sensors andhealthcare sensors for getting a comprehensive awareness of a person’s health. On top ofthe architecture, several communication protocols was deployed and compared, resultingin the suggestion of CoAP as a more efficient application protocol in the field of eHealthapplications. The architecture suggested the usage of Raspberry Pi as an affordable homegateway for eHealth applications. Finally, the thesis studied the scalability of such archi-tecture in remote communities in Northern Sweden.
1.5 Thesis outline
This section gives an overview of the thesis structure and a brief introduction to eachchapter.
• Chapter 2 - Background and literature reviewChapter two starts with presenting a literature study of Smart city paradigm, IoTinfrastructure and network communications in Smart city. A reference IoT archi-tecture for Smart city is described in details. Various IoT application layer protocolsare described and compared in the second part of chapter two. The last part of chap-ter two is about the state of the art in home automation.
5TeliaSonera ventures into eHealth - http://www.teliasonera.com/en/newsroom/news/2014/teliasonera-ventures-into-ehealth-/

18
• Chapter 3 - IoT-based system for home automation and health careChapter three describes the existing Telia eHealth system, the openHAB default im-plementation and the proposed architecture for remote health monitoring (IReHMo),as well as the actual implementation done at Luleå University of Technology.
• Chapter 4 - ResultsChapter four presents the results collected from studying the Telia eHealth sys-tem, the openHAB default configuration and the implementation of IReHMo usingCoAP and HTTP. It highlights the better efficiency that the CoAP-based IReHMoimplementation has achieved. The scalability analysis is included in the last part ofthe chapter, with results from experiments measuring the available bandwidth andthe required bandwidth of different healthcare scenarios .
• Chapter 5 - Conclusion and future workChapter five concludes and discusses the results obtained during this Master thesis,and presents future work to further extend the proposed architecture.

19
2 BACKGROUND AND LITERATURE REVIEW
This chapter summarizes the literature work on Smart city and Internet of Things, includ-ing examples of Smart city implementations. In Section 2.1, the introduction of Smartcity definitions is followed by the focus on the reference model of an IoT infrastructurein Smart city. Section 2.2 discusses different aspects of network communication. Section2.3 describes the widely used protocols in the field of IoT communication, namely HTTP,CoAP and MQTT. Section 2.4 summarizes the state of the art in home automation. Sec-tion 2.5 provides the background of eHealth systems and architecture. Finally, section 2.6concludes the chapter.
2.1 Smart cities and Internet of Things
Today, 50 percent of the world population live in cities and urban areas. It is predicted thatthe trend is continuing, resulting in 75 percent of the world population are urban citizensby 2050 [13]. There are several reasons for this, including better access to healthcare,entertainment, telecommunication and transportation. However, from the city authorities’point of view, urbanization brings about new challenges and demands. City authorities areexpected to manage a growing number of issues ranging from technical, social, physicalto organizational issues caused by overcrowded population in a geographically limitedarea. Typical issues in a big urban area are traffic jam, environmental pollution (air,water, noise, light, radiation), high crime rate, inefficient use of energy and resources,waste disposal.
The "Smart city" term represents a set of initiatives, ideas and solutions that try to addressthe aforementioned issues and thus make urban areas more livable. A Smart city can be[14]:
• A city connecting the physical infrastructure, the ICT infrastructure, the social in-frastructure, and the business infrastructure to leverage the collective intelligenceof the city [15].
• A city that invests in human and social capital and traditional and modern (ICT)communication infrastructure in order to sustain the economic growth and a highquality of life, with a wise management of natural resources, through participatorygovernance [16].

20
• A city whose community has learned to learn, adapt and innovate. People need tobe able to use the technology in order to benefit from it [17].
• A city that reflects a particular idea of local community, one where city govern-ments, enterprises and residents use ICTs to reinvent and reinforce the commu-nity’s role in the new service economy, create jobs locally and improve the qualityof community life [18].
More definitions can be found at [19]. Although scholars do not agree on a single def-inition of "Smart city", all the definitions center around the usage of ICT to evaluate,manage and make a better, more efficient use of resource. A typical Smart city deploy-ment usually includes sensors, actuators, communication platforms, data storage facilitiesand computing devices. For each components in that deployment, there are many solu-tions and alternatives. Sensors can be embedded sensors, dedicated sensors or citizens’smartphones. Data storage can be cloud storage solutions or simple logfile in a server.There is an endless list of Smart city deployments and prototypes; this chapter detailssome of the most prominent examples to show an overview of the actual implementation.
SmartSantander is a large-scale Smart city project involving various applications and ex-periments in four different locations (Guildford, Belgrade, Santander and Lubeck). InGuildford, the testbed contains 250 IoT experimentation nodes and 100 embedded gate-way nodes in a building belonging to University of Surrey in order to precisely monitor theenergy consumption at each work desk and correlate the obtained information with othercontext information (ambient temperature, light intensity, user presence). In Lubeck, thetestbed contains 162 sensor nodes of different types in order to gain knowledge on en-vironmental parameters and user activity6. In Santander, the testbed contains a greatnumber of IoT devices collecting information on environment, parking availability, traf-fic intensity and managing parks and garden irrigation 7. Figure 2 describes the generalarchitecture of the SmartSantander project.
6Testbeds - http://www.smartsantander.eu/wiki/index.php/Testbeds/7Santander summary - http://www.smartsantander.eu/index.php/testbeds/item/132-santander-summary

21
Figure 2. General SmartSantander architecture.
RESCATAME stands for Pervasive Air-quality Sensors Network for an EnvironmentalFriendly Urban Traffic Management, a project funded by European Union. The deploy-ment in Salamanca (Spain) aims to monitor the atmosphere quality through a pervasiveair-quality sensors network and feed the gathered information to predicting models. 35IoT devices (of type Waspmote) were spread in two locations inside Salamanca, each ofthem measures temperature, relative humidity, CO, NO2, O3, noise and particle level inthe air [20]. Figure 3 depicts an IoT-based sensor board used in the RESCATAME projectwhile figure 4 describes the solution diagram of the RESCATAME project.
Figure 3. The sensor board used in RESCATAME project [20].

22
Figure 4. The solution diagram of RESCATAME [20].
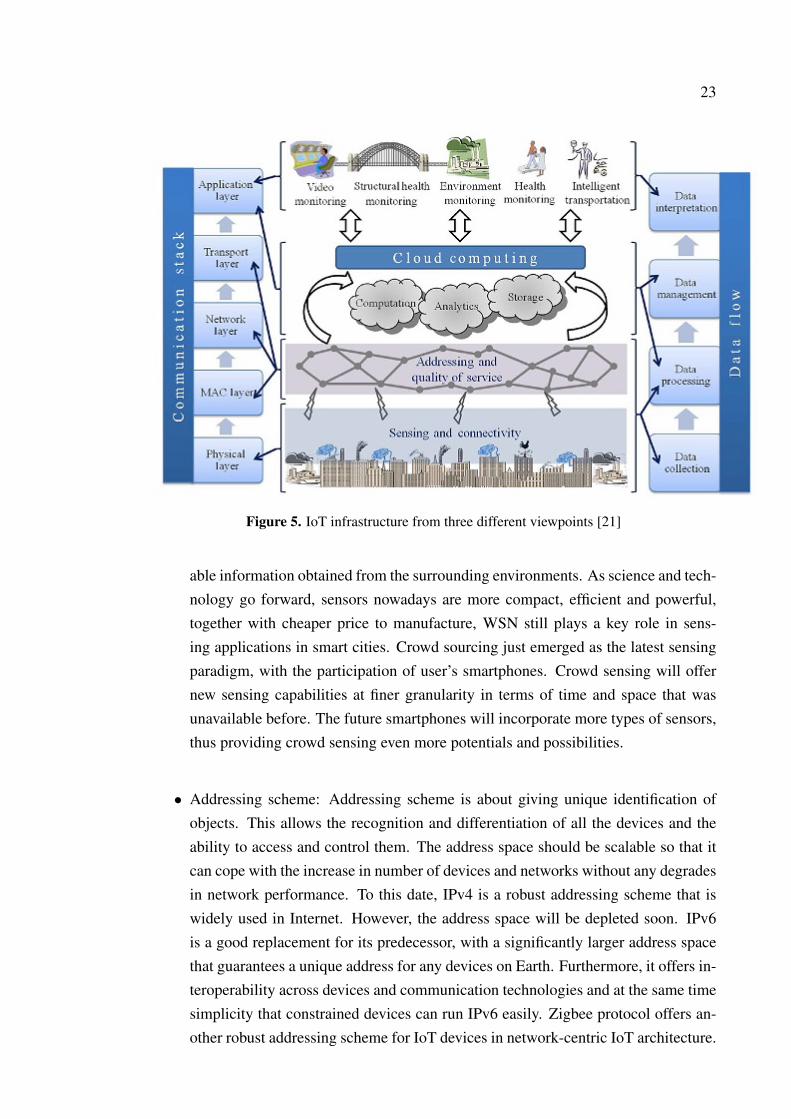
Scholars have been working on a reference model for Internet of Things implementations.Jin et al.[21] proposed a framework for creating an Internet of Things implementation forSmart cities. According to that article, there are three main viewpoints that Internet ofThings can help building a Smart city: network-centric IoT, Cloud-centric IoT and data-centric IoT. These viewpoints cover all different implementation of Smart city projectsand act as a reference model for implementing Smart cities.
A) Network-centric IoT In a network-centric IoT, the implementation can be eitherInternet-based or Object-based. The Internet-based architecture will center around theInternet and uses Internet services as the main focus to transmit data. The object-basedarchitecture will center on smart objects. Networking is the backbone of this network-centric IoT architecture.
Network-centric IoT architecture emphasizes on sensing paradigm, addressing scheme,connectivity model and quality of service (QoS) mechanism.
• Sensing paradigm: Nowadays, the most common sensing paradigms are RFID,wireless sensor network (WSN) and crowd sourcing. RFID uses tags to identify ob-jects and behaviors. The tags, upon receiving interrogation signal from the reader,send their ID back to the reader. RFID is suitable for transportation and accesscontrol applications in a smart city. WSN is the main representative of sensingparadigm, which includes collecting, processing, analyzing and transferring valu-
23
Figure 5. IoT infrastructure from three different viewpoints [21]
able information obtained from the surrounding environments. As science and tech-nology go forward, sensors nowadays are more compact, efficient and powerful,together with cheaper price to manufacture, WSN still plays a key role in sens-ing applications in smart cities. Crowd sourcing just emerged as the latest sensingparadigm, with the participation of user’s smartphones. Crowd sensing will offernew sensing capabilities at finer granularity in terms of time and space that wasunavailable before. The future smartphones will incorporate more types of sensors,thus providing crowd sensing even more potentials and possibilities.
• Addressing scheme: Addressing scheme is about giving unique identification ofobjects. This allows the recognition and differentiation of all the devices and theability to access and control them. The address space should be scalable so that itcan cope with the increase in number of devices and networks without any degradesin network performance. To this date, IPv4 is a robust addressing scheme that iswidely used in Internet. However, the address space will be depleted soon. IPv6is a good replacement for its predecessor, with a significantly larger address spacethat guarantees a unique address for any devices on Earth. Furthermore, it offers in-teroperability across devices and communication technologies and at the same timesimplicity that constrained devices can run IPv6 easily. Zigbee protocol offers an-other robust addressing scheme for IoT devices in network-centric IoT architecture.

24
Each Zigbee device has three different addresses: a permanent 64-bit MAC address,a 16-bit network address and a name for different purposes [22]. The 64-bit MACaddress is unique for each Zigbee device, whereas the 16-bit network address isgiven by the Zigbee network coordinator or router. This addressing scheme wellsupports the complexity and routing requirement of Zigbee devices
• Connectivity model: The TCP/IP architecture formed the backbone of the Inter-net. Nowadays, WSN architecture takes advantages of the layered-architecture ofTCP/IP to meet its own requirements, such as low-power operation, network scal-ability and constrained resources. In the original TCP/IP architecture, there weredifferent networking layers, each layer uses the services provided by the lower layerand offer services to the upper layer. The layers were physical layer, MAC layer,network layer, transport layer and application layer. In WSN implementations, asimilar architecture exists.
• Quality of Service (QoS) Mechanism: An IoT architecture is heterogeneous interms of services, traffic and QoS requirement due to a variety of networking pro-tocol (wired and wireless) and sensor types. For example, in [23] the authors listedseveral IoT applications in the Padova Smart city Project together with their trafficand delay requirements, different network types and energy source. This exam-ple clearly shows the heterogeneity of an IoT architecture. In general, there aretwo categories of network traffic: throughput and delay tolerant elastic traffic andbandwidth and delay-sensitive inelastic traffic [21].
B) Cloud-centric IoT In order to combine IoT characteristics and Smart city applica-tions, as well as to exploit all the potentials of Cloud computing, the Cloud-centric IoTframework is proposed. In this framework, sensors attached to the network producedata which is stored in Cloud storage; software developers build software facilitatingthe framework, experts perform data mining and machine learning activities to transformraw data into knowledge and understanding. Cloud computing offers several servicessuch as Infrastructure-as-a-Service (IaaS), Platform-as-a-Service (PaaS) and Software-as-a-Service (Saas). Therefore, the data generated from sensors, software supporting theframework and algorithms used to process data will be hidden from the applications,which is visible to the public. A Cloud-centric IoT architecture will integrate all aspectsof ubiquitous computing by offering scalable storage and computing resources.
C) Data-centric IoT In this viewpoint, the focus is on data as there will be a vast amount
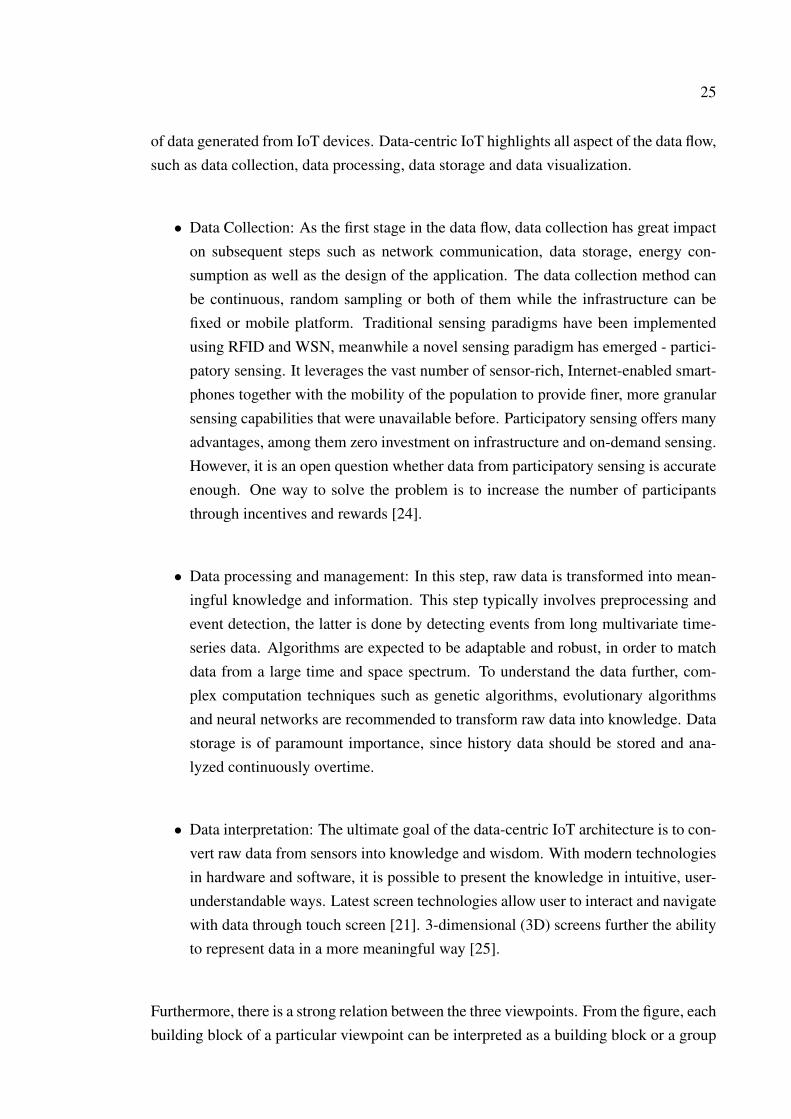
25
of data generated from IoT devices. Data-centric IoT highlights all aspect of the data flow,such as data collection, data processing, data storage and data visualization.
• Data Collection: As the first stage in the data flow, data collection has great impacton subsequent steps such as network communication, data storage, energy con-sumption as well as the design of the application. The data collection method canbe continuous, random sampling or both of them while the infrastructure can befixed or mobile platform. Traditional sensing paradigms have been implementedusing RFID and WSN, meanwhile a novel sensing paradigm has emerged - partici-patory sensing. It leverages the vast number of sensor-rich, Internet-enabled smart-phones together with the mobility of the population to provide finer, more granularsensing capabilities that were unavailable before. Participatory sensing offers manyadvantages, among them zero investment on infrastructure and on-demand sensing.However, it is an open question whether data from participatory sensing is accurateenough. One way to solve the problem is to increase the number of participantsthrough incentives and rewards [24].
• Data processing and management: In this step, raw data is transformed into mean-ingful knowledge and information. This step typically involves preprocessing andevent detection, the latter is done by detecting events from long multivariate time-series data. Algorithms are expected to be adaptable and robust, in order to matchdata from a large time and space spectrum. To understand the data further, com-plex computation techniques such as genetic algorithms, evolutionary algorithmsand neural networks are recommended to transform raw data into knowledge. Datastorage is of paramount importance, since history data should be stored and ana-lyzed continuously overtime.
• Data interpretation: The ultimate goal of the data-centric IoT architecture is to con-vert raw data from sensors into knowledge and wisdom. With modern technologiesin hardware and software, it is possible to present the knowledge in intuitive, user-understandable ways. Latest screen technologies allow user to interact and navigatewith data through touch screen [21]. 3-dimensional (3D) screens further the abilityto represent data in a more meaningful way [25].
Furthermore, there is a strong relation between the three viewpoints. From the figure, eachbuilding block of a particular viewpoint can be interpreted as a building block or a group

26
of building blocks from another viewpoint. For example, addressing and QoS in Cloud-centric architecture belongs to both data collection and data processing in data-centricarchitecture, at the same time it is part of the MAC layer, network layer and transportlayer in the communication stack of the network-centric architecture.
This reference model is reflected in other literature works. Zanella et al. [23] suggested aconceptual representation of an urban IoT architecture, with details of the protocol stackused at different components of the architecture. The architecture represents well thenetwork-centric IoT viewpoint. Elmangoush et al. [26] presented a four-layer archi-tecture that includes Instrumented, Interconnected, Interoperated and Intelligent Smartcity. This architecture reflects well the concept of Cloud-centric IoT viewpoint, where"Instrumented" corresponds to "Sensing and connectivity", "Interconnected" correspondsto "Addressing and quality of service", "Interoperated" means Cloud computing (com-putation, analytics and storage), and finally "Intelligent" means different applications inSmart cities. In [27] the authors proposed a reference framework for mobile crowd sens-ing which clearly represented the data-centric IoT viewpoint. In that proposed framework,there are five distinct layers: crowd sensing, data transmission, data collection infrastruc-ture, crowd data processing and applications. The first three layers described how datacollection is done. Crowd data processing is represented by the use of machine learningand logic-based inference techniques to convert raw data into knowledge and intelligence.Finally, data visualization and user interface were mentioned as the main part of the ap-plications layer.
2.2 Network communication in Smart cities
In a typical smart city, it is a necessary condition to have an infrastructure of communica-tion networks. Nowadays, cities worldwide have various communication systems, rang-ing from legacy system such as GSM, GPRS, EDGE to modern, high capacity networksuch as UMTS, LTE and LTE-Advanced. Almost every household and public buildinghave WiFi coverage. Many cities own a large-scale, city-wide WiFi coverage. For wiredconnections, there are solutions such as ADSL and fiber optics. All these aforementionedtechnologies form the heterogeneous access network. Initially, these technologies weredesigned to support human traffic, for instance voice traffic or web surfing. The char-acteristics and pattern of human data traffic is well studied and networks are optimizedaccordingly [28] [29].
With the emergence of IoT paradigm, the existing heterogeneous access networks have

27
to cope with Machine-to-machine (M2M) communication. M2M is about the data con-nection between a huge number of tiny, communication-enabled devices through wired orwireless network without any human monitoring or intervention. The utilization of M2Mcommunication perfectly matches various scenarios in which sensors, IoT nodes, gate-ways, smartphones connect with each other. However, M2M communication has manyunique characteristics that are different from those of human-to-human (H2H) traffic.While M2M communication has requirements of low mobility, time controlled, time tol-erant, small data transmissions, infrequent transmission [30], human traffic has a completeset of requirements, typically smaller number of connections, high bandwidth, higher mo-bility. The task of combining both M2M communication and H2H traffic poses manychallenges [31]. Usually the M2M communication affects the usual operation of a cellwith human traffic negatively [32].
Sensors play a key role in the operation of a smart, modern city. It produces the inputfor the data flow in any smart city architecture, which includes data collection, data pro-cessing, data management and data interpretation [21]. To make sensors more suitableto various applications, their size have been reduced significantly. With a pool of tinysensing devices, they will be spread into a vast geographical area, thus collecting moredata and generating a better picture of the physical world. However, there are severaldrawbacks associated with the compactness of sensors. First of all, they are very limitedin terms of battery. In some cases, the sensors are located at remote places, inaccessibleto humans. Therefore, battery-limited devices have to be in sleep mode most of the times,and only transmit data when necessary. To send data to the sink, sensors need an accessnetwork. The access network stands between the sensors (or in general Machine TypeCommunication devices - MTC devices) and establish a link between these parties. Thisaccess network can be wired (cable, xDSL and optical) or wireless connection. The wire-less connection can be either capillary (for example WLAN, ZigBee and IEEE 802.15.4)or cellular (GPRS, UMTS, LTE, LTE-Advanced and WiMAX). Wireless connection ispreferred over wired connection due to its ability to scale up, cheaper price and mobility.The capillary wireless connection offers low power connection at a cheaper price com-pared to wired connection and the ability to scale up. However, its main disadvantagesare low data rate, less security, interference and lack of universal infrastructure. On thecontrary, the wireless cellular network technologies offer ubiquitous coverage, mobility,roaming as well as security/encryption, thus making them more suitable platforms forsmart city applications.
As of today, LTE-Advanced is the latest cellular solution that is being deployed world-wide. It is a natural step to include M2M communication into LTE-Advanced, since this

28
technology offers ultra-high bandwidth and ultra-low latency (up to 4.9 ms), among othertechnological advantages[33]. In LTE-Advanced, there are 2 parts, the core network andthe radio access network(RAN). The RAN is in charge of maintaining wireless communi-cation to user equipment (UEs) located in different geographical cells. These UEs includeMTC devices, which have their unique M2M communication patterns. An UE initiatesthe random access (RA) process either when it is turned on or it is handed over fromanother eNodeB [34]. In case of MTC devices, most random access is caused when thedevice switches from sleeping state to active state, since the sensor’s locations are fixed- no need for handover. When a large number of MTC devices initiate the RA process,the physical random access channel (PRACH) is severely loaded[35]. The overloadedPRACH may cause unexpected delay, higher packet loss ratio, waste of radio resource,extra energy consumption and even service interruption [34]. Therefore, a major researchchallenge is to find an novel mechanism for overload control in M2M communication,both from the network point of view as well as the MTC device’s point of view. Hasanet al. [34] identified other key research challenges in M2M communication such as modeselection and quality of service (QoS), efficient group management and opportunistic RA(cognitive M2M).
With the abundance of smartphones, a new computing paradigm emerged in the recentyears - participatory sensing applications. It has proved to be highly effective in variousapplication domains such as urban planning, environment monitoring, public safety, in-frastructure management, and the list is still growing. The use of participatory sensingapplication is fueled by the new achievements in technology, namely the big variety ofsensors embedded in current and future smartphones as well as the sky-rocketing com-puting power of these host devices, the possibilities of extending the functionalities ofsmartphones with other plug-in sensors. Another crucial factor that contributes greatly tothe success of participatory sensing paradigm is the vast number of smartphone users, aswell as their environmental awareness and the desire to move toward a smart, green andsustainable living environment. To date, there are many participatory sensing applicationin operation. eCAALYX helps improving the healthcare system in which the number ofelderly people with chronic diseases is increasing[36]. Hasenfratz et al. [37] developed aportable app that uses smartphone in conjunction with external ozone sensor to measurepollution and monitor air quality in urban environment. D’Hondt et al. [38] mentionedfour existing participatory noise mapping applications in their article. Undoubtedly, oneof the main challenges is to efficiently transmit the data from sensors to the consumervia the existing infrastructure (WiFi, 3G, 4G). In the near future, a typical user will havea smartphone that host several participatory sensing applications, each and every sensorwill constantly stream data to the remote server. Taking into account the population of a

29
city, the flow of collected data from participatory sensing application will be extremelylarge [39].
2.3 Networking protocols for Internet of Things in Smart city
This section briefly describes the most popular application protocols used in IoT com-munication, namely Hypertext Transfer Protocol, Constrained Application Protocol andMessage Queue Telemetry Transport.
2.3.1 Hypertext Transfer Protocol
Hypertext Transfer Protocol (HTTP) [40] is a request-response protocol used in client-server computing model. HTTP establishes the connection between 2 entities, namelyclient (for example a web browser) and server (for example an application hosting a web-site).
HTTP is an application layer protocol within the framework of Internet Protocol Suite.Its definition assumes an underlying and reliable transport layer protocol; as a result,Transmission Control Protocol (TCP) is often used with HTTP. In some rare cases, HTTPcan use User Datagram Protocol (UDP) as transport layer protocol.
Figure 6. HTTP stack
HTTP resources are identified and located on the network by Uniform Resource Identifier(URI) or Uniform Resource Locator (URL). An example of URI can be the following:http://en.wikipedia.org/wiki/Uniform_resource_identifier. HTTP uses HTTP session, asequence of network request-response transactions.

30
Figure 7. HTTP session
The HTTP client initiates a request by establishing a TCP connection to a particular porton the server. An HTTP server listening on that port waits for the client’s request message.Once receiving the request, the server responds by sending back a status line such as"HTTP/1.1 200 OK" and a message body. In the current version, HTTP/1.1 reuses theTCP connection several times to send and receive multiple HTTP request/response insteadof creating a new TCP connection for every single request/response pair
HTTP defines the following idempotent methods to specify the desired actions to be ex-ecuted on the resources: GET, HEAD, POST, PUT, DELETE, TRACE, OPTIONS andCONNECT, as described in details in table 1 .
Table 1. Short explanation of HTTP methods [40].
OPTIONSThe OPTIONS method represents a request for information about the communica-tion options available on the request/response chain identified by the Request-URI.
GETThe GET method means retrieve whatever information (in the form of an entity) isidentified by the Request-URI.
HEADThe HEAD method is identical to GET except that the server MUST NOT returna message-body in the response.
POSTThe POST method is used to request that the origin server accept the entity en-closed in the request as a new subordinate of the resource identified by the Request-URI in the Request-Line.
PUTThe PUT method requests that the enclosed entity be stored under the suppliedRequest-URI.
DELETEThe DELETE method requests that the origin server delete the resource identifiedby the Request-URI.
TRACEThe TRACE method is used to invoke a remote, application-layer loop- back ofthe request message.
CONNECTThis specification reserves the method name CONNECT for use with a proxy thatcan dynamically switch to being a tunnel (e.g. SSL tunneling).

31
The structure of the HTTP request message is detailed in the following table 2:
Table 2. The structure of HTTP messages [40]
HTTP request message HTTP response message<request-line><general-headers><request-headers><entity-headers><empty-line>/[<message-body>]/[<message-trailers>]
<status-line><general-headers><response-headers><entity-headers><empty-line>/[<message-body>]/[<message-trailers>]
HTTP uses the following status code:
Figure 8. HTTP status code [40]

32
2.3.2 Constrained Application Protocol
Constrained Application Protocol (CoAP) [41] is a dedicated web transfer protocol for usewith constrained nodes and constrained networks. CoAP is a request/response protocolused in client-server computing model, however the roles of client and server are usuallyinterchangeable in M2M interactions.
CoAP is an application layer protocol built on top of a datagram-oriented transport proto-col such as UDP.
Figure 9. CoAP stack.
A client sends a CoAP request (similar to an HTTP request) to request an action (using aCoAP method code) on a resource (identified by a CoAP URI) on a CoAP server. Uponreceiving a request, the server sends back a response with a response code; this responsemay include a resource representation. There are four types of CoAP messages: Con-firmable (CON), Non-confirmable (NON), Acknowledgement (ACK) and Reset (RST).CoAP supports multicast IP destination addresses.
CoAP offers two messaging models for different QoS requirements: Reliable messagetransmission and unreliable message transmission, as described in the following figure10.
Figure 10. CoAP messaging models[41].
33
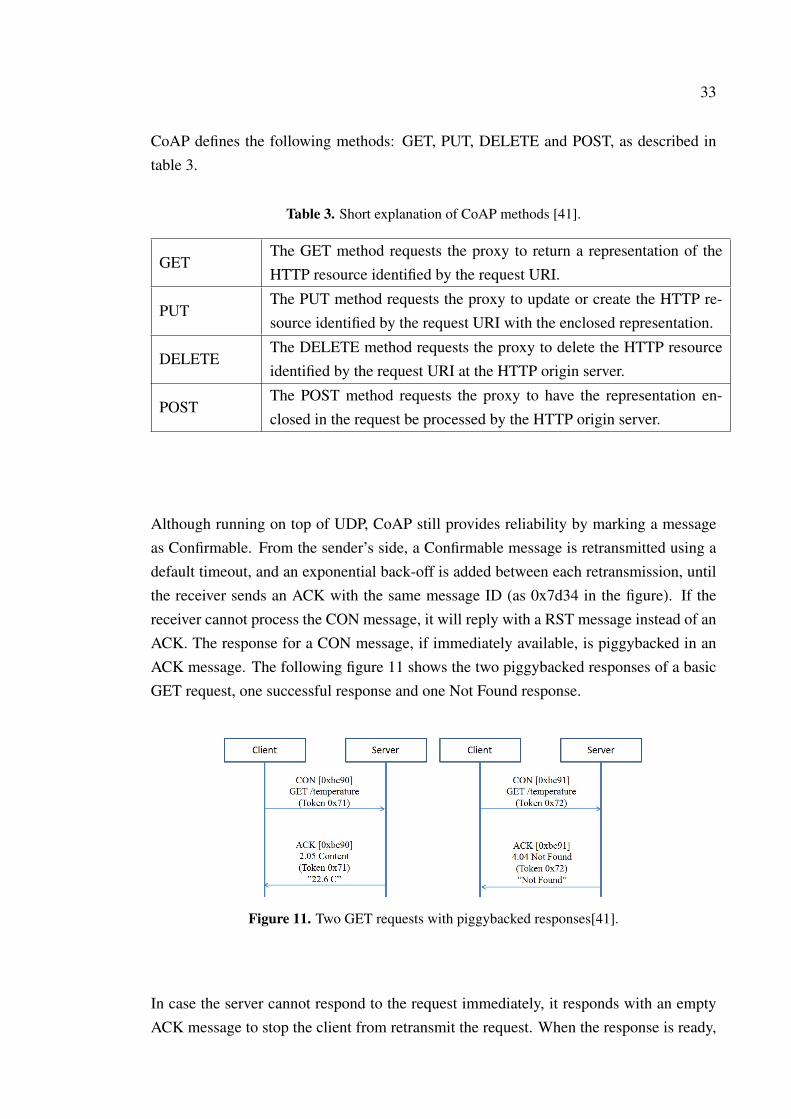
CoAP defines the following methods: GET, PUT, DELETE and POST, as described intable 3.
Table 3. Short explanation of CoAP methods [41].
GETThe GET method requests the proxy to return a representation of theHTTP resource identified by the request URI.
PUTThe PUT method requests the proxy to update or create the HTTP re-source identified by the request URI with the enclosed representation.
DELETEThe DELETE method requests the proxy to delete the HTTP resourceidentified by the request URI at the HTTP origin server.
POSTThe POST method requests the proxy to have the representation en-closed in the request be processed by the HTTP origin server.
Although running on top of UDP, CoAP still provides reliability by marking a messageas Confirmable. From the sender’s side, a Confirmable message is retransmitted using adefault timeout, and an exponential back-off is added between each retransmission, untilthe receiver sends an ACK with the same message ID (as 0x7d34 in the figure). If thereceiver cannot process the CON message, it will reply with a RST message instead of anACK. The response for a CON message, if immediately available, is piggybacked in anACK message. The following figure 11 shows the two piggybacked responses of a basicGET request, one successful response and one Not Found response.
Figure 11. Two GET requests with piggybacked responses[41].
In case the server cannot respond to the request immediately, it responds with an emptyACK message to stop the client from retransmit the request. When the response is ready,

34
the server sends it in a new CON message (which requires the client to send an ACKin return). This is called "separate response". The following figure 12 shows a separateresponse for a GET request.
Figure 12. A GET requests with a separate response[41].
A message can be sent in unreliable mode; the message will be marked as NON (Non-confirmable). The receiver will not acknowledge the message transmission, but the NONmessage still contains a message ID for duplication detection (as 0x01a0 in the figure).If the receiver cannot process the NON message, it may reply with a RST message. Theresponse for a NON request is sent using a NON message, although the server can use aCON message. The following figure 13 shows a request and a reply in NON mode.
Figure 13. A requests and a response carried in NON messages[41].
CoAP messages are encoded in a simple binary format. As a result, the headed of themessage is relatively small (4 bytes) compared to other protocols. CoAP imposes un upper

35
bound to the message size. The default upper bounds are 1152 bytes for the message sizeand 1024 bytes for the payload size. CoAP can carry various types of payload, such asExtensible Markup Language (XML) data, JavaScript Object Notation (JSON) or simpletext. The message format is described in the following figure:
Figure 14. The format of a CoAP message[41].
CoAP identifies resources using URI, similar to those of HTTP. An example for CoAPURI can be: coap://vs0.inf.ethz.ch:5683/. One important feature of CoAP is its Observefunctionality. CoAP pushes information from the server to the client in an asynchronousmode. Instead of a GET request which informs the client about the information of aparticular resource at a time instance, the Observe mode allows the client to be an observerof this resource and to receive an asynchronous message every time the resource changesits state [42, 43]. The following figure 15 describes the CoAP observe process.
Figure 15. CoAP observe functionality[41].
CoAP uses the following response codes, as listed in table 4:

36
Table 4. CoAP response codes [41].
Success 2.xx Client Error 4.xx Server Error 5.xx2.01 Created 4.00 Bad Request 5.00 Internal Server Error2.02 Deleted 4.01 Unauthorized 5.01 Not Implemented2.03 Valid 4.02 Bad Option 5.02 Bad Gateway2.04 Changed 4.03 Forbidden 5.03 Service Unavailable2.05 Content 4.04 Not Found 5.04 Gateway Timeout
4.05 Method Not Allowed 5.05 Proxying Not Supported4.06 Not Acceptable4.12 Precondition Failed4.13 Request Entity Too large4.15 Unsupported Content-Format
2.3.3 Message Queue Telemetry Transport
Message Queue Telemetry Transport (MQTT) [44] is a lightweight message protocol ontop of the TCP/IP protocol; it is widely used in M2M communication for IoT devices. Itfeatures a lightweight header size of 2 bytes and reduced clients footprint. MQTT adoptsthe publish/subscribe model; the MQTT architecture includes the publishers, the brokersand the subscribers. The broker receives the subscription from the clients on the topicsthey are interested in, at the same time it receives message from publishers and forwardthem, clients (publishers and subscribers) subscribe/publish on topics.
Figure 16. The general architecture of MQTT[45].
MQTT uses the following control packets for its data transmission, as listed in table 5:

37
Table 5. MQTT control packets [44].
Control packet Short description
CONNECT - Client requestsa connection to a Server
After a Network Connection is established by a Client to a Server,the first Packet sent from the Client to the Server MUST be aCONNECT Packet.
CONNACK - Acknowledgeconnection request
The CONNACK Packet is the packet sent by the Server in re-sponse to a CONNECT Packet received from a Client. The firstpacket sent from the Server to the Client MUST be a CONNACKPacket.
PUBLISH - Publish messageA PUBLISH Control Packet is sent from a Client to a Server orfrom Server to a Client to transport an Application Message.
PUBACK - Publish acknowl-edgement
A PUBACK Packet is the response to a PUBLISH Packet withQoS level 1.
PUBREC - Publish receivedA PUBREC Packet is the response to a PUBLISH Packet withQoS 2. It is the second packet of the QoS 2 protocol exchange.
PUBREL - Publish releaseA PUBREL Packet is the response to a PUBREC Packet. It is thethird packet of the QoS 2 protocol exchange.
PUBCOMP - Publish com-plete
The PUBCOMP Packet is the response to a PUBREL Packet. Itis the fourth and final packet of the QoS 2 protocol exchange.
SUBSCRIBE - Subscribe totopics
The SUBSCRIBE Packet is sent from the Client to the Server tocreate one or more Subscriptions. Each Subscription registers aClient´s interest in one or more Topics.
SUBACK - Subscribe ac-knowledgement
A SUBACK Packet is sent by the Server to the Client to confirmreceipt and processing of a SUBSCRIBE Packet.
UNSUBSCRIBE - Unsub-scribe from topics
An UNSUBSCRIBE Packet is sent by the Client to the Server, tounsubscribe from topics.
UNSUBACK - Unsubscribeacknowledgement
The UNSUBACK Packet is sent by the Server to the Client toconfirm receipt of an UNSUBSCRIBE Packet.
PINGREQ - PING request
The PINGREQ Packet is sent from a Client to the Server. It can beused to indicate to the Server that the Client is alive in the absenceof any other Control Packets being sent from the Client to theServer, request that the Server responds to confirm that it is alive,or exercise the network to indicate that the Network Connectionis active.
PINGRESP - PING responseA PINGRESP Packet is sent by the Server to the Client in re-sponse to a PINGREQ Packet. It indicates that the Server is alive.
DISCONNECT - Disconnectnotification
The DISCONNECT Packet is the final Control Packet sent fromthe Client to the Server. It indicates that the Client is disconnect-ing cleanly.

38
MQTT employs three QoS schemes, namely QoS 0 - At most once (fire and forget), QoS1 - At least once and QoS 2 - Exactly once.
Figure 17. MQTT QoS 0 - At most once[44].
In QoS 0 scheme (figure 17), the message is delivered according to the best efforts of theunderlying network. No response is sent back by the receiver/subscriber and no retry isperformed by the sender/publisher. The message arrives at the receiver/subscriber eitheronce or not at all.
Figure 18. MQTT QoS 1 - At least once[44].
In QoS 1 scheme (figure 18), it ensures that the message will arrive at the receiver/subscriberat least once. A QoS 1 PUBLISH Packet has a Packet Identifier in its variable header andis acknowledged by a PUBACK Packet.

39
Figure 19. MQTT QoS 2 - Exactly once[44].
Figure 19 describes the highest QoS offered by MQTT, to be used when neither loss norduplication of messages are acceptable. It comes at a price of higher overhead and trafficin the network.
MQTT is payload-agnostic; it supports any type of data (text, binary, JSON, XML,BSON). The format of a MQTT message is detailed in the following figure 20:
Figure 20. MQTT message format.
MQTT features Keep-Alive message, represented by PINGREQ and PINGRESP. TheKeep-Alive timer specifies the maximum allowable time interval between client mes-sages. This timer is used by the broker to check the client’s connection status. After [1.5* Keep-Alive time], the broker disconnects the client in question. A typical value forkeepalive time interval is a couple of minutes.

40
2.3.4 Comparison between protocols
The comparison between these protocols has received attention in recent literature work.Some of the above mentioned protocols share some similarities, such as the purposeof transmitting data, the adaptation for highly constrained network, compatibility withsmartphones[46]. The behaviour of protocols on different platforms has been studiedas well. CoAP, MQTT and HTTP have been compared against each other in terms ofarchitecture, network performance, cost efficiency and energy consumption.
In [46], the authors performed a qualitative comparison between CoAP and MQTT. Theresults suggested that MQTT is a better candidate for applications requiring sophisti-cated functionalities such as different level of QoS, message persistence and will message.MQTT outperforms CoAP in term of multicast security. However, quantitative analysisindicates that CoAP performs better than MQTT in terms of bandwidth requirement andround trip time (RTT). For reliability, it depends on the actual scenario; MQTT achievesbetter results in scenarios where message exchange happens very frequently, otherwisethe difference is not much. The reason is that MQTT has more sophisticated reliabilityand congestion control. The ability of CoAP to fragment large messages makes it moreefficient when transmitting large messages.
CoAP has been compared against HTTP in term of total cost of ownership (TCO) [47].The comparison included each protocol’s technical parameters such as energy consump-tion and amount of data generated over an application’s life cycle. A deployment of10,000 smart objects served as the testbed for comparison. The system performed thesame tasks (sending the measurements of temperature, humidity, solar radiation, windand precipitation and air quality to the remote server) using CoAP and HTTP.
According to the results, CoAP outperformed HTTP in terms of energy consumption.For the energy analysis, the authors defined two methods of communication. Push modemeans that the object served as a client, it sleeps most of the time in order to save energy.When it is awake, it starts the communication session and transmits the sensed data. Pullmode means that the object served as a server, waiting for incoming request from a remotenode and responding to the request with sensed information. In push mode, CoAP con-sumption rate is up to two times less than HTTP, while in pull mode, CoAP consumptionrate is up to six times less compared with that of HTTP. In terms of data, the CoAP-basedsystem generated 62 GB per month while HTTP-based system produced 434 GB.
In [45], the author gave a qualitative analysis on the competing IoT protocols (HTTP,

41
MQTT, CoAP, AMQP). The criteria used were architecture, security mechanism, QoSschemes and communication patterns. The conclusion was that each and every proto-col has its own strengths and drawbacks. It depends on the scenario and requirementsto choose the most appropriate protocol. Furthermore, a complex system can incorpo-rate several protocols together. Finally, the author summarized the most common IoTcommunication patterns, namely telemetry, inquiries, commands and notifications.
2.4 State of the art in home automation
Home automation is about the automation of home appliances, house work or householdactivities. It may include, but not limit to, centralized control and management of de-vices and appliances in a house to enhance security, comfort, energy efficiency and safety.Home automation offers convenience, energy management capability, remote monitoring& control, accessibility and security to the users.
Figure 21. Components of home automation system.
To date, there are many existing home automation solutions in the market, which providedcustomers with the needed flexibility. Each solution is designed and optimized for itsintended use case. For example, the Fibaro system8 offers control of in-house sensors andactuating capabilities with the use of Z-wave sensors. Actuation is achieved by "rules" oruser command from computer or smartphones. Control49 offers another home automationsystem by connecting the home controller with sensors and actuators; the user just haveto connect to the home controller to gain access to all connected devices in the house.Savant10 offers a similar system of home automation, with control of lighting, climate,
8Fibaro system - http://www.fibaro.com/us/the-fibaro-system/home-center-29Control4 - http://www.control4.com/products/system-overview
10Savant - https://www.savant.com/truecontrol

42
security, media and energy consumption.
However, these systems’ usecases are defined by the manufacturer; there are limited pos-sibilities that systems can co-operate with each other, or the functionality can be extendedsignificantly. In many cases, the system is a proprietary one, there is no chance of includ-ing hardware from other vendors. Otherwise, third-party hardware can be added to thehome automation only if they share the same home automation protocol. Today, there areseveral competing home automation protocols [48], grouped as wireless (Zigbee, Z-wave,WiFi and Bluetooth), wired (X10, Universal Powerline Bus (UPB) and HomePlug ) anddual-band (Insteon, KNX).
• Zigbee is a wireless mesh network used for sensor communication based on IEEE802.15.4 standard. In a Zigbee network, each device acts as a relay to forwardinformation. The maximum theoretical network size for Zigbee is 256.
• X10 is a wired home automation protocol, using power lines to allow communica-tion between devices in a house. Since it is a primitive system, it can support about16 commands.
• Insteon is a dual-band home automation technology that uses both wire and wirelessconnection. The wired connection using power lines serves as the back-up for thewireless connection. The wireless connection uses mesh network; each device isa relay to send and receive information. Insteon supports over 65,000 commands,it also offers limited compatibility with X10 devices. The maximum theoreticalnetwork size for Insteon is unlimited.
• UPB is a wired system using power lines to allow communication between devices.It serves as the improvement of X10; offering faster command transmission andgreater voltage loads.
• KNX is a home automation protocol that incorporates a wide array of physical com-munication media: Ethernet, power lines, twisted pair wiring, radio and infrared,with twisted pair wiring is the most common medium in KNX implementations.
• Z-wave is a very popular wireless standard in home automation, it uses mesh net-works to route information between devices. It offers complete compatibility amongZ-wave devices. The maximum theoretical network size for Z-wave is 232.

43
• Bluetooth is a wireless adhoc point-to-point personal area networking (PAN) tech-nology, therefore it has limited applicability in the field of home automation. Themaximum theoretical network size for Bluetooth is 9.
• WiFi is the most popular wireless Local Area Network (LAN) technology, usedmainly in homes and offices. WiFi offers high speed communication (up to 54Mbps) which exceeds the need of home automation applications. At the same time,WiFi consumes high power, thus making it not a perfect candidate for home au-tomation.
Figure 22. Comparison between Zigbee and Z-wave.
Each protocol has its own protocol stack and pool of devices, and there is virtually no in-teraction between devices from different protocols. For example, there are roughly 1000Z-wave products available in the market11. As a result, home automation systems are putin "verticals" or "silos", each of them has its own architecture, protocol stack, commu-nication pattern and hardware. This makes integration between systems or extending thefunctionalities of a system very challenging and complicated.
2.5 eHealth systems and architectures
eHealth is a multidisciplinary domain that includes large number of different scientificand technology fields in computer science and medicine. eHealth aims to the provisionof healthcare services independent of location, user mobility and time limit. Started froma network of electronic medical equipments, eHealth is now an ubiquitous healthcareparadigm that focuses on disease prevention of an individual, proactive actions and life
11Z-wave benefits - http://www.z-wave.com/z-wave_benefits

44
quality enhancement and, in certain cases, home-delivered emergency care at the rightplace and right time if needed.
Authors in [49] proposed a high level architecture based on European Telecommunica-tions Standards Institute (ETSI)/Parlay architecture.
Figure 23. eHealth architecture proposed in [49].
In this architecture, the authors proposed three types of entities that strongly relate toeach other: subjects, object and operational domains. According to the authors, the wholearchitecture centers around the patients (or individuals).
• Subjects are all people surrounding the patients, mainly doctors and healthcare pro-fessionals as well as the patient’s relatives and friends.
• Objects are ICT objects that are being used to take care of the patients. They repre-sent the whole monitoring infrastructure of the patients, for example wearable sen-sors, medical sensors, body gateway, GPS devices, biosensors and context-awaresensors. This infrastructure offers the real-time monitoring capability of the desiredarchitecture.z
• The operational domain represents the location where the eHealth services are pro-vided such as hospitals, elderly care facilities, clinics and especially the elderlypeople’s own houses.

45
The authors selected an eHealth telemonitoring service as a demonstration of the highlevel architecture mentioned above. This service is expected to offer efficient care of anindividual regardless of time, user mobility, location and resource. The service consistsof the following capabilities:
• Real-time update and assessment of the patient’s health conditions. This capabilityis expected to get the medical and biological parameters from the patient’s bodyand assess any changes occurred
• Real-time update of the patient’s surrounding environment and activity. This capa-bility is expected to acquire context information and recognize patient’s activities.
• Dynamically forming groups of suitable subjects (health professionals, relatives,nurse, friends) based on the patient’s conditions and situations. This capabilityis based on the two previous capabilities; the first one selects the most suitablesubjects based on the data from the patient’s profile while the second one initializesthe telecommunication network that connects the selected subjects.
• The creation of information flow and/or alarms to the appropriate subjects relatedto the patient being monitored.
The telemonitoring service has the following structure, with its four main components:smart home, extended gateway, application server and healthcare center.
In the smart home, there are several network infrastructure such as BAN, wireless per-sonal area network (WPAN) and the WLAN that covers the whole home. The smallestnetwork, BAN, consists of several wearable sensors that regularly collect vital body pa-rameters from the patient and context information from the surrounding environment.These information are aggregated at the body gateway, which forwards the information tothe WPAN. Finally, the WLAN sends data to the public IP-based network.
The extended gateway will be in charge of providing developers of an eHealth remotemonitoring service with: the basic functionalities of a standardized ETSI/Parlay frame-work, the mechanisms of sensor networks, the profiling mechanisms and the securitymechanisms. This extended gateway is crucial in deploying a secure, personalized andcontext-aware remote health monitoring service.

46
Figure 24. The structure of the telemonitoring service in [49].
2.6 Chapter conclusion
Chapter two discussed several aspects of the Smart city paradigm. Started with the def-inition of a Smart city, the chapter proceeded to the discussion of IoT, a key enabler forSmart city implementations. An IoT architecture for Smart city is explained in details,which consists of three viewpoints, namely network-centric IoT, Cloud-centric IoT anddata-centric IoT. These three viewpoints have close relations to each other; each buildingblock in a viewpoint corresponds to other building blocks in other viewpoints. This ar-chitecture is reflected in other literature works, which are briefly described in this chapter.In the next part, the chapter discussed various network communication aspects in a Smartcity. Communication protocols are the key in an IoT implementation; chapter two detailedthe three most widely used application layer protocols in the field of IoT, namely CoAP,MQTT and HTTP. Furthermore, protocols are compared against each other, to highlighteach protocol’s strengths and weaknesses; CoAP and MQTT stand out as the more suit-able communication protocols for IoT domain. The next part of the chapter discussedthe state of the art in home automation, which is crucial for Smart living, one of the sixpivotal domains in Smart city. Finally, the last part of the chapter is dedicated to the back-ground of eHealth systems and architecture. In the next chapter, an IoT-based architectureis proposed to combine home automation hardware and healthcare sensors and to realizean efficient health monitoring system.

47
3 IoT-BASED SYSTEM FOR HOME AUTOMATION ANDHEALTHCARE
Taking into account the background on network communication, home automation andeHealth systems, this chapter starts with describing an existing remote health monitoringsystem and its capabilities. The system itself has its own advantages and disadvantages,which are mentioned in later chapters. As a result, we studied some alternatives, bothexisting software and hardware and our proposed architecture. The ultimate goal is tobuild another system which addresses all the shortcomings of the existing remote healthmonitoring system. For the purpose of evaluation, the proposed architecture is realizedinto a prototype, which is organized into different layers, and complies with the referencemodel described in chapter two.
3.1 The existing Telia eHealth system
The installation at Luleå University of Technology (LTU) is part of a bigger trial thatTelia is working on12. There are currently 43 installations in use. At LTU, the installationcontains a gateway, an IP camera, a motion sensor, a smoke sensor, a door sensor and anemergency button. The set of the devices is detailed in the following table 6:
The structure of the system is depicted in the following figure 25:
Figure 25. The architecture of the Telia installation at LTU.
12TeliaSonera ventures into eHealth - http://www.teliasonera.com/en/newsroom/news/2014/teliasonera-ventures-into-ehealth-/

48
Table 6. The set of devices.
No. Product name Functionality User manual
1 Fibaro FGK-101 Door sensorhttp://www.fibaro.com/en/the-fibaro-system/door-window-sensor
2 Fibaro FGSS-001 Smoke sensorhttp://www.fibaro.com/manuals/en/FGFSS001-Smoke-Sensor/FGSS-001-Smoke-Sensor-en-2.1-2.3.pdf
3 Fibaro FGMS-001 Motion sensorhttp://www.fibaro.com/manuals/en/Motion-Sensor/Motion-Sensor_EN_5.3.14.pdf
4 D-Link DSC-932L IP camerahttp://www.ht.com.au/attach/Files/_DC6AC360-6CC8-4F68-B659-9D94E0D2030D.pdf
5 Gigaset L410Emergency but-ton
http://www.gigaset.com/en_HQ/shop/gigaset-l410.html
6 Inteno CG300-AC Home gateway No manual available
7 AN157-2 Wall plughttp://www.zipato.com/UserDocsImages/_SHOP/user_manuals/Everspring-plugin%20AN157.pdf
The sensors are connected wirelessly to the home gateway through Z-wave protocol 13.The motion sensor detects the human movement by receiving infra-red signal. The smokesensor sends an alarm when there is smoke or the temperature is too high. The door sen-sor checks whether the door is open or closed. The IP camera is wired to the gateway byEthernet cable. The emergency button is wirelessly connected to the gateway. If the userpresses the button, the gateway triggers the remote Telia server to send an SMS to a reg-istered phone number, usually the caregivers or relatives of the person being monitored.
The system constantly updates the Telia server in real-time about events occurred in thehouse. The Telia server maintains a log, which stores all the events occurred. Theseare the most essential tasks of such a remote health monitoring system. However, thesystem has some weaknesses that need to be addressed. First of all, the system does notallow including or excluding home automation and healthcare sensors. Users need tocontact system admins to get permission for those inclusion and exclusion. This systemis a typical "vertical" system or "silo" that was mentioned in section 2.4, significantlyreducing the ability of the users to modify its use cases. Furthermore, the transmissionof sensor data is not efficient in term of bandwidth and volume of data. This fact will beexplained in chapter 4.
13http://z-wavealliance.org/about_z-wave_technology/

49
3.2 openHAB default implementation
The implementation consists of the same sensors that are described in section 3.1, namelythe wall plug, the door sensor and the motion sensor. The Z-wave communication ismanaged by Aeon Z-Stick dongle 14. The dongle is then connected to a computer (laptopor Raspberry Pi 15) through USB port. openHAB is installed on the computer, togetherwith the binding for Z-wave.
The architecture of the system is depicted in the following figure:
Figure 26. The architecture of the openHAB implementation.
The sensors are connected wirelessly to the home gateway through Z-wave protocol. Themotion sensor can detect the human movement as well as measure the temperature, rel-ative humidity and light intensity of the surrounding environment. The wall plug canmeasure the power consumption, the voltage and the current. The door sensor can checkif the door is open or closed.
3.3 The proposed IoT-based remote health monitoring architecture
A smart, efficient and safe living environment is an integral part of healthcare, especiallyfor elderly people. Such an environment will offer those living inside the awareness ofthe situation as well as the ability to respond to or prevent certain events such as accidents
14Aeon Z-Stick - http://aeotec.com/z-wave-usb-stick15Raspberry Pi - http://en.wikipedia.org/wiki/Raspberry_Pi

50
or health emergency situations. For example, a smart, automated home can prevent fallsfrom accidents by automatically turning on lights or preventing flood from leaked faucets.It can measure and adjust the optimal room temperature based on outside temperature, orto ensure medicine cabinet access with context sensors. The same knowledge and capa-bilities is provided to their relatives as well as caregivers through existing communicationinfrastructure.
In order to overcome the challenges of the current "vertical" home automation system,openHAB is suggested as the middleware to integrate different home automation solutionsand create a single platform to interact with sensors and actuators. Currently, openHABsoftware supports a large number of different technologies, device types and protocols,including the extremely popular home automation protocols such as Z-wave, KNX andInsteon16. Many other protocols are expected to be incorporated into openHAB in thefuture.
openHAB is incorporated in a bigger architecture, which aims to realize efficient andsmart health monitoring systems. The architecture is named as IoT-based Remote HealthMonitoring (IReHMo) The overall architecture of IReHMo consists of five layers, namelysensing layer, home gateway, network infrastructure, cloud computing and applicationlayer, as described in figure 27.
• The sensing layer comprises of home automation devices, such as sensors (tem-perature, humidity, smoke and CO, water leak) and actuators (power switch, lock,dimmer). For the purpose of eHealth, medical sensors can be included in this layer,such as RFID sensors, accelerometers and other healthcare sensors. Today, there isa long list of biosensors or healthcare sensors that measure body temperature, bloodpressure, heart pulse, electrocardiography (ECG), respiratory rate, blood sugar. An-other source of healthcare information may come from smartphones with healthmonitoring functionality. It is possible to collect all these health-related informa-tion in this sensing layer and forward it to higher layers for further processing.
• In the home gateway layer, sensor data are collected and stored in different databases.openHAB collects data from openHAB-supported sensors. Other medical sensorsstream their data to local databases. In the home gateway, activities such as filteringor pre-processing can take place, to select and improve the data for the next stageof data transmission. Not all sensed data are needed, therefore filtering selects theone that is important, meaningful or relevant. Pre-processing can add more contextinformation to the data to be transmitted. These activities can help reducing the
16Technologies supported by openHAB - http://www.openhab.org/features-tech.html

51
Figure 27. The proposed architecture.
bandwidth required or the volume of data to be transmitted. Different databasesare presenting in this layer. Local database is in charge of storing raw data, whileexport database is for storing processed data, ready to be transmitted. Encryption isnecessary for preserving data privacy, as health data is sensitive and need to be pro-tected. At the gateway layer, the selection of IoT communication protocol is crucialas it decides the performance of the system, which is discussed in later chapters.
• Information from the home gateway is transmitted to the place where it is consumedusing the network infrastructure. To date, different networking technologies areavailable, namely cellular (3G, 4G), mobile broadband, fiber and ADSL. The trans-mission can include WiFi and Ethernet technologies. Depending on the requiredbandwidth of the implementation, certain technologies are preferred to ensure thebest performance and efficiency.
• Further processing is done in cloud computing facilities. Here the sensor data is

52
transformed into meaningful knowledge and actions, using algorithms and dedi-cated software. In this layer, the main activities are further processing of data, datastorage and analytics. Efficient and elastic data storage can be achieved by cloudservices such as Amazon S3 or Microsoft Azure.
• The top-most layer of the stack is the application layer, where applications inter-act with users through web interfaces. Since sensor data is collected, stored andprocessed continuously, users can get a holistic picture of the situation and deliveractions accordingly. Typical applications based on health data collected by sensorscan be remote health monitoring, quick reaction to emergency situations or healthdata gathering and statistics.
3.4 Actual implementationAn actual implementation of IReHMo has been carried out. In the sensing layer, theimplementation includes Z-wave sensors for monitoring parameters such as room tem-perature, the presence of a person, the state of the door/windows, the presence of smoke.Healthcare sensors are RFID readers and embedded accelerometers from iPhone for thepurpose of activity recognition. Encryption is carried out at the home gateway, using AES128-bit encryption algorithm. The healthcare data is encrypted into a string, which is thentransmitted over the network. This encryption process first started with the addition ofpadding into the healthcare data, to lengthen the size into a multiple of 16 bytes, as re-quired by the AES algorithm. AES encrypts this string, transforming it into a byte array.This byte array is converted into a hexadecimal string, to be delivered over the network.
At the monitoring side, the encrypted string is decrypted; as a result the original healthcaredata is obtained. First, the hexadecimal string is converted into a byte array, which is theinput for the decryption. The AES algorithm decrypted it, using the same key as theencryption. Finally, the padding is removed to get the original healthcare data. The keyfor encryption and decryption can be a default common key. To achieve higher level ofsecurity, the key can be computed based on the system date.
In the home gateway layer, the sensed data are stored locally in the home gateway aswell as transmitted to another monitoring computer. Two protocols for transporting sen-sor data to the monitoring side were used, namely CoAP and HTTP. The details of theimplementation are depicted in the following figure 29:

53
Figure 28. The encryption and decryption process.
Figure 29. IReHMo actual implementation.
3.5 Chapter Conclusion
With the use of openHAB, it is possible to integrate different home automation systemsand hardware, which was unavailable previously due to their incompatibility issues. As aresult, IReHMo can enhance the comfort and awareness of the indoor environment wellas prevent accidents, especially for elderly people. Health sensors are connected to thehome gateway, fetching health-related data to the system for analyzing and monitoring.These sensor data are the input for the flow of information, from raw data to high levelknowledge and statistics, from the sensing layer to the application layer. IReHMo offersa comprehensive stack of layers that addresses the challenge of getting both detailed andhigh level eHealth knowledge in real-time. This layered structure complies with the well-established IoT architecture described in Section 2.1, as they all have separate layers forsensing, transmitting data and processing. The behaviour and performance of IReHMo

54
will be discussed in Chapter 4.

55
4 RESULTS
This chapter presents the description, the behaviour, the required bandwidth and the vol-ume of generated data from the Telia eHealth installation installed at Luleå University ofTechnology, the default openHAB implementation, the CoAP-based IReHMo implemen-tation and the HTTP-based IReHMo implementation. Throughout this chapter, the uplinkchannel is defined as the data flow from the place being monitored to the monitoring site,and the downlink channel is defined as the data flow from the monitoring site to the placebeing monitored. The thesis studies the performance of the existing Telia eHealth instal-lation as the baseline system in the uplink and downlink, specifies the components thatare inefficient and things that can be improved. Subsequently, several communicationprotocols were tried on the IReHMo architecture, to find the most efficient protocol thatat the same time retains all the strengths of the Telia installation. The scalability analysisis detailed in the last part of the chapter, which includes the data from experiments toestimate the cellular bandwidth, the demographic information of the Västerbotten regionand the required bandwidth from various remote health monitoring scenarios.
4.1 Telia eHealth installation at Luleå University of Technology
To analyze the traffic pattern, Wireshark 17 is used to capture the packets exchanged be-tween the gateway and Telia remote server. As connected to the LTU network, the gate-way obtained its IP address of 130.240.134.73. On the server side, there are 4 IP ad-dresses to which the gateway communicates: 89.18.105.52, 89.18.105.57, 89.18.105.35and 54.75.253.90.
4.1.1 Periodic traffic pattern
The gateway exchanges packets periodically (without any sensor data) with the four IPaddresses below: 89.18.105.52, 89.18.105.57, 89.18.105.35 and 54.74.253.90
To/from IP address 89.18.105.52 This IP address receives sensor data from the Z-wavesensors of the Telia eHealth installation. There are two periodic traffic patterns here.In pattern 1, every 60 seconds the gateway (130.240.134.73) sends an application layer
17Wireshark official page - https://www.wireshark.org/

56
packet of 74 bytes, followed by an application layer ACK of 74 bytes from 89.18.105.52and a transport layer ACK from 130.240.134.73. These patterns correspond to the PIN-GREQ and PINGRESP packets of the MQTT protocol mentioned in Chapter 2. Theprocess is detailed in the following figure 30:
Figure 30. Periodic traffic pattern 1.
In pattern 2, every 240 seconds the gateway (130.240.134.73) sends an application layerpacket of 970 bytes, followed by a transport layer ACK of 66 bytes from 89.18.105.52.The process is detailed in the following figure 31:
Figure 31. Periodic traffic pattern 2.
The following table 7 summarizes the data generated by pattern 1 and 2 in bytes:
Table 7. Data generated from pattern 1 and 2.
Pattern Lower layers(bytes)
Application layer(bytes)
Total(bytes)
Pattern 1 (uplink) - MQTT 66 74 140Pattern 1 (downlink) - ACK 66 74 140Pattern 1 (uplink) - ACK 66 0 66Pattern 2 (uplink) - MQTT 66 970 1036Pattern 2 (downlink) - ACK 66 0 66
The following figure 32 shows the traffic as seen from Wireshark:

57
Figure 32. Screenshot showing pattern 1 and 2
To/from IP address 89.18.105.57 The gateway initializes the key exchange to 89.18.105.57,using Diffie-Hellman Key Exchange Algorithm. This IP address receives encrypted pack-ets from the gateway. There is one periodic traffic pattern here, every 60 seconds thegateway sends two encrypted packets using SSHv2 of 36 bytes each, followed by 2 ACKpackets from 89.18.105.57. The process is detailed in the following figure 33:
Figure 33. Periodic traffic pattern 3.
The following table 8 summarizes the data generated by pattern 3 in bytes:
Table 8. Data generated from pattern 3.
Pattern Lower layers Application layer TotalPattern 3 (uplink) - Encrypted packet 66 36 102Pattern 3 (downlink) - ACK 66 0 66
To/from IP address 89.18.105.35 The gateway communicates with 89.18.105.35 tosend an HTTP GET request; in response the Telia server sends back a HTTP message

58
with status code 200 OK. The whole process happens every 240 seconds. It starts whenthe gateway initiates the 3-way TCP handshake, then the gateway sends an HTTP GETpacket, after that the Telia server sends back an HTTP message with status code 200 OK,finally the process ends with ACK from both gateway and Telia server. The whole processis detailed in the following figure 34:
Figure 34. Periodic traffic pattern 4.
The following table 9 summarizes the data generated by pattern 4 in bytes:
Table 9. Data generated from pattern 4.
Pattern Lower layers Application layer TotalPattern 4 (uplink) - SYN 74 0 74Pattern 4 (downlink) - SYN, ACK 74 0 74Pattern 4 (uplink) - ACK 66 0 66Pattern 4 (uplink) - HTTP GET 66 82 148Pattern 4 (downlink) - ACK 66 0 66Pattern 4 (downlink) - HTTP 200 OK 66 226 292Pattern 4 (downlink) - FIN, ACK 66 0 66Pattern 4 (uplink) - ACK 66 0 66Pattern 4 (uplink) - FIN, ACK 66 0 66Pattern 4 (downlink) - ACK 66 0 66
To/from IP address 54.75.253.90 The gateway communicates with 54.75.253.90 tomaintain the connection to the cloud-based video server. There are two periodic traffic

59
patterns here. In pattern 5, the gateway exchanges packets with the video server. Theprocess starts with the 3-way TCP handshake, later ACK packets are exchanged. Thispattern 5 happens every 60 seconds The whole process is detailed in the following figure35:
Figure 35. Periodic traffic pattern 5.
In pattern 6, the gateway exchanges TCP Keep-Alive packets with the video server. Thegateway sends TCP Keep-Alive packet to the server; the server responses by sendingTCP Keep-Alive ACK packet. The process happens every 30 seconds. It is detailed in thefollowing figure 36:
Figure 36. Periodic traffic pattern 6.
The following table 10 summarizes the data generated by pattern 5 and 6 in bytes:
These patterns 1-6 are periodic traffic patterns, used by home gateway and different re-mote Telia servers to maintain and update the states of the network connection.
4.1.2 Sensor data
Upon receiving triggers from the sensors, the gateway sends data to the Telia server89.18.105.52 accordingly. Using Wireshark, it is possible to see the details of the datacommunication. In this thesis, the focus is on the size and pattern of the data generated

60
Table 10. Data generated from pattern 5 and 6.
Pattern Lower layers Application layer TotalPattern 5 (uplink) - SYN 74 0 74Pattern 5 (downlink) - SYN, ACK 74 0 74Pattern 5 (uplink) - ACK 66 0 66Pattern 5 (uplink) - PSH, ACK 234 0 234Pattern 5 (downlink) - FIN, ACK 66 0 66Pattern 5 (uplink) - ACK 66 0 66Pattern 5 (uplink) - FIN, ACK 66 0 66Pattern 6 (uplink) - Keep-Alive 66 0 66Pattern 6 (downlink) - Keep-Alive ACK 66 0 66
by gateway in response to a trigger from sensors. Different sensors in the system producedifferent data size and patterns, depending on the event happened.
Door Sensor The sensor can detect the following events: Door opening, door closingand sensor tampering. Sensor tampering means the cover of the door sensor is opened, orthe sensor is being removed from the frame of the door/window.
• Door opening: The gateway sends two application layer packets of 138 and 154bytes respectively. Each of these packet is followed by ACK packets from gatewayas well as Telia server. The event is logged in Telia server
The following figure describes the packet exchange between gateway and Telia server:
Figure 37. Packet exchange triggered by door opening event.
The following table 11 summarizes the data generated by door opening event from doorsensor:

61
Table 11. Data generated from door opening event.
Packet Lower layers Application layer TotalPacket 1 (uplink) 66 138 204Packet 2 (downlink) 66 74 140Packet 3 (uplink) 66 0 66Packet 4 (uplink) 66 154 220Packet 5 (downlink) 66 74 140Packet 6 (uplink) 66 0 66
• Door closing: The gateway sends three application layer packets of 138, 154 and154 bytes respectively. Each of these packet is followed by ACK packets fromgateway as well as Telia server. The event is logged in Telia server
• Sensor tampering: The gateway sends one application layer packet of 202 bytes.This packet is followed by ACK packets from gateway as well as Telia server. Theevent is not listed in the log from Telia server.
Wall plug The wall plug can detect when it changes the state, either by pressing thebutton or controlling remotely.
• ON: The gateway sends two application layer packets of 234 and 138 bytes respec-tively. Each of these packet is followed by ACK packets from gateway as well asTelia server. The event is logged in Telia server.
• OFF: The gateway sends two application layer packets of 234 and 138 bytes re-spectively. Each of these packet is followed by ACK packets from gateway as wellas Telia server. The event is logged in Telia server.
Emergency button The emergency button can detect if it is pressed by the user.
• Button pressed: The gateway sends three application layer packets of 234, 154 and154 bytes respectively. Each of these packet is followed by ACK packets fromgateway as well as Telia server. The event is logged in Telia server. A SMS is sentto a registered phone number, for example the relative of the person being watched.
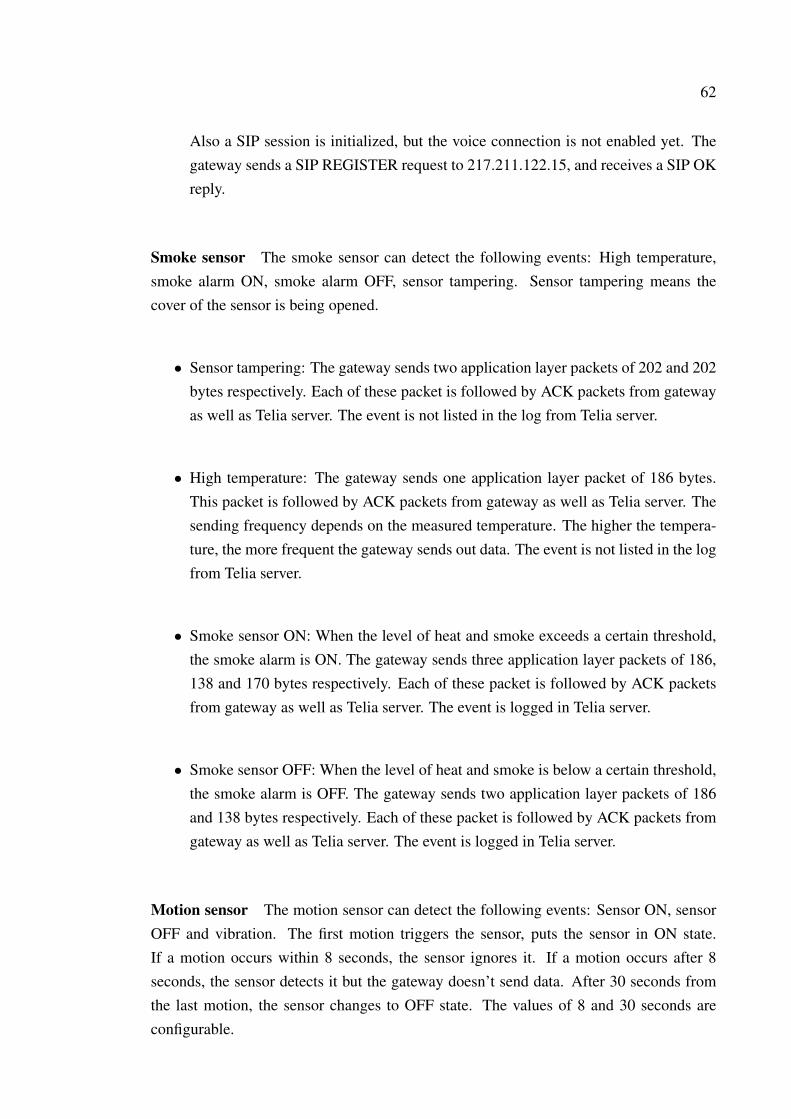
62
Also a SIP session is initialized, but the voice connection is not enabled yet. Thegateway sends a SIP REGISTER request to 217.211.122.15, and receives a SIP OKreply.
Smoke sensor The smoke sensor can detect the following events: High temperature,smoke alarm ON, smoke alarm OFF, sensor tampering. Sensor tampering means thecover of the sensor is being opened.
• Sensor tampering: The gateway sends two application layer packets of 202 and 202bytes respectively. Each of these packet is followed by ACK packets from gatewayas well as Telia server. The event is not listed in the log from Telia server.
• High temperature: The gateway sends one application layer packet of 186 bytes.This packet is followed by ACK packets from gateway as well as Telia server. Thesending frequency depends on the measured temperature. The higher the tempera-ture, the more frequent the gateway sends out data. The event is not listed in the logfrom Telia server.
• Smoke sensor ON: When the level of heat and smoke exceeds a certain threshold,the smoke alarm is ON. The gateway sends three application layer packets of 186,138 and 170 bytes respectively. Each of these packet is followed by ACK packetsfrom gateway as well as Telia server. The event is logged in Telia server.
• Smoke sensor OFF: When the level of heat and smoke is below a certain threshold,the smoke alarm is OFF. The gateway sends two application layer packets of 186and 138 bytes respectively. Each of these packet is followed by ACK packets fromgateway as well as Telia server. The event is logged in Telia server.
Motion sensor The motion sensor can detect the following events: Sensor ON, sensorOFF and vibration. The first motion triggers the sensor, puts the sensor in ON state.If a motion occurs within 8 seconds, the sensor ignores it. If a motion occurs after 8seconds, the sensor detects it but the gateway doesn’t send data. After 30 seconds fromthe last motion, the sensor changes to OFF state. The values of 8 and 30 seconds areconfigurable.

63
• Motion sensor ON: The gateway sends three application layer packets of 154, 138and 154 bytes respectively. Each of these packet is followed by ACK packets fromgateway as well as Telia server. The event is logged in Telia server.
• Motion sensor OFF: The gateway sends five application layer packets of 154, 138,154, 154 and 154 bytes respectively. Each of these packet is followed by ACKpackets from gateway as well as Telia server. The event is logged in Telia server.
• Vibration: The gateway sends two application layer packets of 202 and 202 bytesrespectively. Each of these packet is followed by ACK packets from gateway aswell as Telia server. The event is not listed in the log from Telia server.
IP camera The gateway sends video frames to Telia video server upon user request. Thefirst phase is login, as the user inputs his credential, the gateway and Telia video serverexchange packets to make the video stream ready. It takes a series of packets to completethis phase. The second phase starts when user starts the video stream. A video frameis sent to Telia approximately every 1.4 second. Each video frame is fragmented intoseveral packets, depending on the resolution of the IP camera. At the current resolutionit takes 15 packets to transmit a video frame. Each video frame starts with a packet of53 bytes then 13 packets of 1448 bytes each and the last packet delivers the remainingbytes. Each packet is followed by one ACK packet from the video server. When theframe is sent completely, one ACK packet of 485 bytes is sent from the video server tothe gateway. The whole process takes 31 packets in total. The whole process is detailedin the following figure 38:
Figure 38. Packet exchange for the video stream.
The following table 12 summarizes the data generated by a video frame:
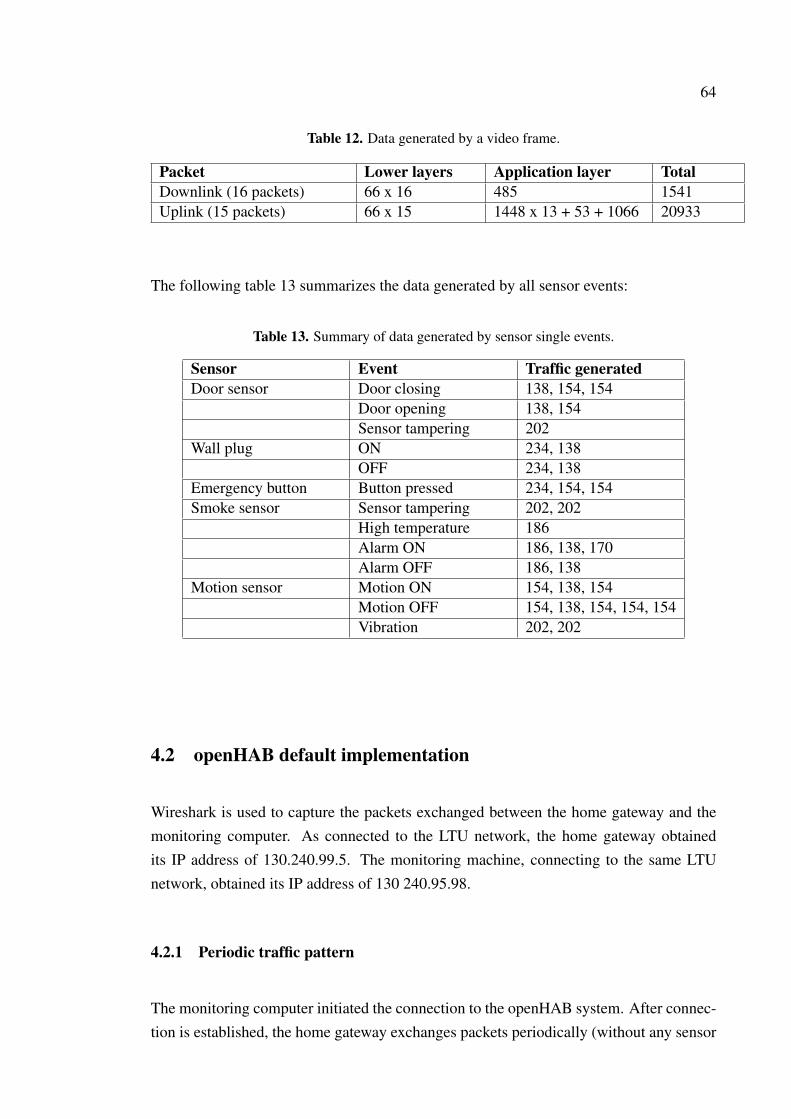
64
Table 12. Data generated by a video frame.
Packet Lower layers Application layer TotalDownlink (16 packets) 66 x 16 485 1541Uplink (15 packets) 66 x 15 1448 x 13 + 53 + 1066 20933
The following table 13 summarizes the data generated by all sensor events:
Table 13. Summary of data generated by sensor single events.
Sensor Event Traffic generatedDoor sensor Door closing 138, 154, 154
Door opening 138, 154Sensor tampering 202
Wall plug ON 234, 138OFF 234, 138
Emergency button Button pressed 234, 154, 154Smoke sensor Sensor tampering 202, 202
High temperature 186Alarm ON 186, 138, 170Alarm OFF 186, 138
Motion sensor Motion ON 154, 138, 154Motion OFF 154, 138, 154, 154, 154Vibration 202, 202
4.2 openHAB default implementation
Wireshark is used to capture the packets exchanged between the home gateway and themonitoring computer. As connected to the LTU network, the home gateway obtainedits IP address of 130.240.99.5. The monitoring machine, connecting to the same LTUnetwork, obtained its IP address of 130 240.95.98.
4.2.1 Periodic traffic pattern
The monitoring computer initiated the connection to the openHAB system. After connec-tion is established, the home gateway exchanges packets periodically (without any sensor

65
data) with the monitoring computer. In the default setting, openHAB sends TCP Keep-Alive packet every 10 seconds. The monitoring computer sends HTTP GET request atthe same frequency of 10 seconds. The process is detailed in the following figure 39:
Figure 39. The periodic message exchange between openHAB and monitoring computer.
The following table 14 summarizes the data generated by this periodic pattern:
Table 14. Data generated by openHAB periodic packet exchange.
Packet TotalPacket 1 (downlink) 55Packet 2 (uplink) 66Packet 3 (uplink) 254Packet 4 (downlink) 55Packet 5 (uplink) 60Total uplink 60Total downlink 380
4.2.2 Sensor data
In openHAB, items are objects which can be read from or written on, in order to retrievedata or change their status. Examples can be a temperature value read from a sensor, ora light switch which can be toggled on/off. Items are grouped into "group" and "frame".A group is a set of items that share a common item characteristic, such as item type orlocation inside the building. A frame is a set of items that are displayed to the user at thesame time, for example all the items in the living room.
The sensor data is sent when any item in the frame got updated. It can be a closed doorbeing opened, a motion detected or the wall plug’s voltage is updated according to a

66
schedule. In its default setting, openHAB sends all the values of items in the frame as asingle XML file using HTTP. Therefore, the amount of traffic sent between home gatewayand monitoring computer depends on the number of items in a frame being monitored.For example, the following implementation consists of two entities, an openHAB serverat 192.168.1.51 and the client at the monitoring computer. The frame consists of fiveitems, as shown in figure 40:
Figure 40. The openHAB frame as displayed to the user.
In this example, opanHAB takes 1095 bytes (content-length of the HTTP message) totransmit the whole frame, which consists of 5 items. If the number of item is increased to9, it takes 1526 bytes (content-length of the HTTP message) to transmit the whole frame.Fragmentation occurs, as shown in the following screenshot:
Fragmentation occurred due to the fact that the size of the XML file to be transmittedexceeds the MTU of the transport layer. Since HTTP is running on top of TCP, the MTUsize of TCP applies (1500 bytes ) to HTTP message.
4.3 CoAP-based IReHMo implementation
4.3.1 Architecture of the implementation
This implementation consists of the same sensors that are described in section 4.2.1,namely the wall plug, the door sensor and the motion sensor. Z-wave communicationis managed by the Aeon Z-Stick dongle, which is connected to a computer (laptop orRaspberry Pi) through USB port. openHAB is installed on the computer, together withthe binding for Z-wave.
CoAP is installed on the computer as the application layer protocol for transmitting sensordata. The computer acts as a CoAP server, responding to request sent by CoAP clients

67
Figure 41. Fragmentation due to big XML file size exceeding MTU.
over the network. Sensor data is fetched to the CoAP server from the openHAB log file.The architecture is depicted in the following figure 42:
Figure 42. The architecture of the CoAP-based IReHMo implementation.
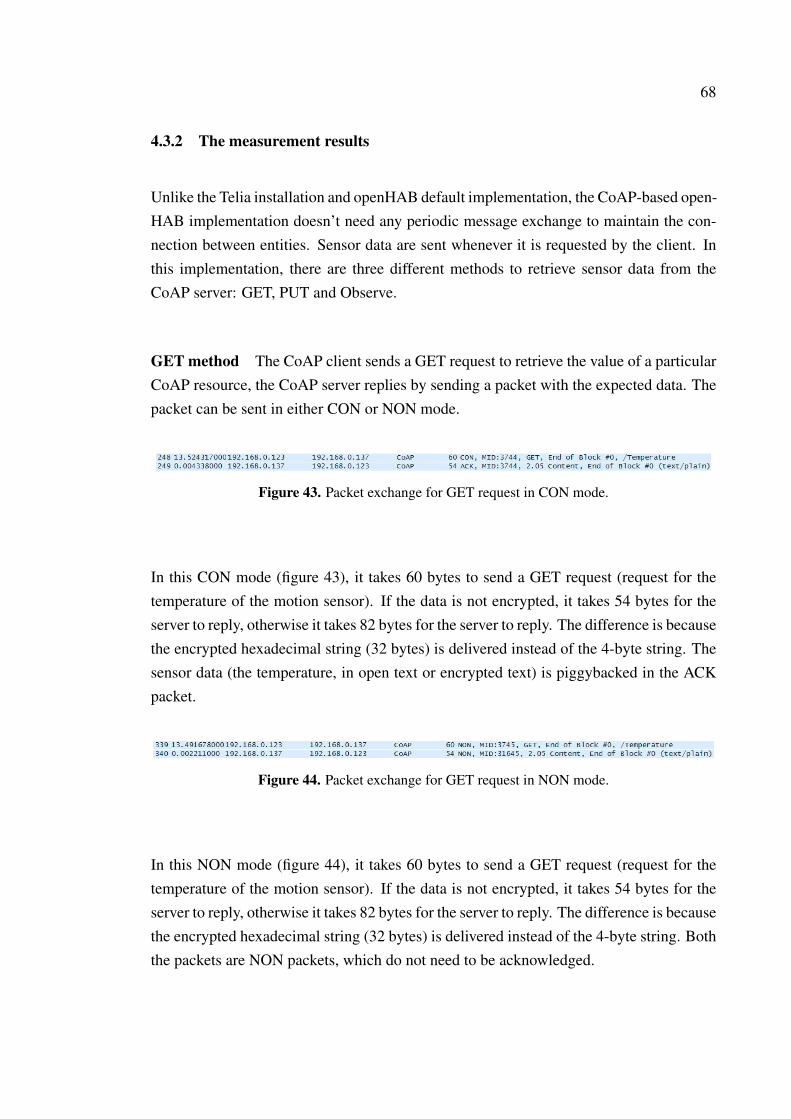
68
4.3.2 The measurement results
Unlike the Telia installation and openHAB default implementation, the CoAP-based open-HAB implementation doesn’t need any periodic message exchange to maintain the con-nection between entities. Sensor data are sent whenever it is requested by the client. Inthis implementation, there are three different methods to retrieve sensor data from theCoAP server: GET, PUT and Observe.
GET method The CoAP client sends a GET request to retrieve the value of a particularCoAP resource, the CoAP server replies by sending a packet with the expected data. Thepacket can be sent in either CON or NON mode.
Figure 43. Packet exchange for GET request in CON mode.
In this CON mode (figure 43), it takes 60 bytes to send a GET request (request for thetemperature of the motion sensor). If the data is not encrypted, it takes 54 bytes for theserver to reply, otherwise it takes 82 bytes for the server to reply. The difference is becausethe encrypted hexadecimal string (32 bytes) is delivered instead of the 4-byte string. Thesensor data (the temperature, in open text or encrypted text) is piggybacked in the ACKpacket.
Figure 44. Packet exchange for GET request in NON mode.
In this NON mode (figure 44), it takes 60 bytes to send a GET request (request for thetemperature of the motion sensor). If the data is not encrypted, it takes 54 bytes for theserver to reply, otherwise it takes 82 bytes for the server to reply. The difference is becausethe encrypted hexadecimal string (32 bytes) is delivered instead of the 4-byte string. Boththe packets are NON packets, which do not need to be acknowledged.

69
PUT method The CoAP client sends a PUT request to retrieve the value of a particularCoAP resource, the CoAP server replies by sending a packet with the expected data. Thepacket can be sent in either CON or NON mode.
Figure 45. Packet exchange for PUT request in CON mode.
In this CON mode (figure 45), it takes 70 bytes to send a PUT request (request for thetemperature of the motion sensor). If the data is not encrypted, it takes 52 bytes for theserver to reply, otherwise it takes 80 bytes for the server to reply. The difference is becausethe encrypted hexadecimal string (32 bytes) is delivered instead of the 4-byte string. Thesensor data (the temperature, in text format) is piggybacked in the ACK packet.
Figure 46. Packet exchange for PUT request in NON mode.
In this NON mode (figure 46), it takes 70 bytes to send a GET request (request for thetemperature of the motion sensor). If the data is not encrypted, it takes 52 bytes for theserver to reply, otherwise it takes 80 bytes for the server to reply. The difference is becausethe encrypted hexadecimal string (32 bytes) is delivered instead of the 4-byte string. Boththe packets are NON packets, which do not need to be acknowledged.
Observe method In this Observe method, the CoAP server keeps updating the clientabout a particular CoAP resource as requested by the CoAP client. Observe functionalitycan be done in either CON or NON mode.
Figure 47. Observe in CON mode.

70
In this CON mode (figure 47), the CoAP server continuously sends out packets containingthe sensor data to the client. Each packet has to be acknowledged by the client, whichreplies by sending an ACK. In this example of temperature reading, it takes 59 bytes tosend the sensor data (the temperature, in unencrypted text) and 85 bytes to send the sensordata in encrypted text. It takes 60 bytes to acknowledge the successful transmission of thesensor data.
Figure 48. Observe in NON mode.
In this NON mode (figure 48), the CoAP server continuously sends out packets containingthe sensor data to the client. There is no need to acknowledge the packet transmission, asthe communication is one-way. In this example of temperature reading, it takes 58 bytesto send the sensor data (the unencrypted text) to the client, while the encrypted text takes85 bytes.
4.4 HTTP-based IReHMo implementation
4.4.1 Architecture of the implementation
This implementation consists of the same sensors that are described in section 4.2.1,namely the wall plug, the door sensor and the motion sensor. Z-wave communicationis managed by the Aeon Z-Stick dongle, which is connected to a computer (laptop orRaspberry Pi) through USB port. openHAB is installed on the computer, together withthe binding for Z-wave.
The computer uses HTTP as the application layer protocol for transmitting sensor data.The computer acts as a HTTP server, responding to request sent by HTTP clients overthe network. Sensor data is fetched to the HTTP server from the openHAB log file. Thearchitecture is depicted in the following figure:

71
Figure 49. The architecture of the HTTP-based IReHMo implementation.
4.4.2 The measurement results
Unlike the Telia installation and openHAB default implementation, the HTTP-based open-HAB implementation doesn’t need any periodic message exchange to maintain the con-nection between entities. Sensor data are sent whenever it is requested by the client. Inthis implementation, sensor data (in text format) are retrieved from the HTTP server usingGET method.
An HTTP session is created for requesting the sensor data (for example the voltage levelat the wall plug) from the HTTP server. The session starts with TCP 3-way handshake,then the HTTP GET request is sent to the server, the server replies with an HTTP mes-sage containing the text value of the voltage. During the HTTP session, TCP Keep-Alivepackets are exchanged between the HTTP client and server. If there is no more requestsfrom the client, the HTTP session is ended by exchanging FIN packets between the con-cerning parties. For the whole session, it took 845 bytes in the downlink and 494 bytes inthe uplink to get a sensor reading (voltage level) from the wall plug. The following figuresummarizes the packet exchange between the HTTP client and server:
The following figure details the packet exchange of an HTTP session explained in theprevious figure:

72
Figure 50. The process of exchanging HTTP packets for getting a sensor reading.
Figure 51. The details of exchanging HTTP packets for getting a sensor reading.
4.5 Scalability analysis
4.5.1 Bitrate of different events
Based on the results presented in the previous section, the next step is to quantify thebitrate from the periodic traffic patterns, the single sensor event as well as the combinationof sensor events, both in the uplink and downlink of all the implementations mentionedabove.
The following table 15 summarizes the bitrate of the periodic traffic patterns:
The following table 16 summarizes the bitrate of sensor events in the Telia installation:

73
Table 15. Bitrate of the periodic traffic patterns in Telia installation.
Pattern Uplink/Downlink Bytes Bitrate (kbps) Total (kbps)Pattern 1 Uplink 206 1.648 2.768
Downlink 140 1.12Pattern 2 Uplink 1036 8.288 8.816
Downlink 66 0.528Pattern 3 Uplink 204 1.632 2.688
Downlink 102 1.056Pattern 4 Uplink 420 3.36 7.872
Downlink 564 4.512Pattern 5 Uplink 506 4.048 5.168
Downlink 140 1.12Pattern 6 Uplink 66 0.528 1.056
Downlink 66 0.528
Table 16. Bitrate of sensor single events in Telia installation.
EventUplink/Downlink
BytesBitrate(kbps)
Total (kbps)
Door closing Uplink 644 5.152 8.512
Downlink 420 3.36
Door opening Uplink 556 4.448 6.688
Downlink 280 2.24
Door Sensor tampered Uplink 334 2.672 3.792
Downlink 140 1.12
Wall Plug ON Uplink 636 5.088 7.328
Downlink 280 2.24
Wall plug OFF Uplink 636 5.088 7.328
Downlink 280 2.24
Button pressed Uplink 938 7.504 10.864
Downlink 420 3.36
Smoke sensor tampered Uplink 668 5.344 7.584
Downlink 280 2.24
High temperature Uplink 318 2.544 3.664
Downlink 140 1.12
Smoke alarm ON Uplink 890 7.12 10.48
Downlink 420 3.36
Smoke alarm OFF Uplink 1084 8.672 14.272
Downlink 700 5.6
Motion sensor ON Uplink 842 6.736 10.096
Downlink 420 3.36
Motion sensor OFF Uplink 1084 8.672 14.272
Downlink 700 5.6
Vibration Uplink 668 5.344 7.584
Downlink 280 2.24
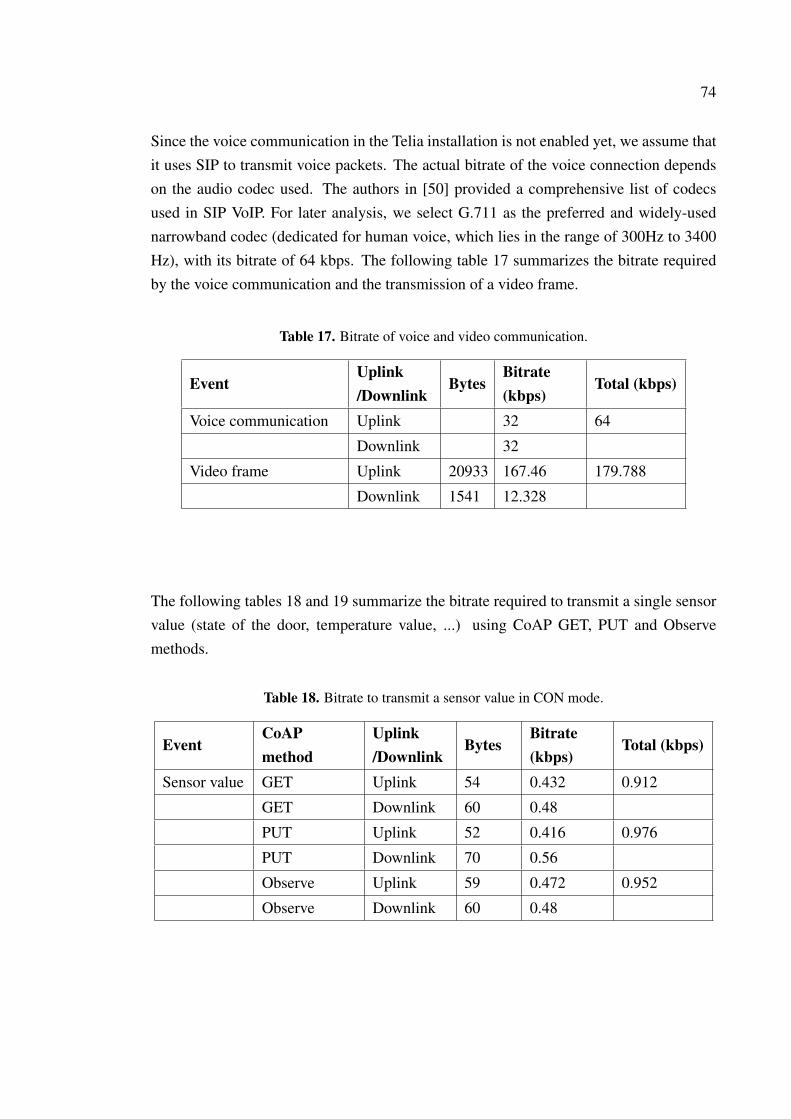
74
Since the voice communication in the Telia installation is not enabled yet, we assume thatit uses SIP to transmit voice packets. The actual bitrate of the voice connection dependson the audio codec used. The authors in [50] provided a comprehensive list of codecsused in SIP VoIP. For later analysis, we select G.711 as the preferred and widely-usednarrowband codec (dedicated for human voice, which lies in the range of 300Hz to 3400Hz), with its bitrate of 64 kbps. The following table 17 summarizes the bitrate requiredby the voice communication and the transmission of a video frame.
Table 17. Bitrate of voice and video communication.
EventUplink/Downlink
BytesBitrate(kbps)
Total (kbps)
Voice communication Uplink 32 64
Downlink 32
Video frame Uplink 20933 167.46 179.788
Downlink 1541 12.328
The following tables 18 and 19 summarize the bitrate required to transmit a single sensorvalue (state of the door, temperature value, ...) using CoAP GET, PUT and Observemethods.
Table 18. Bitrate to transmit a sensor value in CON mode.
EventCoAPmethod
Uplink/Downlink
BytesBitrate(kbps)
Total (kbps)
Sensor value GET Uplink 54 0.432 0.912
GET Downlink 60 0.48
PUT Uplink 52 0.416 0.976
PUT Downlink 70 0.56
Observe Uplink 59 0.472 0.952
Observe Downlink 60 0.48

75
Table 19. Bitrate to transmit a sensor value in NON mode.
EventCoAPmethod
Uplink/Downlink
BytesBitrate(kbps)
Total (kbps)
Sensor value GET Uplink 54 0.432 0.912
GET Downlink 60 0.48
PUT Uplink 52 0.416 0.976
PUT Downlink 70 0.56
Observe Uplink 58 0.464 0.464
Observe Downlink 0 0.00
The following table 20 summarizes the bitrate required to transmit a single sensor reading(state of the door, temperature value, ...) using HTTP.
Table 20. Bandwidth required to transmit a sensor value using HTTP.
Event Uplink/Downlink BytesBitrate(kbps)
Total (kbps)
Sensor value Uplink 254 2.032 6.872
Downlink 605 4.84
The following table 21 summarizes the bitrate required to transmit an openHAB frame:
Table 21. Instantaneous bandwidth requirement of an openHAB frame.
FrameUplink/Downlink
Bytes Bitrate (kbps) Total (kbps)
5 items Uplink 1304 10.432 14.568
Downlink 517 4.136
9 items Uplink 1789 14.321 18.457
Downlink 517 4.136

76
The following figures show the comparisons between bitrates from different events.
Figure 52. Comparison between bitrate of different events in the uplink.
Figure 53. Comparison between bitrate of different events in the downlink.
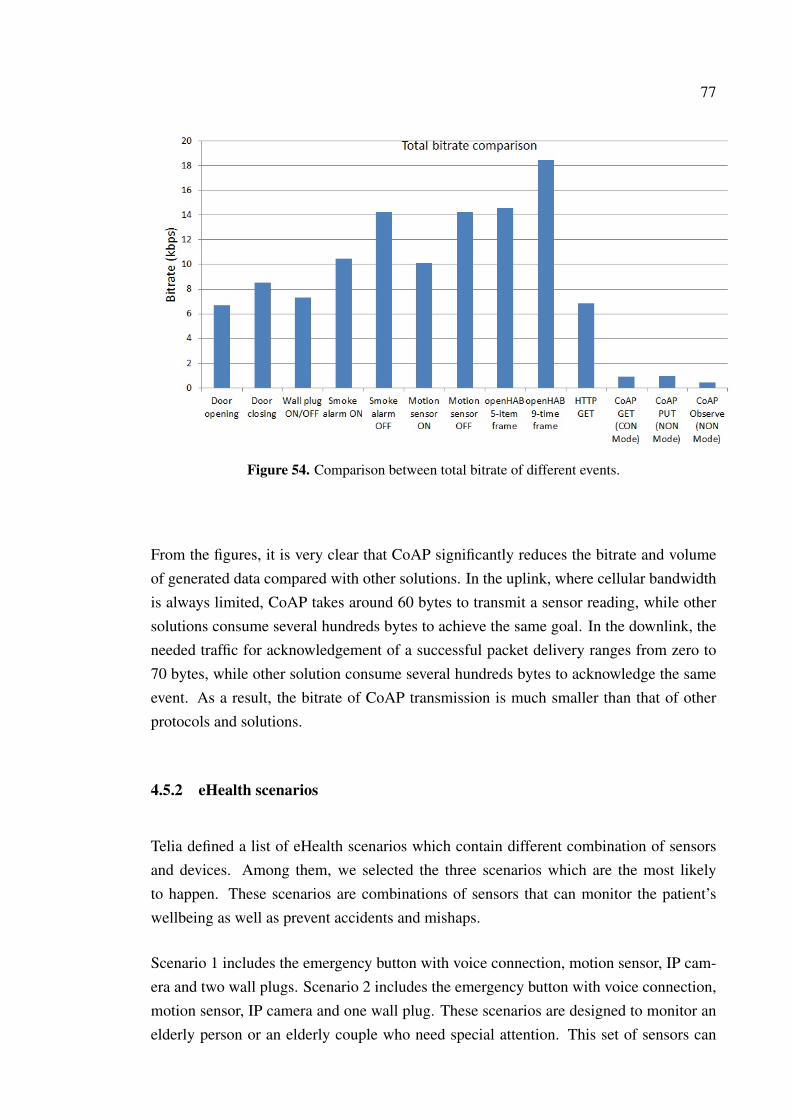
77
Figure 54. Comparison between total bitrate of different events.
From the figures, it is very clear that CoAP significantly reduces the bitrate and volumeof generated data compared with other solutions. In the uplink, where cellular bandwidthis always limited, CoAP takes around 60 bytes to transmit a sensor reading, while othersolutions consume several hundreds bytes to achieve the same goal. In the downlink, theneeded traffic for acknowledgement of a successful packet delivery ranges from zero to70 bytes, while other solution consume several hundreds bytes to acknowledge the sameevent. As a result, the bitrate of CoAP transmission is much smaller than that of otherprotocols and solutions.
4.5.2 eHealth scenarios
Telia defined a list of eHealth scenarios which contain different combination of sensorsand devices. Among them, we selected the three scenarios which are the most likelyto happen. These scenarios are combinations of sensors that can monitor the patient’swellbeing as well as prevent accidents and mishaps.
Scenario 1 includes the emergency button with voice connection, motion sensor, IP cam-era and two wall plugs. Scenario 2 includes the emergency button with voice connection,motion sensor, IP camera and one wall plug. These scenarios are designed to monitor anelderly person or an elderly couple who need special attention. This set of sensors can

78
detect the presence of the person in a particular area of the house, if someone is fallingdown or whether he/she left the house. In case of emergency, the person being monitoredcan interact with the caregivers through voice and video connection.
Meanwhile, scenario 3 contains security alarm (voice connection and emergency button),night alarm (door sensor and motion sensor) and fire alarm. It offers basic monitoringcapabilities for the caregivers to prevent and react to accidents and fire hazards, or toknow if someone left the house in the evening (as described in Section 1.1).
In order to estimate the required bandwidth of a scenario, we have to distinguish betweenseveral cases. In a normal case, the required bandwidth is the sum of some bitrates ofsingle sensor events (the sensors that are triggered). In an extreme case, the requiredbandwidth is the above sum plus some bitrates from periodic traffic patterns mentionedin table 15. In the worst case, the required bandwidth is the sum of all bitrates of singlesensor events and all bitrates from periodic traffic patterns. This method applies to boththe uplink and downlink channel. The following table 22 details the worst case requiredbandwidth of scenarios 1,2 and 3.
Table 22. The required bandwidth in the worst case of scenario 1,2 and 3 .
Scenario Uplink (kbps) Downlink (kbps) Total (kbps)Scenario 1 243.38 64.392 307.772
Scenario 2 238.292 62.152 300.444
Scenario 3 77.632 54.304 131.936
If IReHMo is deployed in parallel with the Telia eHealth installation or IReHMo replacesthe existing Telia eHealth installation, it will deliver the sensor data more efficiently interms of bitrate and volume of data generated. As a result, the required bandwidth is re-duced; the reduction rate depends on the scenarios and the application layer protocol usedin IReHMo. From section 4.5.1, it is very clear that CoAP outperforms HTTP in terms ofbitrate and volume of generated data when they are used in the IReHMo architecture. Theworst case required bandwidth is estimated as the sum of bitrate from voice connection,video connection, sensor data and periodic traffic (if any). This method applies to both theuplink and downlink channel. In this case the bitrate from sensor data is The followingtable 23 details the worst case required bandwidth of scenarios 1,2 and 3 when IReHMoand CoAP are used.

79
Table 23. The required bandwidth in the worst case of scenario 1,2 and 3 when IReHMo andCoAP are used .
Scenario Uplink (kbps) Downlink (kbps) Total (kbps)Scenario 1 205.924 47.896 253.82
Scenario 2 205.452 47.416 252.868
Scenario 3 33.888 33.92 67.808
The saving when IReHMo and CoAP are used is listed in the following table 24:
Table 24. The saving of IReHMo and CoAP compared with Telia installation.
ScenarioUplink/Downlink
Telia eHealthinstallation(kbps)
IReHMo andCoAP (kbps)
Saving
Scenario 1 Uplink 243.38 205.924 15.38 %
Downlink 64.392 47.896 25.61 %
Total 307.772 253.82 17.52 %
Scenario 2 Uplink 238.292 205.452 13.78 %
Downlink 62.152 47.416 23.70 %
Total 300.444 252.868 15.83 %
Scenario 3 Uplink 77.632 33.888 56.34 %
Downlink 54.304 33.92 37.53 %
Total 131.936 67.808 48.60 %
4.5.3 Experiments measuring the available upload and download bandwidth
Several experiments have been carried out to estimate the available upload and downloadbandwidth of the cellular network in real life conditions. To estimate the bandwidth, weset up a testbed to upload and download files multiple times, then we computed the aver-age speed. Several file sizes were used to maintain the data transmission and measure thebandwidth. To measure the download bandwidth, files are downloaded from the WAMPserver. To measure the upload bandwidth, files are uploaded to the FTP server using wput

80
18. Both the WAMP server and the FTP server are hosted in a computer at Skellefteå. Thetestbed is described in the following figure 55:
Figure 55. The set up of the experiments.
To cross-check the results, the Ookla speedtest19 was used to determine the cellular band-width. The app sends and receives traffic to a nearby server, in this case the server isin Stockholm. All the experiments were repeated several times at each measurement lo-cation. Three measurement locations were selected in Västerbotten region: Renström,Gumboda (Norsjö kommun) and Bastuträsk. The reason for selecting these locations isexplained in Section 4.5.4. In all the three locations, the upload and download bandwidthfrom our own testbed is slightly lower than that from the Ookla speedtest. The averagebandwidths are listed in the following table 25, with units in Mbps:
Table 25. The average available bandwidth.
LocationOokla uploadspeedtest
File uploadOokla downloadspeedtest
File download
Renström 2.67 2.19 - 2.30 13.96 11.68 - 12.96
Gumboda 3.61 2.13 - 2.42 8.27 8.15 - 9.22
Bastuträsk 2.45 1.35 - 1.82 15.362 12.20 - 13.26
18wput - http://wput.sourceforge.net/19Ookla speedtest - http://www.speedtest.net/
81
These bandwidths mentioned above can be considered as single user bandwidth. More fo-cus is on the uplink channel, since the uplink in cellular data network always has smallercapacity and bandwidth than the downlink. Furthermore, in all the implementations dis-cussed so far, the uplink transfers much more data than the downlink, which mainlytransfers the acknowledgement data; therefore the uplink is likely the bottleneck of thesystems. Based on the performance of the cellular network as well as information fromTelia, it is believed that DC-HSPA+ is deployed at the measurement locations. For thistechnology, the upper bound of cell capacity in the uplink is 6.2 Mbps[51]. This numberwill be used in the analysis in the next section
4.5.4 The scalability of the systems
The scalability of the systems depends much on the required bandwidth of each individ-ual system, the number of systems demanded and the availability of the communicationinfrastructure in a particular area. The combination of these factors decides the maximumand the optimal number of systems to be deployed.
For this analysis, the worst case scenario is assumed: at the same time, all sensors aretriggered and generate traffic. We target areas that are covered by moderate to low qualitycellular network, where the network capacity is the bottle neck of the system. The networkcapacity is retrieved from Telia coverage map 20. In this map, Telia differentiated betweenoutdoor and in-car coverage. The analysis takes into consideration the in-car coverage,since it resembles the actual indoor signal strength, which is used by 3G and 4G modems.For both outdoor and in-car coverage, Telia offered different network categories, namelyEDGE, Turbo-3G, Turbo-3G+, 4G and 4G+. According to Telia, the available downloadbandwidths are 0.2 Mbps, 6 Mbps, 10-32 Mbps, 40 Mbps and 80 Mbps respectively. Theanalysis targets residential areas that are covered by Turbo 3G and Turbo-3G+ network;these areas are mainly remote communities sparsely located in the countryside.
We have identified several villages/residential areas that are covered by Turbo-3G anTurbo-3G+. The list of villages/residential areas is in Appendix 3. The locations wherethe experiment took place (Renström, Gumboda (Norsjö kommun) and Bastuträsk) areincluded in the list as well. These villages/residential areas are those covered in purplein the figure 56. Among them, we have selected nine villages/residential areas for moredetailed analysis. They have diverse population, ranging from several dozens to severalhundreds. They all share the same network of Turbo-3G and Turbo-3G+.
20Telia coverage map - http://www.telia.se/privat/international/coverage/

82
Figure 56. Coverage map from Telia website.
To determine the number of Telia systems in demand, it is assumed that Telia offers theremote health monitoring systems to all elderly people over 65 years old. Statistics fromthe Swedish Västerbotten county shows that at least 25 % of the population are 65 yearsand older. The population information of the targeted communities in Västerbotten countyis retrieved from Swedish Central Statistics Bureau. For the analysis, it is assumed that25% of the population in the targeted villages/residential areas is using eHealth serviceform Telia.
The following table 26 details the targeted villages/residential areas, together with thepopulations. Among the number of Telia installations provided according to the popu-lation, we took into account four different combinations of the three scenarios: 100 %scenario 1, 30 % scenario 1 - 40 % scenario 2 - 30 % scenario 3, 10 % scenario 1 - 20% scenario 2 - 70 % scenario 3 and 100 % scenario 3. The uplink required bandwidth istaken into consideration here, as uplink is the bottleneck when the Telia eHealth installa-tion is scaled up. It clearly showed that different scenario combinations required differentbandwidths.

83
Table 26. Scalability analysis of the Telia installation.
Name PopulationScenario 1(Mbps)
30-40-30(Mbps)
10-20-70(Mbps)
Scenario 3(Mbps)
Availablebandwidth
Gumboda 55 3.34 2.63 1.73 1.06 6.2 Mbps
Renström 67 4.07 3.20 2.11 1.30 6.2 Mbps
Långträsk 109 6.63 5.22 3.44 2.11 6.2 Mbps
Moskosel 232 14.11 11.11 7.32 4.50 6.2 Mbps
Bastuträsk 392 23.85 18.77 12.38 7.60 6.2 Mbps
Backe 599 36.44 28.69 18.91 11.62 6.2 Mbps
Jörn 797 48.49 38.18 25.17 15.46 6.2 Mbps
Junsele 800 48.67 38.32 25.26 15.52 6.2 Mbps
Boliden 1566 95.28 75.01 49.46 30.39 6.2 Mbps
If IReHMo is deployed in parallel with the Telia eHealth installation or IReHMo replacesthe existing Telia eHealth installation, it will deliver the sensor data more efficiently interms of bitrate and volume of data generated. As a result, the required bandwidth isreduced; the reduction rate depends on the scenarios and the application layer protocolused in IReHMo. The following table 27 details the same targeted villages/residentialareas, the populations and different combinations of scenarios when IReHMo is deployedin conjunction with CoAP for transmitting sensor data. Again, the uplink bandwidth istaken into consideration as it is the bottleneck of the system when IReHMo is scaled up.
Table 27. Reduced bandwidth requirement by IReHMo and CoAP.
Name Population Scenario 1(Mbps)
30-40-30(Mbps)
10-20-70(Mbps)
Scenario 3(Mbps)
Availablebandwidth
Gumboda 55 2.83 2.11 1.17 0.46 6.2 MbpsRenström 67 3.44 2.58 1.43 0.56 6.2 MbpsLångträsk 109 5.61 4.19 2.32 0.92 6.2 MbpsMoskosel 232 11.94 8.93 4.95 1.96 6.2 MbpsBastuträsk 392 20.18 15.10 8.36 3.32 6.2 MbpsBacke 599 30.84 23.08 12.78 5.07 6.2 MbpsJörn 797 41.03 30.70 17.01 6.75 6.2 MbpsJunsele 800 41.19 30.82 17.08 6.77 6.2 MbpsBoliden 1566 80.63 60.33 33.43 13.26 6.2 Mbps

84
5 CONCLUSIONS AND FUTURE WORK
The objective of the thesis is to understand the key requirements of a remote health mon-itoring system, specifically in terms of network bandwidth and volume of generated data.Based on these knowledge, the thesis proposed an architecture that efficiently delivershealthcare data to the servers for further processing.
5.1 Conclusion
The thesis has identified several requirements of a remote health monitoring system. As ageneral requirement, the system should be able to support and incorporate several types ofhealthcare and home automation sensors and devices. Furthermore, the system should beable to update occurred events in real-time. In terms of network requirements, the systemis expected to consume low bandwidth, especially upload bandwidth so that it can fit inand scale up in areas where network infrastructure is limited. Furthermore, the volumeof data generated is expected to be small, so that it will not stress the existing networkinfrastructure as well as induce unnecessary costs to users. Finally, the system should beopen and flexible to support several IoT protocols.
The thesis proposed and evaluated an architecture called IReHMo. IReHMo is capableof incorporating several types of home automation sensors and healthcare IoT devices inthe sensing layer. The home gateway layer of IReHMo offers the data pre-processing,filtering and storage to reduce the data transmission in the network. The use of CoAP atthe home gateway significantly reduced the bandwidth requirements and volume of gen-erated data. For a single sensor value, the system consumes several times less bandwidthand traffic compared to the commercial product, the system reduces up to 56% of therequired bandwidth for a remote health monitoring scenario. Finally, the scalability anal-ysis showed that the combination of IReHMo and CoAP make it possible to deploy largernumber of remote health monitoring systems compared to the existing commercial prod-uct. This is of paramount importance in remote rural areas where the network capacity islow and local people have limited access to regular healthcare services.
The thesis has addressed the issue of efficiency, security and sustainability. Better effi-ciency is achieved by reducing the communication network needs (up to 90% volume ofgenerated data for a single sensor event and up to 56% required bandwidth for a health-care scenario). Security is guaranteed by encrypting all healthcare data while sending

85
over public network, using well-defined AES encryption algorithm.
Finally, sustainability is the main concern of the thesis, as it has to make improvementsto the economy, ethics and ecology at the same time. By deploying this IReHMo system,both the patients and the government can significantly reduce expense on healthcare. Thecost of installing and operating IReHMo systems is negligible compared with the cost tohave caregivers visiting patients on a regular basis. The patients feel more comfortableand secure when staying in their own house and receive constant care and monitoring. Asthe system reduces the travelling of both patients and caregivers, the ecology benefits themost since less CO2 is emitted.
5.2 Future work
openHAB is an important part of the home gateway layer of IReHMo architecture. AsopenHAB is being developed constantly, IReHMo can integrate more IoT and home au-tomation protocols. One of the targeted IoT protocols to be incorporated in IReHMo isZigbee, which is widely used in the field of home automation.
Another important improvement of the system is to detect when the connection is dropped.This can be done using periodic message exchange between the CoAP server and itsclients. Due to the small traffic footprint of CoAP, this feature can be implemented with-out significantly increasing the required bandwidth. The frequency of exchanging mes-sage should be configurable, thus reducing the effect of the increased bandwidth as wellas volume of generated data.
The gateway should be able to implement more application layer protocols. So far, onlyHTTP and CoAP is implemented in the gateway. The variety of communication protocolsgives the operators more protocol choices as well as the ability to meet the demand of aparticular network or system. An extension of the IReHMo should include MQTT andAMQP as the application layer protocol between the gateway and the cloud-based servers.
The decision to process raw data at the sensing layer, the gateway or to process the rawdata at the cloud-based servers need to be studied further. Processing the raw data atthe IoT devices has to overcome constrains of the devices themselves such as limitedprocessing, storage and battery resources. We believe that recent advances in mobilecloud computing can be beneficial here. Processing the raw data at the home gatewayreduces the required bandwidth and volume of data generated at the cost of losing context

86
information. Processing all the raw data in the cloud-based servers will result in theholistic and detailed picture of events that has occurred, but the cost of transferring sucha large amount of raw data is immense.
Finally, in case the home gateway is behind a router, network address translation or portforwarding has to be studied and implemented to facilitate the transmission of CoAPpackets to/from the client.

87
REFERENCES
[1] Kristina Noel Katich. Urban climate resilience: a global assessment of city adapta-
tion plans. PhD thesis, Massachusetts Institute of Technology, 2009.
[2] Ian Burton. Report on reports: Our common future: The world commission onenvironment and development. Environment: Science and Policy for Sustainable
Development, 29(5):25–29, 1987.
[3] Smart Aarhus Secretariat. Smart region & smart aarhus.
[4] EKA B Project. Helsinki smart region: Pionnering for europe 2020, June 2014.
[5] Jung-Hoon Lee and M Hancock. Toward a framework for smart cities: A compari-son of seoul, san francisco and amsterdam. Research Paper, Yonsei University and
Stanford University, 2012.
[6] Rudolf Giffinger, Christian Fertner, Hans Kramar, Robert Kalasek, Nataša Pichler-Milanovic, and Evert Meijers. Smart cities-ranking of european medium-sizedcities. Technical report, Vienna University of Technology, 2007.
[7] Andrew Whitmore, Anurag Agarwal, and Li Da Xu. The internet of things - a surveyof topics and trends. Information Systems Frontiers, pages 1–14, 2014.
[8] Luigi Atzori, Antonio Iera, and Giacomo Morabito. The internet of things: A survey.Computer networks, 54(15):2787–2805, 2010.
[9] Gartner says 4.9 billion connected "things" will be in use in 2015, November 2014.
[10] Jim Chase. The evolution of the internet of things, September 2013.
[11] Dave Evans. The internet of things - how the next evolution of the internet is chang-ing everything, April 2011.
[12] Internet of things vs. internet of everything what is the difference, May 2014.
[13] Tuba Bakıcı, Esteve Almirall, and Jonathan Wareham. A smart city initiative: thecase of barcelona. Journal of the Knowledge Economy, 4(2):135–148, 2013.
[14] Giuseppe Piro, Ilaria Cianci, Luigi Alfredo Grieco, Gennaro Boggia, and Pietro Ca-marda. Information centric services in smart cities. Journal of Systems and Software,88:169–188, 2014.

88
[15] Colin Harrison, B Eckman, R Hamilton, Perry Hartswick, Jayant Kalagnanam, Ju-rij Paraszczak, and P Williams. Foundations for smarter cities. IBM Journal of
Research and Development, 54(4):1–16, 2010.
[16] Andrea Caragliu, Chiara Del Bo, and Peter Nijkamp. Smart cities in europe. Journal
of urban technology, 18(2):65–82, 2011.
[17] Amanda Coe, Gilles Paquet, and Jeffrey Roy. E-governance and smart communitiesa social learning challenge. Social Science Computer Review, 19(1):80–93, 2001.
[18] Ari-Veikko Anttiroiko, Pekka Valkama, and Stephen J Bailey. Smart cities in the newservice economy: building platforms for smart services. AI & society, 29(3):323–334, 2014.
[19] 1st Africa and Middle East Conference on Software Engineering (AMECSE 2014),2014.
[20] Alberto Bielsa. Smart city project in salamanca to monitor air quality and urbantraffic, December 2011.
[21] Jiong Jin, J Gubbi, S Marusic, and M Palaniswami. An information framework forcreating a smart city through internet of things. IEEE Internet of Things Journal,1(2):112–121, 2014.
[22] Meng-Shiuan Pan, Chia-Hung Tsai, and Yu-Chee Tseng. The orphan problem inzigbee wireless networks. Mobile Computing, IEEE Transactions on, 8(11):1573–1584, 2009.
[23] Andrea Zanella, Nicola Bui, Angelo P Castellani, Lorenzo Vangelista, and MicheleZorzi. Internet of things for smart cities. IEEE Internet of Things Journal, 2014.
[24] Iordanis Koutsopoulos. Optimal incentive-driven design of participatory sensingsystems. In INFOCOM, 2013 Proceedings IEEE, pages 1402–1410. IEEE, 2013.
[25] Jayavardhana Gubbi, Rajkumar Buyya, Slaven Marusic, and MarimuthuPalaniswami. Internet of things (iot): A vision, architectural elements, and futuredirections. Future Generation Computer Systems, 29(7):1645–1660, 2013.
[26] Asma Elmangoush, Hakan Coskun, Sebastian Wahle, and Thomas Magedanz. De-sign aspects for a reference m2m communication platform for smart cities. In In-
novations in Information Technology (IIT), 2013 9th International Conference on,pages 204–209. IEEE, 2013.

89
[27] Bin Guo, Zhiwen Yu, Xingshe Zhou, and Daqing Zhang. From participatory sensingto mobile crowd sensing. In Pervasive Computing and Communications Workshops
(PERCOM Workshops), 2014 IEEE International Conference on, pages 593–598.IEEE, 2014.
[28] Haakon Riiser, Håkon S Bergsaker, Paul Vigmostad, Pål Halvorsen, and CarstenGriwodz. A comparison of quality scheduling in commercial adaptive http streamingsolutions on a 3g network. In Proceedings of the 4th Workshop on Mobile Video,pages 25–30. ACM, 2012.
[29] Yan Zhang, Nirwan Ansari, Mingquan Wu, and Heather Yu. On wide area networkoptimization. Communications Surveys & Tutorials, IEEE, 14(4):1090–1113, 2012.
[30] 3gpp ts 22.368 v11.5.0 - service requirements for machine-type communications,September 2012.
[31] F Ghavimi and Hsiao-Hwa Chen. M2m communications in 3gpp lte/lte-a networks:Architectures, service requirements, challenges and applications.
[32] Christoph Ide, Bjoern Dusza, Markus Putzke, Christian Muller, and Christian Wiet-feld. Influence of m2m communication on the physical resource utilization of lte. InWireless Telecommunications Symposium (WTS), 2012, pages 1–6. IEEE, 2012.
[33] Stefan Parkvall, Anders Furuskar, and Erik Dahlman. Evolution of lte toward imt-advanced. Communications Magazine, IEEE, 49(2):84–91, 2011.
[34] Monowar Hasan, Ekram Hossain, and Dusit Niyato. Random access for machine-to-machine communication in lte-advanced networks: issues and approaches. Com-
munications Magazine, IEEE, 51(6):86–93, 2013.
[35] Mikhail Gerasimenko, Vitaly Petrov, Olga Galinina, Sergey Andreev, and YevgeniKoucheryavy. Impact of machine-type communications on energy and delay per-formance of random access channel in lte-advanced. Transactions on Emerging
Telecommunications Technologies, 24(4):366–377, 2013.
[36] Maged NK Boulos, Steve Wheeler, Carlos Tavares, and Ray Jones. How smart-phones are changing the face of mobile and participatory healthcare: an overview,with example from ecaalyx. Biomedical engineering online, 10(1):24, 2011.
[37] David Hasenfratz, Olga Saukh, Silvan Sturzenegger, and Lothar Thiele. Participa-tory air pollution monitoring using smartphones. Mobile Sensing, 2012.

90
[38] Ellie D Hondt, Matthias Stevens, and An Jacobs. Participatory noise mappingworks! an evaluation of participatory sensing as an alternative to standard tech-niques for environmental monitoring. Pervasive and Mobile Computing, 9(5):681–694, 2013.
[39] Hengchang Liu, Shaohan Hu, Wei Zheng, Zhiheng Xie, Shiguang Wang, Pan Hui,and Tarek Abdelzaher. Efficient 3g budget utilization in mobile participatory sens-ing applications. In INFOCOM, 2013 Proceedings IEEE, pages 1411–1419. IEEE,2013.
[40] Roy Fielding, Jim Gettys, Jeffrey Mogul, Henrik Frystyk, Larry Masinter, PaulLeach, and Tim Berners-Lee. Hypertext transfer protocol–http/1.1, 1999.
[41] Zach Shelby, Klaus Hartke, and Carsten Bormann. The constrained applicationprotocol (coap). 2014.
[42] Application Protocol CoAP. Coap: An application protocol for billions of tiny in-ternet nodes. 2012.
[43] Klaus Hartke. Observing resources in coap. 2014.
[44] Arlen Nipper Andy Stanford-Clark. Mqtt version 3.1.1, October 2014.
[45] Paolo Patierno. Iot protocols landscape, Jun 2014.
[46] Niccolò De Caro, Walter Colitti, Kris Steenhaut, Giuseppe Mangino, and GianlucaReali. Comparison of two lightweight protocols for smartphone-based sensing. InCommunications and Vehicular Technology in the Benelux (SCVT), 2013 IEEE 20th
Symposium on, pages 1–6. IEEE, 2013.
[47] Tapio Levä, Oleksiy Mazhelis, and Henna Suomi. Comparing the cost-efficiency ofcoap and http in web of things applications. Decision Support Systems, 63:23–38,2014.
[48] Insteon. Insteon - whitepaper: Compared, 2013.
[49] M Fengou, Georgios Mantas, Dimitrios Lymberopoulos, Nikos Komninos, SpyrosFengos, and Nikolaos Lazarou. A new framework architecture for next generatione-health services. Biomedical and Health Informatics, IEEE Journal of, 17(1):9–18,2013.
[50] Stylianos Karapantazis and Fotini-Niovi Pavlidou. Voip: A comprehensive surveyon a promising technology. Computer Networks, 53(12):2050–2090, 2009.
[51] Mikko Valtonen. The bitrate limits of hspa+ enhanced uplink, March 2010.
Appendix 1. openHAB installation in Windows
Step 1: Download driver for Z-wave controller In this thesis I use Aeon Z-Stick USBController. Driver can be found in this page: http://aeotec.com/z-wave-usb-stick/1358-z-wave-drivers.html
Step 2: Take note of the USB port that the USB controller is connected to, for exampleCOM4.
Step 3: Instal Java if not already installed.
Step 4: Download openHAB runtime core, then unzip it to to where it is intended to berunning from, for example C:/openHAB
Step 5: Download openHAB addon to another folder in the machine, then unzip it. Copythe necessary bundles to the "addons" directory of openHAB. Each bundle is a .jar file
Step 6: Create a personal configuration file and name it openhab.cfg (The best practice isto make a copy of the default config file and make necessary changes, keep both files)
Step 7: Config Z-wave binding: zwave:port=COM4 and zwave:masterController=true
Step 8: Start openHAB by running start.bat in the folder where openHAB is installed.
Step 9: For using HABmin, a web administration console for openHAB, the bundle HAB-min should be copied to the "addons" directory of openHAB. HABmin is available fromhttps://github.com/cdjackson/HABmin/tree/master/addons
(continues)

Appendix 2. openHAB installation in Linux
Step 1: Build the Linux kernel: Run the command insmod /lib/modules/<kernel-version/kernel/drivers/usb/serial/usbserial.kothen insmod cp210x.ko
Step 2: Take note of the USB port that the USB controller is connected to, using thiscommand dmesg | grep tty, usually the port is ttyUSB0
Step 3: Instal Java if not already installed.
Step 4: Download openHAB runtime core, then unzip it to to where it is intended to berunning from, for example /opt/openHAB
Step 5: Download openHAB addon to another folder in the machine, then unzip it. Copythe necessary bundles to the "addons" directory of openHAB. Each bundle is a .jar file
Step 6: Create a personal configuration file and name it openhab.cfg (The best practice isto make a copy of the default config file and make necessary changes, keep both files)
Step 7: Config Z-wave binding: zwave:port=ttyUSB0 and zwave:masterController=true
Step 8: Start openHAB by running start.sh in the folder where openHAB is installed
Step 9: For using HABmin, a web administration console for openHAB, the bundle HAB-min should be copied to the "addons" directory of openHAB. HABmin is available fromhttps://github.com/cdjackson/HABmin/tree/master/addons
(continues)