Embed Size (px)
Citation preview

Mass Spectrometry Signal Calibration for Protein Quantitation
Cambridge Isotope Laboratories, Inc.isotope.com
PROTEOMICS
IntroductionQuantitative analysis of proteins and peptides by mass spectrometry is an important and growing area of biomedical research. Immunoassays have been the primary tool for protein quantitation. However, immunoassays are far from a perfect solution and may no longer meet the basic research needs in protein detection and quantitation. Recent efforts to overcome the limitations of immunoassays have shown that mass spectrometry assays, when combined with stable isotope-labeled internal standards, careful analyte calibration, quality control, and in some cases enrichment, can overcome the limitations of immunoassays. This is promising because it suggests that protein biochemists may no longer need to rely on the slow and expensive development of immunoassays for their target protein of interest. Instead, we can rely on mass spectrometry to deliver the sensitivity and specificity needed for the next generation of quantitative protein measurements at a greatly reduced cost. While the strengths of mass spectrometry are clear, these are still complicated measurements to perform.
Mass spectrometry has a long history of making quantitative measurements and has even been used for the quantitation of peptides for greater than three decades. However, in the proteomics field, we tend to use the term “quantitation” broadly. Frequently, methods described in papers that measure a signal intensity for peptides between two or more samples or conditions tend to be be labeled as quantitative. Are these data quantitative? Maybe, but not necessarily.
Here we will review some of the fundamentals of quantitative analysis and revisit what types of validation are required to assess whether a measurement is quantitative. We will review a few common strategies for the use of stable isotope-labeled internal standards in proteomics and how these data are used to calibrate the mass spectrometer response. We will approach this from a purely theoretical basis and enable the reader to assess whether the respective strengths and caveats should alter their chosen methodology depending on the intended application. Finally, we hope to correct a couple of misconceptions in the community about the use of stable isotope-labeled internal standards and what makes a mass spectrometry assay quantitative.
What Is the Difference BetweenQuantitative and Differential Analysis?What makes any assay quantitative? To make a measurement quantitative, there must be a change in signal that reflects the change in quantity. To assess whether we get an expected change in signal with a change in quantity, we use standards of “known” quantity. We place quotations around known because the accuracy of any quantitative measurement is only going to be as good as the accuracy of the standards.
An illustration of a quantitative calibration curve can be seen in Figure 1. In this figure, the X-axis is the known quantity of standard samples and the Y-axis is the measured signal intensity. All measurements when plotted in this manner should have a range where there is a linear response between the measured signal intensity and the quantity of the target analyte. There will be a point at the lower end of this curve where the response in signal is not reflective of the quantity. This point is known as the lower limit of quantitation (LLOQ). There is also a similar point at the upper end of the linear dynamic range where the detector begins to saturate and no longer respond linearly (upper limit of quantitation or ULOQ). Quantitation should be performed in the linear dynamic range or at least in a range where there is a change in signal that reflects the change in quantity.
While it may be possible to obtain relative quantities without the use of a standard curve, it is impossible to assess whether all points are within the linear dynamic range of the instrument
(continued)
Figure 1. Illustration of a simplistic calibration curve.

without standards. Imagine two measurements, one below the LLOQ and one above. While there could be a statistically significant difference in intensity between the two measurements, the magnitude of the differences will not necessarily reflect a quantitative difference. Thus, without validation that the intensities are within the quantitative range, the measurements are limited to being differential and should not be considered quantitative.
Why Use a Stable Isotope-Labeled Internal Standard?For the quantitation of compounds in complex matrices the use of internal standards minimizes errors associated with sample isolation and preparation because the compound of interest is measured relative to the added internal standard. A standard is chosen that will mimic the measured compound during the sample isolation and preparation, therefore will account for any possible losses.
The measurement of the ion-current ratio between the target peptide and an internal standard with a mass spectrometer significantly reduces errors associated with the ion source and inlet systems because “like molecules” will experience similar biases during the sample preparation and measurement. The use of stable isotopically labeled internal standards and isotope ratios further minimizes these errors and reduces the effect of long term drifts by using a standard, which is structurally identical to the peptide of interest. Therefore, when used with mass spectrometric detection, stable isotopically labeled proteins or peptides are a nearly ideal internal standard.
When performing quantitation with a stable isotope-labeled internal standard, the basic rules of quantitative analysis remain the same. The one difference is that instead of measuring a raw measured signal intensity, the intensity reported is a intensity normalized to the internal standard – essentially an ion current ratio. Thus, one divides the target signal by the intensity of the signal from the respective stable isotope-labeled internal standard
(continued)
Figure 2. Illustration of a calibration curve using a stable isotope-labeled internal standard. The curve is identical to the one shown in Figure 1 except the Y-axis has been changed from a RAW signal intensity to a normalized intensity ratio.
(Figure 2). The use of the internal standard will not necessarily alter the quantitative accuracy or dynamic range but it should almost certainly improve the quantitative precision by minimizing sample preparation “noise.”
In the example shown in Figure 2, the internal standard is used to normalize the signal intensity and improve the precision of the measurement. We want to make it clear that the stable isotope-labeled internal standard is not necessarily what makes the assay quantitative. The quantitation is still made relative to unlabeled standards. We do not need to know the amount of the stable isotope labeled internal standard particularly well – we just need to make sure that the same amount of the internal standard is added to every sample and standard.
Single-Point CalibrationArguably the most common method used in proteomics for calibrating the instrument response is the use of a single-point calibration. In these experiments, a known quantity of a stable isotope-labeled peptide is added to a sample and then the signal of the target analyte is measured relative to the internal standard. The measured ratio (R) between the unlabeled peptide and internal standard is assumed to be proportional to the mole ratio between the two respective isotopomers
R≈na / nb Equation 1
where na and nb are the moles of the unlabeled and stable isotope-labeled internal standard respectively. Assuming this relationship is linear, we can write a simple linear equation describing the relationship between the isotopomer mole ratio and the measured signal ratio in the mass spectrometer.
R=k·na / nb+Rb Equation 2
In this case, k is a response factor that can be used as a factor to correct differences in the response between the labeled and unlabeled peptide. Likewise, Rb is the measured background ratio during the injection of a blank that contains only the stable isotope-labeled internal standard and no endogenous peptide.
Figure 3. Theoretical effect of the measured mass spectrometer signal intensity between a peptide that contains only natural abundance isotopes and the identical peptide sequence that is enriched with 8 x 13C atoms at 99.9 atom percent excess (APE).
PROTEOMICS

Figure 4. Theoretical calibration curve using known peptide standards. In this example, the amount of the peptide standard is plotted on the x-axis and the ratio of the unlabeled peptide relative to the respective stable isotope-labeled internal standard is used as the signal intensity. It is important that the amount of the stable isotope-labeled internal standard is the same across all samples but knowing the exact quantity of the internal standard is not essential. The two lowest abundance standards are not above the lower limit of quantitation.
Figure 5. Theoretical calibration curves using known protein standards. In these examples, the amount of the standard is plotted on the x-axis and the ratio of the unlabeled peptide relative to the respective stable isotope-labeled internal standard is used as the signal intensity. In the black example, the protein standards are in a sample matrix without any endogenous protein. The blue example is a standard curve that adds the standards to the sample matrix where there is an endogenous amount of the target protein. The red point is the signal measured from the endogenous matrix when no additional protein standard is spiked into the sample. The slope of the two lines should be indistinguishable.
In these experiments it is assumed that k = 1 and Rb = 0 and standards are not necessarily run to confirm these assumptions over the range of the quantitative measurement. Given these assumptions and the “known” quantity of the stable isotope-labeled internal standard, then Equation 2 is rearranged to
na=R·nb Equation 3
to solve for the absolute quantity of endogenous peptide.
This approach is used throughout the proteomics literature for “absolute” quantitation. However, is the assumption valid that k = 1 and Rb = 0? Should we expect equal quantities of unlabeled and stable isotope-enriched peptides to respond similarly in the mass spectrometer? The answer is, of course, it depends.
One main challenge that needs to be accounted for in the use of a simple single-point calibration using 13C-labeled peptides is the effect on the isotope distribution (Figure 3). Consider the peptide sequence YAGILDC ICAT FK where the cysteine residue is labeled with either an isotope-coded affinity tag (ICAT) reagent that contains natural abundance isotopes (light version) or nine of the carbons replaced with 13C-enriched atoms at 99.9 APE (heavy version). If the two peptides are mixed at a perfect 1-to-1 mole ratio and the monoisotopic isotope peak is used for each of the two isotopomers the expected signal would not be 1-to-1 (Figure 3). In fact, assuming perfect and equal ionization between these two isotopomers, we would expect that the 13C-labeled version of the peptide would actually be more intense by almost 10%.
The signal intensity of the mono isotopic mass of a stable isotope-labeled peptide should always be more intense than the unlabeled equivalent and the magnitude of the difference will depend on the elemental composition of the molecule, the number of labeled atoms, the type of labeled atom and the enrichment of the isotope-labeled starting material.
So what is the cause of this difference in signal intensity? This difference is caused because the monoisotopic peak is nowa greater portion of the total isotope distribution in the heavy peptide relative to the light peptide. In the right side of Figure 3, it is obvious that the difference in intensity between the M+0 and the M+1 isotope is very different between the light and the heavy isotopomer. Interestingly, this effect is worse with 13C labeling than 15N, 18O or D. This effect is because we are in essence removing nine carbons from the contribution to the M+1 isotope peak. At low resolution this is less of a problem because without resolution of the individual isotope peaks, the entire distribution is used and, in that case, the sum of the distributions are equal. Thus, in using high resolution mass spectrometry, Equation 3 cannot be used for absolute quantitation without applying a correction factor for the difference in the fraction of the monoisotopic peak of the total isotope distribution between the light and the heavy peptide. This correction factor can be computed theoretically for each light and heavy peptide or can be bypassed using a standard curve of known unlabeled peptide quantities (see below).
(continued)
PROTEOMICS
There are other limitations in the use of a single-point calibration with a stable isotope-labeled peptide standard. One is the lack of day-to-day reproducibility in the quantitative measurement (Hoofnagle et al. Clin. Chem). However, another major limitation is that with a single point, it is impossible to determine whether the signal intensities from both the light and the heavy peptide are both within the linear quantitative range of the mass spectrometer (Figure 1). As mentioned previously, the inability to confirm the measurements are within the linear range generally means the measurement should simply be considered differential and not quantitative. This being said, the simplicity of a single-point calibration still makes it an extremely popular and powerful strategy. However, it is important for users to be aware of the potential limitations in the method and / or data reported using this approach.
Using a Peptide Standard CurveAn improvement to the use of a single-point calibration is to use a peptide standard curve. In this case, a constant amount of a stable isotope-labeled internal standard peptide is added to several unlabeled peptide standards of known quantity that span the range of quantities that need to be quantified. The ratio of the target peptide signal is measured relative to the stable isotope-labeled internal standard (R) and plotted relative to the moles from the unlabeled peptide standards (na ). An example of a theoretical standard curve is shown in Figure 4. The linear portion of the curve follows the equation:
R=k·na+Rb Equation 4
Where k is the slope of the standard curve and Rb is the background ratio from the injection of a blank containing only internal standard peptide. Unlike the single point calibration described above, the use of a peptide standard curve confirms that the measurement is within a linear range of quantitation.
A key advantage of the use of a peptide standard curve is that there is less demand on the chemical purity and isotope enrichment of the standards. As long as the same amount of internal standard is added to each standard and sample, the k in Equation 4 will correct for this appropriately. While it is helpful to know the absolute quantity of the stable isotope-labeled internal standard added to each sample, it is not necessary. Thus, it is more important to have peptide standards at high purity and absolute known quantities for the unlabeled peptide than it is for the stable isotope-labeled peptides. While the use of a peptide standard curve offers advantages over a single point calibration, it still has limitations. The main thing that the user needs to consider is that the instrument response is calibrated relative to peptide standards and, therefore, it is important to be careful about making claims about protein quantities. While the quantitation of peptides can be made very accurate and precise, these measurements do not account for incomplete recovery of peptides during the sample preparation and digestion of the protein sample.
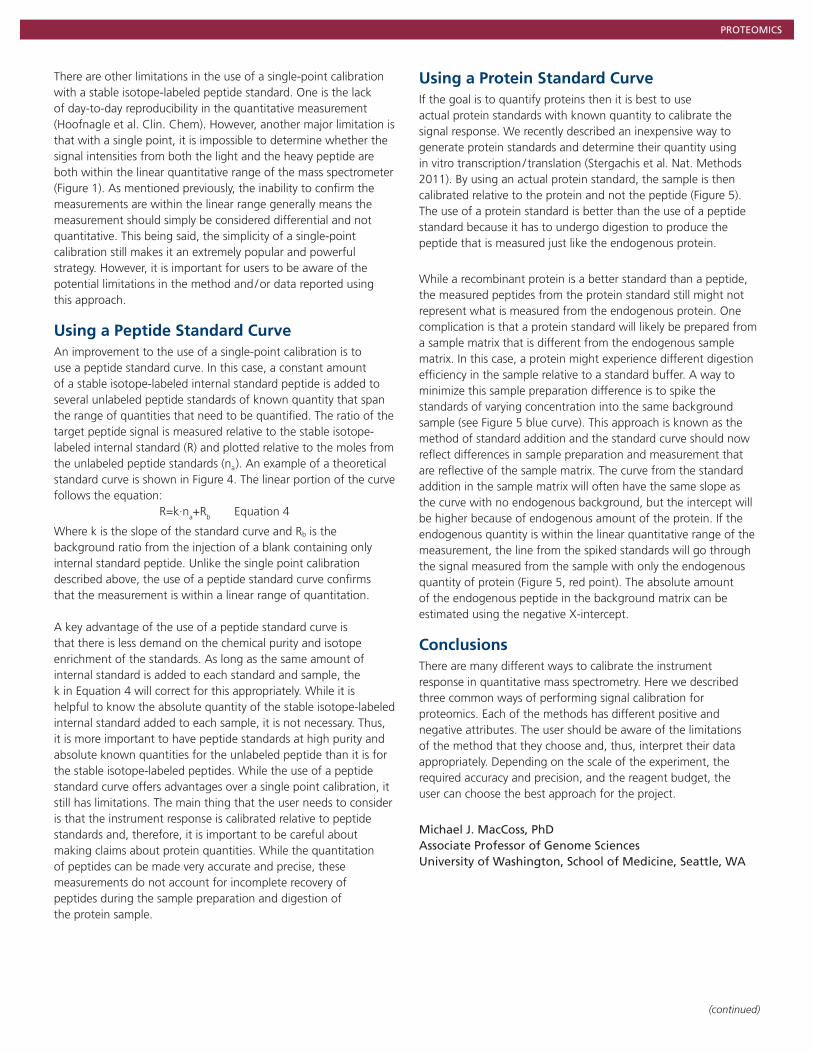
Using a Protein Standard CurveIf the goal is to quantify proteins then it is best to use actual protein standards with known quantity to calibrate the signal response. We recently described an inexpensive way to generate protein standards and determine their quantity using in vitro transcription / translation (Stergachis et al. Nat. Methods 2011). By using an actual protein standard, the sample is then calibrated relative to the protein and not the peptide (Figure 5). The use of a protein standard is better than the use of a peptide standard because it has to undergo digestion to produce the peptide that is measured just like the endogenous protein.
While a recombinant protein is a better standard than a peptide, the measured peptides from the protein standard still might not represent what is measured from the endogenous protein. One complication is that a protein standard will likely be prepared from a sample matrix that is different from the endogenous sample matrix. In this case, a protein might experience different digestion efficiency in the sample relative to a standard buffer. A way to minimize this sample preparation difference is to spike the standards of varying concentration into the same background sample (see Figure 5 blue curve). This approach is known as the method of standard addition and the standard curve should now reflect differences in sample preparation and measurement that are reflective of the sample matrix. The curve from the standard addition in the sample matrix will often have the same slope as the curve with no endogenous background, but the intercept will be higher because of endogenous amount of the protein. If the endogenous quantity is within the linear quantitative range of the measurement, the line from the spiked standards will go through the signal measured from the sample with only the endogenous quantity of protein (Figure 5, red point). The absolute amount of the endogenous peptide in the background matrix can be estimated using the negative X-intercept.
ConclusionsThere are many different ways to calibrate the instrument response in quantitative mass spectrometry. Here we described three common ways of performing signal calibration for proteomics. Each of the methods has different positive and negative attributes. The user should be aware of the limitations of the method that they choose and, thus, interpret their data appropriately. Depending on the scale of the experiment, the required accuracy and precision, and the reagent budget, the user can choose the best approach for the project.
Michael J. MacCoss, PhDAssociate Professor of Genome SciencesUniversity of Washington, School of Medicine, Seattle, WA
(continued)
PROTEOMICS

Useful Software Tools for the Analysis and Management of Mass Spectrometry Data
Skyline – http://skyline.maccosslab.orgSkyline is a freely available and open-source Windows client application for Selected Reaction Monitoring (SRM) / Multiple Reaction Monitoring (MRM) and Full-Scan (MS1 and MS / MS) quantitative methods and analyzing the resulting mass spectrometer data. It makes use of cutting-edge technologies for creating and iteratively refining targeted methods for large-scale proteomics studies.
Panorama – http://panoramaweb.orgPanorama is a freely available, open-source repository server application for targeted proteomics assays that integrates into a Skyline proteomics workflow. PanoramaWeb is a public Panorama server hosted at the University of Washington where laboratories and organizations can own free projects. You can request a project on this server to find out what Panorama has to offer, without having to set up and maintain your own server. You will be able to explore all the available features in Panorama, and be given administrative rights to your project so that you can set up folders and configure permissions. Panorama can also be installed by laboratories and organizations on their own servers.
Topograph – http://topograph.maccosslab.orgTopograph is a Windows application designed to analyze data in protein turnover experiments. Protein turnover experiments involve modifying an organism’s diet or growth media to include a stable isotope-labeled amino acid, and then measuring the rate at which the label appears in peptides. CHORUS – http://chorusproject.orgCHORUS is an effort to provide a free, professionally developed community solution for the storage, sharing and analysis of mass spectrometry data. This is currently a collaborative partnership between the University of Pittsburgh, University of Washington, Infoclinika and Amazon Web Services. The application provides a “Google Docs” type interface optimized for mass spectrometry data. Data can be uploaded and kept private, shared with a group of collaborators, or made entirely public. Tools are available to visualize and analyze the data directly on the cloud.
PROTEOMICS
Cambridge Isotope Laboratories, Inc., 3 Highwood Drive, Tewksbury, MA 01876 USA
tel: +1.978.749.8000 fax: +1.978.749.2768 1.800.322.1174 (North America) www.isotope.com PRT_MACCOSS5/13 Supersedes all previously published literature
References
Hoofnagle et al. 2010. Clin Chem, 56, 1561-70.
Stergachis, A.B.; MacLean, B.; Lee, K.; Stamatoyannopoulo, J.A.; MacCoss, M.J. 2011. Rapid empirical discovery of optimal peptides for targeted proteomics. Nature Methods, 8, 1041-1043. 10.1038 /nmeth.1770.