Embed Size (px)
Citation preview

University of South CarolinaScholar Commons
Theses and Dissertations
2016
Mass Spectrometry-Based Protein Profiling AndInvestigations of TGF-ß1-Induced Epithelial-Mesenchymal Transition Signatures In NamruMurine Mammary Gland Epithelial CellsMatsepo RamaboliUniversity of South Carolina
Follow this and additional works at: https://scholarcommons.sc.edu/etd
Part of the Chemistry Commons
This Open Access Dissertation is brought to you by Scholar Commons. It has been accepted for inclusion in Theses and Dissertations by an authorizedadministrator of Scholar Commons. For more information, please contact [email protected].
Recommended CitationRamaboli, M.(2016). Mass Spectrometry-Based Protein Profiling And Investigations of TGF-ß1-Induced Epithelial-Mesenchymal TransitionSignatures In Namru Murine Mammary Gland Epithelial Cells. (Doctoral dissertation). Retrieved from https://scholarcommons.sc.edu/etd/3763
MASS SPECTROMETRY-BASED PROTEIN PROFILING AND INVESTIGATIONS OF
TGF-1-INDUCED EPITHELIAL-MESENCHYMAL TRANSITION SIGNATURES IN
NAMRU MURINE MAMMARY GLAND EPITHELIAL CELLS
by
Matsepo Ramaboli
Bachelor of Science
National University of Lesotho, 1997
Master of Science
University of Free State, 2002
Submitted in Partial Fulfillment of the Requirements
For the Degree of Doctor of Philosophy in
Chemistry
College of Arts and Sciences
University of South Carolina
2016
Accepted by:
Qian Wang, Major Professor
Caryn Outten, Committee Member
Guoan Wang, Committee Member
Stephen Morgan, Committee Member
Lacy Ford, Senior Vice Provost and Dean of Graduate Studies

ii
© Copyright by Matsepo Ramaboli, 2016
All Rights Reserved.

iii
DEDICATION
The work in this PhD thesis is dedicated to my late parents Mr. Shesha Booi Hlena and
Mrs ‘Masekete Hlena who taught me the value of good education. They spent most of
their meager resources paying for quality education of their children in prestigious
schools. They were known in our village community of Khanyane in the Leribe disctrict
in Lesotho for their dedication in investing in their children’s future. They themselves
hardly completed high school but they made sure their children acquired college and
graduate education.
Mom and dad, I would not be where I am if it were not for your commitment and
the vision you had for our family.
May their souls rest in eternal peace!

iv
ACKNOWLEDGEMENTS
I would like to express my sincere gratitude to my academic advisor Professor Qian
Wang who accepted me as a graduate student in his lab. Without his scholarly guidance,
supervision and persistent help, this dissertation would not have been possible.
I am deeply indebted to my committee members, Professor Stephen Morgan,
Professor Caryn Outten and Professor Guoan Wang, for their mentorship and great
contributions towards my candidacy and dissertation defense.
I thank all Wang lab members past and present for their support throughout this
study. Among them, Dr. Gary Horvath, Dr. Yi Chen, Dr. Elizabeth Balizan, Dr. Xinrui
Duan, Dr. Nikki Sitasuwan, Dr. Honglin Li, Dr. Jittima Luckanagul, Dr. Hong Guan,
Enoch Adogla, and Napat Tandikul stand out as people from whom I learned various
research and leadership skills.
My hearty regards go to the faculty and staff of the department of chemistry and
biochemistry, staff of the international student services, and various on-, and off-campus
organizations, and all my friends and family for their empowerment and support.
I am also indebted to various organizations for their financial support; the foreign
Fulbright scholarship under the administration of the Institute of International Education;
Graduate assistantship through a grant in Professor Wang’s lab, and Graduate
assistantship from Walker Institute of International Studies (African Studies program).

v
ABSTRACT
Breast cancer is the second-most common cancer and the second-leading cause of cancer-
related deaths in women. Despite advances in cancer early detection, prevention and
treatment, breast cancer is still a major health challenge due to low survival caused by
breast cancer metastasis. This warrants critical attention and intervention. From the
proteomic standpoint, a protein-based multiplex system that provides large array of
informative signals for cancer identification and prognosis is still limited. In this
dissertation work, we developed two mass spectrometry-based strategies involving
chemical biology tools for rapid protein fingerprinting of breast cancer cell lines, and for
probing the O-linked N-acetylglucosamine (O-GlcNAc) proteome in transforming growth
factor-beta (TGF-) induced epithelial-mesenchymal transition (EMT), a process that
initiates metastasis. Investigation of O-GlcNAc EMT proteomics is critical in
understanding how aberrant O-GlcNAc post-translational modification (PTM) promotes
cancer invasion and metastasis, as well as in the identification of early stage therapeutic
targets. Until now the role of O-GlcNAc PTM in TGF--induced EMT is unknown.
In Chapter 2, a novel ‘one-step cell processing’ method was developed as a
prerequisite to rapid spectral profiling of mammalian cells using Matrix-Assisted Laser
Desorption Ionization Time-of-Flight mass spectrometry (MALDI-TOF MS). Upon
analysis of the mass spectral data of breast cancer cell lines with pattern recognition
methods, discrimination between metastatic and non-metastatic cell lines was
vi
accomplished, demonstrating the potential of MALDI-MS profiling in breast cancer
diagnosis.
Chapter 3 reports a cleavable azide-reactive dibenzocyclooctyne-disulphide
agarose-based beaded resin in Copper-free Click chemistry-based affinity enrichment of
O-GlcNAc proteome from azido-GlcNAc labeled cellular extracts, that enabled the
global O-GlcNAc proteomic profiling by shortgun proteomics with liquid
chromatography-tandem mass spectrometry identification and label-free quantification.
From TGF--induced EMT in MNuMG cells 196 proteins were identified. 125 of these
were putative O-GlcNAc proteins, 75% of which have been previously identified among
O-GlcNAc affinity enrichment samples. Downstream bioinformatics analyses of the O-
GlcNAc proteome data were performed using Ingenuity Pathway Analysis (IPA)
software. In silico protein-protein interactions revealed a regulatory network for
metastasis, while the most significantly represented metabolic and signaling pathways
included glycolysis and several TGF- non-canonical pathways, respectively. A
metastatic regulatory network that features core regulators β-catenin and cyclin-D1 both
of which are regulated by O-GlcNAc transferase supports published study that shows that
“O-GlcNAcylation Plays Essential Role in Breast Cancer Metastasis,” has led us to
hypothesize that TGF- signaling cooperates with O-GlcNAc signaling in promoting
EMT, invasion and metastasis, pending O-GlcNAc site-mapping and validation of the
proteomic data.

vii
TABLE OF CONTENTS
DEDICATION ....................................................................................................................... iii
ACKNOWLEDGEMENTS ........................................................................................................ iv
ABSTRACT ............................................................................................................................v
LIST OF TABLES .................................................................................................................. ix
LIST OF FIGURES ...................................................................................................................x
LIST OF ABBREVIATIONS ................................................................................................... xiv
CHAPTER 1: LITERATURE REVIEW ........................................................................................1
1.1 BACKGROUND .......................................................................................................1
1.2 EMT AND CANCER ................................................................................................5
1.3 EMT AND TGF- ..................................................................................................7
1.4 N-ACETYLGLUCOSAMINE POST-TRANSLATIONAL MODIFICATION .......................11
1.5 O-GLCNACYLATION AND METABOLISM IN BREAST CANCER .............................14
1.6 MS-BASED PROTEOMICS .....................................................................................19
1.7 MS INSTRUMENTATION FOR PROTEOMIC PROFILING ...........................................25
1.8 SPECIFIC AIMS AND RESEARCH QUESTIONS ........................................................30
REFERENCES .............................................................................................................33
CHAPTER 2: A COMPREHENSIVE AND INFORMATIVE METHODOLOGY FOR MALDI-TOF MS
PROFILING AND DISCRIMINATION OF BREAST CANCER CELLS ..................................48
2.1 ABSTRACT ...........................................................................................................48
2.2 INTRODUCTION.....................................................................................................49

viii
2.3 EXPERIMENTAL SECTION .....................................................................................53
2.4 RESULTS AND DISCUSSION ..................................................................................59
2.5 CONCLUSIONS .....................................................................................................97
REFERENCES .............................................................................................................99
CHAPTER 3: AFFINITY ENRICHMENT AND LC-MS/MS ANALYSES OF O-LINKED
N-ACETYLGLUCOSAMINYL PROTEOME ....................................................................105
3.1 ABSTRACT .........................................................................................................105
3.2 INTRODUCTION ..................................................................................................106
3.3 EXPERIMENTAL SECTION ...................................................................................114
3.4 RESULTS AND DISCUSSION ................................................................................131
3.5 CONCLUSIONS ...................................................................................................169
REFERENCES ...........................................................................................................172
APPENDIX A – PROTEIN IDENTIFICATION AND LABEL-FREE QUANTIFICATION DATA .........178
ix
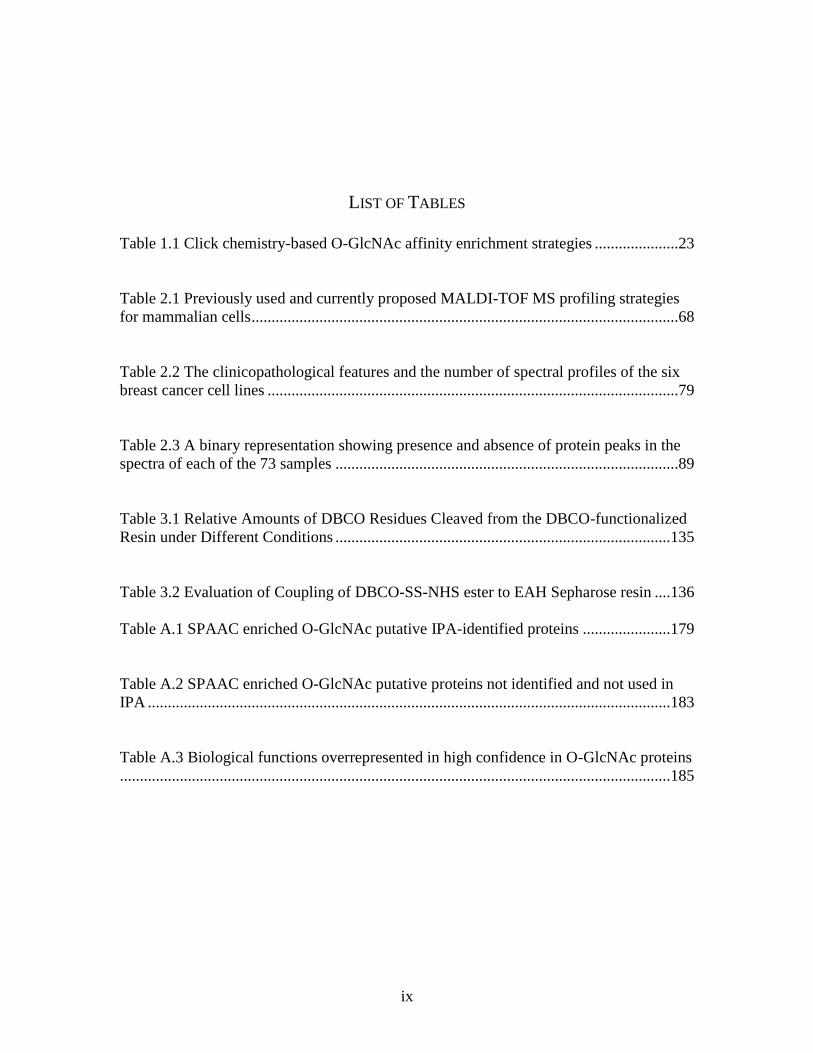
LIST OF TABLES
Table 1.1 Click chemistry-based O-GlcNAc affinity enrichment strategies .....................23
Table 2.1 Previously used and currently proposed MALDI-TOF MS profiling strategies
for mammalian cells ...........................................................................................................68
Table 2.2 The clinicopathological features and the number of spectral profiles of the six
breast cancer cell lines .......................................................................................................79
Table 2.3 A binary representation showing presence and absence of protein peaks in the
spectra of each of the 73 samples ......................................................................................89
Table 3.1 Relative Amounts of DBCO Residues Cleaved from the DBCO-functionalized
Resin under Different Conditions ....................................................................................135
Table 3.2 Evaluation of Coupling of DBCO-SS-NHS ester to EAH Sepharose resin ....136
Table A.1 SPAAC enriched O-GlcNAc putative IPA-identified proteins ......................179
Table A.2 SPAAC enriched O-GlcNAc putative proteins not identified and not used in
IPA ...................................................................................................................................183
Table A.3 Biological functions overrepresented in high confidence in O-GlcNAc proteins
..........................................................................................................................................185

x
LIST OF FIGURES
Figure 1.1 Illustration of different stages of cancer progression in the breast, showing that
primary tumor cells acquire invasive behavior and become migratory through EMT ........2
Figure 1.2 Schematic illustration of the canonical TGF-/Smad signaling showing that
the effect of TGF-, if any, on the O-GlcNAc modification is unknown ...........................9
Figure 1.3 Schematic illustration of the hexose biosynthetic pathway showing flow of
metabolites from other pathways especially glycolysis and the salvage pathways ...........13
Figure 1.4 Illustration of the relationship between O-GlcNAcylation and TGF-
signaling, constructed from connections made from findings and reviews .......................17
Figure 1.5 Diagram showing the route of ions and signal in the LTQ Orbitrap MS .........28
Figure 1.6 Schematic of the MALDI-TOF-MS analysis ...................................................31
Figure 2.1 A Schematic workflow in MALDI-MS profiling .............................................52
Figure 2.2 Figure 2.2 The intial spectra of the cell lines NIH3T3 (blue), BHK (red) and
HeLa (green) ......................................................................................................................62
Figure 2.3 Spectra of NIH3T3 cells generated after rinsing cells with a mixture of
chloroform and water (1:1, v/v) .........................................................................................63
Figure 2.4 Spectra of needle- and syringe-homogenized, DHB-rinsed and DHAP-spotted
NIH3T3 samples showing peaks above m/z 16000 ...........................................................65
Figure 2.5 Effect on the cell spectra of the five different cell-rinsing matrix solutions ....66
Figure 2.6 Effect of cell concentration on the spectra: average peak numbers and standard
deviations from spectra generated from different dilutions of NIH3T3 cells ....................72

xi
Figure 2.7 Mass spectra showing no effect from treatment of NIH3T3 with PMSF
protease inhibitor ...............................................................................................................74
Figure 2.8 Spectra showing effect of short-term stability when incubated on ice prior to
MALDI analysis.................................................................................................................75
Figure 2.9 Light microscope images of MCF-7 (A, B and C) and MDA-MB231 (D, E and
F) cells from three consecutive passages ...........................................................................81
Figure 2.10 Effect of the time of rinsing cells with extraction/lysis matrix solution on the
spectra of MCF-7 and MDA-MB231 ................................................................................82
Figure 2.11 The 73 MALDI-TOF MS spectra (replicates) of six human breast cancer cell
lines ....................................................................................................................................84
Figure 2.12 Principal component analyses and classification of 3 sets of data using the in-
house data analytic pipeline ...............................................................................................87
Figure 2.13 Projection of the PC scores for the 73 samples following PCA using
BioNumerics software .......................................................................................................95
Figure 2.14 Protein expression profiling and hierarchical clustering of breast cancer cell
lines ....................................................................................................................................96
Figure 3.1 Schematic representation of the combined Cu-free Click chemistry-based O-
GlcNAc affinity enrichment and shotgun proteomics approach for O-GlcNAc LC-
MS/MS glycoproteomic profiling ....................................................................................112
Figure 3.2 Reaction scheme for the O-GlcNAc glycoproteomic profiling showing the
preparation of the “click-able” and cleavable bead probe and its application in affinity
enrichment of O-GlcNAc PTM .......................................................................................113
Figure 3.3 Reaction scheme for evaluation of the “click-able” and cleavable bead probe
using UV-vis spectrophotometry and MALDI-TOF MS.................................................116

xii
Figure 3.4 Reaction scheme for bioorthorgonal dye labeling of azido- and alkyne-
modified proteins employing a given panel of fluorophores A-D ...................................121
Figure 3.5 MALDI evaluation of the “click-able” and cleavable bead probe .................133
Figure 3.6 UV-Vis spectrophotometric evaluation of the coupling of the DBCO-SS-NHS
ester to raw beads to produce the affinity bead probe .....................................................138
Figure 3.7 Fluorescence imaging of O-GlcNAc proteins (green) and newly synthesized
proteins (blue) in double-metabolically-labeled fixed NMuMG cells .............................139
Figure 3.8 Fluorescence imaging of O-GlcNAc proteins (green) in metabolically-labeled
fixed NIH3T3 cells ..........................................................................................................141
Figure 3.9 Morphological changes and detection of Snail ..............................................143
Figure 3.10 In-gel fluorescence detection of O-GlcNAz-modified proteins ...................145
Figure 3.11 Evaluation of the RIPA wash buffer against an in-house bead-washing
protocol ............................................................................................................................148
Figure 3.12 Evaluation and comparison of effectiveness of the two bead-washing
protocols ...........................................................................................................................150
Figure 3.13 SDS-PAGE analysis following O-GlcNAc affinity enrichment ..................151
Figure 3.14 Summed intensities of identified proteins from raw and “contaminats-
filtered” data generated from five samples with modified or unmodified beads, with or
without metabolic labeling in NMuMG cells induced or non-induced with TGF-β1 .....153
Figure 3.15 Global identification of potentially O-GlcNAc proteins in TGF-β1-induced
EMT .................................................................................................................................155
Figure 3.16 Subcellular localization of the identified proteins ........................................157

xiii
Figure 3.17 Cellular metabolic and signaling pathways responding to TGF-β1 induction
in NMuMG cells ..............................................................................................................159
Figure 3.18 Ingenuity Pathway Analysis was used to extract and display nodes overlaid
with expression levels for proteins belonging to the top regulatory network enriched in
the experimental data .......................................................................................................161
Figure 3.19 Potentially O-GlcNAc proteins in TGF-β-induced EMT .............................164

xiv
LIST OF ABBREVIATIONS
AC4GalNAz ....................................................... Peracetylated N-azidoacetylgalactosamine
Acetyl CoA ............................................................................................ Acetyl coenzyme A
ACN ................................................................................................................... Acetonitrile
ACTB .................................................................................................................... Beta-actin
ADP.................................................................................................. Adenosine diphosphate
BRCA1 ...................................................................................... Breast cancer 1, early onset
BSA ................................................................................................... Bovine serum albumin
BTF3 .......................................................................................... Basic transcription factor 3
CAV1 .................................................................................................................... Caveolin1
CCNN1 ................................................................................................................. Cyclin D1
CCT ........................................................................................ Chaperonin-containing TCP1
CD44 ......................................................................................... Cluster of differentiation 44
CTNNB1 ........................................................................................................... Beta-catenin
CuAAC ...................................................... Copper-catalyzed Azide Alkyne Cycloaddition
DBCO ................................................................................................... Dibenzocyclooctyne
DBCO-SS-NHS .................................Dibenzocyclooctyne disulphide-N-succinimide ester
dH2O ........................................................................................................... Deionized water
DHAP ............................................................................................. Dihydroxyacetophenone
DNA .................................................................................................. Deoxyribonucleic acid
DTT .................................................................................................................. Dithiothreitol
EAH Sepharose 4B ..................................................... Epoxy-activated Sepharose 4B resin
xv
EEF2 ................................................................ Eukaryotic Translation Elongation Factor 2
EGFR ............................................................................ Epidermal Growth Factor Receptor
eIF3 ..................................................................... Eukaryotic Translation Initiation Factor 3
EMT ................................................................................Epithelial-mesenchymal transition
ER ............................................................................................................ Estrogen Receptor
ERBB2/HER2 ............................................... Human Epidermal Growth Factor Receptor 2
EZR ............................................................................................................................... Ezrin
FITC ............................................................................................ Fluorescein isothiocyanate
Fruc-6-P .............................................................................................. Fructose-6-phosphate
GalNAc ........................................................................ O-linked-N-acetyl-D-galactosamine
GalNAz ..................................................................... O-linked-N-azidoacetylgalactosamine
GAP......................................................................................... Glyceraldehyde-6-phosphate
Glc ............................................................................................................................ Glucose
Glc-6-P ............................................................................................ D-Glucose-6-phosphate
GlcN-6-P ................................................................................. D-Glucosamine-6-phosphate
GlcNAc-1-P .............................................................. N-acetyl-D-glucosamine-1-phosphate
GlcNAc-6-P .............................................................. N-acetyl-D-glucosamine-6-phosphate
Gln................................................................................................................ D-Glucosamine
GO .................................................................................................................. Gene ontology
HBP ........................................................................................Hexose Biosynthetic Pathway
HMGB1..................................................................................... High Mobility Group Box 1
HNRNP .............................................................................. Heterogenous ribonucleoprotein
HSP ........................................................................................................ Heat Shock Protein
IgG .......................................................................................................... Immunoglobulin G
IPA ........................................................................................... Ingenuity Pathway Analysis

xvi
K-Rasv12- ..............................................................................K-Ras glycine to valine mutant
KRT............................................................................................................................Keratin
LC-MS/MS .......................................... Liquid chromatography tandem mass spectrometry
LTQ ................................................................................................... Linear trap quadrupole
MALDI-TOF MS ...................................................................................................................
...................... Matrix-assisted laser desorption/ionization-time of flight mass spectrometry
MMP-9 .........................................................................................Matrix metallopeptidase 9
MST1R .......................................................................... Macrophage-stimulating 1 receptor
NADPH .......................................... Reduced nicotinamide adenine dinucleotide phosphate
NMuMG ............................................................ Namru Murine Mammary Gland Epithelial
OGA ................................................................. O-linked-beta-N-acetyl-D-glucosaminidase
O-GlcNAc ...................................................................... O-linked-N-acetyl-D-glucosamine
OGT ............... UDP-GlcNAc:protein-O-linked-beta-N-acetyl-D-glucosaminyl transferase
P120 ................................................................................................................. Delta-catenin
PEP ...................................................................................................... Phosphoenolpyruvate
PGR .....................................................................................................Progesterone receptor
PIK3CA......................................................Phosphatidylinositol-4,5-bisphosphate 3-kinase
PRKAA2 ................................... 5’-AMP-activated protein kinase catalytic subunit alpha 2
PSAP .................................................................................................................... Prosaposin
RIPA ................................................................................. Radioimmunoprecipitation assay
SDS .................................................................................................. Sodium dodecyl sulfate
SEER .............................................................. Surveillance, Epidemiology and End Results
Smad ....................................................................................... Sma and Mad related protein
SPAAC ......................................................... Strain-promoted Azide Alkyne Cycloaddition
TRI ................................................................................................ TGF- Receptor Type I
xvii
TRII .............................................................................................. TGF- Receptor Type II
TBST .............................................................................. Tris-buffered saline and Tween 20
TBTA ..................................................... Tris[(1-benzyl-1H-1,2,3-triazol-4-yl)mthyl]amine
TFA ........................................................................................................ Trifluoroacetic acid
TGF- ............................................................................. Transforming Growth Factor Beta
UDP-GalNAc ............................................. Uridine diphosphate N-acetyl-D-galactosamine
UDP-GlcNAc ............................................... Uridine diphosphate N-acetyl-D-glucosamine
UPGMA ........................................... Unweighted pair group method with arithmetic mean
UTP .......................................................................................................Uridine triphosphate
UV-Vis ..................................................................................................... Ultraviolet-visible
VIM ........................................................................................................................ Vimentin
YBX1/YB1 ..................................................................................... Y box binding protein 1

1
CHAPTER 1
LITERATURE REVIEW
1.1 BACKGROUND
1.1.1 Significance and Rationale
Breast cancer is the second-most common cancer and the second leading cause of cancer-
related deaths in women, with over 200,000 new cases and over 40,000 deaths estimated
in USA in 20151. The current USA SEER records show that survival from cancer has
improved a great deal in the last 20 years due partly to advances in cancer prevention,
early detection and treatment1. However, the 5-year relative survival during 2005-2011
was still remarkably low for metastatic (25%) breast tumors and high for localized (98%)
and regional (84%) tumors2. This difference could be attributed to the fact that primary
tumors can be controlled by early detection and adjuvant treatment while control of
metastatic tumors, as accomplished by chemotherapy, is associated with complications3.
These alarming records suggest that breast cancer is not only a public health problem, but
that breast cancer metastasis is the prominent cause of breast cancer mortality and thus
necessitates critical attention and intervention4.
Breast cancer arises primarily from genetic alterations in the epithelium of the
mammary gland ducts and lobules.5 Breast cancer lesions in these glandular regions may
start as benign and progress through in situ and invasive and ultimately become
metastatic if not diagnosed accurately and treated efficiently3, 6-7 (Figure 1.1). Breast
cancer metastasis is a multi-step process4. It begins with switching of epithelial cells of

2
Figure 1.1 Illustration of different stages of progression of breast cancers of epithelial
origin, showing that primary tumor cells acquire invasive behavior and become migratory
through EMT. If cancer is not detected and treated effectively the migratory cells invade
the surrounding stroma and gain access to the blood vessels by intravasation, and
eventually get spread to secondary sites through metastasis. This schematic was adopted
from a review of J. P. Thiery6. The breast anatomy was adopted from the webpage of C.
Nordqvist8.

3
the primary tumors to migratory and invasive forms that are able to invade the local
tumor stroma and the lymphatic system. These motile cancer cells then enter the blood
and get transported to distant sites where they switch back to epithelial and undergo
survival and proliferation6. Gene expression profiling studies have shown that the
metastatic potential of cancer is revealed very early at clonal stage, and that the
expression signature for metastatic recurrence resembles that of epithelial-mesenchymal
transition (EMT).9 This suggests that early diagnosis is invaluable and that deciphering of
EMT signatures could lead to discovery of efficient drug targets for breast cancer.
1.1.2 Breast Cancer and Molecular Profiling
Breast cancer is a collection of distinct neoplastic diseases that are complex and diverse
in their pathological, clinical and molecular features10. The heterogeneous behavior of
breast cancer has been characterized through molecular profiling using complementary
DNA microarrays.11 On the basis of patterns of gene expression and chromosomal
aberrations, breast cancer has been classified into five molecularly and clinically distinct
subtypes12. These are luminal A, luminal B, HER2-overexpressing, basal-like and normal
breast tissue-like. Luminal A and B tumors are estrogen receptor-positive (ER+) and are
associated with good prognosis. HER2-overexpressing and basal-like tumors have worst
clinical outcome. HER2-overexpressing tumors are ER+ while basal-like ones are
negative to ER, PR and HER213. The gene expression pattern defining each subtype is the
same for the in situ carcinoma and its concomitant invasive form while the
aggressiveness due to chromosomal alterations changes with disease progression towards
metastatic14-15. These insights about breast cancer have been unraveled through molecular
profiling, an approach that has revolutionized the understanding of tumor biology11.
4
Molecular profiling involves high-throughput analysis of gene expression and
chromosomal aberrations on a global scale. It produces massive high dimensional data
that requires further analysis by multivariate statistics and advanced computational
methods16. Compared to the routine histological and immunological techniques that
measure few variables known apriori, molecular profiling analyzes many previously
unknown variables17, thus it can reveal new information about breast cancer18. Through
molecular profiling, combinations of gene alterations in the form of gene signatures with
specificity regarding diagnosis, prognosis and prediction to therapeutic response have
been deduced.19 Some representative examples include MammaPrint prognostic test
(70-gene signature),20-21 CINSARC prognostic signature for sarcomas (67-gene
signature), Oncotype DX prognostic kit (16-gene signature),22 and Baylor College 92-
gene signature predictive of response to Docetaxel in breast cancer. Among them,
MammaPrint and Oncotype DX are the only ones that have been clinically validated.
Several benefits of the gene signatures that include the understanding of tumor
biology and pathology, subtyping of cancer and development of clinical diagnostic,
prognostic, and predictive tests have been recognized.11 Of importance is the fact that
while the propensity for metastasis and its recurrence could be predetermined and
progressively acquired, respectively23, as well as assessed using genetic tests, the
therapeutic response is the result of interaction of cancer cells with the stroma and other
underlying tissues, and would be best predicted using functional analyses24-25. Therefore,
with the intent to develop molecular personalized treatments, proteins rather than DNA or
RNA are the suitable targets for therapeutic response17. Proteomic profiling of breast
cancer cells using high-throughput MS technologies is expected to reveal protein level

5
expression of different genes, from which proteomic signatures and disease biomarkers
can be deduced. Specifically, proteomic profiling of EMT, a process that resembles
metastatic recurrence by gene expression9, could impact early diagnosis strategies and
development of efficient therapeutic targets for metastatic breast cancer.
1.2 EMT AND CANCER
EMT is a developmental process in which epithelial cells are transformed biochemically
and phenotypically to a migratory form that detaches from the basement membrane26.
EMT plays a role in cellular changes occurring in embryogenesis, tissue fibrosis and
tumorigenesis27. One the one hand EMT contributes to tissue development, wound
healing and homeostasis26, while on the under hand, under certain conditions it promotes
malignancy6. In cancer, specifically, EMT is responsible for dissociation and migration of
tumor cells from primary tumors, and invasion of surrounding tissues leading to
metastasis27. EMT is highly regulated transcriptionally, post-transcriptionally,
translationally, and post-translationally28. The transcriptional program that drives EMT
involves activities of several transcription factors of different families29. Evidence of
regulation by PTMs other than phosphorylation, such as O-GlcNAc that has bearing on
physiological conditions of the cell, is still emerging30. During EMT, a distinct set of
genes is upregulated or down-regulated and the corresponding gene products (RNA,
Protein) may serve as EMT markers or be included in typical EMT signatures31.
Investigation of potential cancer-related EMT protein markers and signatures are the
focus of this thesis.
6
Several studies and reviews have described what happens to cells during EMT.
Briefly, cells disassemble the epithelial intercellular junctions (Figure 1.1) and repress
expression of junctional proteins. Concomitantly, cells upregulate expression of
mesenchymal proteins and ECM metalloproteases, which promote cell invasion.
Predominantly, loss of transmembrane adherence protein of epithelial cells, E-cadherin,
that is often detected during cancer progression, is a characteristic feature of EMT29. This
feature is also a marker for tumor cell invasion6. In addition, the genetic switch from
epithelial to mesenchymal is accompanied by transformation in cellular morphology and
reorganization of the actin cytoskeleton. Specifically, the actin protein changes
structurally from cortical architecture to stress fibers associated with focal adhesion
complex resulting in enhanced ability to migrate32. In some tumors, EMT provides cancer
cells with the ability to dissociate, degrade the ECM, traverse the basal membrane and
invade the surrounding stroma33. Clinically the EMT molecular hallmarks that include
downregulation of E-cadherin, upregulation of mesenchymal genes and remodeling of
extra-cellular matrix are thought to contribute to poor prognosis in many cancers
including breast cancers29.
A holistic view about EMT is that it involves a co-operation between changes in
the cell shape, adherence and migration, resistance to apoptosis-inducing stimuli and
metabolic pathways34. These processes are regulated via signaling pathways that might
have common stimuli or characterized by crosstalk resulting in expression of
characteristic sets of genes31. Thus, systems-based approaches are considered suitable in
understanding molecular dynamics within EMT29. A typical genome-wide gene
expression approach such as a proteomic study would identify and quantify proteins

7
associated with these changes35. It is envisaged that precise knowledge of such changes in
cancer cells, as revealed by probing the proteome, may lead to characterization of new
candidate biomarkers and therapeutic targets34.
Various researchers have demonstrated that gene ontology and protein-protein
interaction networks enable classification and visualization of distinct features of EMT
from mass spectrometry-identified proteins34, 36-37. Biarc and coworkers observed protein
level structural features of EMT in the form of differentially expressed functional groups
of proteins, where each functional group was referred to as ‘EMT signature’ because of
similarity of expression from two signals, mutant K-Rasv12, and TGF- both of which
induced EMT in the same cell line34. The functional classes of proteins differentially
expressed included ECM proteins, cell adhesion and intercellular junctional proteins,
cytoskeletal proteins, degradation, translation and metabolic machineries. Similarly,
Vergara and co-authors, obtained EMT-associated proteins from proteomic analyses of
non-mesenchymal and mesenchymal breast cancer cellular models37. Protein-protein
interaction networks revealed signaling pathways that regulate EMT including MAPK,
STAT, Src, NF-κB and RhoA. Interestingly, several studies as reviewed elsewhere4, 38,
have shown that TGF- can trigger many of these pathways that regulate EMT, hence our
interest in investigating its possible cooperation with protein O-GlcNAc PTM as
influenced by cellular metabolic changes.
1.3 EMT AND TGF-
TGF- signaling pathway that is triggered by TGF- is recognized as the classical and
key contributor to cancer progression6, 39. TGF- is a prototype of a large family of

8
growth and differentiation cytokines, the TGF- superfamily, whose members regulate a
wide variety of cellular processes in different tissue and cell types40-41. TGF- itself
participates in major cellular processes such as proliferation, differentiation, migration
and apoptosis42. As a potent inducer of EMT, TGF- occurs in high levels in many kinds
of tumors and its levels are often correlated to high invasion and onset of metastasis43. Of
importance, also is the fact that TGF- signaling has antagonistic effects between early
and late tumor stages. Both effects have been demonstrated in vitro in mammary
epithelial cellular models and many cancer cell lines44, and confirmed through in vivo
studies, involving TGF- treatment. In early stages of cancer, TGF- acts as a tumor
suppressor by inhibiting cell proliferation and inducing apoptosis, whereas in later stages
of cancer, it promotes tumorigenesis by stimulating EMT, angiogenesis, immune
response escape, stemness, invasion and metastasis45.
TGF-/Smad signaling has been well studied and widely reviewed43, 46-49. Briefly,
TGF- initiates its signals of multifunctional effects by binding to type II serine-
threonine kinase receptor (TRII), thus causing a heteromeric complex formation of this
receptor with type I kinase receptor (TRI), resulting in trans-phosphorylation and
activation of both receptors (Figure 1.2). From TRI, different signaling cascades will be
initiated depending on whether serine-threonine kinase or tyrosine kinase of the receptor
is activated. In canonical TGF- signaling, represented on Figure 1.2, the activated kinase
activity of TRI propagates the signal by phosphorylating serine-threonine residues of
the Receptor-regulated Smads (R-Smads), Smad2 and Smad3. The activated R-Smads
form heteromeric complex with Smad4 (Co-Smad), leading to translocation of the Smad

9
Figure 1.2 Schematic of the canonical TGF-/Smad signaling showing that the effect of
TGF-, if any, on the O-GlcNAc modification is unknown. The illustration was adopted
from a review of C. Heldin et al.57

10
complex into the nucleus where the Smad proteins modulate the transcription of TGF-
target genes, mainly those encoding Snail proteins and other EMT transcriptional
regulators. In Smad signaling, these EMT regulators aid the heteromeric Smad complex
in DNA promoter recognition and binding.
In non-canonical TGF- signaling, TGF- activates various non-Smad signaling
effectors that produce responses that support EMT program50. These include Ras-Erk
MAP kinase pathway, that mediates growth stimulation; p38 MAP kinase pathway, that
promotes apoptosis; JNK MAP kinase pathway, that modulates phosphorylation of
Smad3 thus enhancing Smad signaling50; mTOR kinase pathway that promotes increase
in cell size and protein synthesis thus supporting cell motility and invasion51; PI3K/Akt
pathway that sequesters Smad3 thus inhibiting antiproliferative effect of Smad352; RhoA
pathway that mediates disassembly of tight junctions53; Integrin-Paxillin, that promotes
focal adhesion formation as adherence junctions disassemble54. In addition, TGF-
signaling can activate other signaling pathways such as Ras and Notch signaling
pathways55. Notch cooperates with hypoxia to regulate Snail transcription factors and
support tumorigenic EMT56.
Mechanistically, TGF- activates complex transcriptional networks to establish
EMT57. The components of the heteromeric Smad complex have low affinity for DNA
and therefore, require interaction with and co-activation by transcriptional co-factors58,
some of which are regulated by O-GlcNAcylation, the PTM under investigation in this
thesis work. The sequential co-activation of the heteromeric co-Smad complex and its
transcriptional effects has been extensively reviewed. However, hardly any reviews show

11
the detailed regulation of this co-activation by PTMs such as O-GlcNAcylation in the
EMT literature. Park et al. have demonstrated how the O-GlcNAc modification of Snail1
regulates its transcriptional activities and its phosphorylation59. Certainly, though Snail1
is one of the major regulators of EMT, it is not the only O-GlcNAc regulated
transcriptional co-factor of the heteromeric co-Smad complex. The extent of O-
GlcNAcylation of the heteromeric co-Smad complex transcriptional co-factors and
various TGF- signaling molecules, as well as interplay between the O-GlcNAc and
phosphorylation modifications in this context, have to be explored in order to understand
how aberrant metabolic changes influence EMT, and possibly to demonstrate if inhibition
of such metabolic changes can inhibit EMT, invasion and metastatic spread34.
1.4 N-ACETYLGLUCOSAMINE POSTTRANSLATIONAL MODIFICATION (PTM)
Research on O-GlcNAcylation in breast cancer has gained interest since the discovery
about five years ago that global GlcNAcylation levels are associated with breast cancer
formation and metastasis60. Unlike the classical N-linked and O-linked glycosylation, O-
GlcNAcylation is a PTM in which a monosaccharide N-acetylglucosamine (GlcNAc) is
attached in -O-linkage to Serine and Threonine hydroxyl groups of nucleocytoplasmic
proteins61-62. It has no consensus motif and it is abundant and reversible and occurs in
multicellular eukaryotes63. It is similar to phosphorylation but different from the
traditional N-, and O-linked glycosylation64-65. Both phosphorylation and O-
GlcNAcylation are dynamic in their response to biological stimulus and widespread
among regulatory and signaling proteins66. Different functional classes of proteins
including transcriptional and translational machinery, degradation proteins, cytoskeletal
and signaling proteins are modified and regulated by phosphorylation and O-

12
GlcNAcylation67-69. Both PTMs modify same proteins and compete for the same Serine
and Threonine sites of proteins, where their effect is reciprocal and is characterized by a
‘yin-yang’ relationship70-71. Each PTM has two recycling enzymes, one that attaches the
modification (i.e. kinase and OGT), and the other that removes the modification (i.e.
phosphatase and O-GlcNAcase)72-73. These enzymes and their target proteins are in close
proximity since they are colocalized thus allowing for dynamic effect to take place63.
However, the enzymes responsible for N-, and O-linked glycosylation are located in
different cellular compartments (Golgi and ER versus lumen of exocytic and endocytic
organelles), thus making dynamic response unlikely63.
Despite its resemblance of phosphorylation, O-GlcNAcylation is distinct in that it
is directly associated with the nutritional and energy status of the cell74. It is considered a
nutrient sensor because of its responsiveness to the nutrient state of the cell that is
coupled with modulation of function of target proteins making them respond
appropriately to extracellular stimuli75. From the external sources including glucose and
glucosamine, O-GlcNAc is made available for post-translational modification through the
hexosamine biosynthetic pathway (HBP)76 (Figure 1.3). This pathway is linked to
glycolysis during the rate-limiting step in which Fructose-6-phosphate is converted in the
presence of glutamine to Glucosamine-6-phosphate by GFAT77. HBP ultimately produces
UDP-GlcNAc, the substrate for modification of serine and threonine residues of proteins
by OGT enzyme. Aside from glycolysis, several other metabolic pathways are linked to
HBP, hence UDP-GlcNAc is synthesized from several metabolites including glutamine,
acetyl-coenzyme A, uridine and ATP78-79.

13
Glc
Glc-6-P
Fruc-6-P
Gln
GlcN-6-P
GlcNAc-6-P
Acetyl
CoA
GlcNAc-1-P
UDP-GlcNAc
UTP
OGT
OGA
OH O-GlcNAc
HB
P f
lux
GAP PEP Pyruvate
DHAP
UDP-GalNAc
GalNAc
GLYCOLYSISS
AL
VA
GE
PA
TH
WA
Y
Figure 1.3 Schematic illustration of the hexosamine biosynthetic pathway showing flow
of metabolites from other pathways especially glycolysis and the salvage pathways. The
scheme was adopted from the review of L. Wells and G. W. Hart 76, and C. Slawson et
al.82

14
There are many ways in which glucose uptake and flux through glycolysis are
altered to modulate HBP80. Several signals including those induced by cellular stress,
insulin and many cytokines increase glucose uptake through upregulation of glucose
transporters81. These signals tend to be disease-specific and some are triggered in
response to environmental glucose concentration. In hyperglycaemic conditions, for
instance, high extracellular glucose levels alter cellular function through upregulation of
the HBP leading to elevated levels of UDP-GlcNAc that promote insulin resistance, a
hallmark of type II diabetes77. In cancer, increased glucose flux through HBP is
influenced by abnormal regulation of glycolysis, owing to high energy demands of cancer
cells, regardless of hyperglycaemic conditions82. With regards to TGF- signaling, high
glucose was found to induce endogenous TGF-1 production mediated by HBP in murine
mesangial cells83. The autocrine TGF- stimulation resulted in upregulation of ECM
proteins and reduced proliferation. These observations imply that glycolysis-influenced
glucose flux characteristic to cancer might enhance TGF--induced EMT. However, the
influence of TGF- on glycolysis and HBP to modulate O-GlcNAcylation is not known.
1.5 O-GLCNACYLATION AND METABOLISM IN BREAST CANCER
1.5.1 “Warburg Effect”
Metabolic dysfunction in cancer was first described by O. Warburg in 195684. Now
known as “Warburg effect”, this metabolic shift involves increase in glycolysis under
conditions of high oxygen tension, resulting in enhanced lactate production, as well as
increase in glucose uptake and use of the elevated amounts of glucose as a carbon source
for biosynthesis85-86. It is known that 2-5% of glucose entering the cell is used to produce
15
UDP-GlcNAc through Hexose Biosynthetic Pathway87. Elevated levels of UDP-GlcNAc
increase the activity of OGT since it is tightly dependent on the concentration of the
substrate UDP-GlcNAc in the cell88. Thus, enhanced glucose uptake and metabolism
result in elevated intracellular (global) O-GlcNAcylation and subsequent modulation of
target proteins to the advantage and support of the cancer phenotypes89. O-GlcNAc levels
are increased in many tumor types89.
O-GlcNAcylation has a role in many biological processes under normal and
diseased states, where in the latter, its effects may be due to faulty metabolic regulation
that contributes to disease pathology60. For instance, in cancer, several tumor-associated
proteins, mostly transcription factors, have been identified as O-GlcNAcylated proteins59,
69, 90. The effects of O-GlcNAcylation on the function of only a few of these proteins, as
well as the roles of their O-GlcNAcylation in cancer progression, have been
investigated59. Snail1, a mediator of TGF- signaling and EMT transcriptional inducer, is
one such protein. The co-regulation of Snail1 through O-GlcNAcylation and TGF-
signaling during cancer progression has not been made clear.
1.5.2 O-GlcNAcylation and Invasion and Metastasis
TGF-- induced EMT is crucial in breast cancer metastasis since many of the breast
carcinomas are of epithelial origin91. It has been established that since loss of E-cadherin
is associated with poor clinical outcome92, the molecule that causes this loss becomes a
marker of malignancy, and a good target for anti-invasive cancer therapy93. Therefore, it
is important to establish E-cadherin repressors during tumor progression. To this end, the
mechanism by which O-GlcNAcylation leads to cancer invasion and metastasis is still not

16
clearly understood60, as illustrated in Fig. 1.4. Suppression of E-cadherin was found to be
one way in which the effects of O-GlcNAcylation in breast cancer are mediated60.
Coincidentally, down-regulation of E-cadherin is known to be the key mechanism and
hallmark of EMT, a process that initiates invasion and metastasis6. Therefore, it is
surprising that in investigating the mechanism of how O-GlcNAcylation contributes to
cancer invasion, an upstream process such as EMT nor the signal transduction pathways
associated with it, have not been considered60. Nonetheless, down-regulation of E-
cadherin due to O-GlcNAcylation suggests a crosstalk between O-GlcNAcylation and
signaling pathways leading to EMT, invasion and metastasis, in which, proteins that
regulate and mediate EMT, invasion and metastasis are, in turn regulated by O-
GlcNAcylation. In the context of TGF--induced EMT in breast cancer, Snail1 is the
only regulatory O-GlcNAcylated protein that has been characterized59. The O-
GlcNAcylation of E-cadherin binding partners, p120 and -catenin in breast cancer
suggests that there might be other proteins relevant to breast cancer whose regulation by
O-GlcNAcylation is still unknown. Similar to Snail1, these proteins could be targets for
therapeutic interventions during TGF--mediated EMT, invasion and metastasis. Detailed
knowledge of the critical roles played by O-GlcNAcylation and other modifications on
the function of such proteins is therefore essential.
1.5.3 O-GlcNAcylation and TGF- Signaling
O-GlcNAcylation is known as a link between nutrient sensing and signaling94. Although
this fact is well established in insulin signaling77, few studies provide evidence for the
linking role of O-GlcNAcylation in TGF- signaling. Figure 1.4 illustrates the roles that

17
HexosamineBiosynthetic
Pathway TGF-β signaling O-GlcNAcylation
Nutrients
Nutrient-sensing
Signaling
Invasion
Metastasis
EMT Snail &
other TF’s Snail ?
E-cadherin
E-cadherin
E-cadherin
Glc Gln Acetyl CoA UTP
Figure 1.4 Illustration of the relationship between O-GlcNAcylation and TGF-
signaling, constructed from connections made from findings and reviews of Y. Gu et
al.60, S. Y. Park et al.59, and S. Hardiville and G. W. Hart94.
18
glucose and its metabolic sensor (HBP) play in TGF- signaling. On the one hand,
glucose induces phosphorylation of Smad3, and activates Akt-TOR signaling thus
causing increase in protein synthesis and cellular hypertrophy95. Previously, glucose had
been shown to stimulate autocrine activation of TGF- in murine mesangial cells, which
in turn induces collagen gene expression and protein synthesis83, 96. On the other hand,
upregulation of Snail1 by O-GlcNAcylation due to high glucose flux through HBP leads
to tumorigenic EMT, invasion and metastasis59. Although O-GlcNAcylation is not
implicated in the phosphorylation of Smad3, both effects contribute to cancer
malignancy.
Taken together, the previous studies show that TGF- signaling is a well-studied
signal transduction pathway whose role in cancer progression is known but whose
contribution to metabolic dysfunction with regards to Warburg effect of carcinogenesis is
not clear. Therefore study of dynamic regulation of cellular metabolic pathways by TGF-
is critical. Neither the investigation of O-GlcNAcylation of E-cadherin and its binding
partners, p120 and Catenin, nor O-GlcNAcylation of Snail1 alone is sufficient to
demonstrate how TGF- causes metabolic shift and promotes malignancy. Perhaps a
combination of quantitative proteomics and metabolic analysis as reported in Shaw et al.
is a suitable approach97. In this thesis, we intend to use mass spectrometry to explore the
O-GlcNAc proteome during TGF--induced EMT, as this proteome can reveal the
relationship between O-GlcNAcylation and TGF- signaling.
19
1.6 MS-BASED PROTEOMICS
1.6.1 Background
The field of proteomics is a collection of various technical disciplines that deal with
large-scale determination of gene and cellular functions directly at the protein level98. A
proteomic approach may take any one of these two routes: 1) MS-based identification of
proteins isolated from cells or tissues, and 2) activity-based biochemical and genomic
analyses that may involve cell imaging, array and chip experiments, and genetic
readouts98-99. In the post-genomic era, rapid identification of proteins using mass
spectrometry is a common proteomic practice100. However, in the traditional sense, this
approach is inadequate for functional proteomics investigations and requires
improvements to be suitable for site-specific mapping of post-translational modifications
and protein-protein interactions25. Recent advancements in MS-based techniques for
protein identification and PTM site-mapping have accelerated functional proteomics and
methodologies are evolving to address inherent challenges posed by the nature of the
biological sample101.
Due to a large dynamic range of proteins in complex biological samples, there is a
bias toward detecting high abundance proteins63. As a result, proteins with low copy
number, many of which are regulatory and post-translationally modified have low
sequence coverage and are unlikely to be detectable102. In addition to being low
abundance proteins, the low stoichiometry of the PTMs and their lability during collision-
induced dissociation (CID) make it more challenging to analyze PTMs103. Hence the
traditional analytical proteomic approach involving separation of proteins using 2D-
20
PAGE prior to LC-MS/MS is replaced or augmented by affinity enrichment approaches
that selectively isolate sub-population of peptides and proteins bearing the O-GlcNAc
PTM, prior to LC-MS/MS63. By complementing sample pre-fractionation, these
approaches not only effectively reduce sample complexity but also increase proteome
coverage and may be amenable to PTM site mapping.
1.6.2 Affinity Enrichment Approaches for O-GlcNAc PTM
Affinity tags coupled to solid supports such as agarose constitute popular affinity
enrichment strategies for O-GlcNAc-modified peptides and proteins63, 104. Since the
discovery of O-GlcNAc PTM about 30 years ago61, different methodologies involving
covalent and non-covalent attachment to affinity probes have been employed and widely
reviewed105. These include the non-covalent anti-O-GlcNAc antibody-, and lectin-based
strategies, as well as the highly specific chemoenzymatic-, and click-chemistry-based
methodologies. The chemoenzymatic-based method originally involved labeling GlcNAc
sites of proteins with [3H]galactose from UDP-[3H]galactose, with the catalytic action of
-1,4-galactosyltransferase61-62, and subsequent detection of the radiolabeled amino acid
using Edman sequencing106. Khidekel et al. eliminated the use of radiolabeling and
modified this method to incorporate keto-galactose using a suitable recombinant -1,4-
galactosyltransferase, followed by biotinylation at its keto moiety, avidin affinity
chromatography and subsequent protein identification by LC-MS/MS107. Wang et al.
improved the strategy by using a novel photocleavable biotin probe that improved the
analytical capability of chemoenzymatic labeling103. This strategy was even further
improved by using Click chemistry-based photocleavable biotin probe as described in
Alfaro et al108.
21
Prior to the method modification championed by Khidekel and co-workers, O-
GlcNAc sites on only 80 mammalian proteins had been reported109. Using
chemoenzymatic labeling and Orbitrap LC-MS/MS Khidekel et al. then contributed
additional 30 proteins110. Although their strategy revolutionized the affinity enrichment
of O-GlcNAc proteins, the analytical performance had low throughput. Due to this
limitation, the improved methodology applied in Alfaro et al.108 is the one considered
instead among the highly promising strategies for O-GlcNAc affinity enrichment111.
Alfaro and coworkers performed chemoenzymatic labeling of the O-GlcNAc proteome
from brain tissue using GalNAz, followed by biotinylation using PC-PEG-biotin-alkyne,
and enrichment using avidin affinity chromatograpy. In that study the largest number of
O-GlcNAc sites, 458 from 195 proteins was reported. On the non-covalent front, lectin
weak affinity chromatography strategy as developed by Vosseller et al.112, and applied
later in Trinidad et al.113 and Myers et al.114 is also “high-throughput” proteome-wide,
since the latter yielded 142 O-GlcNAc sites from 62 proteins111. Nonetheless, use of
Click chemistry-based strategies involving cleavable reagent as demonstrated in Alfaro et
al. and Wang Z. et al. have opened a door to diversity of countless possibilities for
exploiting the CuAAC and SPAAC for affinity enrichment of O-GlcNAc proteins.
Although the CuAAC-based approaches are common, the reagents of the CuAAC
reaction are viewed as toxic and destructive to peptides and to components of the biotin-
avidin system115. Therefore development of SPAAC approaches that exclude biotin-
avidin system is necessary.
In the past few years there has been a growing interest in the application of Click
chemistry involving [3 + 2] azide-alkyne cycloaddition for probing chemically modified
22
proteins bearing bioorthogonal chemical tags. More than a decade ago Bertozzi and co-
workers established that incorporation of unnatural metabolite provides opportunities for
protein modification and selective labeling of proteins116. In particular these authors
showed that labeling glycoproteins with a unique chemical tag permits their selective
modification from complex mixtures. Such chemical tags eventually facilitate
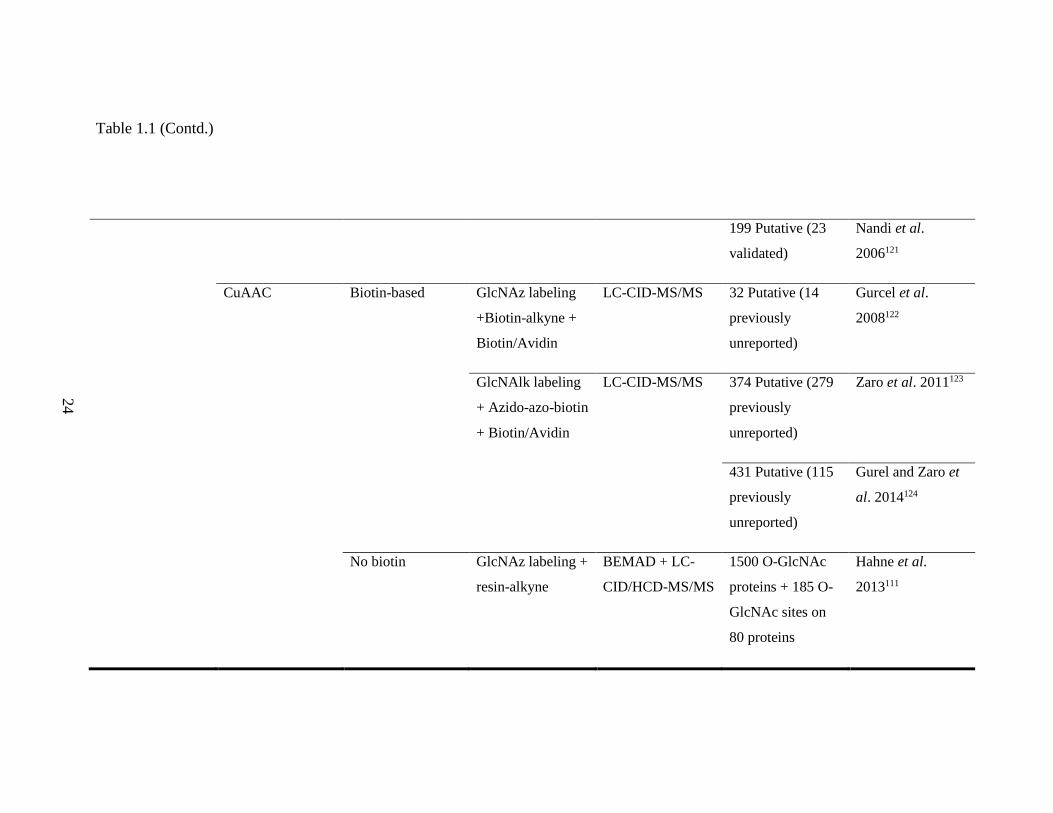
identification of glycoproteins by proteomic strategies. Various strategies previously
employed in tagging O-GlcNAc modified proteins to form a handle for Click chemistry-
based affinity enrichment are shown in Table 1.2. In general, the enrichment route begins
by attaching the chemical handle to O-GlcNAc proteins through chemoenzymatic or
metabolic labeling, followed by conjugation of the functionalized proteins to the
enrichment probe that may be biotin-, or non-biotin-based. Subsequently the affinity-
enriched proteins are released from the probe and analyzed by LC-MS/MS.
The common practice in click chemistry-based strategies involving metabolic
labeling has been described in the studies of Bertozzi and coworkers117. Treatment of
cells with either N-azidoacetylglucosamine, N-azidogalactosamine or N-
alkynylglucosamine results in the metabolic incorporation of the azido sugar into nuclear
and cytoplasmic proteins in place of O-GlcNAc. Briefly, the exogenously added
AC4GlcNAz, AC4GalNAz or AC4GlcNAlk will diffuse into the cells and be deacetylated
by action of intracellular esterases. The deacetylated Azido sugar will then enter the
salvage pathway of the hexosamine biosynthesis where UDP-GlcNAz, a donor substrate
for O-GlcNAcylation of nucleocytoplasmic proteins, is produced. The azido-tagged post-

22
23
Table 1.2 Click chemistry-based O-GlcNAc affinity enrichment strategies
O-GlcNAc
Labeling
Conjugation to
Probe
Biotin or none Affinity
Enrichment
Downstream
Analysis
Results References
Chemoenzymatic CuAAC Biotin-based GalNAz labeling +
Biotin-PEG-PC-
Alkyne +
Biotin/Avidin
LC-
CID/HCD/ETD-
MS/MS
458 O-GlcNAc
sites on 195
proteins
Alfaro et al.
2012108
GalNAz labeling +
Biotin-alkyne +
Biotin/Avidin
LC-CID-MS/MS 213 Putative (67
previously
reported)
Clark et al.
2008118
No biotin GalNaz labeling +
Phospho-alkyne +
Phospho/TiO2
LC-HCD/ETD-
MS/MS
42 O-GlcNAc
peptides (7 novel
O-GlcNAc sites)
Parker et al.
2011119
Metabolic Staudinger ligation Biotin-based GlcNAz labeling
+Biotin-phosphine
+ Biotin/Avidin
LC-CID-MS/MS 10 O-GlcNAc +
41 Putative
Sprung et al.
2005120
23 2
4
Table 1.1 (Contd.)
199 Putative (23
validated)
Nandi et al.
2006121
CuAAC Biotin-based GlcNAz labeling
+Biotin-alkyne +
Biotin/Avidin
LC-CID-MS/MS 32 Putative (14
previously
unreported)
Gurcel et al.
2008122
GlcNAlk labeling
+ Azido-azo-biotin
+ Biotin/Avidin
LC-CID-MS/MS 374 Putative (279
previously
unreported)
Zaro et al. 2011123
431 Putative (115
previously
unreported)
Gurel and Zaro et
al. 2014124
No biotin GlcNAz labeling +
resin-alkyne
BEMAD + LC-
CID/HCD-MS/MS
1500 O-GlcNAc
proteins + 185 O-
GlcNAc sites on
80 proteins
Hahne et al.
2013111
25
translationally modified O-GlcNAc proteins can be covalently derivatized with
biochemical probes that may be biotin-based, in which case the resin should also be
derivatized with the corresponding affinity material, avidin; or alkyne. These affinity
probes are suitable for peptides only, proteins only or both. Below is a synopsis of
selected downstream MS analytical strategies that will be used for proteomic profiling of
breast tumor cells and mammary epithelial tumor model cells.
1.7 MS INSTRUMENTATION FOR PROTEOMIC PROFILING
1.7.1 Background
Mass spectrometry (MS) has become a suitable tool for rapid analysis of proteins sourced
from complex biological mixtures99. As a discipline within the multifaceted field of
proteomics, MS-based proteomics is the current indispensable technology for giving
information about the primary structure of a protein, its post-translational modifications
and its interactions with other proteins125. Most importantly, MS-based proteomics is
capable of solving biological and clinical questions as it can allow: generation of protein-
protein interaction maps; gene ontology annotations based on the protein identification
technology; and analysis of protein expression profiles as a function of cellular state thus
making inference of cellular function possible126. The key role of MS-based proteomics
in cancer research is characterization of proteins through identification, quantification,
and functional assignment, thus, contributing to the understanding of molecular events
involved in cancer progression25. It has been recognized that the proteomic information
will improve cancer diagnosis, prognosis, prevention and treatment through development
of cancer biomarkers and targeted therapies127. In this thesis work MS-based proteomics

26
technology will be applied in protein profiling of breast cancer cell lines as well EMT
breast tumor model cells to test the efficiency of novel sample preparation strategies in
revealing distinguishing features that reflect breast cancer biomarkers and O-GlcNAc
EMT signatures as well as unknown protein functions. Two approaches of protein
profiling, namely; intact cell MALDI-TOF-MS profiling and O-GlcNAc proteomic
profiling will be undertaken. To understand these proteomic approaches, the capabilities
of the two MS instruments of interest, namely; MALDI-TOF-MS and LC-MS/MS (LTQ
orbitrap) have been briefly reviewed.
A mass spectrometer is an instrument that determines the mass of molecules by
measuring their mass-to-charge ratio (m/z) and generates a mass spectrum128. It consists
of three main parts, namely; 1) ion source, where analyte molecules are ionized in
gaseous form, 2) mass analyzer, that measures the mass-to-charge (m/z) ratio of the ions,
and 3) a detector, that records the number of ions at m/z and gives out a signal98.
Although a mass spectrometer was invented in the 19th century, analysis of biomolecules
was only made possible following the discovery of “soft” ionization techniques, MALDI
and ESI, in the late 20th century129-130. These ionization techniques result in minimal
fragmentation of the analyte. MALDI sublimates, in a vacuum, the mixture of matrix and
sample and uses laser pulses to ionize the analyte out of this dry, crystalline mixture of
matrix and sample131. ESI ionizes the analyte coming out of sample solution and is
therefore usually coupled to liquid chromatography132.
Mass measurement of analyte ions generated using either of these two processes
would not be possible if it were not for the powerful mass analyzers coupled therewith
that possess superior qualities required for good analytical performance. Such analytical
27
performance parameters include sensitivity, resolution, mass accuracy and ability to
generate information-rich MS/MS spectra from peptide fragments133. The four basic
types of mass analyzers with stellar qualities for MS measurements are TOF, ion trap,
quadrupole and Fourier-Transform cyclotron98. MALDI is usually coupled to TOF
analyzer that measures the mass of intact peptides while ESI is often coupled to ion trap
and triple quadrupole mass spectrometers in which fragment ion spectra of selected
precursor ions are generated134. Modern mass spectrometers come with advanced
technology that brings outstanding analytical performance owing to the contribution of
parts that make up their hybrid mass analyzers135-138. Such improvement accounts for
higher mass accuracy, higher detection capability and shorter cycling times that enable
increased throughput and more reliable data139. A typical example of such instruments is
the Linear Trap Quadrupole-Orbitrap ion trap velos mass spectrometer140 (Thermo Fisher
Scientific, Germany) that has been employed in the proteomics studies in this thesis.
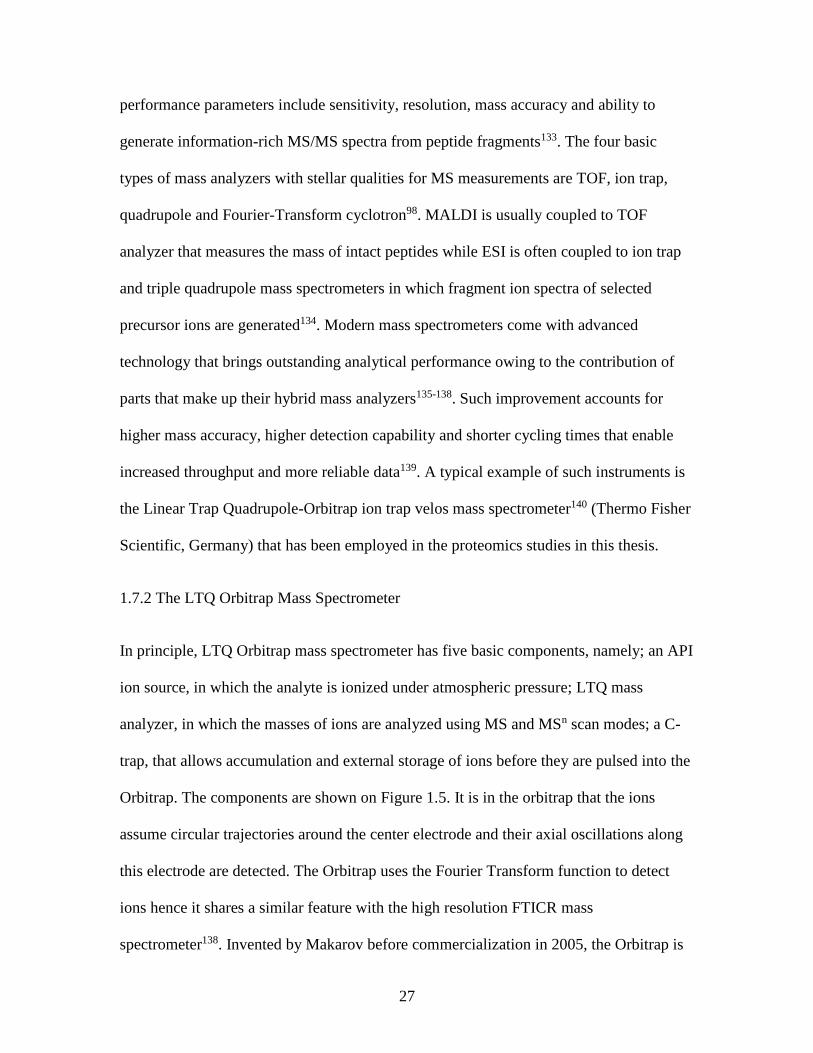
1.7.2 The LTQ Orbitrap Mass Spectrometer
In principle, LTQ Orbitrap mass spectrometer has five basic components, namely; an API
ion source, in which the analyte is ionized under atmospheric pressure; LTQ mass
analyzer, in which the masses of ions are analyzed using MS and MSn scan modes; a C-
trap, that allows accumulation and external storage of ions before they are pulsed into the
Orbitrap. The components are shown on Figure 1.5. It is in the orbitrap that the ions
assume circular trajectories around the center electrode and their axial oscillations along
this electrode are detected. The Orbitrap uses the Fourier Transform function to detect
ions hence it shares a similar feature with the high resolution FTICR mass
spectrometer138. Invented by Makarov before commercialization in 2005, the Orbitrap is
28
Figure 1.5 Diagram showing the route of ions and signal in the LTQ Orbitrap MS,
adopted from S. Eliuk and A. Marakarov102. The horizontal turquoise line represents the
flow of ions. The converging red edges coming from the C-Trap represent the ion packet
(pulse) injected into the orbitrap mass analyzer where advanced signal processing by
Fourier Transform function takes place.

29
one of the newest mass analyzers with outstanding analytical features that include high
mass resolution (up to 150 000), large space charge capacity, and high mass accuracy (2-
5 ppm)141-142. Collectively, the combination of the patented Orbitrap technology and the
powerful Finnigan LTQ linear ion trap in an LTQ Orbitrap mass spectrometer provides
faster, more sensitive and more reliable detection and identification platform for MS-
based proteomics102, 137.
Moreover, Orbitrap mass spectrometer is an instrument of choice for functional
proteomics102. It allows fragmentation of peptides by different modes, collision-induced
dissociation, electron transfer dissociation and high-energy C-trap dissociation102. The
commonly used CID for conventional peptide sequence analysis causes neutral loss of
GlcNAc as an oxonium ion prior to fragmentation of the peptide backbone. As a result,
the peptide bearing the GlcNAc cannot be located143. Conversely, ETD causes
fragmentation of the backbone with GlcNAc modification intact therefore it allows
identification of that peptide and GlcNAc site mapping144-145. HCD also leaves the
modified peptide intact146. Hence, as shown in Table 1.2, affinity enrichment strategies
such as those of Alfaro et al.108 and Hahne et al.111 that were followed by MS analysis
involving combinations of fragmentations resulted in reports of high number of O-
GlcNAc sites and proteins with valid O-GlcNAc. Derivatization of peptides using
BEMAD improves site identification using CID125. For more confident O-GlcNAc site
mapping a combination of ETD and HCD is recommended147.

30
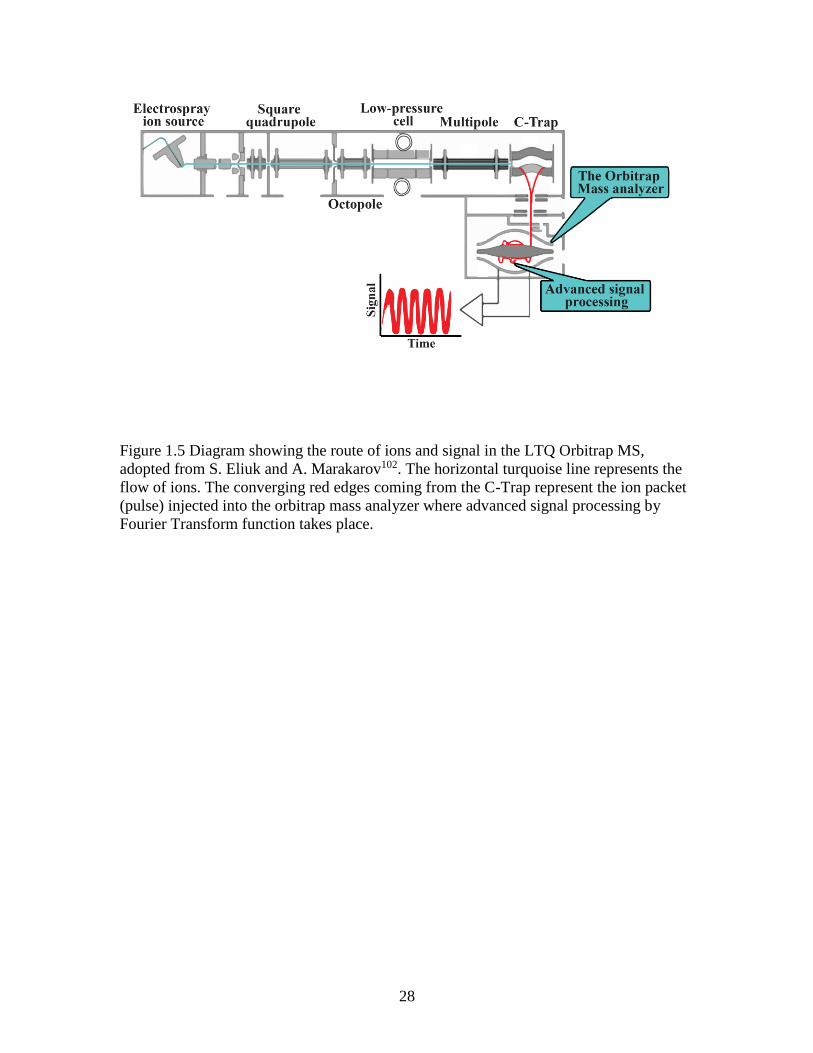
1.7.3 The MALDI-TOF Mass Spectrometer
MALDI-TOF mass spectrometer, in particular, is widely used for protein profiling and
discovery of disease biomarkers from different biological samples148. As illustrated in
Figure 1.6, it uses pulsed laser irradiation of a co-crystal of a UV-absorbing compound (a
matrix) and the analyte to desorb and ionize the analyte molecules in a gaseous phase131.
A spectrum is then recorded directly following the drift of ions in the flight-tube and their
subsequent detection. Each mass spectrum is a graph of protein intensity against m/z and
consists of a series of protein peaks. MALDI-TOF-MS has proven to be a suitable
instrument for rapid profiling of different biological samples including intact cells151-156.
It has been applied previously for rapid profiling of bacteria, fungi, and human clinical
specimen such as serum and biopsies153, 157-159. It has been employed in this thesis for
profiling of breast cancer cells involving novel sample preparation.
1.8 SPECIFIC AIMS AND RESEARCH QUESTIONS
In chapter 2 of this thesis we asked whether breast cancer cell lines could be rapidly
profiled and distinguished based on their protein mass spectral differences. The specific
aims were to 1) develop a novel sample preparation methodology for rapid MALDI MS
profiling of mammalian cells; and 2) apply the established methodology to distinguish
breast cancer cell lines of different metastatic potential. The novel sample preparation
strategy involved “one-tube” pretreatment of cell pellet with a mixture of unique
composition containing some known MALDI solvents and matrices, followed by
instrumental analysis of the samples to generate their mass spectral profiles, as well as
application of computational methods to reveal and visualize the differences.
31
Figure 1.6 Schematic of the MALDI-TOF-MS analysis starting from
desorption/ionization of the protein molecules through display of a spectrum and
discrimination between normal and cancer samples using bioinformatics methods. This
illustration was adopted from reports of C. Laronga and R. Drake149, as well as Y. Yasui
et al.150

32
In Chapter 3, we sought to develop a SPAAC-based affinity enrichment strategy
and use it to obtain insights on O-GlcNAc proteome of TGF- induced EMT. We asked
whether TGF-, in inducing EMT, modulates O-GlcNAc modification of
nucleocytoplasmic proteins. Could there be a crosstalk between TGF- and O-GlcNAc
signaling pathways during EMT? The specific aims were to 1) characterize the affinity
enrichment dibenzocyclooctyne-disulphide-beaded resin probe; 2) metabolically label
cellular proteins with GalNAz and enrich the labeled proteome through SPAAC using the
resin; and 3) employ shotgun proteomics to identify and quantify the azido-labeled O-
GlcNAc-proteome of NMuMG cells undergoing EMT. The biochemical probe employed
in this thesis is a unique “Click-able and cleavable” dibenzocyclooctyne-modified resin
that serves as an affinity enrichment tool for the purpose of facilitating mass
spectrometric identification of azido-labeled O-GlcNAc-modified proteins from TGF--
induced EMT.

33
REFERENCES
1. R. L. Siegel, K. D. Miller, A. Jemal, Cancer statistics, 2015. CA Cancer J. Clin.,
2015, 65, 5-29.
2. B. A. Kohler, R. L. Sherman, N. Howlader, A. Jemal, A. B. Ryerson, K. A.
Henry, et al., Annual Report to the Nation on the Status of Cancer, 1975-2011, Featuring
Incidence of Breast Cancer Subtypes by Race/Ethnicity, Poverty, and State. J. Natl.
Cancer Inst., 2015, 107, djv048.
3. A. Journet, M. Ferro, The potentials of MS-based subproteomic approaches in
medical science: the case of lysosomes and breast cancer. Mass Spectrom. Rev., 2004, 23,
393-442.
4. E. Foubert, B. De Craene, G. Berx, Key signalling nodes in mammary gland
development and cancer. The Snail1-Twist1 conspiracy in malignant breast cancer
progression. Breast Cancer Res., 2010, 12.
5. W. Clarke, Z. Zhang, D. W. Chan, The application of clinical proteomics to
cancer and other diseases. Clin. Chem. Lab. Med., 2003, 41, 1562-1570.
6. J. P. Thiery, Epithelial-mesenchymal transitions in tumour progression. Nat. Rev.
Cancer, 2002, 2, 442-454.
7. P. O'Connell, V. Pekkel, S. A. Fuqua, C. K. Osborne, G. M. Clark, D. C. Allred,
Analysis of loss of heterozygosity in 399 premalignant breast lesions at 15 genetic loci. J.
Natl. Cancer Inst., 1998, 90, 697-703.
8. C. Nordqvist Breast Cancer: Causes, Symptoms and Treatments.
http://www.medicalnewstoday.com/articles/37136.php (accessed October 01, 2015).
9. S. Ramaswamy, K. N. Ross, E. S. Lander, T. R. Golub, A molecular signature of
metastasis in primary solid tumors. Nat. Genet., 2003, 33, 49-54.
10. P. T. Simpson, J. S. Reis-Filho, T. Gale, S. R. Lakhani, Molecular evolution of
breast cancer. J. Pathol., 2005, 205, 248-254.
11. C. M. Perou, T. Sorlie, M. B. Eisen, M. van de Rijn, S. S. Jeffrey, C. A. Rees, et
al., Molecular portraits of human breast tumours. Nature, 2000, 406, 747-752.
34
12. T. Sorlie, C. M. Perou, R. Tibshirani, T. Aas, S. Geisler, H. Johnsen, et al., Gene
expression patterns of breast carcinomas distinguish tumor subclasses with clinical
implications. Proc. Natl. Acad. Sci. U. S. A., 2001, 98, 10869-10874.
13. T. Sorlie, R. Tibshirani, J. Parker, T. Hastie, J. S. Marron, A. Nobel, et al.,
Repeated observation of breast tumor subtypes in independent gene expression data sets.
Proc. Natl. Acad. Sci. U. S. A., 2003, 100, 8418-8423.
14. J. S. Reis-Filho, S. R. Lakhani, The diagnosis and management of pre-invasive
breast disease: genetic alterations in pre-invasive lesions. Breast Cancer Res., 2003, 5,
313-319.
15. M. Aubele, A. Mattis, H. Zitzelsberger, A. Walch, M. Kremer, G. Welzl, et al.,
Extensive ductal carcinoma In situ with small foci of invasive ductal carcinoma: evidence
of genetic resemblance by CGH. Int. J. Cancer, 2000, 85, 82-86.
16. S. R. Morris, L. A. Carey, Molecular profiling in breast cancer. Rev. Endocr.
Metab. Disord., 2007, 8, 185-198.
17. F. Bertucci, D. Birnbaum, A. Goncalves, Proteomics of breast cancer - Principles
and potential clinical applications. Mol. Cell. Proteomics, 2006, 5, 1772-1786.
18. A. Goncalves, F. Bertucci, Clinical application of proteomics in breast cancer:
state of the art and perspectives. Med. Princ. Pract., 2011, 20, 4-18.
19. F. Chibon, Cancer gene expression signatures - the rise and fall? Eur. J. Cancer,
2013, 49, 2000-2009.
20. L. J. van 't Veer, H. Dai, M. J. van de Vijver, Y. D. He, A. A. Hart, M. Mao, et
al., Gene expression profiling predicts clinical outcome of breast cancer. Nature, 2002,
415, 530-536.
21. M. J. van de Vijver, Y. D. He, L. J. van't Veer, H. Dai, A. A. Hart, D. W. Voskuil,
et al., A gene-expression signature as a predictor of survival in breast cancer. N. Engl. J.
Med., 2002, 347, 1999-2009.
22. S. Paik, S. Shak, G. Tang, C. Kim, J. Baker, M. Cronin, et al., A multigene assay
to predict recurrence of tamoxifen-treated, node-negative breast cancer. N. Engl. J. Med.,
2004, 351, 2817-2826.

35
23. R. Bernards, R. A. Weinberg, A progression puzzle. Nature, 2002, 418, 823.
24. S. Cleator, A. Ashworth, Molecular profiling of breast cancer: clinical
implications. Br. J. Cancer, 2004, 90, 1120-1124.
25. J. D. Wulfkuhle, K. C. McLean, C. P. Paweletz, D. C. Sgroi, B. J. Trock, P. S.
Steeg, et al., New approaches to proteomic analysis of breast cancer. Proteomics, 2001,
1, 1205-1215.
26. R. Kalluri, R. A. Weinberg, The basics of epithelial-mesenchymal transition. J.
Clin. Invest., 2009, 119, 1420-1428.
27. J. P. Thiery, J. P. Sleeman, Complex networks orchestrate epithelial-
mesenchymal transitions. Nat. Rev. Mol. Cell Biol., 2006, 7, 131-142.
28. B. De Craene, G. Berx, Regulatory networks defining EMT during cancer
initiation and progression. Nat. Rev. Cancer, 2013, 13, 97-110.
29. H. Peinado, D. Olmeda, A. Cano, Snail, Zeb and bHLH factors in tumour
progression: an alliance against the epithelial phenotype? Nat. Rev. Cancer, 2007, 7, 415-
428.
30. H. B. Ruan, Y. Nie, X. Yang, Regulation of protein degradation by O-
GlcNAcylation: crosstalk with ubiquitination. Mol. Cell. Proteomics, 2013, 12, 3489-
3497.
31. K. Lee, C. M. Nelson, New insights into the regulation of epithelial-mesenchymal
transition and tissue fibrosis. Int. Rev. Cell Mol. Biol., 2012, 294, 171-221.
32. S. B. Jakowlew, Transforming growth factor-beta in cancer and metastasis.
Cancer Metastasis Rev., 2006, 25, 435-457.
33. G. Moreno-Bueno, H. Peinado, P. Molina, D. Olmeda, E. Cubillo, V. Santos, et
al., The morphological and molecular features of the epithelial-to-mesenchymal
transition. Nat. Protoc., 2009, 4, 1591-1613.
34. J. Biarc, P. Gonzalo, I. Mikaelian, L. Fattet, M. Deygas, G. Gillet, et al.,
Combination of a discovery LC-MS/MS analysis and a label-free quantification for the

36
characterization of an epithelial-mesenchymal transition signature. J. Proteomics, 2014,
110, 183-194.
35. A. Gamez-Pozo, J. Berges-Soria, J. M. Arevalillo, P. Nanni, R. Lopez-Vacas, H.
Navarro, et al., Combined Label-Free Quantitative Proteomics and microRNA
Expression Analysis of Breast Cancer Unravel Molecular Differences with Clinical
Implications. Cancer Res., 2015, 75, 2243-2253.
36. S. Cha, M. B. Imielinski, T. Rejtar, E. A. Richardson, D. Thakur, D. C. Sgroi, et
al., In situ proteomic analysis of human breast cancer epithelial cells using laser capture
microdissection: annotation by protein set enrichment analysis and gene ontology. Mol.
Cell. Proteomics, 2010, 9, 2529-2544.
37. D. Vergara, P. Simeone, P. del Boccio, C. Toto, D. Pieragostino, A. Tinelli, et al.,
Comparative proteome profiling of breast tumor cell lines by gel electrophoresis and
mass spectrometry reveals an epithelial mesenchymal transition associated protein
signature. Mol. Biosyst., 2013, 9, 1127-1138.
38. J. Zavadil, E. P. Bottinger, TGF-beta and epithelial-to-mesenchymal transitions.
Oncogene, 2005, 24, 5764-5774.
39. J. P. Thiery, H. Acloque, R. Y. Huang, M. A. Nieto, Epithelial-mesenchymal
transitions in development and disease. Cell, 2009, 139, 871-890.
40. J. Massague, A. Hata, F. Liu, TGF-beta signalling through the Smad pathway.
Trends Cell Biol., 1997, 7, 187-192.
41. C. H. Heldin, K. Miyazono, P. ten Dijke, TGF-beta signalling from cell
membrane to nucleus through SMAD proteins. Nature, 1997, 390, 465-471.
42. X. Guo, X. F. Wang, Signaling cross-talk between TGF-beta/BMP and other
pathways. Cell Res., 2009, 19, 71-88.
43. A. Moustakas, C. H. Heldin, Induction of epithelial-mesenchymal transition by
transforming growth factor beta. Semin. Cancer Biol., 2012, 22, 446-454.
44. E. Piek, A. Moustakas, A. Kurisaki, C. H. Heldin, P. ten Dijke, TGF-(beta) type I
receptor/ALK-5 and Smad proteins mediate epithelial to mesenchymal
37
transdifferentiation in NMuMG breast epithelial cells. J. Cell Sci., 1999, 112 ( Pt 24),
4557-4568.
45. G. J. Inman, Switching TGFbeta from a tumor suppressor to a tumor promoter.
Curr. Opin. Genet. Dev., 2011, 21, 93-99.
46. C. D. Morrison, J. G. Parvani, W. P. Schiemann, The relevance of the TGF-beta
Paradox to EMT-MET programs. Cancer Lett., 2013, 341, 30-40.
47. J. Xu, S. Lamouille, R. Derynck, TGF-beta-induced epithelial to mesenchymal
transition. Cell Res., 2009, 19, 156-172.
48. J. Massague, TGF-beta signal transduction. Annu. Rev. Biochem., 1998, 67, 753-
791.
49. J. Massague, TGFbeta in Cancer. Cell, 2008, 134, 215-230.
50. P. M. Siegel, J. Massague, Cytostatic and apoptotic actions of TGF-beta in
homeostasis and cancer. Nat. Rev. Cancer, 2003, 3, 807-821.
51. S. Lamouille, R. Derynck, Cell size and invasion in TGF-beta-induced epithelial
to mesenchymal transition is regulated by activation of the mTOR pathway. J. Cell Biol.,
2007, 178, 437-451.
52. H. J. Cho, K. E. Baek, S. Saika, M. J. Jeong, J. Yoo, Snail is required for
transforming growth factor-beta-induced epithelial-mesenchymal transition by activating
PI3 kinase/Akt signal pathway. Biochem. Biophys. Res. Commun., 2007, 353, 337-343.
53. N. A. Bhowmick, M. Ghiassi, A. Bakin, M. Aakre, C. A. Lundquist, M. E. Engel,
et al., Transforming growth factor-beta1 mediates epithelial to mesenchymal
transdifferentiation through a RhoA-dependent mechanism. Mol. Biol. Cell, 2001, 12, 27-
36.
54. X. Han, J. E. Stewart, Jr., S. L. Bellis, E. N. Benveniste, Q. Ding, K. Tachibana,
et al., TGF-beta1 up-regulates paxillin protein expression in malignant astrocytoma cells:
requirement for a fibronectin substrate. Oncogene, 2001, 20, 7976-7986.

38
55. E. Janda, K. Lehmann, I. Killisch, M. Jechlinger, M. Herzig, J. Downward, et al.,
Ras and TGF[beta] cooperatively regulate epithelial cell plasticity and metastasis:
dissection of Ras signaling pathways. J. Cell Biol., 2002, 156, 299-313.
56. N. Tiwari, A. Gheldof, M. Tatari, G. Christofori, EMT as the ultimate survival
mechanism of cancer cells. Semin. Cancer Biol., 2012, 22, 194-207.
57. C. H. Heldin, M. Landstrom, A. Moustakas, Mechanism of TGF-beta signaling to
growth arrest, apoptosis, and epithelial-mesenchymal transition. Curr. Opin. Cell Biol.,
2009, 21, 166-176.
58. J. Massague, How cells read TGF-beta signals. Nat Rev Mol Cell Bio, 2000, 1,
169-178.
59. S. Y. Park, H. S. Kim, N. H. Kim, S. Ji, S. Y. Cha, J. G. Kang, et al., Snail1 is
stabilized by O-GlcNAc modification in hyperglycaemic condition. EMBO J., 2010, 29,
3787-3796.
60. Y. Gu, W. Mi, Y. Ge, H. Liu, Q. Fan, C. Han, et al., GlcNAcylation plays an
essential role in breast cancer metastasis. Cancer Res., 2010, 70, 6344-6351.
61. C. R. Torres, G. W. Hart, Topography and polypeptide distribution of terminal N-
acetylglucosamine residues on the surfaces of intact lymphocytes. Evidence for O-linked
GlcNAc. J. Biol. Chem., 1984, 259, 3308-3317.
62. G. D. Holt, G. W. Hart, The subcellular distribution of terminal N-
acetylglucosamine moieties. Localization of a novel protein-saccharide linkage, O-linked
GlcNAc. J. Biol. Chem., 1986, 261, 8049-8057.
63. K. Vosseller, L. Wells, G. W. Hart, Nucleocytoplasmic O-glycosylation: O-
GlcNAc and functional proteomics. Biochimie, 2001, 83, 575-581.
64. L. Wells, K. Vosseller, G. W. Hart, Glycosylation of nucleocytoplasmic proteins:
signal transduction and O-GlcNAc. Science, 2001, 291, 2376-2378.
65. F. I. Comer, G. W. Hart, O-glycosylation of nuclear and cytosolic proteins -
Dynamic interplay between O-GlcNAc and O-phosphate. J. Biol. Chem., 2000, 275,
29179-29182.

39
66. K. Vosseller, K. Sakabe, L. Wells, G. W. Hart, Diverse regulation of protein
function by O-GlcNAc: a nuclear and cytoplasmic carbohydrate post-translational
modification. Curr. Opin. Chem. Biol., 2002, 6, 851-857.
67. R. Dentin, S. Hedrick, J. Xie, J. Yates, 3rd, M. Montminy, Hepatic glucose
sensing via the CREB coactivator CRTC2. Science, 2008, 319, 1402-1405.
68. X. Yang, P. P. Ongusaha, P. D. Miles, J. C. Havstad, F. Zhang, W. V. So, et al.,
Phosphoinositide signalling links O-GlcNAc transferase to insulin resistance. Nature,
2008, 451, 964-969.
69. C. Slawson, G. W. Hart, O-GlcNAc signalling: implications for cancer cell
biology. Nat. Rev. Cancer, 2011, 11, 678-684.
70. P. Hu, S. Shimoji, G. W. Hart, Site-specific interplay between O-GlcNAcylation
and phosphorylation in cellular regulation. FEBS Lett., 2010, 584, 2526-2538.
71. L. S. Griffith, B. Schmitz, O-linked N-acetylglucosamine levels in cerebellar
neurons respond reciprocally to pertubations of phosphorylation. Eur. J. Biochem., 1999,
262, 824-831.
72. R. S. Haltiwanger, G. D. Holt, G. W. Hart, Enzymatic addition of O-GlcNAc to
nuclear and cytoplasmic proteins. Identification of a uridine diphospho-N-
acetylglucosamine:peptide beta-N-acetylglucosaminyltransferase. J. Biol. Chem., 1990,
265, 2563-2568.
73. D. L. Dong, G. W. Hart, Purification and characterization of an O-GlcNAc
selective N-acetyl-beta-D-glucosaminidase from rat spleen cytosol. J. Biol. Chem., 1994,
269, 19321-19330.
74. K. R. Harwood, J. A. Hanover, Nutrient-driven O-GlcNAc cycling - think
globally but act locally. J. Cell Sci., 2014, 127, 1857-1867.
75. G. W. Hart, M. P. Housley, C. Slawson, Cycling of O-linked beta-N-
acetylglucosamine on nucleocytoplasmic proteins. Nature, 2007, 446, 1017-1022.
76. L. Wells, G. W. Hart, O-GlcNAc turns twenty: functional implications for post-
translational modification of nuclear and cytosolic proteins with a sugar. FEBS Lett.,
2003, 546, 154-158.

40
77. D. A. McClain, Hexosamines as mediators of nutrient sensing and regulation in
diabetes. J. Diabetes Complications, 2002, 16, 72-80.
78. K. E. Wellen, C. Lu, A. Mancuso, J. M. Lemons, M. Ryczko, J. W. Dennis, et al.,
The hexosamine biosynthetic pathway couples growth factor-induced glutamine uptake
to glucose metabolism. Genes Dev., 2010, 24, 2784-2799.
79. H. N. Moseley, A. N. Lane, A. C. Belshoff, R. M. Higashi, T. W. Fan, A novel
deconvolution method for modeling UDP-N-acetyl-D-glucosamine biosynthetic
pathways based on (13)C mass isotopologue profiles under non-steady-state conditions.
BMC Biol., 2011, 9, 37.
80. W. Yi, P. M. Clark, D. E. Mason, M. C. Keenan, C. Hill, W. A. Goddard, 3rd, et
al., Phosphofructokinase 1 glycosylation regulates cell growth and metabolism. Science,
2012, 337, 975-980.
81. N. E. Zachara, G. W. Hart, Cell signaling, the essential role of O-GlcNAc!
Biochim. Biophys. Acta, 2006, 1761, 599-617.
82. C. Slawson, R. J. Copeland, G. W. Hart, O-GlcNAc signaling: a metabolic link
between diabetes and cancer? Trends Biochem. Sci., 2010, 35, 547-555.
83. F. N. Ziyadeh, K. Sharma, M. Ericksen, G. Wolf, Stimulation of Collagen Gene-
Expression and Protein-Synthesis in Murine Mesangial Cells by High Glucose Is
Mediated by Autocrine Activation of Transforming Growth-Factor-Beta. J. Clin. Invest.,
1994, 93, 536-542.
84. O. Warburg, Origin of Cancer Cells. Science, 1956, 123, 309-314.
85. C. V. Dang, G. L. Semenza, Oncogenic alterations of metabolism. Trends
Biochem. Sci., 1999, 24, 68-72.
86. G. Kroemer, J. Pouyssegur, Tumor cell metabolism: cancer's Achilles' heel.
Cancer Cell, 2008, 13, 472-482.
87. S. Marshall, V. Bacote, R. R. Traxinger, Discovery of a Metabolic Pathway
Mediating Glucose-Induced Desensitization of the Glucose-Transport System - Role of
Hexosamine Biosynthesis in the Induction of Insulin Resistance. J. Biol. Chem., 1991,
266, 4706-4712.

41
88. J. E. Rexach, P. M. Clark, D. E. Mason, R. L. Neve, E. C. Peters, L. C. Hsieh-
Wilson, Dynamic O-GlcNAc modification regulates CREB-mediated gene expression
and memory formation. Nat. Chem. Biol., 2012, 8, 253-261.
89. S. A. Caldwell, S. R. Jackson, K. S. Shahriari, T. P. Lynch, G. Sethi, S. Walker, et
al., Nutrient sensor O-GlcNAc transferase regulates breast cancer tumorigenesis through
targeting of the oncogenic transcription factor FoxM1. Oncogene, 2010, 29, 2831-2842.
90. K. Kamemura, B. K. Hayes, F. I. Comer, G. W. Hart, Dynamic interplay between
O-glycosylation and O-phosphorylation of nucleocytoplasmic proteins: alternative
glycosylation/phosphorylation of THR-58, a known mutational hot spot of c-Myc in
lymphomas, is regulated by mitogens. J. Biol. Chem., 2002, 277, 19229-19235.
91. A. E. Lenferink, J. Magoon, C. Cantin, M. D. O'Connor-McCourt, Investigation
of three new mouse mammary tumor cell lines as models for transforming growth factor
(TGF)-beta and Neu pathway signaling studies: identification of a novel model for TGF-
beta-induced epithelial-to-mesenchymal transition. Breast Cancer Res., 2004, 6, R514-
530.
92. A. K. Perl, P. Wilgenbus, U. Dahl, H. Semb, G. Christofori, A causal role for E-
cadherin in the transition from adenoma to carcinoma. Nature, 1998, 392, 190-193.
93. A. Barrallo-Gimeno, M. A. Nieto, The Snail genes as inducers of cell movement
and survival: implications in development and cancer. Development, 2005, 132, 3151-
3161.
94. S. Hardiville, G. W. Hart, Nutrient regulation of signaling, transcription, and cell
physiology by O-GlcNAcylation. Cell Metab., 2014, 20, 208-213.
95. L. Wu, R. Derynck, Essential role of TGF-beta signaling in glucose-induced cell
hypertrophy. Dev. Cell, 2009, 17, 35-48.
96. B. L. Riser, P. Cortes, J. Yee, A. K. Sharba, K. Asano, A. Rodriguez-Barbero, et
al., Mechanical strain- and high glucose-induced alterations in mesangial cell collagen
metabolism: role of TGF-beta. J. Am. Soc. Nephrol., 1998, 9, 827-836.
97. P. G. Shaw, R. Chaerkady, T. Wang, S. Vasilatos, Y. Huang, B. Van Houten, et
al., Integrated proteomic and metabolic analysis of breast cancer progression. PLoS One,
2013, 8, e76220.

42
98. R. Aebersold, M. Mann, Mass spectrometry-based proteomics. Nature, 2003, 422,
198-207.
99. B. F. Cravatt, G. M. Simon, J. R. Yates, 3rd, The biological impact of mass-
spectrometry-based proteomics. Nature, 2007, 450, 991-1000.
100. P. A. Haynes, S. P. Gygi, D. Figeys, R. Aebersold, Proteome analysis: Biological
assay or data archive? Electrophoresis, 1998, 19, 1862-1871.
101. Q. Zhang, V. Faca, S. Hanash, Mining the plasma proteome for disease
applications across seven logs of protein abundance. J. Proteome Res., 2011, 10, 46-50.
102. S. Eliuk, A. Makarov, Evolution of Orbitrap Mass Spectrometry Instrumentation.
Annu. Rev. Anal. Chem. (Palo Alto Calif.), 2015, 8, 61-80.
103. Z. Wang, N. D. Udeshi, M. O'Malley, J. Shabanowitz, D. F. Hunt, G. W. Hart,
Enrichment and site mapping of O-linked N-acetylglucosamine by a combination of
chemical/enzymatic tagging, photochemical cleavage, and electron transfer dissociation
mass spectrometry. Mol. Cell. Proteomics, 2010, 9, 153-160.
104. H. T. Tan, Y. H. Lee, M. C. Chung, Cancer proteomics. Mass Spectrom. Rev.,
2012, 31, 583-605.
105. J. Ma, G. W. Hart, O-GlcNAc profiling: from proteins to proteomes. Clin.
Proteomics, 2014, 11, 8.
106. A. J. Reason, H. R. Morris, M. Panico, R. Marais, R. H. Treisman, R. S.
Haltiwanger, et al., Localization of O-GlcNAc modification on the serum response
transcription factor. J. Biol. Chem., 1992, 267, 16911-16921.
107. N. Khidekel, S. Arndt, N. Lamarre-Vincent, A. Lippert, K. G. Poulin-Kerstien, B.
Ramakrishnan, et al., A chemoenzymatic approach toward the rapid and sensitive
detection of O-GlcNAc posttranslational modifications. J. Am. Chem. Soc., 2003, 125,
16162-16163.
108. J. F. Alfaro, C. X. Gong, M. E. Monroe, J. T. Aldrich, T. R. Clauss, S. O. Purvine,
et al., Tandem mass spectrometry identifies many mouse brain O-GlcNAcylated proteins
including EGF domain-specific O-GlcNAc transferase targets. Proc. Natl. Acad. Sci. U.
S. A., 2012, 109, 7280-7285.
43
109. N. Khidekel, S. B. Ficarro, E. C. Peters, L. C. Hsieh-Wilson, Exploring the O-
GlcNAc proteome: direct identification of O-GlcNAc-modified proteins from the brain.
Proc. Natl. Acad. Sci. U. S. A., 2004, 101, 13132-13137.
110. N. Khidekel, S. B. Ficarro, P. M. Clark, M. C. Bryan, D. L. Swaney, J. E. Rexach,
et al., Probing the dynamics of O-GlcNAc glycosylation in the brain using quantitative
proteomics. Nat. Chem. Biol., 2007, 3, 339-348.
111. H. Hahne, N. Sobotzki, T. Nyberg, D. Helm, V. S. Borodkin, D. M. van Aalten, et
al., Proteome wide purification and identification of O-GlcNAc-modified proteins using
click chemistry and mass spectrometry. J. Proteome Res., 2013, 12, 927-936.
112. K. Vosseller, J. C. Trinidad, R. J. Chalkley, C. G. Specht, A. Thalhammer, A. J.
Lynn, et al., O-linked N-acetylglucosamine proteomics of postsynaptic density
preparations using lectin weak affinity chromatography and mass spectrometry. Mol.
Cell. Proteomics, 2006, 5, 923-934.
113. J. C. Trinidad, D. T. Barkan, B. F. Gulledge, A. Thalhammer, A. Sali, R.
Schoepfer, et al., Global identification and characterization of both O-GlcNAcylation and
phosphorylation at the murine synapse. Mol. Cell. Proteomics, 2012, 11, 215-229.
114. S. A. Myers, B. Panning, A. L. Burlingame, Polycomb repressive complex 2 is
necessary for the normal site-specific O-GlcNAc distribution in mouse embryonic stem
cells. Proc. Natl. Acad. Sci. U. S. A., 2011, 108, 9490-9495.
115. M. A. Nessen, G. Kramer, J. Back, J. M. Baskin, L. E. J. Smeenk, L. J. de
Koning, et al., Selective Enrichment of Azide-Containing Peptides from Complex
Mixtures. J. Proteome Res., 2009, 8, 3702-3711.
116. D. J. Vocadlo, H. C. Hang, E. J. Kim, J. A. Hanover, C. R. Bertozzi, A chemical
approach for identifying O-GlcNAc-modified proteins in cells. Proc. Natl. Acad. Sci. U.
S. A., 2003, 100, 9116-9121.
117. S. T. Laughlin, C. R. Bertozzi, Metabolic labeling of glycans with azido sugars
and subsequent glycan-profiling and visualization via Staudinger ligation. Nat. Protoc.,
2007, 2, 2930-2944.
118. P. M. Clark, J. F. Dweck, D. E. Mason, C. R. Hart, S. B. Buck, E. C. Peters, et al.,
Direct in-gel fluorescence detection and cellular imaging of O-GlcNAc-modified
proteins. J. Am. Chem. Soc., 2008, 130, 11576-11577.
44
119. B. L. Parker, P. Gupta, S. J. Cordwell, M. R. Larsen, G. Palmisano, Purification
and identification of O-GlcNAc-modified peptides using phosphate-based alkyne CLICK
chemistry in combination with titanium dioxide chromatography and mass spectrometry.
J. Proteome Res., 2011, 10, 1449-1458.
120. R. Sprung, A. Nandi, Y. Chen, S. C. Kim, D. Barma, J. R. Falck, et al., Tagging-
via-substrate strategy for probing O-GlcNAc modified proteins. J. Proteome Res., 2005,
4, 950-957.
121. A. Nandi, R. Sprung, D. K. Barma, Y. Zhao, S. C. Kim, J. R. Falck, et al., Global
identification of O-GlcNAc-modified proteins. Anal. Chem., 2006, 78, 452-458.
122. C. Gurcel, A. S. Vercoutter-Edouart, C. Fonbonne, M. Mortuaire, A. Salvador, J.
C. Michalski, et al., Identification of new O-GlcNAc modified proteins using a click-
chemistry-based tagging. Anal. Bioanal. Chem., 2008, 390, 2089-2097.
123. B. W. Zaro, Y. Y. Yang, H. C. Hang, M. R. Pratt, Chemical reporters for
fluorescent detection and identification of O-GlcNAc-modified proteins reveal
glycosylation of the ubiquitin ligase NEDD4-1. Proc. Natl. Acad. Sci. U. S. A., 2011,
108, 8146-8151.
124. Z. Gurel, B. W. Zaro, M. R. Pratt, N. Sheibani, Identification of O-GlcNAc
modification targets in mouse retinal pericytes: implication of p53 in pathogenesis of
diabetic retinopathy. PLoS One, 2014, 9, e95561.
125. L. Wells, K. Vosseller, R. N. Cole, J. M. Cronshaw, M. J. Matunis, G. W. Hart,
Mapping sites of O-GlcNAc modification using affinity tags for serine and threonine
post-translational modifications. Mol. Cell. Proteomics, 2002, 1, 791-804.
126. R. I. Somiari, S. Somiari, S. Russell, C. D. Shriver, Proteomics of breast
carcinoma. J Chromatogr B, 2005, 815, 215-225.
127. G. Chambers, L. Lawrie, P. Cash, G. I. Murray, Proteomics: a new approach to
the study of disease. J. Pathol., 2000, 192, 280-288.
128. J. Micallef, M. Dharsee, J. Chen, S. Ackloo, K. Evans, L. Qiu, et al., Applying
mass spectrometry based proteomic technology to advance the understanding of multiple
myeloma. J. Hematol. Oncol., 2010, 3, 13.
45
129. M. Karas, F. Hillenkamp, Laser desorption ionization of proteins with molecular
masses exceeding 10,000 daltons. Anal. Chem., 1988, 60, 2299-2301.
130. J. B. Fenn, M. Mann, C. K. Meng, S. F. Wong, C. M. Whitehouse, Electrospray
ionization for mass spectrometry of large biomolecules. Science, 1989, 246, 64-71.
131. F. Hillenkamp, M. Karas, The MALDI Process and Method. In MALDI MS. A
Practical Guide to Instrumentation Methods and Applications, Hillenkamp, F.; Peter-
Karalinc, J., Eds. Wiley-VCH Verlag GmbH & Co. KGaA: Weinheim, 2007.
132. J. R. Yates, C. I. Ruse, A. Nakorchevsky, Proteomics by mass spectrometry:
approaches, advances, and applications. Annu. Rev. Biomed. Eng., 2009, 11, 49-79.
133. W. G. Fisher, K. P. Rosenblatt, D. A. Fishman, G. R. Whiteley, A. Mikulskis, S.
A. Kuzdzal, et al., A robust biomarker discovery pipeline for high-performance mass
spectrometry data. J. Bioinform. Comput. Biol., 2007, 5, 1023-1045.
134. M. Wilm, A. Shevchenko, T. Houthaeve, S. Breit, L. Schweigerer, T. Fotsis, et
al., Femtomole sequencing of proteins from polyacrylamide gels by nano-electrospray
mass spectrometry. Nature, 1996, 379, 466-469.
135. H. R. Morris, T. Paxton, A. Dell, J. Langhorne, M. Berg, R. S. Bordoli, et al.,
High sensitivity collisionally-activated decomposition tandem mass spectrometry on a
novel quadrupole/orthogonal-acceleration time-of-flight mass spectrometer. Rapid
Commun. Mass Spectrom., 1996, 10, 889-896.
136. M. Sharon, C. V. Robinson, The role of mass spectrometry in structure
elucidation of dynamic protein complexes. Annu. Rev. Biochem., 2007, 76, 167-193.
137. J. C. Schwartz, M. W. Senko, J. E. Syka, A two-dimensional quadrupole ion trap
mass spectrometer. J. Am. Soc. Mass Spectrom., 2002, 13, 659-669.
138. E. Denisov, E. Damoc, O. Lange, A. Makarov, Orbitrap mass spectrometry with
resolving powers above 1,000,000. Int J Mass Spectrom, 2012, 325, 80-85.
139. B. Domon, R. Aebersold, Mass spectrometry and protein analysis. Science, 2006,
312, 212-217.

46
140. J. V. Olsen, J. C. Schwartz, J. Griep-Raming, M. L. Nielsen, E. Damoc, E.
Denisov, et al., A dual pressure linear ion trap Orbitrap instrument with very high
sequencing speed. Mol. Cell. Proteomics, 2009, 8, 2759-2769.
141. Q. Hu, R. J. Noll, H. Li, A. Makarov, M. Hardman, R. Graham Cooks, The
Orbitrap: a new mass spectrometer. J. Mass Spectrom., 2005, 40, 430-443.
142. A. Makarov, E. Denisov, A. Kholomeev, W. Balschun, O. Lange, K. Strupat, et
al., Performance evaluation of a hybrid linear ion trap/orbitrap mass spectrometer. Anal.
Chem., 2006, 78, 2113-2120.
143. R. J. Chalkley, A. L. Burlingame, Identification of GlcNAcylation sites of
peptides and alpha-crystallin using Q-TOF mass spectrometry. J. Am. Soc. Mass
Spectrom., 2001, 12, 1106-1113.
144. L. M. Mikesh, B. Ueberheide, A. Chi, J. J. Coon, J. E. Syka, J. Shabanowitz, et
al., The utility of ETD mass spectrometry in proteomic analysis. Biochim. Biophys. Acta,
2006, 1764, 1811-1822.
145. J. E. Syka, J. J. Coon, M. J. Schroeder, J. Shabanowitz, D. F. Hunt, Peptide and
protein sequence analysis by electron transfer dissociation mass spectrometry. Proc. Natl.
Acad. Sci. U. S. A., 2004, 101, 9528-9533.
146. J. V. Olsen, B. Macek, O. Lange, A. Makarov, S. Horning, M. Mann, Higher-
energy C-trap dissociation for peptide modification analysis. Nat. Methods, 2007, 4, 709-
712.
147. P. Zhao, R. Viner, C. F. Teo, G. J. Boons, D. Horn, L. Wells, Combining high-
energy C-trap dissociation and electron transfer dissociation for protein O-GlcNAc
modification site assignment. J. Proteome Res., 2011, 10, 4088-4104.
148. X. Zhang, S. M. Leung, C. R. Morris, M. K. Shigenaga, Evaluation of a novel,
integrated approach using functionalized magnetic beads, bench-top MALDI-TOF-MS
with prestructured sample supports, and pattern recognition software for profiling
potential biomarkers in human plasma. Journal of biomolecular techniques : JBT, 2004,
15, 167-175.
149. C. Laronga, R. R. Drake, Proteomic approach to breast cancer. Cancer Control,
2007, 14, 360-368.
47
150. Y. Yasui, M. Pepe, M. L. Thompson, B. L. Adam, G. L. Wright, Jr., Y. Qu, et al.,
A data-analytic strategy for protein biomarker discovery: profiling of high-dimensional
proteomic data for cancer detection. Biostatistics, 2003, 4, 449-463.
151. H. Dong, W. Shen, M. T. Cheung, Y. Liang, H. Y. Cheung, G. Allmaier, et al.,
Rapid detection of apoptosis in mammalian cells by using intact cell MALDI mass
spectrometry. Analyst, 2011, 136, 5181-5189.
152. A. J. Madonna, F. Basile, I. Ferrer, M. A. Meetani, J. C. Rees, K. J. Voorhees,
On-probe sample pretreatment for detection of proteins above 15 KDa from whole cell
bacteria by matrix-assisted laser desorption/ionization time-of-flight mass spectrometry.
Rapid Commun. Mass Spectrom., 2000, 14, 2220-2229.
153. J. M. Hettick, M. L. Kashon, J. E. Slaven, Y. Ma, J. P. Simpson, P. D. Siegel, et
al., Discrimination of intact mycobacteria at the strain level: a combined MALDI-TOF
MS and biostatistical analysis. Proteomics, 2006, 6, 6416-6425.
154. T. C. Cain, D. M. Lubman, W. J. Weber, Differentiation of Bacteria Using Protein
Profiles from Matrix-Assisted Laser-Desorption Ionization Time-of-Flight Mass-
Spectrometry. Rapid Commun. Mass Spectrom., 1994, 8, 1026-1030.
155. S. Vaidyanathan, C. L. Winder, S. C. Wade, D. B. Kell, R. Goodacre, Sample
preparation in matrix-assisted laser desorption/ionization mass spectrometry of whole
bacterial cells and the detection of high mass (>20 kDa) proteins. Rapid Commun. Mass
Spectrom., 2002, 16, 1276-1286.
156. T. L. Williams, D. Andrzejewski, J. O. Lay, S. M. Musser, Experimental factors
affecting the quality and reproducibility of MALDI TOF mass spectra obtained from
whole bacteria cells. J. Am. Soc. Mass Spectrom., 2003, 14, 342-351.
157. B. L. Adam, Y. Qu, J. W. Davis, M. D. Ward, M. A. Clements, L. H. Cazares, et
al., Serum protein fingerprinting coupled with a pattern-matching algorithm distinguishes
prostate cancer from benign prostate hyperplasia and healthy men. Cancer Res., 2002, 62,
3609-3614.
158. E. T. Fung, V. Thulasiraman, S. R. Weinberger, E. A. Dalmasso, Protein Biochips
for Differential Profiling. Curr. Opin. Biotechnol., 2001, 12, 65-69.
159. L. A. Liotta, E. F. Petricoin, Serum peptidome for cancer detection: spinning
biologic trash into diagnostic gold. J. Clin. Invest., 2006, 116, 26-30.

48
CHAPTER 2
A COMPREHENSIVE AND INFORMATIVE METHODOLOGY FOR MALDI-TOF MS
PROFILING AND DISCRIMINATION OF BREAST CANCER CELLS
2.1 ABSTRACT
Matrix-assisted Laser Desorption/Ionization time-of-flight mass spectrometry (MALDI-
TOF MS), the state-of-the-art high-throughput technology, has been employed in
profiling of breast cancer cell lines leading to their discrimination based on mass spectral
fingerprints. The reported novel sample preparation strategy for profiling of mammalian
cells involves a one-step processing of whole cells to produce the sample from which
protein mass spectra are generated. Spectra were acquired in the m/z range 3000-20000
and consisted of the largest array of peaks ever to be reported in this range. Among the
cell lines profiled, NIH3T3 (murine) cells were used for method development while the
human breast cancer cell lines were used for method application. Analysis of the mass
spectral data by pattern recognition and learning classification methods has enabled us to
discriminate between the cancerous and non-cancerous cells lines, and between
metastatic and non-metastatic cell lines. Specifically, results of unsupervised clustering
show that the established MALDI-TOF MS strategy has the potential to discriminate
breast cancer cell lines, and therefore could be an alternative to Surface Enhanced Laser
Desorption Ionization (SELDI) TOF MS with ProteinChip. However, similar to SELDI
approach, the discrimination by the MALDI fingerprints requires further fine-tuning
using supervised classification. The reported results portray the one-step cell processing

49
method as an informative and simple way of profiling and classifying cells in a highly
cost-effective and reproducible manner. The comprehensive methodology has a potential
to expand the role of MALDI-TOF MS in several fields related to cell and tissue profiling
for disease diagnosis and therapy.
2.2 INTRODUCTION
Breast cancer is the second leading cause of cancer-related mortality in women1-2.
Although significant advances in early detection and treatment of breast cancer have been
made, a protein-based multiplex system that provides large array of informative signals
for cancer identification and prognosis is still limited3. As a step towards advancing the
future tools in cancer diagnostics, we focused our multivariate analytical tool for human
cell lines derived from breast cancers. These breast cancer cell lines represent some of the
key molecular tumor subtypes and serve as representative models for studying breast
cancers4-6. Profiling of such cells by the state-of-the-art high-throughput technologies
such as MALDI-TOF MS can lead to the discovery of potential diagnostic and prognostic
biomarkers of breast cancers7.
MALDI-MS is an analytical technique that uses laser irradiation of a matrix-
sample co-crystal to vaporize molecules for injection into a mass spectrometer to obtain
information on molecular weight8. The distinctive advantages over other ionization
techniques, such as electrospray ionization and atmospheric pressure chemical ionization,
lie in the soft ionization nature by which singly-charged ions are produced without
fragmentation of the fragile biomolecules (i.e. peptides, proteins, nucleic acids)9. In
addition, MALDI is usually coupled with a time-of-flight (TOF) analyzer to provide, in
theory, a potentially unlimited measurement of masses of macromolecules10. These
50
features, among others, have made MALDI-MS a popular analytical tool for the rapid,
sensitive and efficient detection of various analytes relevant to protein chemistry,
biotechnology, and cell and molecular biology9, 11-12.
MALDI-TOF MS protein profiling with or without protein identification has been
employed in the field of proteomics in the identification of bacteria and fungi and in the
discrimination of disease states of various cancers13-15. Although this mass spectrometric
approach for dissecting organisms and diseases does not reveal the entire proteome, the
mass spectra reflect a small but sufficient portion that can be used to characterize
organisms and diseases9, 16. The spectral patterns generated provide large arrays of
valuable information that permit classification at taxonomic and biological levels17. Such
a remarkable revelation of biological information requires, prior to analysis, appropriate
preparation of the sample18, a part of the MALDI-MS analytical technique that is often
challenging due to the complexity of biological samples, such as cells19-20.
There are thousands of different proteins in the cell co-existing with lipids,
carbohydrates and nucleic acids, and the total amount of protein varies significantly with
each cell type9. Moreover, some abundant proteins produce very strong ionization signals
that suppress signals from less abundant proteins, hiding the signals that carry
biologically important information21. Preparative methods, such as cell-sample
pretreatment, matrix selection , matrix solution conditions and spotting technique, also
affect the quality of the mass spectra18. Consequently, while in theory the MALDI-TOF
MS based approach is appealing, in practice, the sample preparation and the complexity
of the sample make the entire process quite arduous for obtaining informative and
reproducible mass spectral patterns22.
51
Since Cain et al. began profiling bacteria by MALDI-TOF MS and demonstrated
the potential of MS-based profiling in 1994, several investigations on bacterial cell
sample preparation, experimental factors involved and detection of high molecular
weight proteins for the improvement of MALDI-MS profiles have been documented23.
Vaidyanathan et al. investigated different sample preparation approaches to increase the
detection range of proteins from whole bacterial cells using MALDI-MS24; Williams et
al. explored the influence of experimental factors on mass spectra from whole-cell
bacteria by MALDI-MS17; and Madonna et al. published a methodology to enhance the
signal-to-base-line ratio of high molecular weight protein signals from bacteria by
MALDI-MS25. In contrast to the bacterial cells, mammalian cells exhibit an even greater
structural complexity, thereby making their analysis by mass spectrometry a more
challenging effort9. The cell culture methods and heterogenous cell populations
complicate the MALDI-MS profiling of mammalian cells, hence very few reports on
MALDI-MS profiling of mammalian cells have been published9, 26-30.
Herein, we report a comprehensive and informative methodology for the direct
and rapid protein profiling of whole mammalian cells. Our protocol, depicted on Figure
2.1, involves a simple and reproducible one-step sample processing for analyzing whole
mammalian cells by MALDI-TOF MS to produce mass spectral fingerprints of each cell
type, and a down-stream computational data analytic step for the discrimination of cell
types. The key step in our sample preparation is carried out by just a one-step operation,
rinsing of cells with a novel DHB- and Isopropanol-containing MALDI matrix solution A
(Figure 2.1) to simultaneously lyse cells and extract proteins. No additional purification
and fractionation of the cell sample are involved. Fewer sample preparation steps in
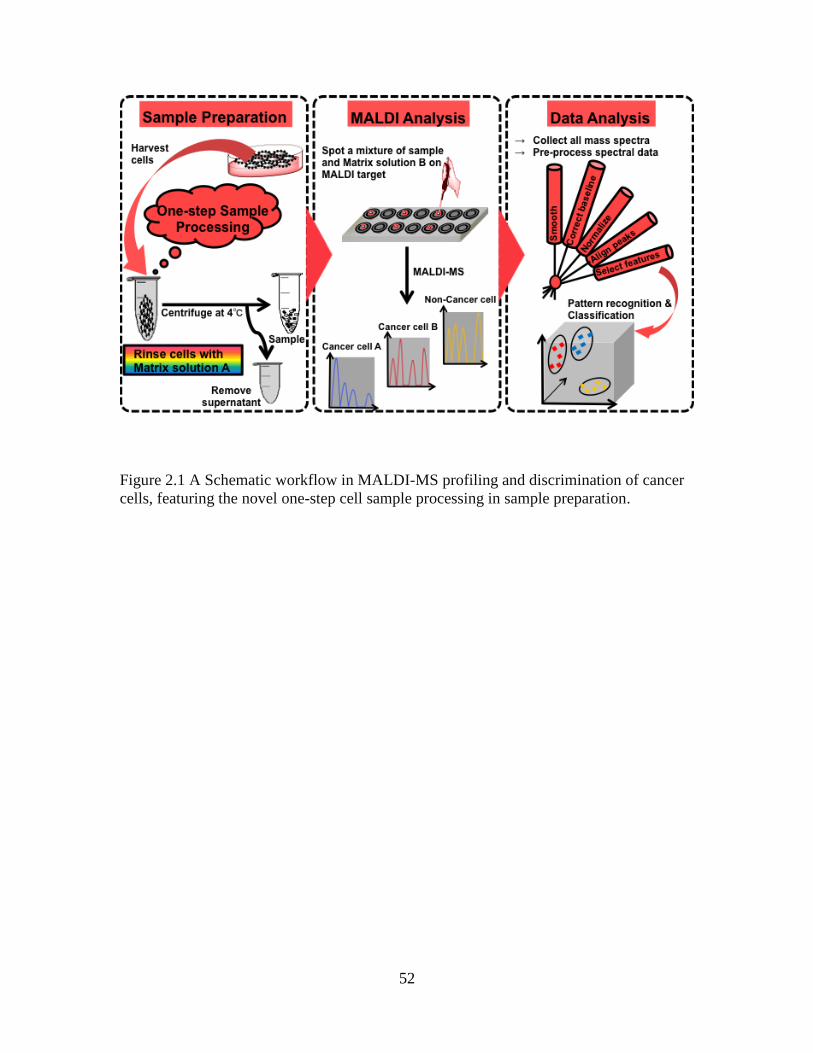
52
Figure 2.1 A Schematic workflow in MALDI-MS profiling and discrimination of cancer
cells, featuring the novel one-step cell sample processing in sample preparation.

53
comparison with previously published methods minimize the risk of poor reproducibility
thereby make the profiling methodology rapid and reliable9, 29-30. We firstly applied an in-
house data analytic pipeline, based on the preprocessing algorithms of the Bioinformatics
Toolbox (Mathworks, Natick, MA), pattern recognition and learning classification
algorithms, to analyze the complex mass spectral data. Secondly, we employed a
commercial software to further explore patterns in the data. The results show that
MALDI-TOF MS profiling can be employed in the discrimination of breast cancer cells
in a rapid, high-throughput and reproducible manner. This comprehensive and
informative methodology might be useful for the identification and analysis of cancerous,
stem, and differentiating cells.
2.3 EXPERIMENTAL SECTION
2.3.1 Materials
2,5-Dihydroxybenzoic acid (gentisic acid, DHB), 3,5-dimethoxy-4-hydroxycinnamic acid
(Sinapinic acid, SA), α-cyano-4-hydroxycinnamic acid (CHCA) and ammonium
hydrogencitrate (AHC) were purchased from Sigma-Aldrich, St. Louis, USA. 2’6’-
Dihydroxyacetophenone (DHAP) was purchased from Acros Organics, New Jersey,
USA. Dulbecco’s modified phosphate-buffered saline (DPBS) and all cell culture
reagents were purchased from Thermo Scientific Hyclone Laboratories, Inc., Utah, USA.
Deionized water (dH2O) was produced from a Millipore Purification System (18 MΩ·cm
at 25 ºC). MALDI matrix solution A (5 mg/mL DHB in [VC3H8O:VACN:VdH2O = 2:1:1])
was prepared by mixing equal volumes of isopropanol with that of 10 mg DHB/mL of
acetonitrile and dH2O (1:1). MALDI matrix solution B is a DHAP matrix solution
described by Wenzel et al.31. It was prepared by suspending 50 µmol DHAP in 375 µL

54
ethanol and 125 µL of 10 µmol ammonium hydrogencitrate (stock solution: 27 mg in 1.5
mL dH2O), and vortexing for at least a minute to dissolve the DHAP. The composition of
the SA matrix solution was 10 mg/mL SA in (VACN:VdH2O:VTFA = 10:10:1), while that of
CHCA matrix solution was 10 mg/mL CHCA in (VACN:VdH2O:VTFA = 30:70:1). NIH-3T3
cells were provided by Dr. Kim E. Creek (Center for Colon Cancer Research, University
of South Carolina). MCF-7 and MCF-10A cells were kind gifts from Dr. Hexin Chen
(Center for Colon Cancer Research, University of South Carolina). MDA-MB231
cellculture was obtained from the American Type Culture Collection (ATCC number
HTB26, ATCC, Manassas, VA, USA).
2.3.2 Cell Culture and Harvesting
The two human breast cancer cell lines, MCF-7 and MDA-MB231, and the mouse
embryonic fibroblast cell line, NIH-3T3 were maintained in high glucose Dulbecco’s
Modified Eagle’s Medium (DMEM) containing 4 mM L-glutamine, 1 mM sodium
pyruvate, and supplemented with penicillin (100 U/mL), streptomycin (100 µg/mL), and
10% foetal bovine serum (FBS) or 10% neonatal calf serum (NCS), respectively. The
human breast immortalized normal cell line MCF-10A was cultured in DMEM:F12
(50/50) medium containing similar supplements as the DMEM above in addition to 10
µg/mL insulin, 20 ng/mL epidermal growth factor, 100 ng/mL cholera toxin and 0.5
µg/mL hydrocortisone. All cell cultures were maintained at 37 ºC and 5% CO2 in air in a
humidified incubator. Cells were cultured in triplicates in T75 flasks for 2 days. At about
80% confluence, cells in one of the flasks were trypsinized and passaged in a split ratio of
1:3. Cells from the other two flasks were also trypsinized, transferred to 15 mL Falcon
tubes and harvested by 5 min centrifugation in a Beckman Coulter Benchtop centrifuge at
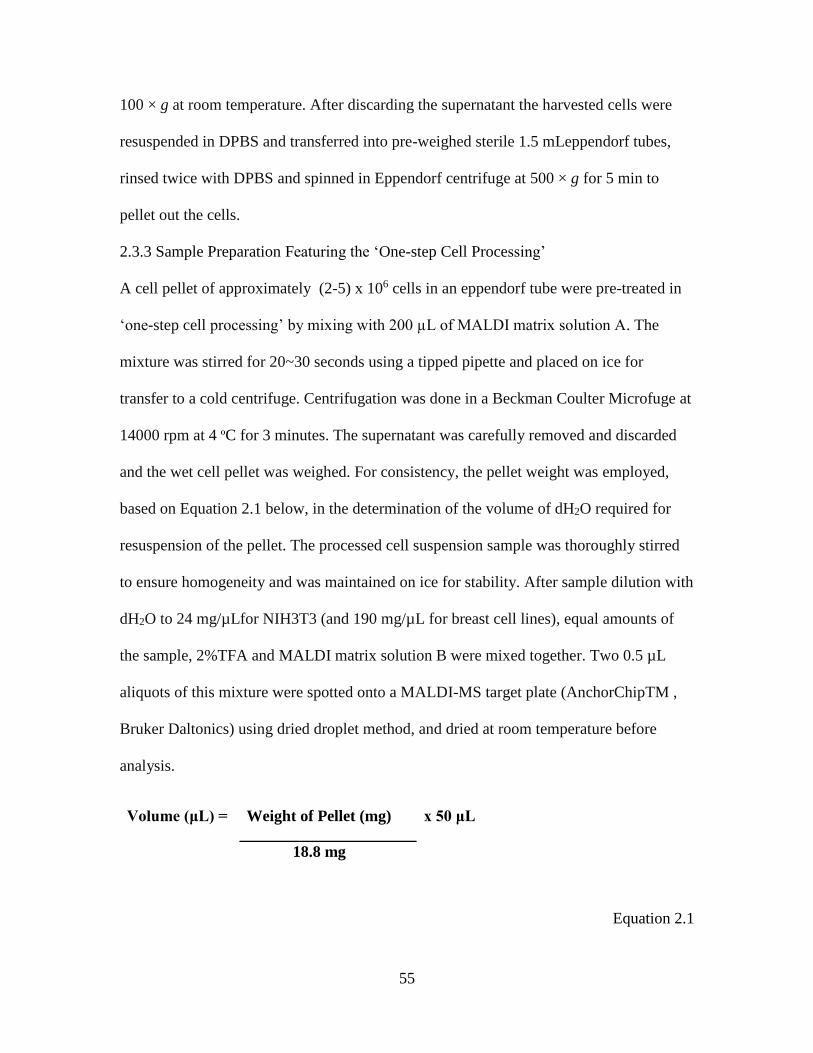
55
100 × g at room temperature. After discarding the supernatant the harvested cells were
resuspended in DPBS and transferred into pre-weighed sterile 1.5 mLeppendorf tubes,
rinsed twice with DPBS and spinned in Eppendorf centrifuge at 500 × g for 5 min to
pellet out the cells.
2.3.3 Sample Preparation Featuring the ‘One-step Cell Processing’
A cell pellet of approximately (2-5) x 106 cells in an eppendorf tube were pre-treated in
‘one-step cell processing’ by mixing with 200 µL of MALDI matrix solution A. The
mixture was stirred for 20~30 seconds using a tipped pipette and placed on ice for
transfer to a cold centrifuge. Centrifugation was done in a Beckman Coulter Microfuge at
14000 rpm at 4 ºC for 3 minutes. The supernatant was carefully removed and discarded
and the wet cell pellet was weighed. For consistency, the pellet weight was employed,
based on Equation 2.1 below, in the determination of the volume of dH2O required for
resuspension of the pellet. The processed cell suspension sample was thoroughly stirred
to ensure homogeneity and was maintained on ice for stability. After sample dilution with
dH2O to 24 mg/µLfor NIH3T3 (and 190 mg/µL for breast cell lines), equal amounts of
the sample, 2%TFA and MALDI matrix solution B were mixed together. Two 0.5 µL
aliquots of this mixture were spotted onto a MALDI-MS target plate (AnchorChipTM ,
Bruker Daltonics) using dried droplet method, and dried at room temperature before
analysis.
Volume (μL) = Weight of Pellet (mg) x 50 μL
18.8 mg
Equation 2.1
56
2.3.4 MALDI-TOF MS Analysis
Mass spectra were generated with a MALDI-TOF mass spectrometer (Ultraflex I
TOF/TOF, Bruker Daltonics) operated in linear delayed extraction positive ion mode.
Nitrogen laser (λ = 337 nm) at a frequency of 20 Hz was employed for desorption/
ionization and a mass range from 3000 Da to 35000 Da was selected. Spectra were
calibrated using Protein Calibration Standard I (Bruker Daltonics), based on the average
values of [M+H+]+ of insulin, ubiquitin I, cytochrome C, myoglobin, at ‘mass/charge’,
(m/z) 5734.56, 8565.89, 12361.09, and 16952.55, respectively. The mass accuracy was on
the order of 0.05%. A total of 2000 shots was taken from two spots of the same sample.
2.3.5 Data Analysis
2.3.5.1 Preliminary Analysis
In the establishment of the sample preparation strategy, minimal data analysis was carried
out. Spectra were overlaid and visually examined for presence of peaks, which was
evidence that proteins were detected; differences and similarities in peak location and
intensities, reflecting on different proteins and their relative abundances; and observable
drift in baseline, an indicator of the quality of the spectrum. Spectra with minimal or no
observable drift in baseline were considered for evaluations of the sample preparation
strategy.
2.3.5.2 Using Data Analytic Pipeline of Morgan et al.32
In the application of the established sample preparation strategy, for protein profiling of
breast cancer cell lines, two data analytic routines were utilized, one that was developed
and used by Morgan et al.32 and the other, a commercial software, BioNumerics version
7.3.1 (Austin, Texas; www.applied-maths.com), following the instructions provided. The
57
Morgan data analytic pipeline consists of preprocessing, pattern recognition, and
classification utilities written in MatLab (The Mathworks, Natick, MA). The dataset
consisting of 73 spectra/samples of the breast cancer cell lines, shown on Figure 2.9, was
generated following the optimized sample preparation method. The raw spectra were
exported as ASCII files and converted to CSV files before being uploaded into Matlab.
Prior to statistical analyses spectra were preprocessed using routines from the Matlab
bioinformatics toolbox. Each of these spectra initially had total features of about 130,600
different ion masses from m/z 3000 to 30000. Given the lack of discriminating
information at feature values higher than m/z 25000, only about 100,600 feature values
below m/z 25,000 were used for further analysis.
Upon preprocessing the resampling algorithm in the Matlab bioinformatics
toolbox was then employed to reduce the data to 8,000 mass features per spectrum. This
algorithm was designed for complex mass spectrometric data to preserve significant
peaks heights while eliminating features representing noise. The data was then broken
into three data sets containing three combinations: (1) normal versus non-metastatic (47
samples), (2) normal versus metastatic (36 samples), and (3) non-metastatic versus
metastatic (63 samples). For each of these comparisons, further feature selection was
performed using single-feature two-group t-tests to select m/z values of high
discriminating power. Features were retained for further analysis if they were associated
with a calculated Student’s t-statistic larger than the critical value of t (Bonferroni-
corrected error rate of 0.05). This strategy produced number of features ranging from 230
to 301, which were then used for principal component analysis.
2.3.5.3 Using the Commercial BioNumerics Data Analytic Procedure

58
Alternatively, the data files of the 73 spectra were imported into the BioNumerics
software interface and preprocessed using the given methods. Upon peak detection, peak
matching was done to create peak classes that represent detected proteins. In
BioNumerics a peak is defined on the basis of the spectrum during preprocessing while a
peak class is defined on a basis of a group of spectra and peak classes are generated
during peak matching. Many peaks may have been detected at a signal-to-noise ratio of 5
during spectral preprocessing, but 109 peak classes, corresponding to expressed proteins,
were created during the subsequent peak matching. On the basis of these 109 proteins,
relationships among the samples were determined by cluster analyses.
2.3.5.3.1 Cluster Analysis
Cluster analysis is a multivariate procedure of pattern recognition that detects natural
groupings in data and examines similarities and dissimilarities between observations33.
BioNumerics software was used according to the UPGMA algorithm to obtain
hierarchical agglomerative clustering of the data. This algorithm constructs a rooted tree
(dendogram) that reflects the structure of a similarity matrix in a pairwise comparison
where the distance between two clusters is the distance between the average over the
elements of each cluster. The distances were measured with Pearson Correlation, as a
similarity metric.
2.3.5.3.2 Principal Component Analysis (PCA)
Similar to the hierarchical clustering, PCA is also a clustering method that operates
without any prior knowledge of grouping34. However, PCA is a mathematical procedure
for reducing dimensionality of data. It extracts variance in the data and simultaneously
transforms possibly correlated variables into a smaller number of uncorrelated variables,
59
the principal components, which are linear combinations of the original variables. The
first principal component accounts for as much of the variance in the data as possible
while the other components account for the remaining maximum proportion of the
variance. PCA computation, involving covariance matrix and standardized principal
component scores, was performed using BioNumerics and the in-house pipeline of
Morgan et al.32
2.4 RESULTS AND DISCUSSION
In this study we used NIH-3T3 cell line as a model for developing the MALDI-MS cell
profiling method since it can be easily cultured and represents a stable, and fast growing
cell line35. Despite the complexity of the sample and limited details on MS profiling of
mammalian cells, we focused our work to two areas. The first goal was to develop an
optimum sample preparation method for MALDI-TOF MS characterization of different
mammalian cell types in a fast and reproducible manner. Such a method should permit
protein fingerprinting of mammalian cells in the range of 3000-30000 so as to facilitate
the differentiation of cells. If such a method could generate a large number of peaks,
especially above m/z 15000, an upper limit obtained by Zhang et al.,30 it would increase
the chance of generating unique spectral profiles25 that contain more information about
the differences and similarities among mammalian cell types.
The second goal was to use the established method to obtain distinctive spectra of
the breast cancer cell lines and to classify the cell lines based to their spectral
fingerprints. For the purpose of establishing the desired methodology, we investigated
several matrixes that include DHB30, SA20, 28, CHCA27, and DHAP31, 36; organic solvents
such as chloroform, acetone, ethanol25, methanol23, isopropanol19, acetonitrile, and

60
trifluoroacetic acid; and matrix additives such as di-ammonium hydrogen citrate31, that
have previously been used in MALDI analyses37. The purpose of matrix solvents and
additives is to enable the release of proteins from the cells while the matrix aids in the
ionization of proteins and thus influences the mass range of the proteins detected36.
2.4.1 MALDI-TOF MS Profiling: Method Development using NIH3T3 Cell Line
2.4.1.1 Establishment of the Sample Preparation Protocol
Since it is well appreciated that the optimization of key parameters in sample preparation
is empirical and that the discovery of a desirable method is a matter of trial-and-error
experimentation38, we sought to find out if spectra with protein peaks spanning a wide
mass range i.e. 3000-20000, would be obtained from MALDI-MS analysis of whole-cell
NIH3T3 pellet rinsed with ACN solution (VACN:VdH2O:VTFA = 10:10:1), DHB matrix
solution (10 mg/mL DHB in VACN:VdH2O:VTFA = 10:10:1) or just water. Rinsing cells
with DHB matrix solution was a strategy used by Zhang et al. who first reported MALDI
spectral profiles of mammalian cells in the m/z range 4000-1600030. Our hypothesis was
that changing the composition of the DHB rinsing solution in a similar manner as those
who attempted to generate high-mass spectral profiles for bacteria ( i.e. varying matrixes,
their solvents and additives), might result in observation of peaks with m/z > 16000. For
spotting samples on the target plate, we initially applied the matrixes, DHB, DHB mixed
with CHCA (VDHB:VCHCA = 1:1), and a mixture of DHB, CHCA and SA
(VDHB:VCHCA:VSA = 1:1:1), since DHB is a suitable matrix for proteins in complex
biological mixtures30. All samples were spotted onto a prestructured (AnchorChip 600)
target plate by the common dried droplet method24. From these attempts, we obtained
spectra with few or no peaks at all. The useful spectra consisted of about 20 peaks in the

61
mass range 4000-16000 and were obtained, as shown on Figure 2.2, from cells rinsed
with DHB in water (NIH3T3 [ spectrum A]) or acetonitrile solution (BHK [spectrum B]
and HeLa [spectrum C]), and spotted with a co-matrix of DHB and CHCA. Although
these spectra could be reproduced, they lacked peaks above m/z 16000.
We then diversified both our rinsing solution and spotting matrix by involving
different organic solvents and matrixes. Sonication and rinsing of samples with aqueous
chloroform solution (VCHCl3:VdH2O = 1:1) to delipidate the cells resulted in spectra with
number of peaks in the range 50-80, having slightly higher intensities compared to the
former spectra consisting of about 20 peaks . However, hardly any peaks with m/z
>16000 were obtained from the chloroform-treated sonicated samples irrespective of the
spotting matrix (Figure 2.3). The number of peaks was further elevated to ≥100 when the
DHB-rinsed instead of chloroform-rinsed samples were homogenized with with a 26-G
needle fixed to a 1 mL syringe and spotted with DHAP matrix (Figure 2.4). Action of
needle and syringe increases the surface area for proteins within the rubble of the
complex cell material to be effectively mixed and co-crystallized with the matrix, and
may have positive effect on the MALDI process. However, sonication of syringe-
processed samples resulted in low-quality spectra with fewer peaks and lower intensities
(Figure 2.4 – spectrum E), making it unsuitable for mammalian cell sample preparation.
Varying sample processing conditions without changing the DHAP spotting matrix
influenced our choice of DHAP as a suitable spotting matrix for mammalian cells,
especially since peaks with m/z around 20000 were observed.
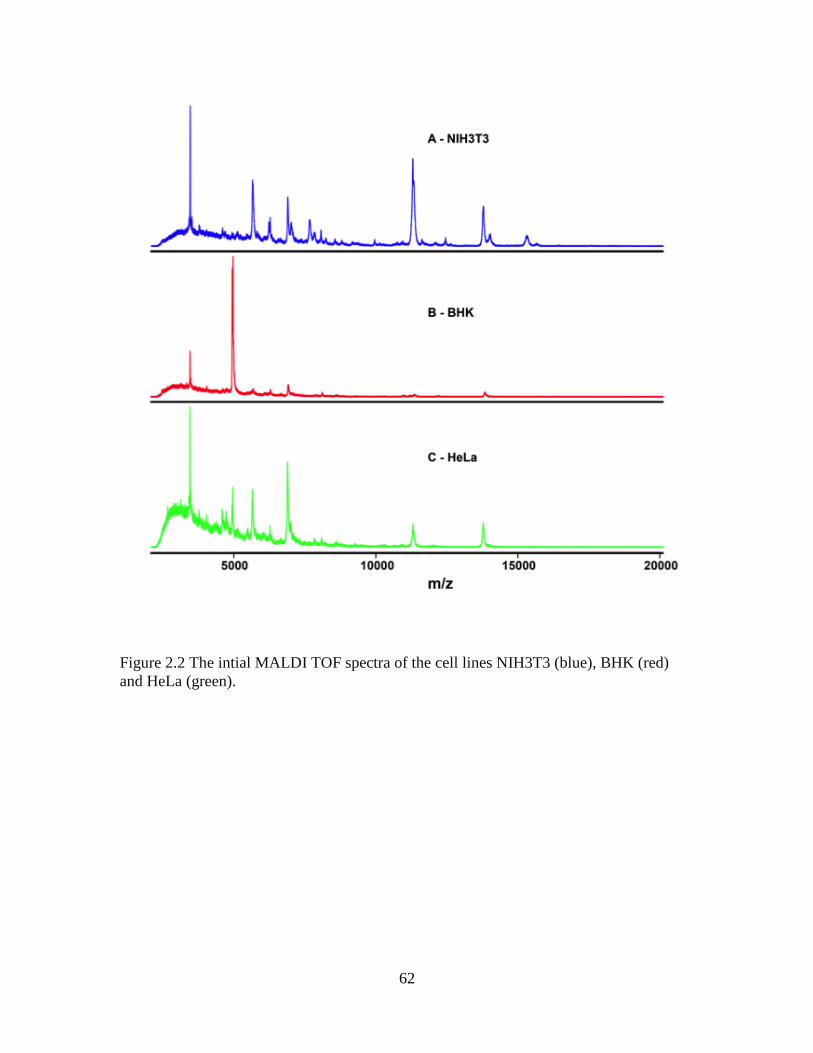
62
Figure 2.2 The intial MALDI TOF spectra of the cell lines NIH3T3 (blue), BHK (red)
and HeLa (green).

63
Figure 2.3 Spectra of NIH3T3 cells generated after rinsing cells with a mixture of
chloroform and water (1:1, v/v), in the presence or absence of sonication or
homogenization by syringe and needle, and after spotting samples with different MALDI
matrix compounds. Hardly any peaks with m/z >16000 were obtained. Blue-, red-, green-
and magenta-colored spectra – samples were sonicated or homogenized before rinising
and spotted with DHAP, DHAP mixed with AHC, DHB and SA matrixes, respectively.
The black-colored spectrum was recorded from MALDI analysis of the sample that was
not sonicated.
64
With further modifications of the rinsing solution, the number of peaks were
increasing. Figure 2.5 shows effect on the cell spectra of the five different cell rinsing
solutions: DHB/isopropanol, DHB, DHB/methanol, SA, and DHAP, respectively. Of
these five, DHB/isopropanol resulted in peaks at m/z 16000 and overall higher intesities
for many peaks. Hence, the DHB/isopropanol rinsing solution was optimized to find the
DHB and isopropanol proportions that could lead to spectra with high number of peaks.
Use of the optimized novel rinsing matrix solution of the composition 5 mg/mL DHB in
(VC3H8O:VACN:VdH2O= 2:1:1) and the established DHAP spotting matrix solution31
resulted in spectra with more than 200 peaks. More specifically, spectra of about 200
peaks were obtained in the m/z range 3000-20000 when using these two optimized matrix
solutions, one for rinsing the cells, called “matrix solution A”, and the other for spotting
the cell sample, referred to as “matrix solution B”. The whole analysis was completed in
30-45 min, the shortest time ever for MALDI profiling of cells.
In spite of the novelty of our sample preparation, there are other sample
preparation strategies for MALDI profiling of mammalian cells that have been published
(Table 2.1). These strategies differ with respect to the MALDI reagents and
methodologies used. While spectral profiles with unique peaks were obtained using these
strategies, certain features make them less suitable for robust profiling with the ultimate
goal of application in disease diagnostics. For example, sample pre-treatment involving
fractionation and sample clean-up as was respectively done by van Adrichem et al.9 and
Lokhov et al.29 makes the profiling seem tedious and costly. Also, spectra generated by
Marvin-Guy et al.20 and Dong et al.27 from minimally processed cell samples, without
rinsing and extraction steps, did not have any peaks above m/z 16000. Our method was

65
Figure 2.4 Spectra of needle- and syringe-homogenized, DHB-rinsed and DHAP-spotted
NIH3T3 samples showing peaks above m/z 16000. Blue –cell pellet rinsed before
homogenization, red – cell pellet homogenized after addition of DHAP spotting matrix,
green – cell suspension in DHB not pelleted, magenta – cell pellet rinsed with water
instead of DHB, and black – the homogenized cell pellet had been sonicated before
spotting.
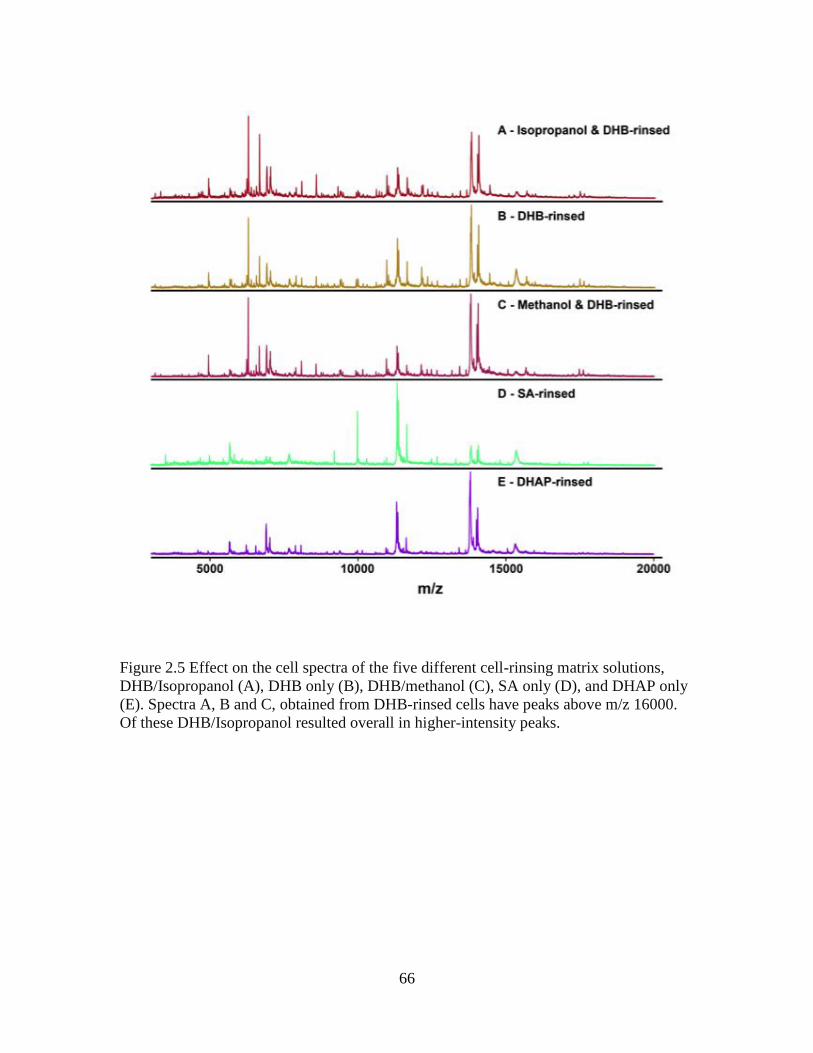
66
Figure 2.5 Effect on the cell spectra of the five different cell-rinsing matrix solutions,
DHB/Isopropanol (A), DHB only (B), DHB/methanol (C), SA only (D), and DHAP only
(E). Spectra A, B and C, obtained from DHB-rinsed cells have peaks above m/z 16000.
Of these DHB/Isopropanol resulted overall in higher-intensity peaks.

67
adopted from Zhang et al.30 who simultaneously processed cells by rinsing, lysis, and
extraction, and possibly desalted them, using DHB solution. One solution was used to
perform four tasks in one step, a strategy that makes sample preparation time-, and cost-
effective. However, unlike in Zhang et al.30 where only DHB solution in water was used
to lyse cells and extract proteins directly from cells without any sample clean-up, we
useda solution of DHB, isopropanol and acetonitrile for rinsing cells, cell lysis and
protein extraction.
While Zhang et al.30 reported spectra in the m/z range 4000-16000, we obtained
typical spectra with m/z range 3000-20000. We believe that addition of a mixture of
organic solvents (i.e. acetonitrile – efficient extraction solvent; and isopropanol – a
lipophilic solvent with good extraction properties) and a mild acid to the cells followed
by vigorous mixing resulted in simultaneous lysis of the cells, extraction and
solubilization of some lipids from the cell membrane, and extraction and precipitation of
both the hydrophilic and hydrophobic proteins directly from the cells. Since cell
membrane proteins co-exist with lipids, extraction of lipids exposes proteins and makes
them more accessible than would do mild acid treatment alone. When the sample-rinsing
matrix solution mixture was spinned down at 4 ºC, the extracted proteins were retained in
the pellet while the lipids were removed with the supernatant. Subsequent spotting of the
dH2O-diluted and 2% TFA-acidified cell pellet onto a prestructured MALDI target with
DHAP matrix solution resulted in the generation of peaks up to m/z 20000. Since we
modified the composition of both the rinsing matrix solution and the spotting matrix
solution in sample preparation to extend the m/z range of peaks from 4-16k to 3-20k,
further modifications of these two solutions could lead to acquisition of spectra in higher.

24 6
8
Table 2.1 Previously used and currently proposed MALDI-TOF MS profiling strategies for mammalian cells9, 20, 29-30
Different MALDI-TOF MS Profiling Strategies
van Adrichem et al.,
1998
Zhang et al., 2006 Marvin-Guy et al.,
2008
Lokhov et al., 2009 The One-step Cell
Processing
Key Steps in Sample
Preparation
Washing of Cells PBS PBS - 0.9% NaCl PBS
Rinsing of Cells - DBH/water - Cold trypsin in 0.9%
NaCl
DBH/water/ACN/
Isopropanol
Cell Lysis Lysis buffer DBH/water - - DBH/water/ACN/
Isopropanol
Extraction - DBH/water - - DBH/water/ACN/
Isopropanol
MS Sample Pre-
treatment
Detergent for removal
of lipids
- - ZipTipC18 for
desalting
DBH/water/ACN/
Isopropanol
Sample Dilution - DBH/water 0.1% TFA - 2% TFA
Spotting Matrix Ferulic acid CHCA; SA SA DHB DHAP/AHC
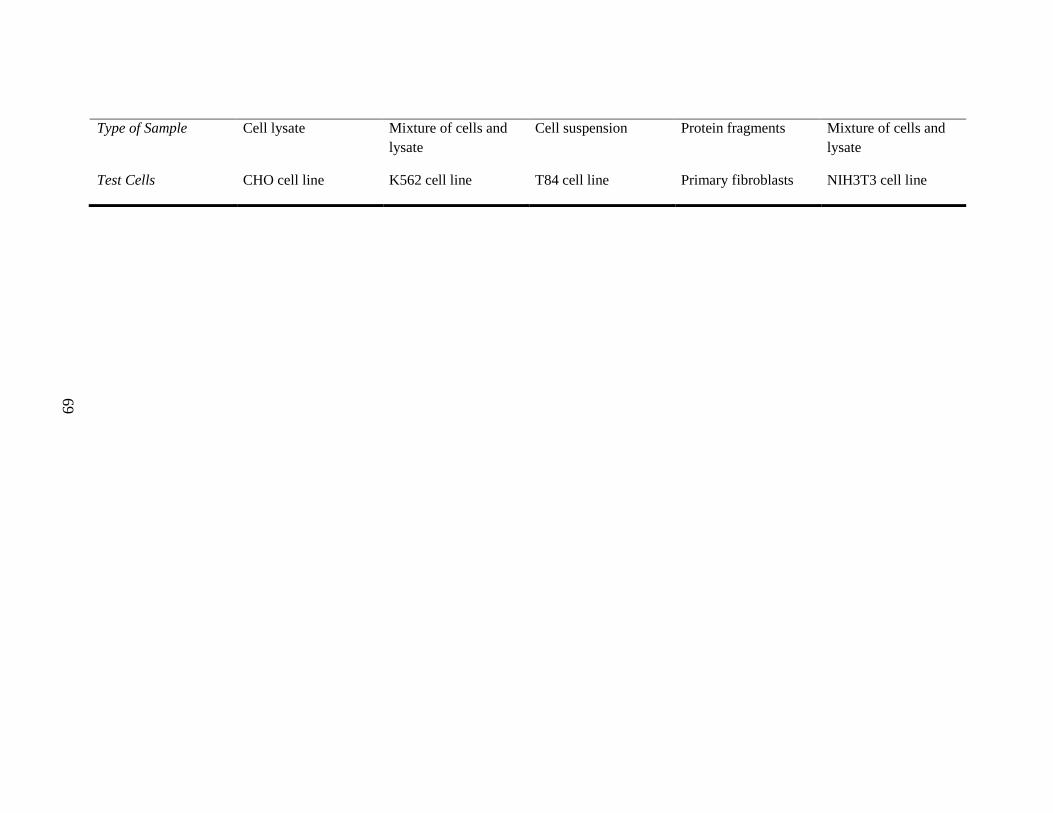
24 6
9
Type of Sample Cell lysate Mixture of cells and
lysate
Cell suspension Protein fragments Mixture of cells and
lysate
Test Cells CHO cell line K562 cell line T84 cell line Primary fibroblasts NIH3T3 cell line

70
mass range (i.e. >20k) that could precede generation of more unique MALDI fingerprints
for cells and greater potential for discovery of unique biomarkers. Such changes would
still require optimization of key steps to ensure reproducibility and reliability of MALDI
profiles39
2.4.1.2 Determination of the suitable Cell Concentration
Successful comparison of spectral patterns has been reported to be dependent on the
reproducibility of mass spectra16, 40. Poor reproducibility, as shown by inconsistent
appearance of peaks, can lead to gross errors41. Cell concentration is one of the
experimental factors with strong effect on the observed mass spectra17, and hence their
reproducibility. Previous studies on bacterial profiling have shown that less satisfactory
spectra with fewer peaks could be resulted from samples with either too high or too low
cell concentrations42-43. In this study a cell concentration higher than 380 mg/L and
lower than 12 mg/L yielded mass spectra that could not be reproduced and had raised
base line, respectively (data not shown). This implies that there is an optimal
concentration range that could give good quality spectra, and this is in agreement with
above-mentioned published reports.
The effect of cell concentration on the number of peaks was investigated by
profiling varying concentrations of the processed NIH3T3 cell pellet. After the one-step
processing, the cell pellet weighing 18.8 mg was dispersed in cold 50 µL dH2O to make
sample A. Next, this sample was serially diluted in a 1:1 ratio resulting in 9 different
samples with the concentrations 380, 190, 95, 47, 24, 12, 6, 3, and 1 mg/L, respectively.
The experiment was performed in triplicates. The spectra of the first six samples from
one of the triplicate experiments are shown in Fig 2.6. The corresponding number of

71
peaks in these samples were 143, 215, 225, 272, 285, and 261, respectively. It was
observed that as the cell concentration decreased, the number of peaks in a spectrum
increased for the first five concentrations but decreased with further sample dilution. The
24 mg/L cell concentration not only yielded the largest average number of peaks but it
also resulted in repeatable spectra characterized by lowest variability or smallest standard
deviation of the average number of peaks (Figure 2.6). From these results we conclude
that the optimum cell concentration for MALDI profiling of NIH-3T3 cell line is around
24 mg/L. Using the same strategy the optimum concentration for MALDI profiling of
the breast cancer cell lines was around 190 mg/L (Section 2.4.2 below).
2.4.1.3 Short-term Stability of the Cell Sample
Apart from the cell concentration, other experimental factors such as time and
temperature of sample preparation and storage are important for whole cell analysis since
they influence stability of the proteins. The stability of protein samples during
preparation could be improved through inhibition of activity of endogenous proteases by
maintenance of samples on ice or addition of a protease inhibitor. This short-term
stability was investigated in two ways: 1) processing two parallel samples, one with and
one without protease inhibitor (2 mM phenylmethylsulfonyl fluoride, AMRESCO, Solon,
OH, USA); and 2) varying the time between the one-step sample processing and
application of matrix while keeping samples on ice at 0 ºC.
Figure 2.7 shows mass spectra of samples processed in the absence and the
presence of protease inhibitor, respectively. No differences were observed between these
two spectra. This implies that during time of processing of about 20-30 min at 0 ºC
protease activity, if any, is minimized and the integrity of the sample is maintained.

72
Figure 2.6 Right panel: The bar graph of the average peak numbers and standard
deviations of spectra generated from triplicate samples of NIH3T3 cells sequentially
diluted into six concentrations 380, 190, 95, 47, 24 and 12 mg wet cell pellet weight/L
water. 24 mg/L was found to be the optimum concentration because it resulted in a
combination of large number of peaks and a small standard deviation. The error bars
represent standard deviation. Left panel: Representative spectra from each of the six
dilutions. Although the spectra are similar the average number of peaks increase with
decreasing concentrations and plateaus at 47 mg/L onwards.

73
Therefore protease inhibitor is not needed. In addition, sample stability was tested by incubation
of multiple samples on ice at different time durations, i.e. 0 h, 3 h, 5 h and 19 h, before
application of the spotting matrix. The aim was to see if the spectra would be the same if the
samples are left on ice prior to MALDI MS. In this experiment, sample preparation (i.e. one-
step processing) and parameters for instrumental analysis were kept the same for all
samples while duration prior to MALDI analysis was varied. Mass spectra of the 0 h, 1h,
3 h and 5 h cell samples expressed nearly all same peaks while differences such as at m/z
3457 and 15848 were observed between these four samples and the 19h sample (Figure
2.8). Stability of the samples is not affected by long incubation on ice prior to MALDI
analysis, but repeatability might be compromised. Nonetheless, short or no incubation is
essential to ensure the rapidness of the analytical methodology.
2.4.2 Application of the Established Methodology in Discrimination of Breast Cancer
Cells
Traditional approaches to analysis of biochemical systems associated with human disease
involve study of biochemical transformations and identification of target molecules.
Typically such studies vary only a few experimental factors thought apriori to be relevant
with the result that they reduce complexity of research hypothesis but may preclude
important information that would better characterize the complexity and diffusivity of the
same biochemical systems. With the growth of the “omics” technologies it has been
possible to characterize these biochemical systems on the basis of fingerprints displayed
by their cellular proteins of previously unknown identities. The key is to record, in a
single analysis, in the form of a profile, the relative abundances and masses of several
hundreds or thousands of proteins measured. MALDI-TOF MS provides this information
in a high-throughput, simple and rapid manner44. The spectral fingerprints generated by

74
Figure 2.7 Mass spectra showing no effect from treatment of NIH3T3 with PMSF
protease inhibitor. Blueviolet – spectrum from inhibitor-treated cells and firebrick –
spectrum from control.

75
Figure 2.8 Spectra showing effect of short-term stability when incubated on ice prior to
MALDI analysis. The middle column has the actual spectra while the two side columns
are zoom-in views of the peaks at m/z 3457 and 15848. The spectra from 0 h, 1 h, 3 h and
5 h samples had nearly all same peaks while differences such as at m/z 3457 and 15848
were observed between these four samples and the 19 h sample. To ensure repeatability,
samples should not be kept too long on ice prior to MALDI analysis.

76
the MALDI-TOF MS are highly dimensional data that require application of
bioinformatics and multivariate statistical methods for pattern recognition and revelation
of distinguishing features. In the case of cancer, for instance, different biological samples
such as body fluids, biopsies and intact tissues have been profiled using MALDI MS to
establish and rapidly screen for disease biomarkers. However, regarding breast cancer,
few attempts have been made to profile the breast cancer cell lines, the very essential and
widely used systems in studying the complex breast cancer pathobiology and in screening
of newly developed therapeutics.
2.4.2.1 Subtypes and profiling of breast cancer
Breast cancers are molecularly heterogeneous manifestations of one disease45. They have
been grouped into five subtypes that are not only biologically distinct but also have
specific clinical course and response to treatment46. The five molecular subtypes are
luminal A, luminal B, ERBB2-overexpressing, basal-like and normal-like47. Luminal A
and B tumors express markers of the luminal epithelial cells lining the normal breast
ducts and are ER-positive. The basal-like tumors express markers of the basal epithelial
cells lining the normal breast ducts and are ER-negative. The ERBB2-overexpressing
tumors express genes co-amplified with ERBB2 that encodes HER2 and are HER2-
positive. Normal-like tumors share expression patterns of the normal breast tissue. Of
these, the basal-like breast cancer has poor prognosis and hardly any treatment48.
To improve the understanding of the breast cancer phenotypes, the merits of
integrated genomic and proteomic profiling of the breast cancer cell lines have been
appreciated49. A comprehensive comparison of the molecular and biological features of a
collection of 51 breast cancer cell lines with those of primary tumors performed by Neve
77
et al. revealed that the breast cancer cell lines resemble primary tumors with respect to
genomic and transcriptional abnormalities as well as response to pathway-targeted
therapeutic agents6. Similarly Kao et al. profiled gene expression and DNA copy number
alterations of 52 widely used breast cancer cell lines and made same observations50.
Based on the resemblance of cell lines to primary tumors, the breast cancer cell lines have
been categorized into 3 subtypes: luminal, basal A and basal B. Luminal cell lines are
ER-positive. Basal A cell lines are associated with BRCA1 expression. Basal B cell lines
display mesenchymal and stem cell properties and have upregulated EMT51. Both basal A
and basal B cell lines share same expression patterns of the basal-like tumors while
luminal cell lines resemble either luminal A or luminal B tumors.
It is evident from the works of Neve and Kao and their co-workers that genomic
and proteomic analyses of breast cancer cell lines can accurately reflect how genes
contribute to breast cancer pathophysiology. Proteomic profiling of breast cancer cell
lines has been previously undertaken using surface-enhanced laser desorption/ionization
(SELDI) ProteinChip™ arrays52. The cell lines were successfully sub-classified into
similar groups as with corresponding earlier gene expression and immunohistochemistry
studies. A diagnostic protein signature was developed and new biomarkers identified.
The study demonstrated that MS-based methods can be reliably employed in profiling of
breast cancer cell lines. While the SELDI MS profiling involved a lengthy sample
preparation procedure due to prior incubation of protein sample with the chip and
subsequent purification, our MALDI-TOF MS profiling strategy involves just a one-step
cell sample processing, the procedure of which is simple and rapid. Our goal was to use
this established MALDI-TOF MS-based method as an alternative to rapidly profile breast
78
cancer cell lines and to demonstrate their discrimination based on the biological
differences captured in the spectral fingerprints, a feature that is invaluable for
development of diagnostic tool and biomarker discovery. In this study, the cell lines
profiled were MCF-7, MCF-10A, MDA-MB231, MDA-MB468, SKBR-3 and T47-D,
and their characteristics are shown in Table 2.2.
Six but one of these cell lines are human breast cancer cell lines widely used as in
vitro tumor models. MCF-10A is an immortalized normal breast cell line derived from
fibrocystic disease and commonly used as a non-cancerous control in breast cancer
studies53. Previous studies on gene expression microarray and immunohistochemical
analyses, as well as SELDI MS profiling have shown that MCF-7, SKBR-3 and T47-D
share characteristics of the luminal-like tumors while MCF-10A and MDA-MB231 share
same characteristics as the basal-like tumors54. MDA-MB468 was not included in that
study. Since SELDI MS, a MALDI MS-related analysis could reveal distinct groups as
with other biochemical approaches, we hypothesized that MALDI-TOF mass spectral
fingerprinting following pre-treatment of breast cancer cell lines using the one-step cell
sampling processing should result not only in similar groupings but also in observation of
some known and possibly new disease biomarkers. To test this hypothesis, an inhouse
bioinformatics pipeline and a commercial software were applied in analyses of mass
spectral data of six breast cell lines. The specific aim was to distinguish the metastatic
cell lines, MDA-MB231 and MDA-MB468 from the non-metastatic cell lines, MCF-7,
SKBR-3 and T47-D, and in turn, from the normal cell line, MCF-10A.
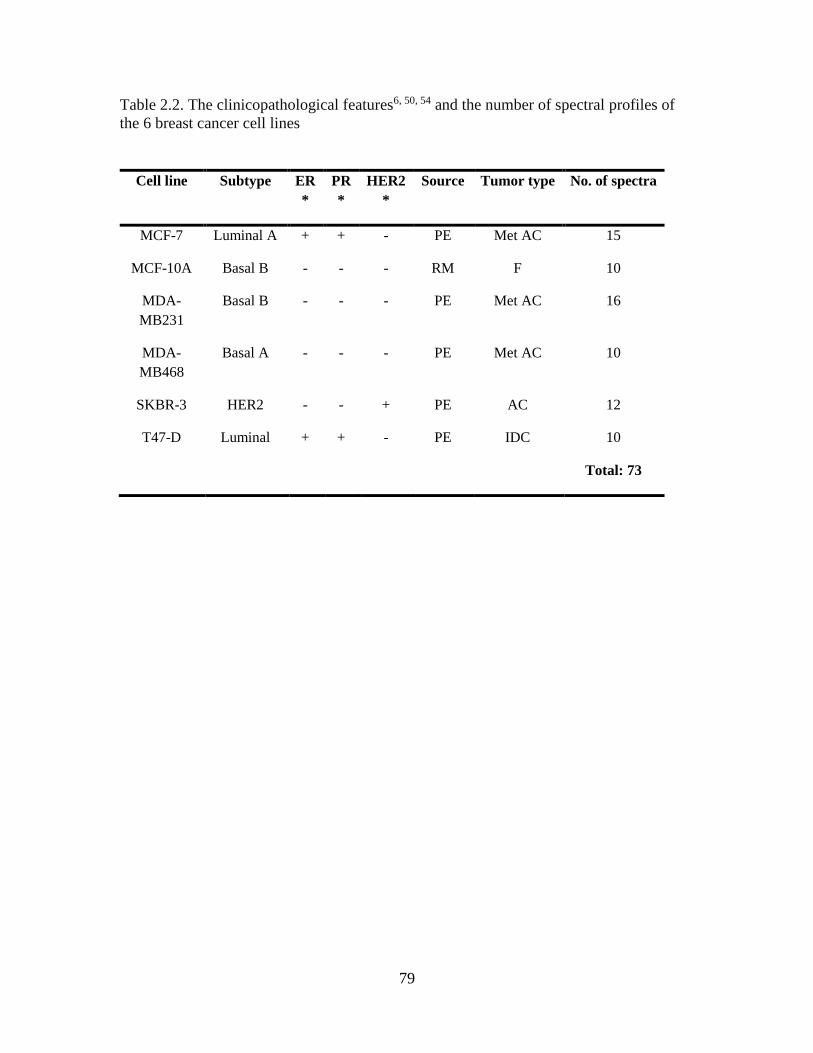
79
Table 2.2. The clinicopathological features6, 50, 54 and the number of spectral profiles of
the 6 breast cancer cell lines
Cell line Subtype ER
*
PR
*
HER2
*
Source Tumor type No. of spectra
MCF-7 Luminal A + + - PE Met AC 15
MCF-10A Basal B - - - RM F 10
MDA-
MB231
Basal B - - - PE Met AC 16
MDA-
MB468
Basal A - - - PE Met AC 10
SKBR-3 HER2 - - + PE AC 12
T47-D Luminal + + - PE IDC 10
Total: 73
80
2.4.2.2 Repeatability and Consistency of Cell Morphology
Initially cell morphologies of the cell lines in several consecutive passages were tested
for similarity. To do that, MCF-7 and MDA-MB231 were cultured and passaged
following designated protocols. Each passage was cultured in two T75 flasks resulting in
two replicate samples. In order to ensure reproducible MALDI-MS profiles, efforts were
made to get similar cell morphologies throughout different passages. Three images
(Figure 2.7) were obtained from three different passages of MCF7 and MDA-MB231
cells to show that, prior to harvesting, the cells had similar morphology and confluency.
2.4.2.3 Selection of the Suitable Time for One-step Processing of Breast Cancer Cells
In addition to ensuring consistent cell morphology, an attempt was made to find a
suitable length of time at which the harvested cells could be mixed with the
extraction/lysis matrix solution A prior to pelleting. This time is critical because if it is
too short, the extraction and removal of lipids will not be sufficient to release the proteins
and make them available for ionization during MALDI; conversely, if this time is too
long, release of endogenous proteases may lead to degradation of the protein analyte and
reduction of MALDI-MS signal. To find the suitable length of time for sample
processing, cells were resuspendend in 4 mL PBS after harvesting, and then sub-divided
into 1 mL aliquots. After washing in PBS, the four samples were treated with the
extraction/lysis matrix solution A for 5, 20, 100, and 200 sec, respectively. The cell pellet
of each sample was dispersed in water and diluted to concentrations of 0.19 and 0.094
mg/µL, respectively. The MALDI-MS spectra of all the samples were generated the
peaks above noise level of about 200 a.u. were manually counted and used to evaluate the
effect of the duration of extraction/lysis on the MALDI-MS spectra of the cells. The

81
Figure 2.9 Light microscope images of MCF-7 (A, B and C) and MDA-MB231 (D, E and
F) cells from three consecutive passages. Scale bar = 100 m. The cell morphology was
similar throughout successive passages.
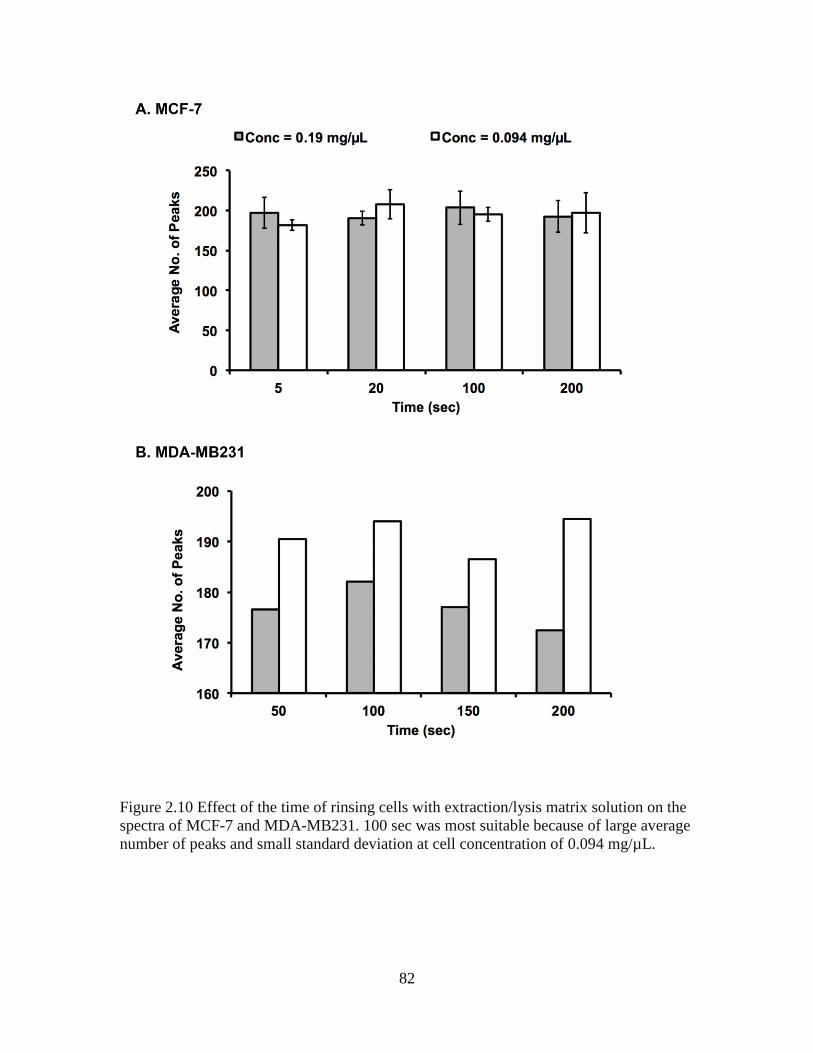
82
Figure 2.10 Effect of the time of rinsing cells with extraction/lysis matrix solution on the
spectra of MCF-7 and MDA-MB231. 100 sec was most suitable because of large average
number of peaks and small standard deviation at cell concentration of 0.094 mg/µL.

83
experiment was performed in triplicates for the MCF-7 and in duplicates for MDA-
MB231 cells.
The duration of extraction/lysis was found to have little or no effect on the
number of spectral peaks as shown on Figure 2.8. For MCF-7, although the mass spectra
of about the same number of peaks (200) were obtained at each concentration after
treatment with extraction/lysis solution for 5, 20, 100 and 200 sec, spectra from 100 sec
treatment had relatively higher intensities than all other treatments, indicating high
signal-to-noise ratio. For MDA-MB231, a trend was observed only at higher
concentration (0.19 mg/µL) at which the highest average number of peaks was obtained
from 100 sec treatment. Based on these results the time 100 sec and the 0.19 µg/µL cell
concentration were used for profiling of the human breast cancer cell lines.
2.4.2.4 PCA Analysis using the In-house Data Analytic Pipeline
Prior to PCA analysis, selection of discriminatory features by the multiple t-tests was
performed resulting in data matrix sizes of 47 samples by 301 features for normal versus
non-metastatic, 36 samples by 230 features for normal versus metastatic, and 63 samples
by 280 features for metastatic versus non-metastatic. For these 3 comparisons,
projections of the data into the space of the first two principal components were found to
be adequate to achieve 100% leave-one-out cross-validated classification accuracy, based
on Mahalanobis distances to cluster group centroids. Group membership was predicted
using Mahalanobis distance as a similarity measure. The Criterion for classifying a
sample as a member of the group is that the Mahalanobis distance from the sample to the
group centroid is smallest. The higher classification accuracy and the lower error imply
that the discrimination between the groups is greater32.

84
Figure 2.11 The 73 MALDI-TOF MS spectra (replicates) of six human breast cancer cell
lines. 26 green spectra for the cancerous and metastatic cell lines, MDA-MB231 and
MDA-MB468; 37 red spectra for the cancerous and non-metastatic cell lines, MCF-7,
SKBR-3 and T47-D; and 10 blue spectra for the normal and transformed cell line, MCF-
10A (control).
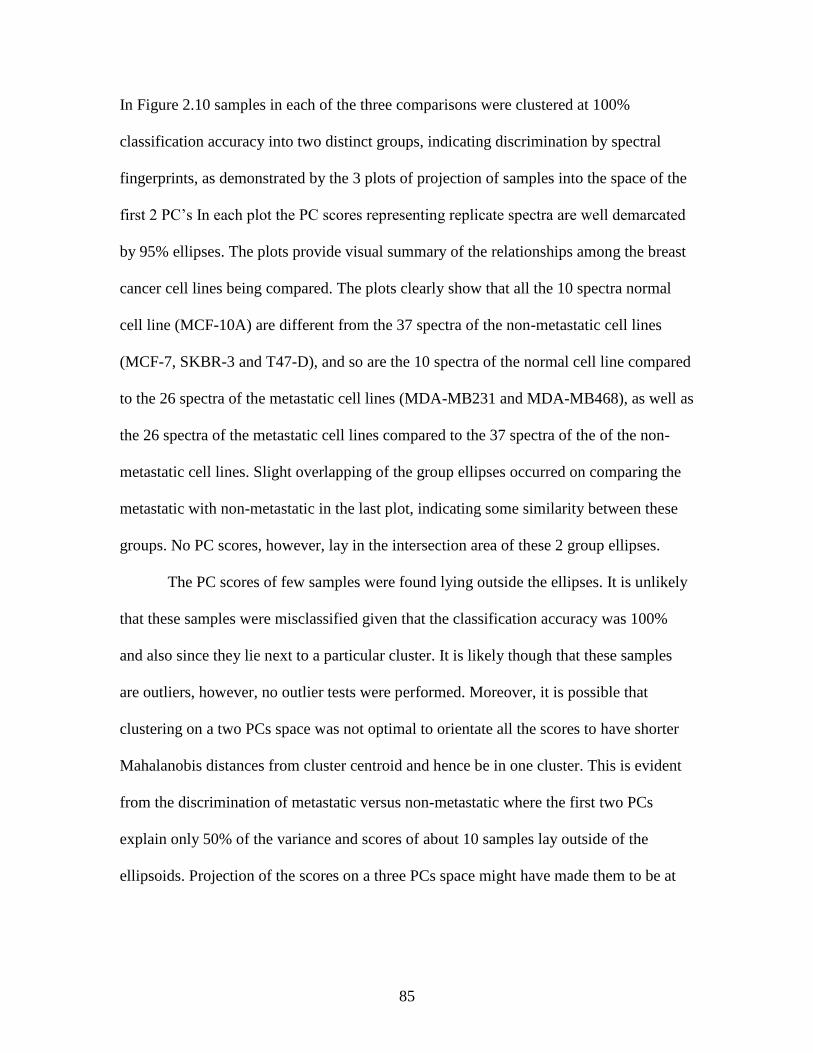
85
In Figure 2.10 samples in each of the three comparisons were clustered at 100%
classification accuracy into two distinct groups, indicating discrimination by spectral
fingerprints, as demonstrated by the 3 plots of projection of samples into the space of the
first 2 PC’s In each plot the PC scores representing replicate spectra are well demarcated
by 95% ellipses. The plots provide visual summary of the relationships among the breast
cancer cell lines being compared. The plots clearly show that all the 10 spectra normal
cell line (MCF-10A) are different from the 37 spectra of the non-metastatic cell lines
(MCF-7, SKBR-3 and T47-D), and so are the 10 spectra of the normal cell line compared
to the 26 spectra of the metastatic cell lines (MDA-MB231 and MDA-MB468), as well as
the 26 spectra of the metastatic cell lines compared to the 37 spectra of the of the non-
metastatic cell lines. Slight overlapping of the group ellipses occurred on comparing the
metastatic with non-metastatic in the last plot, indicating some similarity between these
groups. No PC scores, however, lay in the intersection area of these 2 group ellipses.
The PC scores of few samples were found lying outside the ellipses. It is unlikely
that these samples were misclassified given that the classification accuracy was 100%
and also since they lie next to a particular cluster. It is likely though that these samples
are outliers, however, no outlier tests were performed. Moreover, it is possible that
clustering on a two PCs space was not optimal to orientate all the scores to have shorter
Mahalanobis distances from cluster centroid and hence be in one cluster. This is evident
from the discrimination of metastatic versus non-metastatic where the first two PCs
explain only 50% of the variance and scores of about 10 samples lay outside of the
ellipsoids. Projection of the scores on a three PCs space might have made them to be at
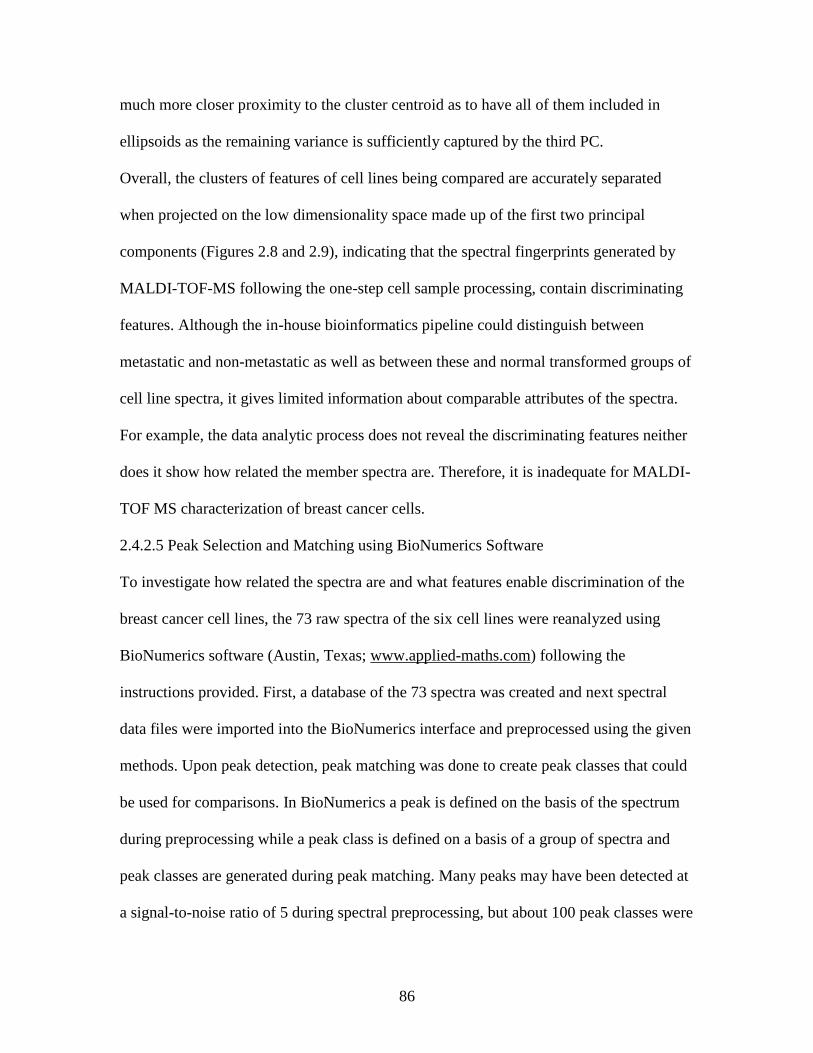
86
much more closer proximity to the cluster centroid as to have all of them included in
ellipsoids as the remaining variance is sufficiently captured by the third PC.
Overall, the clusters of features of cell lines being compared are accurately separated
when projected on the low dimensionality space made up of the first two principal
components (Figures 2.8 and 2.9), indicating that the spectral fingerprints generated by
MALDI-TOF-MS following the one-step cell sample processing, contain discriminating
features. Although the in-house bioinformatics pipeline could distinguish between
metastatic and non-metastatic as well as between these and normal transformed groups of
cell line spectra, it gives limited information about comparable attributes of the spectra.
For example, the data analytic process does not reveal the discriminating features neither
does it show how related the member spectra are. Therefore, it is inadequate for MALDI-
TOF MS characterization of breast cancer cells.
2.4.2.5 Peak Selection and Matching using BioNumerics Software
To investigate how related the spectra are and what features enable discrimination of the
breast cancer cell lines, the 73 raw spectra of the six cell lines were reanalyzed using
BioNumerics software (Austin, Texas; www.applied-maths.com) following the
instructions provided. First, a database of the 73 spectra was created and next spectral
data files were imported into the BioNumerics interface and preprocessed using the given
methods. Upon peak detection, peak matching was done to create peak classes that could
be used for comparisons. In BioNumerics a peak is defined on the basis of the spectrum
during preprocessing while a peak class is defined on a basis of a group of spectra and
peak classes are generated during peak matching. Many peaks may have been detected at
a signal-to-noise ratio of 5 during spectral preprocessing, but about 100 peak classes were

87
Figure 2.12 Principal component analyses and classification of 3 sets of data, first panel:
normal against non-metastatic, second panel: normal against metastatic, and third panel:
non-metastatic against metastatic
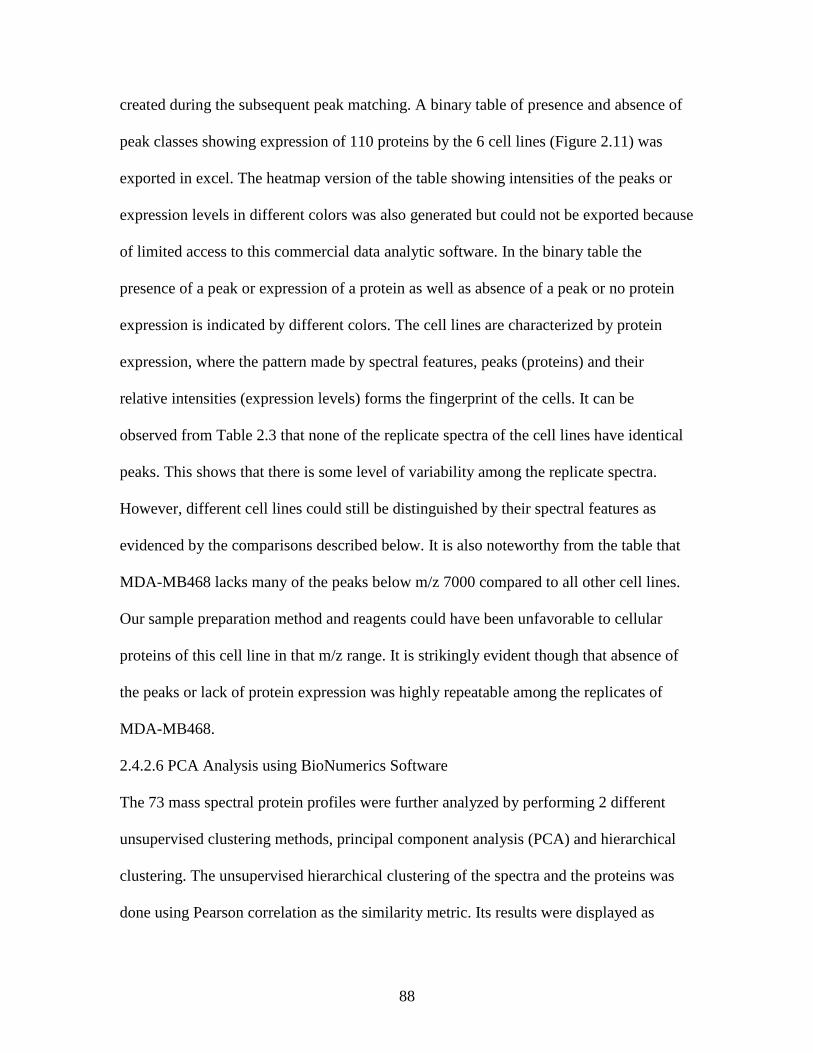
88
created during the subsequent peak matching. A binary table of presence and absence of
peak classes showing expression of 110 proteins by the 6 cell lines (Figure 2.11) was
exported in excel. The heatmap version of the table showing intensities of the peaks or
expression levels in different colors was also generated but could not be exported because
of limited access to this commercial data analytic software. In the binary table the
presence of a peak or expression of a protein as well as absence of a peak or no protein
expression is indicated by different colors. The cell lines are characterized by protein
expression, where the pattern made by spectral features, peaks (proteins) and their
relative intensities (expression levels) forms the fingerprint of the cells. It can be
observed from Table 2.3 that none of the replicate spectra of the cell lines have identical
peaks. This shows that there is some level of variability among the replicate spectra.
However, different cell lines could still be distinguished by their spectral features as
evidenced by the comparisons described below. It is also noteworthy from the table that
MDA-MB468 lacks many of the peaks below m/z 7000 compared to all other cell lines.
Our sample preparation method and reagents could have been unfavorable to cellular
proteins of this cell line in that m/z range. It is strikingly evident though that absence of
the peaks or lack of protein expression was highly repeatable among the replicates of
MDA-MB468.
2.4.2.6 PCA Analysis using BioNumerics Software
The 73 mass spectral protein profiles were further analyzed by performing 2 different
unsupervised clustering methods, principal component analysis (PCA) and hierarchical
clustering. The unsupervised hierarchical clustering of the spectra and the proteins was
done using Pearson correlation as the similarity metric. Its results were displayed as

89
Table 2.3 Binary representation showing presence and absence of protein peaks in the spectra of each of the 73 samples. Red –
presence of a peak. White – absence of a peak.

90
Table 2.3 Contd.

91
Table 2.3 Contd.
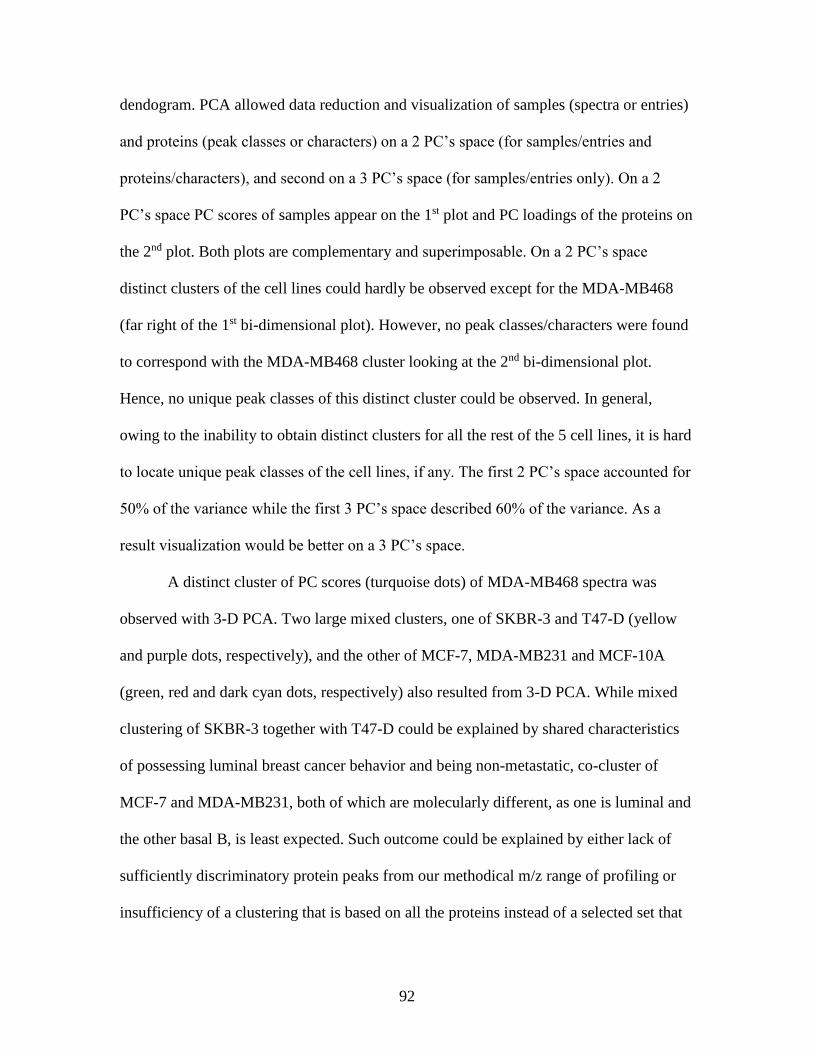
92
dendogram. PCA allowed data reduction and visualization of samples (spectra or entries)
and proteins (peak classes or characters) on a 2 PC’s space (for samples/entries and
proteins/characters), and second on a 3 PC’s space (for samples/entries only). On a 2
PC’s space PC scores of samples appear on the 1st plot and PC loadings of the proteins on
the 2nd plot. Both plots are complementary and superimposable. On a 2 PC’s space
distinct clusters of the cell lines could hardly be observed except for the MDA-MB468
(far right of the 1st bi-dimensional plot). However, no peak classes/characters were found
to correspond with the MDA-MB468 cluster looking at the 2nd bi-dimensional plot.
Hence, no unique peak classes of this distinct cluster could be observed. In general,
owing to the inability to obtain distinct clusters for all the rest of the 5 cell lines, it is hard
to locate unique peak classes of the cell lines, if any. The first 2 PC’s space accounted for
50% of the variance while the first 3 PC’s space described 60% of the variance. As a
result visualization would be better on a 3 PC’s space.
A distinct cluster of PC scores (turquoise dots) of MDA-MB468 spectra was
observed with 3-D PCA. Two large mixed clusters, one of SKBR-3 and T47-D (yellow
and purple dots, respectively), and the other of MCF-7, MDA-MB231 and MCF-10A
(green, red and dark cyan dots, respectively) also resulted from 3-D PCA. While mixed
clustering of SKBR-3 together with T47-D could be explained by shared characteristics
of possessing luminal breast cancer behavior and being non-metastatic, co-cluster of
MCF-7 and MDA-MB231, both of which are molecularly different, as one is luminal and
the other basal B, is least expected. Such outcome could be explained by either lack of
sufficiently discriminatory protein peaks from our methodical m/z range of profiling or
insufficiency of a clustering that is based on all the proteins instead of a selected set that
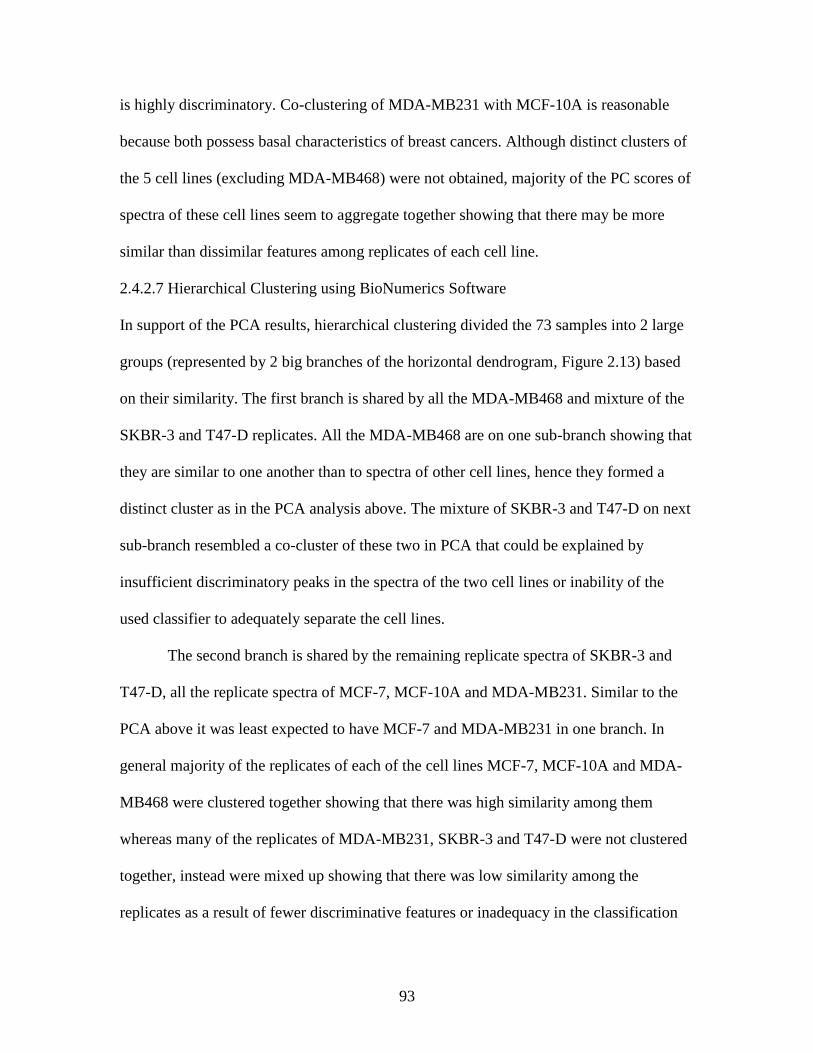
93
is highly discriminatory. Co-clustering of MDA-MB231 with MCF-10A is reasonable
because both possess basal characteristics of breast cancers. Although distinct clusters of
the 5 cell lines (excluding MDA-MB468) were not obtained, majority of the PC scores of
spectra of these cell lines seem to aggregate together showing that there may be more
similar than dissimilar features among replicates of each cell line.
2.4.2.7 Hierarchical Clustering using BioNumerics Software
In support of the PCA results, hierarchical clustering divided the 73 samples into 2 large
groups (represented by 2 big branches of the horizontal dendrogram, Figure 2.13) based
on their similarity. The first branch is shared by all the MDA-MB468 and mixture of the
SKBR-3 and T47-D replicates. All the MDA-MB468 are on one sub-branch showing that
they are similar to one another than to spectra of other cell lines, hence they formed a
distinct cluster as in the PCA analysis above. The mixture of SKBR-3 and T47-D on next
sub-branch resembled a co-cluster of these two in PCA that could be explained by
insufficient discriminatory peaks in the spectra of the two cell lines or inability of the
used classifier to adequately separate the cell lines.
The second branch is shared by the remaining replicate spectra of SKBR-3 and
T47-D, all the replicate spectra of MCF-7, MCF-10A and MDA-MB231. Similar to the
PCA above it was least expected to have MCF-7 and MDA-MB231 in one branch. In
general majority of the replicates of each of the cell lines MCF-7, MCF-10A and MDA-
MB468 were clustered together showing that there was high similarity among them
whereas many of the replicates of MDA-MB231, SKBR-3 and T47-D were not clustered
together, instead were mixed up showing that there was low similarity among the
replicates as a result of fewer discriminative features or inadequacy in the classification

94
model. These results are based on the clustering using all 109 proteins. It is possible that
if the number of proteins had been reduced to include only highly discriminatory ones,
the sizes and the components of the clusters would have changed. Probably even the
replicate spectra of MCF-7 and MDA-MB231 would have been classified into 2 distinct
groups.
Hierarchical clustering of 27 breast cell lines, based on their SELDI-TOF mass
spectra, placed T47-D and MCF-7 in the first branch, and SKBR-3, MDA-MB231 and
MCF-10A in second branch. The subsequent supervised classification of the 27 breast
cell lines, based on only the significant differentially expressed protein peaks, placed
MCF-7, SKBR-3 and T47-D in the first branch, and MCF-10A and MDA-MB231 in the
second branch, where the first branch and second branch depict the luminal and basal
subtypes, respectively. In that classification the 3 luminal cell lines were adjacent to one
another showing that they were highly similar, while the 2 basal cell lines were distant
from one another showing that they were less similar. MDA-MB468 was not included in
that study. In the current study, supervised clustering was not accomplished due to
limited access to the commercial software. Had the supervised clustering been performed,
the clustering might have been refined and could have been comparable to that by
Goncalves et al.52 Supervised clustering methods can control within-group variance while
maximizing beween-group separations to enhance discrimination between groups.55
Clustering of the 109 protein peaks (vertical dendogram, Figure 2.13) reveals that
there may be similarities shared in intensities among peaks in the m/z ranges 3000-5000,
5000-25000, and 25000-30000. The remarkable observation from this pattern of
clustering was the distinctly low intensities of the protein peaks of MDA-MB468
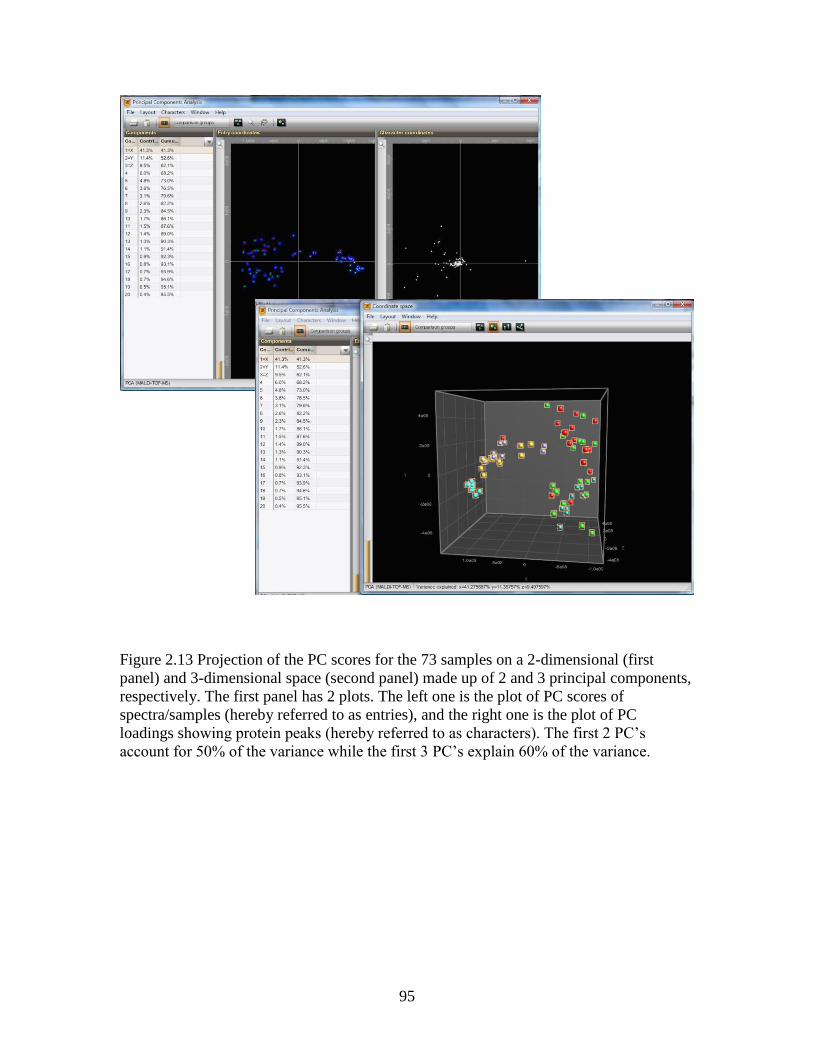
95
Figure 2.13 Projection of the PC scores for the 73 samples on a 2-dimensional (first
panel) and 3-dimensional space (second panel) made up of 2 and 3 principal components,
respectively. The first panel has 2 plots. The left one is the plot of PC scores of
spectra/samples (hereby referred to as entries), and the right one is the plot of PC
loadings showing protein peaks (hereby referred to as characters). The first 2 PC’s
account for 50% of the variance while the first 3 PC’s explain 60% of the variance.

96
Figure 2.14. Protein expression profiling and hierarchical clustering of breast cancer cell
lines (MCF-7/red, MCF-10A/dark cyan, MDA-MB231/green, MDA-MB468/turquoise,
SKBR-3/purple, and T47-D/yellow) and 110 proteins based on MALDI-TOF mass
spectral measurements. Each row represents a protein peak and each column represents a
spectrum of a cell line. The expression level of each protein is relative to its median
abundance across all cell lines and is shown according to a color scale. Black, red and
green are levels on, above and below the median, respectively. The magnitude of
deviation from median is represented by color saturation. The curve in the profiles panel
depicts the change in p-values of differential expression between MCF-10A (the control)
and the 5 breast cancer cells lines.

97
replicates and that these low expression levels underscore the observations shown in the
binary table. Due to limited access to the commercial software, protein peaks that have
significant differential expression among the cell lines are not known. However, several
proteins were found to have significant differential expression between MCF-10A and all
the 5 breast cancer cell lines at an adjusted p-value of 0.05.
2.5 CONCLUSIONS
Using NIH3T3 cell line, a novel one-step process method has been developed for whole
cell analysis of mammalian cells using MALDI-TOF MS. The established method
involves use of the optimized novel rinsing matrix solution of the composition 5 mg/mL
DHB in isopropanol: acetonitrile: dH2O (2:1:1 v/v/v) and the DHAP spotting matrix
solution developed by Wenzel et al.31. Spectra generated had strong signals and consisted
of the largest array of peaks ever to be reported from direct cell MALDI-MS in the mass
range 3000-30000.The established method is simple, rapid , direct, and repeatable. Since
it is a one-step process, it reduces the variables and complications that can lead to
irrepeatable spectra. By the optimization of pre-analytical conditions such as organic
solvent, matrix, temperature, inhibitor, time and concentration of cells as well as spotting
approach, reproducible spectral fingerprints could be obtained. The novel one-step
profiling was applied in the fingerprinting and discrimination of breast cancer cell lines.
Four different mammalian cell lines 3T3, MCF-10A, MCF-7and MDA-MB231Three
non-metastatic cell lines MCF-7, SKBR-3 and T47-D, two metastatic cell lines, MDA-
MB231 and MDA-MB468, and one non-cancerous cell line, MCF-10A were investigated
and differences among them were observed by comparing their mass spectra. Since the
mass spectral data is highly dimensional it is mandatory34 that multivariate pattern
98
recognition methods be employed to demonstrate the similarities and differences and to
visualize some patterns in the data. Two different data analytic pipelines were employed
to ensure confidence of the profiling results, one is the in-house methodology developed
by Morgan et al.32 and the other is a commercial BioNumerics software (www.applied-
maths.com).
PCA analysis using Morgan et al. methodology distinguished the breast cancer
cell lines into groups based whether they were metastatic, non-metastatic or non
cancerous. The clustering was performed for two groups at a time where the samples
were always classified with 100% accuracy. However, this pipeline could not
demonstrate clustering of more than two groups and therefore was inadequate for
differentiation of spectra of the six breast cancer cell lines in one analysis. BioNumerics
on the other hand permitted hierarchical clustering and PCA of all the six cell lines,
where distinct groups were observed for MDA-MB468 and MCF-10A. A co-cluster of
SKBR-3 and T47-D showed that there are more similar than dissimilar features between
these two. These cell lines have similar clinicopathological features so they are likely to
co-cluster. A co-cluster of MCF-7 and MDA-MB231 was least expected since these have
different clinicopathological properties. Although the unsupervised clustering methods
demonstrated the potential to distinguish breast cancer cell line, the discrimination could
have been improved by employment of supervised clustering that uses only a
discriminatory set of variables (proteins) to cluster the samples.

99
REFERENCES
1. A. Bombonati, D. C. Sgroi, The molecular pathology of breast cancer
progression. J. Pathol., 2011, 223, 307-317.
2. A. Journet, M. Ferro, The potentials of MS-based subproteomic approaches in
medical science: the case of lysosomes and breast cancer. Mass Spectrom. Rev., 2004, 23,
393-442.
3. R. R. Drake, L. H. Cazares, E. E. Jones, T. W. Fuller, O. J. Semmes, C. Laronga,
Challenges to Developing Proteomic-Based Breast Cancer Diagnostics. OMICS: J.
Integrative Biol., 2011, 15, 251-259.
4. M. Lacroix, G. Leclercq, Relevance of Breast Cancer Cell Lines as Models for
Breast Tumours: An Update. Breast Cancer Res. Treat., 2004, 83, 249-289.
5. J. Mladkova, M. Sanda, E. Matouskova, I. Selicharova, Phenotyping breast cancer
cell lines EM-G3, HCC1937, MCF7 and MDA-MB-231 using 2-D electrophoresis and
affinity chromatography for glutathione-binding proteins. BMC Cancer, 2010, 10, 449.
6. R. M. Neve, K. Chin, J. Fridlyand, J. Yeh, F. L. Baehner, T. Fevr, et al., A
collection of breast cancer cell lines for the study of functionally distinct cancer subtypes.
Cancer Cell, 2006, 10, 515-527.
7. C. Laronga, R. R. Drake, Proteomic approach to breast cancer. Cancer Control,
2007, 14, 360-368.
8. M. Karas, F. Hillenkamp, Laser desorption ionization of proteins with molecular
masses exceeding 10,000 daltons. Anal. Chem., 1988, 60, 2299-2301.
9. J. H. van Adrichem, K. O. Bornsen, H. Conzelmann, M. A. Gass, H. Eppenberger,
G. M. Kresbach, et al., Investigation of protein patterns in mammalian cells and culture
supernatants by matrix-assisted laser desorption/ionization mass spectrometry. Anal.
Chem., 1998, 70, 923-930.
10. K. Tanaka, H. Waki, Y. Ido, S. Akita, Y. Yoshida, T. Yoshida, Protein and
Polymer Analyses up to m/z 100000 by Laser Ionization Time-of-flight Mass
Spectrometry. Rapid Commun. Mass Spectrom., 1988, 2, 151-153.
100
11. C. Fenselau, P. A. Demirev, Characterization of intact microorganisms by
MALDI mass spectrometry. Mass Spectrom. Rev., 2001, 20, 157-171.
12. R. Kaufman, Matrix-assisted laser desorption ionization (MALDI) mass
spectrometry: a novel analytical tool in molecular biology and biotechnology. J.
Biotechnol., 1995, 41, 155-175.
13. B. L. Adam, Y. Qu, J. W. Davis, M. D. Ward, M. A. Clements, L. H. Cazares, et
al., Serum protein fingerprinting coupled with a pattern-matching algorithm distinguishes
prostate cancer from benign prostate hyperplasia and healthy men. Cancer Res., 2002, 62,
3609-3614.
14. E. T. Fung, V. Thulasiraman, S. R. Weinberger, E. A. Dalmasso, Protein Biochips
for Differential Profiling. Curr. Opin. Biotechnol., 2001, 12, 65-69.
15. J. M. Hettick, M. L. Kashon, J. E. Slaven, Y. Ma, J. P. Simpson, P. D. Siegel, et
al., Discrimination of intact mycobacteria at the strain level: a combined MALDI-TOF
MS and biostatistical analysis. Proteomics, 2006, 6, 6416-6425.
16. J. O. Lay, Jr., MALDI-TOF mass spectrometry of bacteria. Mass Spectrom. Rev.,
2001, 20, 172-194.
17. T. L. Williams, D. Andrzejewski, J. O. Lay, S. M. Musser, Experimental factors
affecting the quality and reproducibility of MALDI TOF mass spectra obtained from
whole bacteria cells. J. Am. Soc. Mass Spectrom., 2003, 14, 342-351.
18. S. L. Cohen, B. T. Chait, Influence of matrix solution conditions on the MALDI-
MS analysis of peptides and proteins. Anal. Chem., 1996, 68, 31-37.
19. K. O. Bornsen, M. A. Gass, G. J. Bruin, J. H. von Adrichem, M. C. Biro, G. M.
Kresbach, et al., Influence of solvents and detergents on matrix-assisted laser
desorption/ionization mass spectrometry measurements of proteins and oligonucleotides.
Rapid Commun. Mass Spectrom., 1997, 11, 603-609.
20. L. F. Marvin-Guy, P. Duncan, S. Wagniere, N. Antille, N. Porta, M. Affolter, et
al., Rapid identification of differentiation markers from whole epithelial cells by matrix-
assisted laser desorption/ionisation time-of-flight mass spectrometry and statistical
analysis. Rapid Commun. Mass Spectrom., 2008, 22, 1099-1108.

101
21. R. Knochenmuss, F. Dubois, M. J. Dale, R. Zenobi, The matrix suppression effect
and ionization mechanisms in matrix-assisted laser desorption/ionization. Rapid
Commun. Mass Spectrom., 1996, 10, 871-877.
22. J. Rappsilber, M. Moniatte, M. L. Nielsen, A. V. Podtelejnikov, M. Mann,
Experiences and perspectives of MALDI MS and MS/MS in proteomic research. Int J
Mass Spectrom, 2003, 226, 223-237.
23. T. C. Cain, D. M. Lubman, W. J. Weber, Differentiation of Bacteria Using Protein
Profiles from Matrix-Assisted Laser-Desorption Ionization Time-of-Flight Mass-
Spectrometry. Rapid Commun. Mass Spectrom., 1994, 8, 1026-1030.
24. S. Vaidyanathan, C. L. Winder, S. C. Wade, D. B. Kell, R. Goodacre, Sample
preparation in matrix-assisted laser desorption/ionization mass spectrometry of whole
bacterial cells and the detection of high mass (>20 kDa) proteins. Rapid Commun. Mass
Spectrom., 2002, 16, 1276-1286.
25. A. J. Madonna, F. Basile, I. Ferrer, M. A. Meetani, J. C. Rees, K. J. Voorhees,
On-probe sample pretreatment for detection of proteins above 15 KDa from whole cell
bacteria by matrix-assisted laser desorption/ionization time-of-flight mass spectrometry.
Rapid Commun. Mass Spectrom., 2000, 14, 2220-2229.
26. E. E. Balashova, D. I. Maxim, P. G. Lokhov, Proteomics Footprinting of Drug-
Treated Cancer Cells as a Measure of Cellular Vaccine Efficacy for the Prevention of
Cancer Recurrence. Mol. Cell. Proteomics, 2012, (10.1074/mcp.M111.014480).
27. H. Dong, W. Shen, M. T. Cheung, Y. Liang, H. Y. Cheung, G. Allmaier, et al.,
Rapid detection of apoptosis in mammalian cells by using intact cell MALDI mass
spectrometry. Analyst, 2011, 136, 5181-5189.
28. H. T. Feng, L. C. Sim, C. Wan, N. S. Wong, Y. Yang, Rapid characterization of
protein productivity and production stability of CHO cells by matrix-assisted laser
desorption/ionization time-of-flight mass spectrometry. Rapid Commun. Mass Spectrom.,
2011, 25, 1407-1412.
29. P. Lokhov, E. Balashova, M. Dashtiev, Cell proteomic footprint. Rapid Commun.
Mass Spectrom., 2009, 23, 680-682.

102
30. X. Zhang, M. Scalf, T. W. Berggren, M. S. Westphall, L. M. Smith, Identification
of mammalian cell lines using MALDI-TOF and LC-ESI-MS/MS mass spectrometry. J.
Am. Soc. Mass Spectrom., 2006, 17, 490-499.
31. T. Wenzel, K. Sparbier, T. Mieruch, M. Kostrzewa, 2,5-Dihydroxyacetophenone:
a matrix for highly sensitive matrix-assisted laser desorption/ionization time-of-flight
mass spectrometric analysis of proteins using manual and automated preparation
techniques. Rapid Commun. Mass Spectrom., 2006, 20, 785-789.
32. S. L. Morgan, E. G. Bartick, Discrimination of Forensic Analytical Chemical
Data Using Multivariate Statistics. In Forensic Analysis on the Cutting Edge: New
Methods for Trace Evidence Analysis, Blackwell, R. D., Ed. John Wiley & Sonds: New
York, 2007, pp 331-372.
33. G. Caprioli, G. Cristalli, E. Ragazzi, L. Molin, M. Ricciutelli, G. Sagratini, et al.,
A preliminary matrix-assisted laser desorption/ionization time-of-flight approach for the
characterization of Italian lentil varieties. Rapid Commun. Mass Spectrom., 2010, 24,
2843-2848.
34. A. C. Tas, J. Vandergreef, Mass-Spectrometric Profiling and Pattern-Recognition.
Mass Spectrom. Rev., 1994, 13, 155-181.
35. C. Shui, A. M. Scutt, Mouse embryo-derived NIH3T3 fibroblasts adopt an
osteoblast-like phenotype when treated with 1alpha,25-dihydroxyvitamin D(3) and
dexamethasone in vitro. J. Cell. Physiol., 2002, 193, 164-172.
36. C. F. Franco, M. C. Mellado, P. M. Alves, A. V. Coelho, Monitoring virus-like
particle and viral protein production by intact cell MALDI-TOF mass spectrometry.
Talanta, 2010, 80, 1561-1568.
37. O. Sedo, I. Sedlacek, Z. Zdrahal, Sample preparation methods for MALDI-MS
profiling of bacteria. Mass Spectrom. Rev., 2011, 30, 417-434.
38. F. Hillenkamp, M. Karas, R. C. Beavis, B. T. Chait, Matrix-Assisted Laser
Desorption/Ionization Time-of-Flight Mass Spectrometry of Biopolymers. Anal. Chem.,
1991, 63, 1193-1203.
39. M. W. Duncan, H. Roder, S. W. Hunsucker, Quantitative matrix-assisted laser
desorption/ionization mass spectrometry. Brief Funct Genomic Proteomic, 2008, 7, 355-
370.

103
40. Z. Wang, L. Russon, L. Li, D. C. Roser, S. R. Long, Investigation of Spectral
Reproducibility in Direct Analysis of Bacteria Proteins by Matrix-assisted Laser
Desorption/Ionization Time-of-Flight Mass Spectrometry. Rapid Commun. Mass
Spectrom., 1998, 12, 456-464.
41. R. J. Arnold, J. P. Reilly, Fingerprint matching of E. coli strains with matrix-
assisted laser desorption/ionization time-of-flight mass spectrometry of whole cells using
a modified correlation approach. Rapid Commun. Mass Spectrom., 1998, 12, 630-636.
42. Q. Liu, A. H. Sung, M. Qiao, Z. Chen, J. Y. Yang, M. Q. Yang, et al.,
Comparison of feature selection and classification for MALDI-MS data. BMC Genomics,
2009, 10 Suppl 1, S3.
43. J. Qian, J. E. Cutler, R. B. Cole, Y. Cai, MALDI-TOF mass signatures for
differentiation of yeast species, strain grouping and monitoring of morphogenesis
markers. Anal. Bioanal. Chem., 2008, 392, 439-449.
44. F. Bertucci, D. Birnbaum, A. Goncalves, Proteomics of breast cancer - Principles
and potential clinical applications. Mol. Cell. Proteomics, 2006, 5, 1772-1786.
45. C. M. Perou, T. Sorlie, M. B. Eisen, M. van de Rijn, S. S. Jeffrey, C. A. Rees, et
al., Molecular portraits of human breast tumours. Nature, 2000, 406, 747-752.
46. P. T. Simpson, J. S. Reis-Filho, T. Gale, S. R. Lakhani, Molecular evolution of
breast cancer. J. Pathol., 2005, 205, 248-254.
47. T. Sorlie, C. M. Perou, R. Tibshirani, T. Aas, S. Geisler, H. Johnsen, et al., Gene
expression patterns of breast carcinomas distinguish tumor subclasses with clinical
implications. Proc. Natl. Acad. Sci. U. S. A., 2001, 98, 10869-10874.
48. C. Sotiriou, S. Y. Neo, L. M. McShane, E. L. Korn, P. M. Long, A. Jazaeri, et al.,
Breast cancer classification and prognosis based on gene expression profiles from a
population-based study. Proc. Natl. Acad. Sci. U. S. A., 2003, 100, 10393-10398.
49. L. A. Liotta, E. F. Petricoin, Beyond the genome to tissue proteomics. Breast
Cancer Res., 2000, 2, 13-14.

104
50. J. Kao, K. Salari, M. Bocanegra, Y. L. Choi, L. Girard, J. Gandhi, et al.,
Molecular profiling of breast cancer cell lines defines relevant tumor models and
provides a resource for cancer gene discovery. PLoS One, 2009, 4, e6146.
51. E. Charafe-Jauffret, C. Ginestier, F. Iovino, J. Wicinski, N. Cervera, P. Finetti, et
al., Breast cancer cell lines contain functional cancer stem cells with metastatic capacity
and a distinct molecular signature. Cancer Res., 2009, 69, 1302-1313.
52. A. Goncalves, E. Charafe-Jauffret, F. Bertucci, S. Audebert, Y. Toiron, B.
Esterni, et al., Protein profiling of human breast tumor cells identifies novel biomarkers
associated with molecular subtypes. Mol. Cell. Proteomics, 2008, 7, 1420-1433.
53. H. D. Soule, T. M. Maloney, S. R. Wolman, W. D. Peterson, Jr., R. Brenz, C. M.
McGrath, et al., Isolation and characterization of a spontaneously immortalized human
breast epithelial cell line, MCF-10. Cancer Res., 1990, 50, 6075-6086.
54. K. Subik, J. F. Lee, L. Baxter, T. Strzepek, D. Costello, P. Crowley, et al., The
Expression Patterns of ER, PR, HER2, CK5/6, EGFR, Ki-67 and AR by
Immunohistochemical Analysis in Breast Cancer Cell Lines. Breast Cancer (Auckl.),
2010, 4, 35-41.
55. M. Hilario, A. Kalousis, C. Pellegrini, M. Muller, Processing and classification of
protein mass spectra. Mass Spectrom. Rev., 2006, 25, 409-449.
105
CHAPTER 3
AFFINITY ENRICHMENT AND LC-MS/MS ANALYSES OF O-LINKED-N-
ACETYLGLUCOSAMINE PROTEOME
3.1 ABSTRACT
Investigation of O-GlcNAc epithelial-mesenchymal transition (EMT) proteomics is
critical in understanding how aberrant O-GlcNAc PTM promotes cancer invasion and
metastasis, as well as in the identification of early stage therapeutic targets. Until now the
role of O-GlcNAc PTM in TGF--induced EMT is unknown. To explore the O-GlcNAc
EMT proteome, we developed a cleavable azide-reactive dibenzocyclooctyne-disulphide
agarose-based beaded resin by coupling DBCO-SS-NHS ester to two commercial
available NH2-terminated resins. Prior to utilization of these affinity probes, robust bead
washing was established to minimize the non-specific protein binding to affinity resins.
Protein extracts from GalNAz-fed, metabolically labeled cells were conjugated onto the
affinity resin via SPAAC for 18 h at 37 ºC. Using NIH3T3, a cell line that has been
previously GalNAz labeled, the affinity-enriched proteins were detected by SDS-PAGE
and in-gel fluorescence scanning. The GalNAz labeling and affinity purification were
repeated on NMuMG cells undergoing EMT. The five samples tested were as follows: 1)
DBCO-beads+GalNAz+TGF-; 2) beads+GalNAz+TGF-; 3) DBCO-beads+GalNAz-
TGF-; 4) beads+GalNAz-TGF-; and 5) DBCO-beads-GalNAz-TGF-, where samples
2, 4 and 5 were negative affinity controls, and 1 and 2 were TGF- induced. Following
106
affinity enrichment and bead washing the non-O-GlcNAc peptides were obtained by
tryptic digestion and analyzed by LC-MS/MS with CID fragmentation. Using the intact
and fragmented peptide ion profiles, label-free quantification and identification were
performed with MaxQuant and Andromeda search engine. Based on the MaxQuant-
generated LFQ intensities, biochemical enrichment factor of each protein was calculated
and employed in filtering nonspecific binding proteins. Out of 196 proteins identified,
125 constituted the affinity enriched proteins. 75% of these have been identified among
O-GlcNAc affinity enrichment samples in other studies. Bioinformatics gene ontology
analyses were performed using Ingenuity Pathway Analysis to determine cellular
localization, functions and processes represented by the data. In silico protein-protein
interactions revealed a regulatory network for metastasis, and cell cycle and proliferation,
among the highly represented cellular processes. In silico canonical pathways analysis
revealed glycolysis among the highly represented metabolic pathways and several
signaling pathways that cooperate with TGF-/SMAD signaling in accomplishing EMT.
A metastatic regulatory network that features core regulators β-Catenin and cyclin-D1
both of which are regulated by OGT has led us to hypothesize that TGF- signaling
cooperates with O-GlcNAc signaling in promoting EMT, invasion and metastasis,
pending validation and O-GlcNAc site-mapping.
3.2 INTRODUCTION
Cancer metastasis is the major cause of high breast cancer mortality1-2. Therefore
understanding of molecular mechanisms leading to cancer cell invasion and metastasis is
very essential. Epithelial-Mesenchymal Transition (EMT), a process by which cells lose
their epithelial features and acquire mesenchymal and migratory behavior, is known to

107
initiate invasion leading to metastasis3. In addition, EMT supports cancer phenotypes by
promoting angiogenesis, immune response escape, and stem cell properties4. Targeting
molecular events of EMT has been perceived to be helpful in mitigating propagation of
malignancies. Research on proteomic studies of EMT is aimed at identifying molecular
signatures that allow detection of the transition from normal mammary epithelial cells to
malignant invasive cells5. Such signatures are critical in the development of diagnostic,
therapeutic and preventative strategies against breast cancers5-6. While proteomic
investigations provide platform for protein-level probing of gene expression as compared
to DNA-, and RNA-based studies, it is envisaged that study on functional proteomics
involving PTMs can generate newer and more useful insights on complex diseases than
other molecular profiling approaches have so far elucidated7-8.
Recently O-GlcNAc PTM has been considered as a link between abnormal
glucose metabolism and metastasis9. However, its role in TGF--induced EMT is not
fully understood. In cancer cells, alteration in glucose metabolism leads to aberrant
glycosylation and plays a role in disease progression10. Due to “Warburg effect”
elevation of glucose uptake resulting from de-regulation of glucose metabolism
upregulates glucose flux through HBP leading to increase in UDP-GlcNAc11, the
nucleotide-sugar substrate for enzymatic tagging of target proteins with O-GlcNAc.
Increase in UPD-GlcNAc stimulates the expression and activity of the tagging enzyme,
uridine diphospho-N-acetylglucosamine: polypeptide beta-N-
acetylglucosaminyltransferase (O-GlcNAc Transferase [OGT]) which will then
glycosylate target nucleocytoplasmic proteins to modulate activity, localization, stability
and interactions of O-GlcNAc-regulated proteins, mainly transcription regulators10, 12-14.

108
Upregulation of O-GlcNAcylation in this manner modulates the expression of target
proteins to favor cancer growth and metastasis9.
The role of O-GlcNAcylation on protein function as well as on cancer progression
has been reported. Reference to O-GlcNAcylation of Snail1, at protein level, OGT
overexpression resulting from hyperglycaemia, increased the amount of Snail1 protein
and enhanced the O-GlcNAc modification without changing the Snail mRNA levels10.
Together with Snail1, several other cellular proteins were also O-GlcNAcylated as many
bands were resolved on SDS-PAGE of lectin-based sWGA-affinity purified total cell
lysates. OGT overexpression stabilized O-GlcNAcylated Snail1 through inhibition of
phosphorylation-mediated ubiquitination resulting in Snail1 transcriptional repression of
E-cadherin. In a different study on O-GlcNAcylation in breast tumors, at cellular and
tissue level, OGT overexpression was associated with elevated global O-GlcNAcylation,
E-cadherin downregulation, and invasion and metastasis both in vitro and in vivo, as
shown by immunohistochemical analyses9. Based on these observations, it is likely that
the elevated OGT expression and O-GlcNAcylation cooperate with the known signaling
cascades in promoting invasion and metastasis.
In TGF--induced EMT, the mediators of the TGF- induced signal, namely, the
Smad proteins are weak in binding DNA1, 15. They only bind strongly to the promoters of
target genes upon interacting with the transcription regulators, some of which are O-
GlcNAc regulated. By interacting with the Smads to form EMT-promoting Smad
complexes, these O-GlcNAc-regulated transcription cofactors facilitate recognition and
binding to target promoter elements, ensure nuclear retention and prevent degradation of
the Smads16. Many studies have shown that transcription cofactors of the Smads
109
including Hmga-2, c-Myc, Snail1, and Foxm1, among others, are upregulated in cancers
synergistically with O-GlcNAcylation and they may be O-GlcNAcylated14, 16-18.
However, only the O-GlcNAc modifications of Snail1 and c-Myc have been
characterized in relation to phosphorylation, and the interplay between these two
modifications in controlling breast cancer progression has been recognized10, 19. The
oncogenic protein Foxm1 is upregulated in high O-GlcNAc levels but its O-GlcNAc site
has not been established14, 20. The impact of O-GlcNAc, if any, at specific sites on these
transcription regulators and other key proteins in the context of TGF--induced EMT is
still unknown. Since a combination of affinity enrichment and mass spectrometry is
widely acceptable as a suitable approach for identification of O-GlcNAc-modified
proteins and mapping the site of modification to understand the role of O-GlcNAc
modification in protein function11, it was hereby applied in investigating the O-GlcNAc-
modified proteins from cells undergoing EMT.
In previous studies proteomic characterization of cells undergoing EMT has
revealed protein expression changes reflecting cellular reprogramming regardless of the
source of the EMT-inducing signal. Biarc and coworkers have performed targeted
proteomics of mutant K-Rasv12-, and TGF--induced MCF-10A cells8. Proteomic profiles
from both treatments reflected EMT features including upregulation of cytoskeletal
proteins, translation and degradation machineries, as well as metabolic enzymes, and
down-regulation of cell-cell adhesion proteins. Their study, however, did not demonstrate
the role of PTMs such as, in providing the link between metabolic changes and EMT,
specifically in revealing which proteins during EMT might be modulated by abnormal
metabolic regulation elicited by TGF-. Examination of the O-GlcNAc proteome in
110
discovery LC-MS/MS has a potential to reveal a wealth of information pertaining to new
candidate disease biomarkers, as well as insights on regulation of protein function by O-
GlcNAc PTM in the context of EMT and metastasis.
To explore the O-GlcNAc molecular signatures in TGF--induced EMT, we
developed a cleavable “click”-chemistry-based affinity enrichment probe, azide-reactive
DBCO-SS-resin. Of all the O-GlcNAc enrichment strategies including immunoaffinity-
based21, WGA lectin-based22-23, chemoenzymatic biotin/avidin-based24-25, azide-reactive
cyclooctyne resin (ARCO)-based26, and resin-alkyne-based27, our affinity probe is
ARCO-resin-based. However, unlike the ARCO-resin that was suited for O-GlcNAc-
modified peptides, our probe is aimed at enrichment of intact proteins following the
strategy employed for the commercial resin-alkyne (Click-iT Protein Enrichment kit,
Invitrogen)27. In that strategy, the GlcNAz modified intact cellular proteins were captured
via CuAAC onto the resin-alkyne, thus as an alternative, we propose a SPAAC-based
strategy in which the GlcNAz modified proteins are enriched by capture onto DBCO-SS-
resin probe and released from the resin by reductive cleavage28. Previous studies have
shown that the ARCO-resin that selectively enriches proteins by SPAAC is more suited
to peptides since it avoids the toxic effect of Cu (I)26. Extension of the SPAAC-based
bead conjugation to intact proteins allows expansion of the utility of such probes.
Temming et al. briefly characterized a “capture and release” bicyclononyne-resin
possessing a hydrazine-cleavable levulinoyl linker29. Our cleavable DBCO-SS-resin
probe is hereby characterized and applied in EMT O-GlcNAc proteomics.
In this chapter affinity enrichment of O-GlcNAc proteins from NMuMG cell line
using the approach of metabolic labeling of cellular O-GlcNAc PTM with azido-sugar
111
and ligation of azido-sugar labeled proteins to resin-strained-alkyne by SPAAC is
described. The overall analytical workflow involves metabolic labeling, affinity O-
GlcNAc protein enrichment and shotgun proteomics (Figure 3.1). Prior to enrichment,
metabolic labeling of O-GlcNAc proteins with azido-GalNAc was confirmed by chemo-
selective staining with alkyne-conjugated fluorescein dyes and imaging by fluorescence
microscopy. The stability of the O-GlcNAz PTM in cell lysates was confirmed by a
similar dye-labeling strategy, and the proteins were resolved using 1D SDS-PAGE and
visualized by in-gel fluorescence scanning. The resin strained-cleavable-alkyne-
conjugated probe was prepared following the reaction scheme on Figure 3.2, by coupling
dibenzo-cyclooctyne-disulphide-N-hydroxysuccinimide ester to epoxy-activated amine-
terminated sepharose or ω-aminohexyl agarose. The efficiency of coupling was evaluated
by UV-Vis spectrophotometry while the reactivity, not the reaction kinetics, of the
modified bead probe was tested by MALDI-TOF MS analysis of the reduced and cleaved
glycoconjugate products. To detect O-GlcNAc proteins during TGF-1-induced EMT,
azido-GlcNAc-tagged proteins in pre-fractionated protein extracts from induced and non-
induced cells were enriched via SPAAC onto the alkyne-modified bead probe. The
selectivity of the enrichment strategy was assessed through evaluation of the bead
washing protocol to ensure that non-specific binding is minimized. The selectivity is
further demonstrated by biochemical enrichment factors of the identified proteins. The
specificity of the enrichment strategy was assessed in two ways; 1) by detection of
affinity enriched proteins from metabolically labeled NIH3T3 cells, and 2) by LC-
MS/MS quantification and identification of enriched O-GlcNAz-proteins from on-resin
tryptic digests of metabolically labeled NMuMG cells undergoing EMT. These peptides

112
Figure 3.1 Schematic representation of the combined Cu-free Click chemistry-based O-
GlcNAc affinity enrichment and shotgun proteomics approach for O-GlcNAc LC-
MS/MS glycoproteomic profiling.

113
Figure 3.2 Reaction scheme for the O-GlcNAc glycoproteomic profiling showing the
preparation of the “click-able” and cleavable bead probe and its application in affinity
enrichment of O-GlcNAc PTM. Two different raw bead resins, namely; EAH sepharose
4B and -aminohexyl agarose were used.

114
were not directly attached to the beads and were analyzed as the first fraction. The second
fraction consisted of the O-GlcNAz-modified peptides that were directly linked to the
beads by the triazolyl linkage and these were eluted via reduction of the disulphide linker
using DTT and saved for O-GlcNAc site-mapping. Analysis of this fraction required a
different kind of fragmentation method, electron transfer dissociation, and due to time not
permitting, the O-GlcNAc site-mapping was not accomplished in this study. However,
data from O-GlcNAc proteomic profiling based on the tryptic digests alone revealed
EMT and O-GlcNAc characterization that underscores findings from many previous
studies.
3.3 EXPERIMENTAL SECTION
3.3.1 Materials
-Aminohexyl agarose and dibenzocyclooctyne-disulphide-N-hydroxysuccinimide ester
were purchased from Sigma and EAH Sepharose 4B came from GE Healthcare. FITC-
alkyne, DBCO-naphthalimide, peracetylated N-azidoacetylgalactosamine, peracetylated
N-acetylgalactosamine and 3-azido-7-hydroxycoumarin were synthesized in-house.
Click-iT L- homopropargylglycine, was purchased from Gibco Invitrogen. NMuMG and
NIH3T3 were purchased from ATCC (Manassas, VA). DBCO-Fluorescein was
purchased from Click Chemistry Tools (Scottsdale, AZ). Cell scraper was obtained from
BioTang Inc. (Lexington, MA). Benzonase and sequencing trypsin were purchased from
Promega (Madison, WI). Protease and phosphatase inhibitor and immunoblotting
reagents were purchased from Thermo Fisher Scientific (Grand Island, NY). SDS-PAGE
materials and RNA extraction kit were obtained from Biorad (Hercules, CA).
115
Transforming Growth Factor beta-1 was purchased from R&D Systems (McKinley, NE).
Anti-Snail1 antibody was purchased from Cell Signaling (Danvers, MA). All other
chemicals were purchased from Sigma (St. Louis, MO).
3.3.2 Coupling of DBCO-SS-NHS Linker to -Aminohexyl Agarose and EAH
Sepharose 4B Resins
3.3.2.1 Synthesis of the Strained Alkyne-resin and Evaluation of the Efficiency of
Coupling
Three 250 L (1.75-3 mol active amino groups) aliquots of bead slurry were placed in
empty spin columns. Synthesis of the bead probe was done through coupling of DBCO-
SS-NHS to commercial beads following the manufacturer’s instructions, where available.
Prior to coupling, the beads were prepared by washing 1× with acidified water (pH 4.7)
and 1× with 0.5 M NaCl. Next, the beads were rinsed 2× with coupling buffer (50%
dioxane in acidified water, pH 4.7). The wash flow-throughs were collected by
centrifugation (200 × g, 30 s) to obtain drained bead matrix. 20 mM solution containing
4.18 mol DBCO-SS-NHS was added to each of the three drained bead samples and
coupling was allowed at room temperature for 24 h on an end-over-end rotator. After
coupling the beads were washed 4 times with coupling buffer, 1× with acidified water
and 1× with 0.5 M NaCl. The absorbance of the DBCO linker in the series of wash flow-
throughs were determined by UV-Vis spectrophotometry at a wavelength of 302 nm.
Thus, the amount of DBCO linker retained on the beads was estimated. To facilitate the
estimation, a standard curve was prepared from 100-fold diluted aliquots of the starting

116
Figure 3.3 Reaction scheme for evaluation of the “click-able” and cleavable bead probe
using UV-vis spectrophotometry and MALDI-TOF MS.

117
solution. The first four wash flow-through samples used were blanked with coupling
buffer.
Initially coupling of DBCO-SS-NHS to -aminohexyl agarose was performed
using different conditions, none of which were from the manufacturer as these were not
available. Coupling was done with excess linker (equivalent to 2× mol of active amino
groups in beads) in 70% DMSO/30% PBS with incubation for 2 h on end-over-end
rotator.3.3.2.2 Determination of Suitable Conditions for Cleavage of Bead-conjugated
Product
The reductive cleavage elution buffer consisting of 20 mM DTT, 1 M Urea and 50 mM
NH4HCO3 was adopted from Howden et al. who used it for elution of biotin-avidin
enriched proteins28. The cleavage conditions were initially determined for the -
aminohexyl agarose but used later with the EAH Sepharose. After coupling of DBCO-
SS-NHS linker to resin beads, 20 L aliquots of slurry of modified and unmodified beads
were placed in 1.5 mL Eppendorf tubes. The beads were briefly centrifuged (200 × g, 30
s) and the supernatant was removed from the top of the slurry. The beads were rinsed
with water, which was removed too. Next the modified and unmodified beads were
incubated with DTT in different solutions: 1) 40 mM DTT in 60% DMSO containing 1
M Urea and 50 mM NH4HCO3; 2) 40 mM DTT in 0% DMSO containing 1 M Urea and
50 mM NH4HCO3; 3) 40 mM DTT in 60% DMSO only. The samples were kept in a
shaker at 37ºC for 1 hr. After the first fraction of eluents was collected, fresh DTT
solution was added and the beads were incubated again to get the second fraction. The
cleaved DBCO conjugate was detected by UV-Vis spectrophotometry.

118
3.3.2.3 Testing Whether the Beaded Resin Probe is Azide-reactive
MALDI-TOF MS analysis of the eluted GalNAz conjugate was performed according to
the procedure on MALDI analysis of starch hydrolysis by Grant et al30. After coupling of
DBCO-SS-NHS linker to resin beads, 50 L aliquots of slurry of modified and
unmodified beads were placed in 1.5 mL eppendorf tubes. The beads were rinsed 2× with
50% dioxane (EAH Sepharose) or 50% DMSO (-aminohexyl agarose) and supernatant
was removed by pipetting from the top of the slurry. Next, the beads were incubated with
10 mM AC4GalNAz (50 L) in 50% Dioxane or 50% DMSO for 24 h on a shaker at
37ºC for SPAAC conjugation of AC4GalNAz to alkyne on beads. The SPAAC conditions
used here were based on the on-bead SPAAC kinetics reported in Temming et al29. After
SPAAC the supernatant was removed and beads were washed 5× with the coupling
buffer to get rid of unbound AC4GalNAz. Subsequently the beads were incubated with 40
mM DTT in coupling buffer for 1 h at 37ºC for reductive cleavage of the covalently
bound AC4GalNAz. The eluent (cleavage GalNAz conjugate = m/z 817.4) was analyzed
by MALDI-TOF MS. A mixture of 2 L eluent, 100 M AC4GalNAc and 10 mM NaCl
in 50% dioxane or DMSO was made. An aliquot of this mixture was mixed 1:1 with
DHB matrix solution, spotted on the MALDI target plate and air-dried, before analysis.
External calibration was done using AC4GalNAc ([M+Na]+ = 411.547 Da). Spectra were
acquired from 200 shots in positive linear mode in the m/z range 200-2000.
3.3.3 Cell Culture
NIH3T3 cells were cultured in high-glucose DMEM media (Hyclone, ThermoScientific)
supplemented with 10% FCS (Hyclone, ThermoScientific). NMuMG cells were cultured

119
in low-glucose DMEM media containing 10% FBS and 10 g/mL insulin. All cells were
seeded at a density of 1 million cells in 10-cm culture plates and were maintained in a
humidified incubator at 37ºC and 5.0% CO2.
3.3.4 Metabolic Labeling with AC4GalNAz
After 24 h and at about 70% confluence, all media were replaced with low-glucose
DMEM containing 200 M AC4GalNAz (200 mM stock in DMSO) of DMSO vehicle,
and the labeling was done for 16 h. NMuMG cells were induced with 100 pM TGF-1 or
1% BSA in 4 mM HCl vehicle and 200 M AC4GalNAz was added 8 h after induction
with TGF-1 so that the duration for induction was 24 h and that for AC4GalNAz
labeling was 16 h.
3.3.5 Metabolic Labeling and Pulse-Chase with HPG
Double and single metabolic labeling and pulse-chase with HPG were carried out
according to the procedures in Duan et al.31-32 Beatty et al.33 and Liu et al.34 Briefly two
12-well plates were seeded with 6×10⁴ cells per well on sterile microscope cover slips
immersed in high-glucose DMEM supplemented with 10% FBS, 1%
penicillin/streptomycin, and 10 g/mL insulin, and containing 100 M AC4GalNAz or
DMSO vehicle. Cells were cultured for 48 h and in the last 6½ h cells were starved for 30
min, pulsed with HPG for 4 h and chased with L-Methionine for 2 h before fixing and
staining.
120
3.3.6 Fluorescence Visualization of GalNAz-tagged Proteins in Fixed NIH3T3 and
NMuMG Cells
Cells were seeded in 12-well plates on sterile microscope cover slips disinfected by
immersion in 70% ethanol and UV irradiation for 20 min. After 16 h of AC4GalNAz
labeling, wells were washed 3 times with warm PBS, and then fixed with 4%
paraformaldehyde in PBS for 10 min. Cells were permeabilized with 0.1% Triton X-100
in PBS for 30 min, rinsed with PBS and blocked with 0.1 M Glycine in PBS for 30 min.
Dye-labeling was carried out with 10 M DBCO-fluorescein or FITC-alkyne for 30 min.
For double metabolic labeling, cells were stained with multiple stains, first, DBCO-
fluorescein or FITC-alkyne for the GalNAz tag, then Azide-42 for HPG tag, and then
DAPI or propidium iodide for nuclear DNA. After dye-labeling the wells were washed
four times with a wash solution containing 1% Tween 20 and 0.5 mM EDTA in PBS, and
once with ddH2O.
3.3.7 Preparation of Cellular Protein Extract for Immunoblotting
Cellular protein extracts were prepared according to the procedure by Zaro et al.
modified. Cells were resuspended in hypotonic buffer (10 mM HEPES, pH 8.0, 1.5 mM
MgCl2, 10 mM KCl, 1X protease and phosphatase inhibitor), and disrupted with a
homogenizer. The samples were incubated on ice for 30 min for lysis to be completed.
Crude nuclei were pelleted by centrifugation (500 × g, 5 min). To prepare cytoplasmic
extracts, this nuclei- depleted supernatant was centrifuged at 20,000 × g to pellet
insoluble (i.e. membrane and small organelle) material and the resulting supernatant was
saved. To prepare nuclear extracts, the crude nuclear pellet was resuspended in sucrose
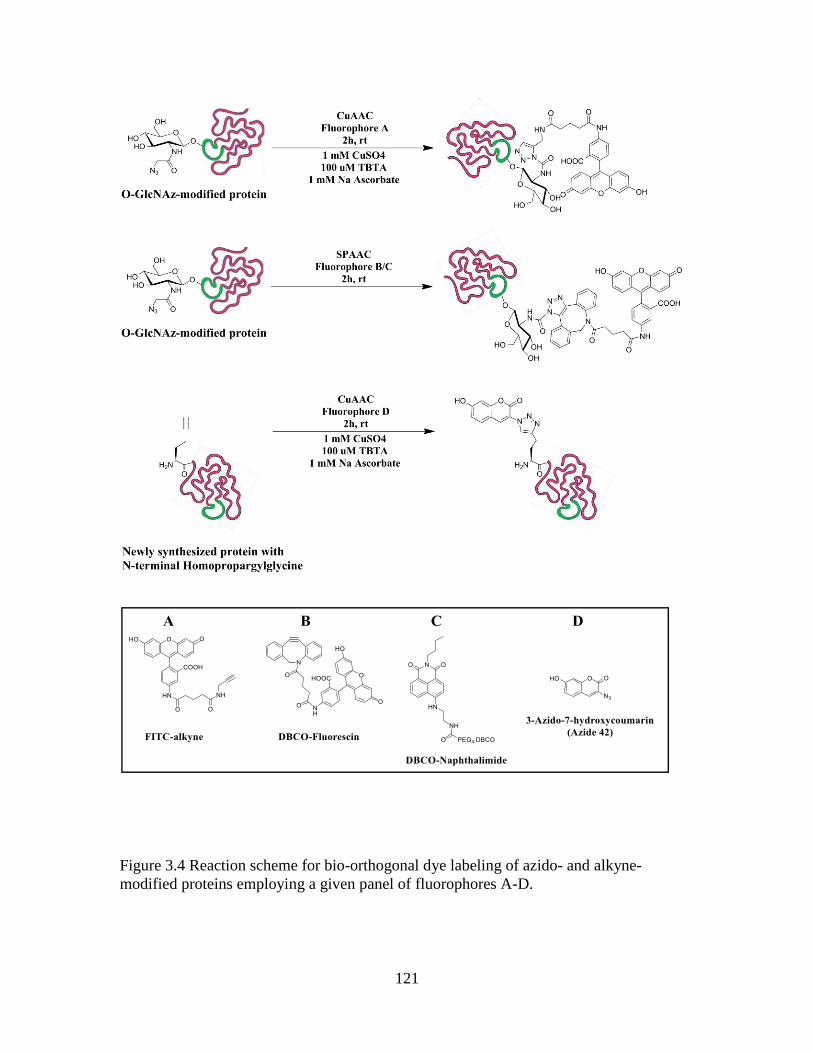
121
Figure 3.4 Reaction scheme for bio-orthogonal dye labeling of azido- and alkyne-
modified proteins employing a given panel of fluorophores A-D.
122
buffer A (250 mM sucrose, 10 mM MgCl2), layered over an equal volume of sucrose
buffer B (880 mM sucrose, 0.5 mM MgCl2) and pelleted by centrifugation (2,800 × g, 10
min). This highly purified nuclear pellet was resuspended in 1% Triton X-100, 300 mM
NaCl, 20 mM Tris pH 7.4. All samples were sonicated and cleared by centrifugation
(10,000 × g, 10 min).
3.3.8 Western Blotting
Alternatively, cells were lysed in RIPA buffer with protease and phosphatase inhibitors,
and then prepared and immunoblotted according to the procedure by Lamouille et al.
modified35. Protein concentration was determined using a modified Bradford protein
assay (Pierce, ThermoScientific). 20 mg of protein was separated by SDS-PAGE and
transferred to nitrocellulose membranes which were blocked with 5% dry milk TBST for
1 h before overnight incubation with primary antibody diluted in 3% BSA in TBST.
HRP-conjugated secondary antibody (Jackson ImmunoResearch Laboratories) was
applied and detected by ECL (Pierce, ThermoScientific) and BioMax film (Kodak).
3.3.9 RNA Extraction and Reverse-Transcription Quantitative Polymerase Chain
Reaction (RT-qPCR)
RT-qPCR was performed following the procedure in Saha et al. Briefly total RNA was
extracted from NMuMG cells induced with 0, 2 and 5 ng/L TGF-1 after 2 days of
culture using RNeasy mini purification kit (Qiagen) and subsequently reverse-transcribed
with qScript cDNA synthesis kit (Quanta Bioscience, inc.). RT-qPCR was carried out for
45 cycles of PCR (95 ºC for 15 s, 58 ºC for 15 s and 72 ºC for 30 s) with iQ5 SYBR
Green Supermix (Biorad) using the Snai1 and Gapdh primers shown in Table 2. The
123
reaction mixture of 25 L total volume included 200 nM of both forward and reverse
primers (Integrated DNA Technologies, inc.) and the cDNA template at a final
concentration of 0.25 ng/L. Data analysis was performed using 2-CT method for
relative quantification. The samples were normalized to Gapdh as the internal control.
The reaction was repeated using another batch of NMuMG samples.
3.3.9 Preparation of Nonidet P-40 (NP-40)-Soluble Lysates for SDS-PAGE and In-gel
Fluorescence Visualization
Preparation of NP-40-soluble lysates was done following the method of Zaro et al.
modified36. Briefly, after 16 h or labeling cells harvested in ice-cold PBS using cell
scraper after washing plates with ice-cold PBS. The cell suspension was centrifuged at
100 × g for 5 min at 4 ºC. The pellet was washed again in ice-cold PBS before re-
suspension in about 100 L 1% NP-40 lysis buffer containing 1 × protease and
phosphatase inhibitor solution. Samples were incubated on ice for 30 min for cell lysis to
be completed. Samples were then centrifuged at 10,000 × g for 10 min at 4 ºC. The pellet
was discarded while supernatant was used for labeling of GalNAz-tagged proteins. Total
protein in the supernatants of the GalNAz-labeled and control cell lysates was quantified
by Bradford assay using BSA as standard.
3.3.10 In-gel Fluorescence Visualization of GalNAz-tagged Proteins from NIH3T3 Cell
Lysates
A 200 L reaction mixture containing 1 mg/mL cell lysate protein in the presence of 100
M DBCO-fluorescein or DBCO-naphthalimide dye was set up. Alternatively the
amount of cell lysate protein was mixed with click chemistry reagents; 100 M FITC-

124
alkyne, 1 mM ascorbic acid, 1 mM TBTA and 1 mM CuSO4.5H2O. Dye-labeling reaction
was carried out at 10 ºC for 10 h. An additional condition of room temperature 1 h was
included to find out the suitable conditions for dye labeling with DBCO-naphthalimide.
When labeling was completed, 1 mL of ice-cold methanol was added and the mixtures
placed at -80 ºC for 2 h to precipitate the proteins. The cold mixtures were centrifuged at
10,000 × g for 10 min at 4 ºC. The supernatant was discarded and the pellet air-dried. The
proteins were re-solubilized in 50 L of 4% SDS buffer [4% SDS, 150 mM NaCl and 50
mM Tris, pH 7.4] in a bath sonicator. The samples were diluted accordingly and total
protein quantified by Bradford assay, using BSA as standard. Samples were further
diluted 2-fold by adding 50 L of 4 × SDS-free loading buffer containing 1.4% -
mercaptoethanol. 30 g protein of each sample was loaded onto gel for SDS-PAGE
analysis. Prestained protein standards were used as weight markers while FITC-IgG was
used as a positive for fluorescence.
3.3.11 Optimization of Washing Protocol of the Beads to Remove Non-specifically
Bound Proteins
Different bead-washing conditions were tested to aid in establishing an optimized in-
house bead-washing method. In each test about 200 L bead slurry (-aminohexyl
agarose, Sigma) was added to at least two empty spin columns (Pierce, Thermo
Scientific). The beads were washed twice with PBS and once with the protein
conjugation buffer. One tube was loaded with 2 mg of cell lysate protein and the other
tube (control) was loaded with conjugation buffer without protein. Both tubes were
incubated under SPAAC conditions and then washed according to the washing conditions

125
under test. The bead washing was evaluated by SDS-PAGE to check the protein content
of the wash flow-throughs, the DTT-eluted fraction and the denatured beads. To a gel
with 30 L well capacity was loaded a mixture of 15 L wash sample and 15 L SDS
loading buffer containing 5% -mercaptoethanol. Prestained protein standards solution
was loaded in weight markers’ lane.
To two sets (A and B) of three empty spin columns each was added 400 L bead
slurry (EAH Sepharose, GE Healthcare). The bead bed was washed with acidified water,
pH 4.7 and 0.5 M NaCl to prepare it for loading. The first tube of each set was loaded
with 10 mg cell lysate protein, the second was loaded with 10 mg BSA while the third
was loaded with same lysis buffer as was used for samples in the first and second tubes
(0.01 × Urea buffer), but no protein. All tubes were incubated under SPAAC conditions
(37 ºC for 24 h, on a shaker) to mimic coupling of GalNAz-tagged proteins to DBCO-
modified beads. At the end of incubation, the SPAAC supernatant was removed and
beads in set A tubes were washed according the manufacturer’s protocol while beads in
set B tubes were washed according to the in-house protocol. The bead-washing protocols
were evaluated by measuring the amount of protein in DTT-eluted fraction (Bradford
assay, with BSA as standard) and by SDS-PAGE profile of denatured beads. Before
Bradford assay, the DTT eluents were dialyzed against 0.1M PBS, pH 7.4 overnight.
3.3.12 Preparation of Cellular Protein Extract and Affinity Enrichment of Cellular O-
GlcNAc Proteins
For analysis of affinity-enriched proteins using SDS-PAGE, azido-GalNAc-labeled and
control, NIH3T3 cells were harvested as indicated above. 5 × 10⁶ cells per sample were
126
lysed in 1% SDS/PBS buffer containing 1× protease inhibitor and benzonase. 800 L
lysate was added to DBCO-SS-modified beads and incubated on a shaker under SPAAC
conditions for the azido-labeled proteins to be conjugated to the beads. After SPAAC the
beads were washed 3 times with alternate low and high pH SDS wash buffer, 5 times
with urea/bicarbonate wash buffer, 5 times with 20% acetonitrile in H2O. For each wash
the beads were incubated 5 min on shaker at 37 ºC. The washing procedure used here was
applied before establishment for the in-house washing protocol. After washing, the
conjugated proteins were eluted by incubation for 1 h at 37 oC in 40 mM DTT elution
buffer. Elution was repeated to collect the 2nd fraction. A total of 200 L of the eluents
was reduced and concentrated in a SpeedVac to 20 L.
For analysis of affinity-enriched protein using LC-MS/MS, Azido-GalNAc-
labeled and control, TGF-1-induced and non-induced cells (5-10 × 107) were harvested
as indicated above. The cell extracts and protein samples were prepared according to
procedures used in Hahne et al. and Boyce et al27, 37. The cell pellets were re-suspended
in 500 L hypotonic lysis buffer [10 mM HEPES, 1.5 mM MgCl2, 10 mM KCl, 1×
protease and phosphatase inhibitor and 20 M PUGNAc] and cells were homogenized
for 1 min using 3 out 5 power. The samples were incubated on ice for 30 min for lysis to
be completed. Crude nuclei were pelleted by centrifugation (500 × g, 15 min, 4 ºC). The
supernatant was used for fractional enrichment of Cytosolic extracts while the pellet was
further processed for isolation of nuclear extracts.
The 1-mL nuclei-depleted supernatant was transferred to 10-mL ultra-centrifuge
tube and the volume was adjusted to about 9 mL using cold water. The samples were

127
centrifuged at 145,000 × g for 1 h at 4 ºC. The clarified supernatant was placed in a 4 mL
chamber of a 15-mL MWCO (3K) centrifugal tube and centrifuged at 10,000 × g for 10
min at 4 ºC. The retentate was re-suspended in 8M Urea buffer [8 M Urea, 100 mM Tris,
pH 8, 4% CHAPS, 1 M NaCl, 1 × protease and phosphatase inhibitor solution].
The pellet containing crude nuclei (obtained after homogenization) was re-
suspended in sucrose buffer A [250 mM sucrose, 10 mM MgCl2], layered onto sucrose
buffer B [880 mM sucrose, 0.5 mM MgCl2] and centrifuged at 2800 × g for 10 min at 4
ºC. The resultant pellet contained purified nuclei. The pellet was re-suspended in
hypotonic lysis buffer supplemented with 0.1% SDS. The nuclei were lyses with a probe-
tip sonicator for 30 sec at the lowest speed. The nuclear proteins were precipitated using
chloroform/methanol method and the precipitate was re-solubilized in 8M Urea lysis
buffer. The nuclear extracts were mixed with the cytosolic extract to create a sample from
which O-GlcNAc proteins could be ‘fished out’. The concentration of protein in this
sample was determined by Bradford assay using BSA as standard.
Each of the five 1 mg protein samples was reduced using 10 mM DTT at 30 ºC
for 1 h and alkylated using 50 mM iodoacetamide at 37 ºC for 1 h in the dark. The protein
solutions were centrifuged in MWCO (3K) spin columns to remove DTT. The retentates
were suspended in water and loaded to the respective bead samples. Samples were
incubated on a shaker at 37 ºC for 24 h to allow conjugation of Azido-GlcNAc proteins to
the beads by SPAAC. After SPAAC, the supernatant was removed by centrifugation at
200 × g for 1 min at room temperature. All the bead samples were washed according the
manufacturer’s protocol using 4 cycles of alternate solutions of high and low pH. These
solutions were 0.1 M Sodium acetate buffer, pH 4 containing 0.5 M NaCl and 0.1 M Tris
128
buffer, pH 8 containing 0.5 M NaCl. The beads were next rinsed with acidified water, pH
4.7 before incubation with 20 ng/L Trypsin for about 16 h at 37 ºC. The fraction of
peptides was collected by centrifugation. The beads were rinsed with acidified water and
the rinses were pooled together with their respective fractions. Before DTT elution, bead
washing was repeated following the 4 cycles of alternate solutions of high and low pH.
After rinsing with acidified water, the beads were incubated with 50 mM DTT in 1 M
urea and 50 mM NH4HCO3. The eluent was collected by centrifugation. The beads were
rinsed with elution buffer and the rinses were pooled together with their respective
fractions. All peptide samples were desalted using iSEP tips. The eluents obtained were
concentrated by vacuum drying in a SpeedVac, and re-diluted with 0.1% formic acid to
about 10 L. 1 L aliquots of the eluents were mixed with CHCA matrix and analyzed
by MALDI-TOF MS to ensure presence of peptide before LC-MS/MS analysis.
3.3.13 LC-MS/MS Analyses
Mass spectrometry was performed on an LTQ Orbitrap Velos mass spectrometer
(Thermo Fisher Scientific, Germany) connected to a nanoLC Ultra 1D+ liquid
chromatrography system (Dionex,) using both pre-column and analytical column packed
with ReproSil-Pur C18 (New Objective, Germany). The mass spectrometer was equipped
with a nanoelectrospray ion source (Pico Chip,), and the electrospray voltage was applied
via a liquid junction. All measurements were performed in positive ion mode. Intact
peptide mass spectra were acquired at a resolution of 7500 at a normal mass range, and
an automatic gain control target value of 106, followed by fragmentation of the most
intense ions by collision-induced dissociation. CID was performed in the FTMS for up to
8 MS/MS (4 h gradient) per full scan with 35% normalized collision energy and an AGC

129
target value of 5000. Both full scans and tandem mass spectra were acquired in profile
mode. Singly charged ions and ions without assigned charge state were excluded from
fragmentation, and fragmented precursor ions were dynamically excluded (4 h gradient,
30 s). Internal calibration was performed using Pierce LTQ Velos ESI positive ion
calibration solution (Pierce,). The raw MS1 and MS2 spectra were generated using
Proteome Discoverer software (Thermo Fisher Scientific) and saved as .RAW files.
Intensity-based label-free quantification and protein identification from on-resin
digestion experiments were achieved with the MaxQuant computational proteomics
platform and its integrated search engine, Andromeda (Max Planck Institute of
Biochemistry, Martinsried, Germany). The .RAW files were loaded into MaxQuant
version 1.2.5.6 interface where detected features were preprocessed through alignment of
the retention times and m/z across samples and recalibration of precursor ion peak
intensity outputted as LFQ intensity. Andromeda automatically searched the resulting
peak lists of precursor and fragment ions against Mouse Fasta database (UniProtKB)
using search parameters that included a precursor tolerance of 2 ppm and a fragment
tolerance of 0.5 Da for CID spectra. Enzyme specificity was set to trypsin, and up to 2
missed cleavage sites were allowed. The variable modifications allowed were oxidation
of Met and phosphorylation of Ser and Thr while the fixed modification was
carbamidomethylation of Cys. Tables of detailed results showing protein identities and
search parameters, mass spectrometric parameters, peptide sequences and their LFQ
quantities were automatically generated.
130
3.3.14 Data Analysis
Prior to data analysis, contaminants were discarded from the protein list if identified as
trypsin or if they had no gene name. The biochemical O-GlcNAc protein enrichment
factors of the proteins were determined based on label-free quantification following the
procedures by Hahne et al27. Briefly, the biochemical enrichment factor of a given
protein was calculated as the ratio of its LFQ intensity in the O-GlcNaz-labeled sample
compared to that in the control (unlabeled) sample. The LFQ intensity of each protein
represents the summed intensities of unique peptides including the razor signal. In the
case of missing values, where a protein was present in either the labeled or unlabeled and
not in the other, 3000 was used as the smallest value to avoid zero and infinite ratios. The
biochemical enrichment factors were then converted to Log2 ratios. All proteins with log2
enrichment factor <2 were considered non-specifically bound since they were found in
the unfunctionalized beads, hence they were discarded. The list of bead-enriched O-
GlcNAc proteins was subjected to downstream bioinformatics analysis to understand the
protein expression changes in our system and the relevance of these changes to EMT and
metastasis.
Gene Ontology enrichment analysis was performed using the Ingenuity Pathway
Analysis, proprietary software that maps experimental data to the Ingenuity Knowledge
Base and provides four basic outputs; canonical pathways enriched in the data, biological
functions and diseases overrepresented in the data, plausible molecular networks showing
molecular interactions, as well as upstream regulators that might explain changes
observed in the data. As parameters for the analyses, settings were made to explore direct
and indirect relationships among proteins/genes in our data reference to mouse mammary

131
gland or breast cancer cell lines. The threshold and level of significance was set to p <
0.05. Fisher’s Exact Test p-value was used to demonstrate significant enrichment or
overrepresentation while activation and inhibition were predicted based on the z-score.
Each of these two statistical measures was used depending on the analysis type. The
Fisher’s Exact Test compares the similarity between proportions of significant molecules
that map to a function/pathway in the experimental data to that of the molecules in the
reference data that map randomly to a similar function/pathway. The Z-score determines
the overall prediction direction based on expression values of individual proteins.
3.4 RESULTS AND DISCUSSION
A SPAAC click-chemistry-based strategy for affinity enrichment and identification of
proteins modified by the post-translational O-GlcNAc glycosylation has been described.
The enrichment scheme is summarized in Figure 3.1. The present strategy was adopted
from a CuAAC click-chemistry-based affinity enrichment of O-GlcNaz-modified
proteins onto resin-alkyne bead probe, developed and commercialized by Invitrogen27.
Application of the commercial resin-alkyne in large-scale enrichment of HEK293 cellular
O-GlcNaz-modified proteins has been demonstrated. In comparison, our strained-
cleavable alkyne was prepared in-house by coupling DBCO-SS-NHS ester to amine-
terminated Sepharose beads via amidation reaction. The efficiency of coupling and the
azide-reactivity of the strained-cleavable-alkyne bead probe were evaluated by UV-Vis
spectrophotometry and MALDI-TOF MS, respectively. Our enrichment strategy is
unique in three ways: 1) coupling of O-GlcNAz-labeled proteins onto the bead probe
occurs by SPAAC, 2) coupling takes place in an aqueous buffer (e.g. Urea/Tris buffer)
with neither copper catalyst, reducing agent nor ligand, and 3) the bead probe possesses a
132
disulphide bridge for easy and reproducible elution of covalently coupled proteins under
mild reducing conditions. Overall, several measures were taken to maintain selectivity
toward O-GlcNAc purification. Many precautions including growing cells under low
glucose conditions to reduce azide tagging of N-linked and O-linked mucin glycans, and
ultracentrifugation of cell lysate to clear away potentially unspecific protein background,
were borrowed from Zaro et al. and Hahne et al27, 38. Details of evaluations of the
coupling reactions, metabolic-, and dye-labeling of fixed cells and cell lysates, bead
washing optimization, enrichment, and identification of cellular O-GlcNAz-labeled
proteins from a TGF-β1-induced EMT model, are described below.
3.4.1 Evaluation of coupling DBCO-SS-NHS linker to -Aminohexyl agarose and EAH
Sepharose 4B beads
Preparation of strained-alkyne agarose beads was accomplished by coupling DBCO-SS-
NHS to EAH Sepharose 4B (GE Healthcare) and -aminohexyl agarose (Sigma) under
their respective optimum conditions that are different between the two. The goal of the
synthesis was to obtain 100% degree of modification so that the loading of the DBCO in
the bead probe is the same as the loading of the NH2 groups in the unmodified bead resin.
We also aimed at reproducing this high DOM. Given that the reaction stoichiometry is
1:1, the UV-Vis measurements of uncoupled DBCO-SS-NHS washed from beads show
that coupling was most efficient and repeatable when starting with excess amount of
DBCO-SS-NHS ester since two molar equivalent of the ester to that of the reactive NH2
groups on the beads resulted in 100% DOM. Furthermore, we used MALDI-TOF
analysis to show that the bead probe is azide reactive. The MALDI spectra of DTT-eluent
obtained after coupling azido-GalNAc to the modified bead probe revealed a [DBCO-
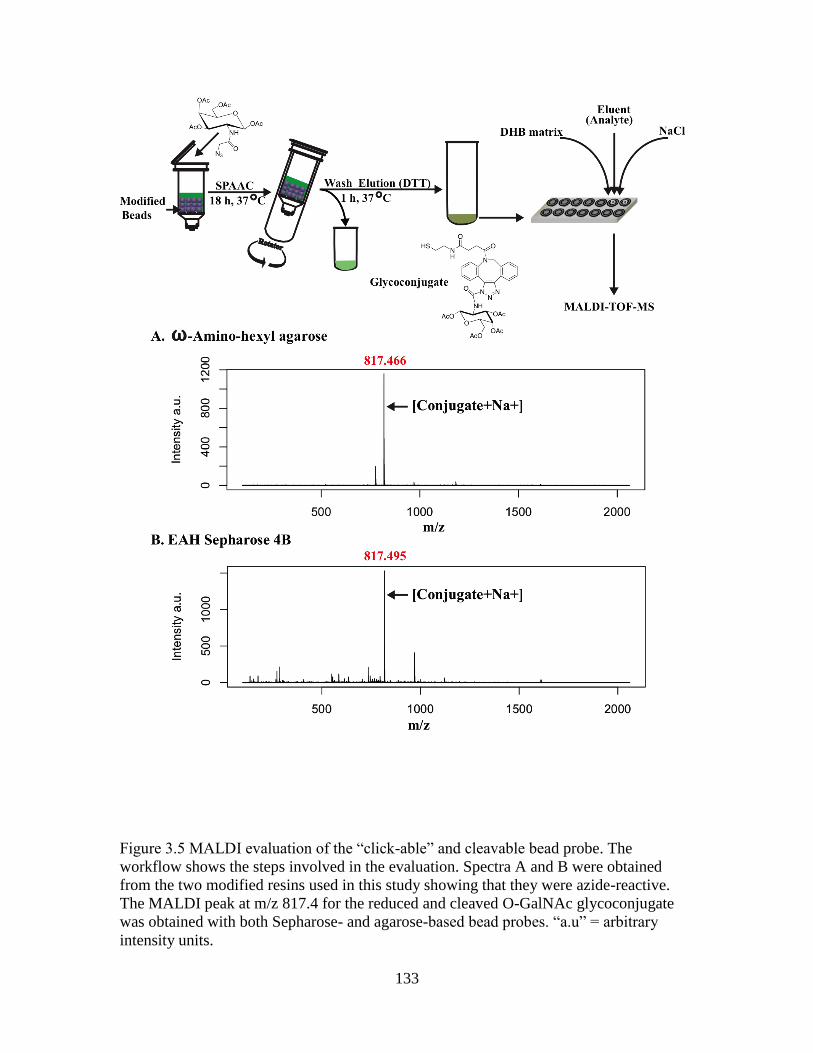
133
Figure 3.5 MALDI evaluation of the “click-able” and cleavable bead probe. The
workflow shows the steps involved in the evaluation. Spectra A and B were obtained
from the two modified resins used in this study showing that they were azide-reactive.
The MALDI peak at m/z 817.4 for the reduced and cleaved O-GalNAc glycoconjugate
was obtained with both Sepharose- and agarose-based bead probes. “a.u” = arbitrary
intensity units.

134
SH-triazolyl-GalNAz + Na]+ cleavage product at m/z = 817.4 that was not obtained from
the control bead. This product is indicative of the reactivity of the strained-alkyne agarose
bead probe. The product was obtained from both EAH sepharose and -Aminohexyl
agarose showing that the reactivity of the strained-alkyne agarose bead probe is the same
regardless of the length of the linker and conditions that were involved in coupling alkyne
to the bead. In addition, the azide-reactivity test makes it confident to use the strained-
alkyne agarose bead probe for affinity capture and enrichment of Azido-GlcNAc tagged
proteins from complex biological samples of metabolically labeled cells.
UV-Vis spectrophotometry was also employed in the determination of the suitable
conditions for reductive cleavage of bead-bound linker (Table 3.1). It was estimated that
~ 60% of the product was cleaved in the first fraction, obtained by incubation of modified
beads with 40 mM DTT for 1 h at 37 ºC on a shaker, in the presence or absence of urea
and NH4HCO3. This indicates that urea and NH4HCO3, the likely components of a DTT
elution buffer for enriched proteins are not inhibitory to the reductive cleavage reaction.
The remaining bead-bound linker was recovered in the second fraction. DTT, Urea and
NH4HCO3 were components of a reductive cleavage elution buffer previously used in the
selective isolation of enriched proteins from drugged immune cells in a quantitative non-
canonical amino acid tagging strategy. Presence of DMSO or 1,4-dioxane in the cleavage
solution ensured solubility of the cleaved linker. However, these solvents will not be
needed in elution of actual bead-bound proteins.

135
Table 3.1 Relative Amounts of DBCO Residues Cleaved from the DBCO-functionalized
Resin under Different Conditions
Elution (Reductive Cleavage)
Conditions
mol equivalents in 20 L (out of 200
L total bead slurry)
1-h eluent 2-h eluent
Modified beads+40mM DTT+60%
DMSO+Urea+NH4HCO3
0.063/0.1 63% 0.037/0.1 37%
Modified beads+40mM DTT+60%
DMSO
0.066/0.1 66% 0.031/0.1 31%
Modified beads+40mM DTT+0%
DMSO+Urea+NH4HCO3
0.038/0.1 38% 0.018/0.1 18%
Control beads+40mM DTT+60%
DMSO+Urea+NH4HCO3
0 0% 0 0%
Control beads+40mM DTT+0%
DMSO+Urea+NH4HCO3
0.0012/0.1 0.12% 0.0024 0.24%

136
Table 3.2 Evaluation of Coupling of DBCO-SS-NHS ester to EAH Sepharose resin
Bead
sample
Starting
linker
Wash Flow-throughs
(mol)
Total mol
in Washes
Retained
mol
A B C D
1 4.180 0.288 0.103 0.179 0.0046 0.4401 3.780
2 4.180 0.834 0.154 0.177 0.0043 1.0693 3.111
3 4.180 0.369 0.129 0.0312 0.00647 0.536 3.640

137
3.4.2 Dye-labeling and fluorescence microscopy of Azido-O-GlcNAc-tagged proteins in
fixed cells
Metabolic labeling of proteomes in cells using an unnatural sugar and a non-canonical
amino acid was followed with dye-labeling and fluorescence microscopy. The unnatural
sugar, GalNAz, non-canonical amino acid, HPG and their bioorthogonal fluorophores
have been successfully used elsewhere for labeling subsets of proteomes. As applied and
recognized in Duan et al., fluorescence of fluorophores used in this study is quenched by
the surrounding groups such as azide, and recovers upon formation of the triazole ring via
CuAAC and SPAAC reactions31, 39-40. The fluorogenic nature ensures minimal
background noise and high signal-to-noise ratio of detection41. Like many cell lines that
have been metabolically labeled with GalNAz in previous studies, our results show that
both NMuMG and NIH3T3 cells are amenable to metabolic labeling by azido-sugars and
to dye-labeling that tags the azido moiety with fluorescent alkyne dyes via CuAAC or
SPAAC36, 38, 42. In both cell cultures the green fluorescence arising from the FITC-alkyne-
Tagging of azido-labeled proteins colocalized with nuclear staining (Figures 3.7 and 3.8).
NMuMG was metabolically labeled with two bioorthogonal chemical reporters, azido-
GalNAc and homopropargylglycine (HPG) while NIH3T3 was labeled with one
bioorthogonal chemical reporter, azido-GalNAc. HPG is an analogue of the amino acid
Methionine and therefore tags the newly synthesized proteome, while Azido-GlcNAc
tags the PTM following synthesis of the proteome34. The blue fluorescence stain for
HPG-tagged proteins colocalized with green fluorescence stain azido-GlcNAc PTM and
the red fluorescence stain for nuclei.
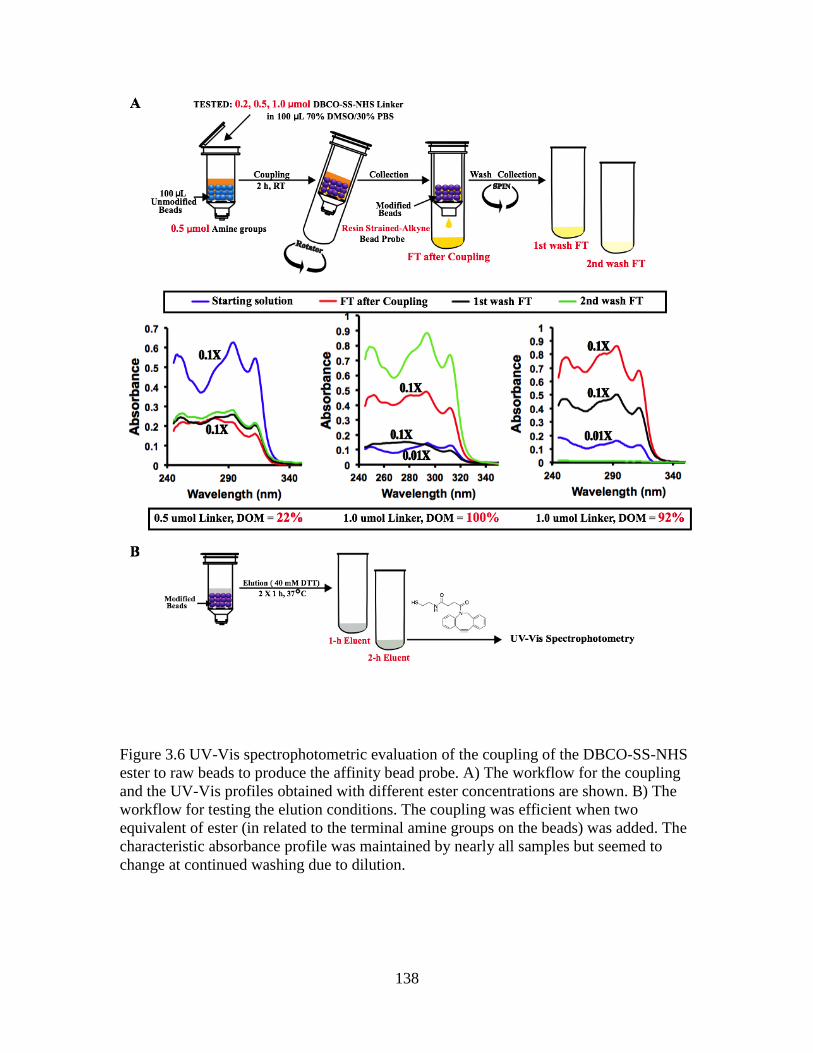
138
Figure 3.6 UV-Vis spectrophotometric evaluation of the coupling of the DBCO-SS-NHS
ester to raw beads to produce the affinity bead probe. A) The workflow for the coupling
and the UV-Vis profiles obtained with different ester concentrations are shown. B) The
workflow for testing the elution conditions. The coupling was efficient when two
equivalent of ester (in related to the terminal amine groups on the beads) was added. The
characteristic absorbance profile was maintained by nearly all samples but seemed to
change at continued washing due to dilution.
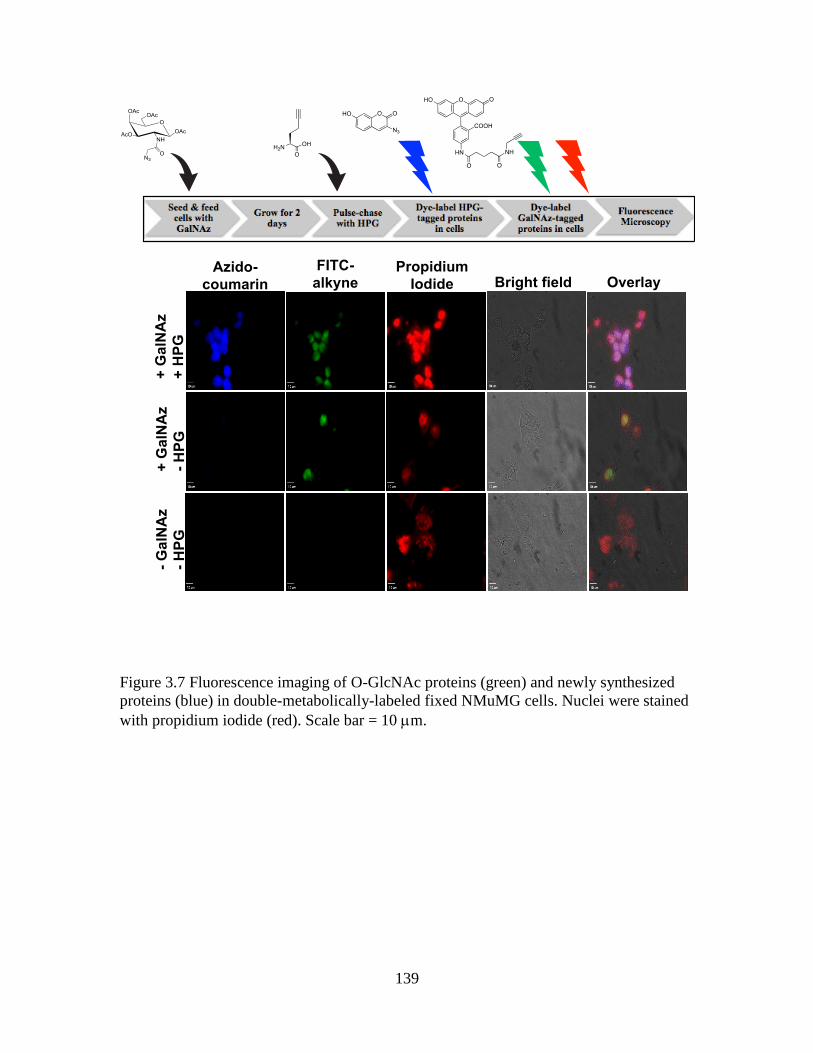
139
Figure 3.7 Fluorescence imaging of O-GlcNAc proteins (green) and newly synthesized
proteins (blue) in double-metabolically-labeled fixed NMuMG cells. Nuclei were stained
with propidium iodide (red). Scale bar = 10 m.
140
Fluorescence microscopy examination of dye-labeled HPG-tagged proteome and
azido-GlcNAc tagged PTM in fixed cells confirmed the metabolic labeling and aided in
the localization of the labeled proteome. In Figure 3.8 co-localization of DAPI with
FITC-alkyne in azido-GalNAc-fed NIH3T3 cells and not in the control, showed the
labeling of both nuclear proteome and its PTM. Cell population in the GalNAz-labeled
cultures was found to be lower than that in the control. A similar observation was
previously made by Duan et al32. In Figure 3.7, the three dye stains; namely, azido-
coumarin for HPG labeling, FITC-alkyne for azido-GalNAc labeling and propidium
iodide for nuclear staining, all colocalized in multiply-stained NMuMG cells, showing
azido-GlcNAc PTM of the newly synthesized proteome around the nucleocytoplasmic
region. The exent of FITC-alkyne staining is smaller than that of azido-coumarin staining
showing that not all the newly synthesized proteome has the O-GlcNAc PTM. The results
demonstrate that NMuMG cells can be metabolically labeled with bioorthogonal
chemical reporters to probe the O-GlcNAc PTM. Fluorescence Microscopy of dye-
labeled, HPG pulse-chased and azido-GlcNac tagged NMuMG cells was initially aimed
at monitoring dynamic glycosylation in TGF-1-induced EMT similar to the work of Liu
et al34. However, multiple staining seemed laborious and could not be easily reproduced,
hence it was not applicable to cells undergoing EMT. To overcome this limitation cells
undergoing EMT could have been followed by: 1) monitoring glycosylation of a target
protein, or 2) studying changes in global glycosylation using dye-labeling of azido-
GlcNAc PTM in cell lysates.

141
Figure 3.8 Fluorescence imaging of O-GlcNAc proteins (green) in metabolically-labeled
fixed NIH3T3 cells. Nuclei were stained with DAPI (blue). Scale bar = 10 m.

142
3.4.3 Fishing for Snail1 protein
Snail protein might be the only key transcription factor and EMT marker whose O-
GlcNAc in relation to phosphorylation has been well studied. Park et al. showed that the
presence of O-GlcNAc stabilizes Snail1 expression by inhibiting O-phosphorylation and
that O-GlcNAc PTM on Snail1 occurs in various cell lines. In addition, these researchers
demonstrated the presence of O-GlcNAc-modified Snail1 by immunoblotting following
succinylated Wheat Germ Agglutinin-affinity purification from total cell lysates10. For
this reason we were interested in using the strained-alkyne-cleavable bead probe to
enrichfor Snail1 from metabolically labeled NMuMG cells using the O-GlcNAz as a
handle for bead capture and enrichment, and to subsequently determine whether TGF-1-
induction of EMT has effect on how the O-GlcNAc PTM level changes. The goal was to
resolve using 1D SDS-PAGE, bead-enriched proteins from TGF-1-induced cellular
extracts and among them detect Snail1 using immunoblotting with anti-Snail1 antibody.
From preliminary work aimed at demonstrating presence of Snail1 without
enrichment, we failed to detect Snail1 by immunoblotting, despite an attempt to follow a
procedure that has been used previously35. On troubleshooting by analyzing positive
control cell lysates, Snail1 was detected (Figure 3.9 C) showing that the procedure
worked. In addition, Snail mRNAs were detected by qRT-PCR analysis of NMuMG
TGF-β1-induced and control lysates using the same optimized forward and reverse
primers for Snail and Gapdh (house-keeping gene) as were employed in Saha et al43.
Snail mRNA levels were 3-5 fold higher in induced cells than in the control (Figure
3.9B). The change in mRNA levels paralleled morphological change (Figure 3.9A)
during TGF-β1 induction, and both seemed to be dose-dependent. It was surprising that
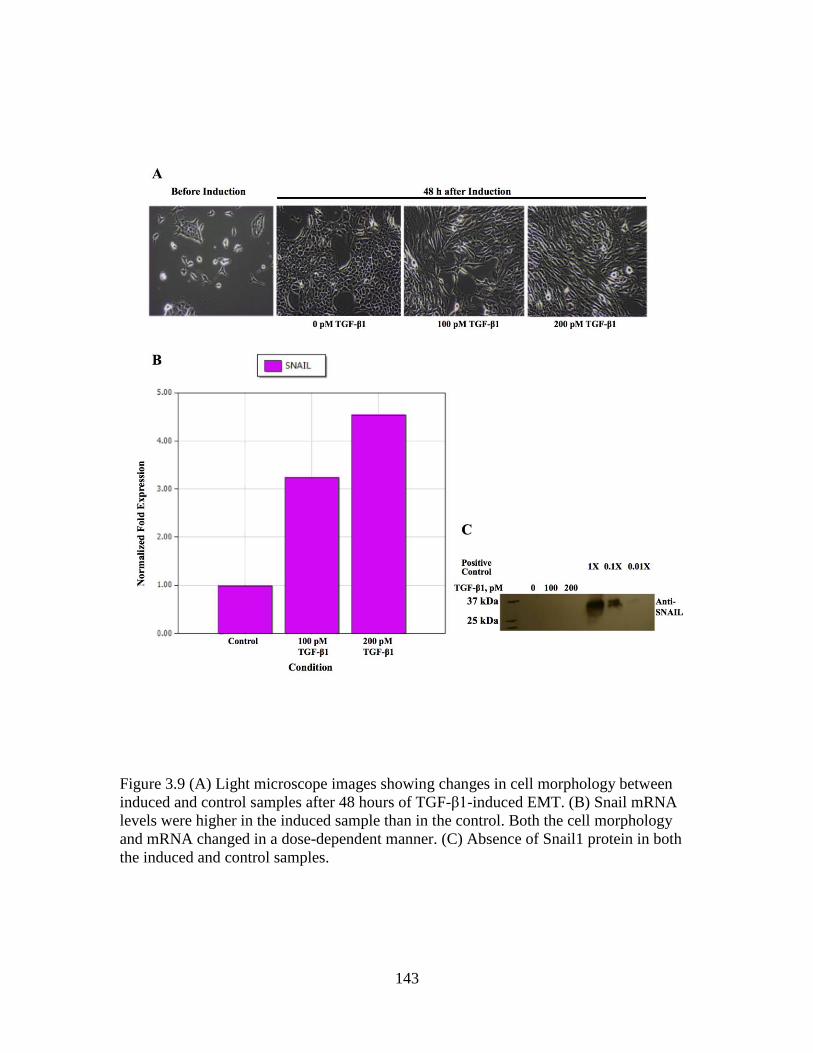
143
Figure 3.9 (A) Light microscope images showing changes in cell morphology between
induced and control samples after 48 hours of TGF-β1-induced EMT. (B) Snail mRNA
levels were higher in the induced sample than in the control. Both the cell morphology
and mRNA changed in a dose-dependent manner. (C) Absence of Snail1 protein in both
the induced and control samples.

144
despite these changes associated with Snail expression, Snail protein could not be
detected. Perhaps, the presence of Snail should have been monitored through following
its localization using immunofluorescence microscopy prior to isolation from cellular
extracts. Alternatively immunoprecipitation or succinylated Wheat Germ Agglutinin
(sWGA)-affinity purification of Snail should have been carried out to facilitate detection
as has been demonstrated in Park et al10. Failure to detect Snail paralleled inability to see
consistent morphological changes characteristic to EMT from different batches of the 48-
h TGF-β1-induced cell cultures, a problem that could be attributed possibly to some
inactive TGF-β1 protein aliquots among the refrigerated stock. As a consequence, the
work on Snail1 was discontinued.
3.4.4 Dye-labeling, SDS-PAGE and Fluorescent Scanning of Azido-O-GlcNAc-tagged
Proteins
Despite failure in detecting our target O-GlcNAc modified Snail, enrichment of global O-
GlcNAc proteins from the nucleocytoplasmic cellular fractions was pursued. We sought
to find out if Azido-O-GlcNAc tagged proteins in cell lysates could be detected through
dye-labeling via SPAAC since this has never been reported. We hypothesized that
successful labeling of Azido-O-GlcNAc tagged proteins in cell lysates with DBCO-
functionalized dye via SPAAC would indicate that such proteins could be attached to any
strained-alkyne in cell lysates regardless of whether the reaction environment is liquid
phase or solid phase. Prior to bead-based enrichment, Azido-O-GlcNAc tagged proteins
in cell lysates were directly labeled with an alkyne-conjugated fluorescein dye, and
subsequently detected by in-gel fluorescence scanning. Dye-labeling here, not only
confirmed the presence of azido functionality, but it proved that the azido group on
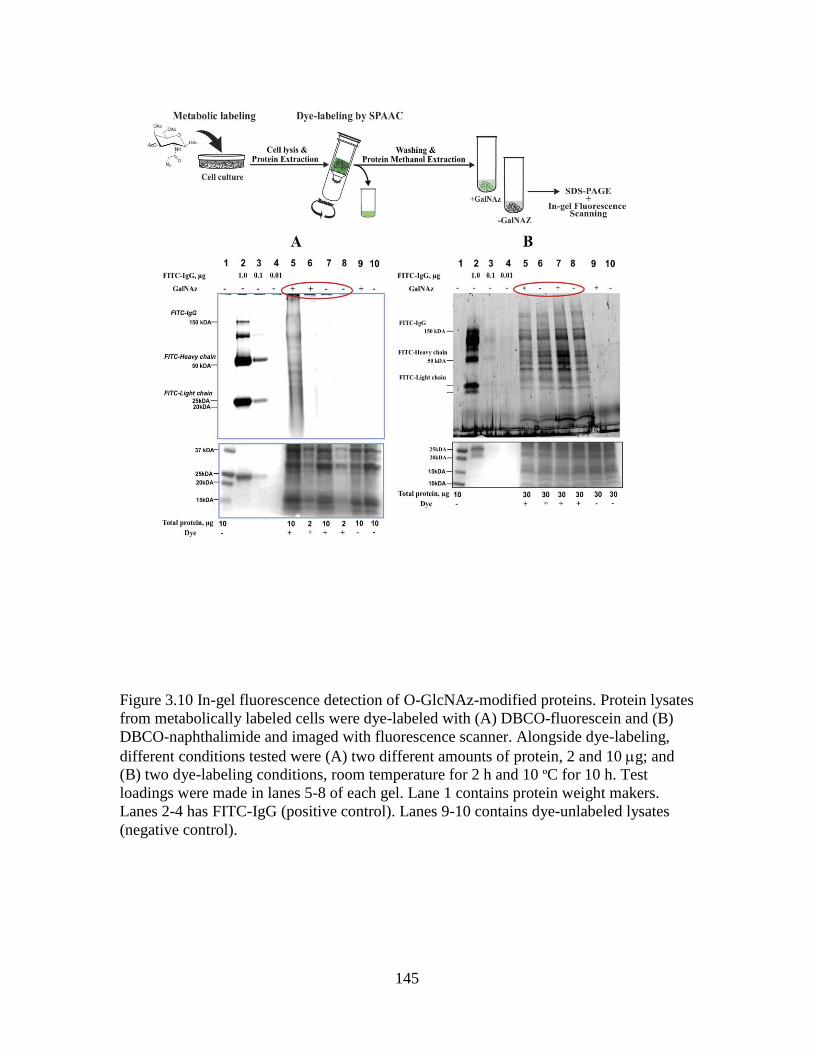
145
Figure 3.10 In-gel fluorescence detection of O-GlcNAz-modified proteins. Protein lysates
from metabolically labeled cells were dye-labeled with (A) DBCO-fluorescein and (B)
DBCO-naphthalimide and imaged with fluorescence scanner. Alongside dye-labeling,
different conditions tested were (A) two different amounts of protein, 2 and 10 g; and
(B) two dye-labeling conditions, room temperature for 2 h and 10 ºC for 10 h. Test
loadings were made in lanes 5-8 of each gel. Lane 1 contains protein weight makers.
Lanes 2-4 has FITC-IgG (positive control). Lanes 9-10 contains dye-unlabeled lysates
(negative control).

146
proteins can be probed via SPAAC in cell lysates, even though previous studies
exploitedonly the Cu-catalyzed click chemistry. Two dyes available in the lab, DBCO-
fluorescein and FITC-alkyne, were used for dye-labeling of proteins in cell lysates. The
dyes were tested on NIH3T3, a cell line that has been previously labeled in other
studies38. Labeling was done by incubation at 10 ºC for 10 h on a shaker. No signal was
observed from FITC-alkyne-labeled samples in a preliminary experiment comparing dye-
labeling of proteins in lysates using FITC-alkyne and DBCO-fluorescein. The FITC-
alkyne might have been out dated and inactive and its use was therefore discontinued.
Figure 3.10 A shows that GalNAz-tagged proteins were detected with a loading of 10
compared to 2 g total protein using DBCO-fluorescein dye. The protein bands were
however faint, as a result dye-labeling was repeated. To improve the signal obtained
using DBCO-fluorescein labeling and to demonstrate that azido-GlcNAc proteins could
be coupled to a strained-alkyne probe via SPAAC in cell lysates, a newly prepared dye,
DBCO-naphthalimide (by Dr. Honglin Li) was used. Two conditions were tested with
DBCO-naphthalimide: 1) incubation at room temperature for 2 h on end-over-end rotator,
and 2) incubation at 10 ºC for 10 h on a shaker. Incubation at room temperature resulted
in unspecific binding since the signal of the test samples was the same as that of control
samples. The 2 h room temperature and the 10 h 10 ºC conditions have been previously
employed in Cu catalyzed dye-labeling of GlcNAz-tagged NIH3T3 cell lysates using
Tamra-alkyne dye, and that of azidohomoalanine-tagged Jurkat cells with Alkynyl Alexa-
647 dye, respectively, without any unspecific protein background34, 36. Although
unspecific protein background was the challenge in this study, a difference in the signal
between test sample and control was observed with the 10 h 10ºC incubation, indicating

147
that the azido-GlcNAc proteins that had been coupled via SPAAC to alkyne dye probe in
cell lysate were detected. Perhaps the poor signals observed in this work justify why none
of these three alkyne-functionalized fluorescent dyes (DBCO-fluorescin, FITC-alkyne
and DBCO-naphthalimide) are listed among the dyes known for robust labeling of azido-
GlcNAc proteins in cell lysates.
3.4.5 Bead Washing
In bead-based enrichment of proteins, thorough washing of beads is crucial for removal
of nonspecific protein background. Inability to remove these bead-adsorbed proteins can
result in contamination of the bead-bound fraction and false positives. Owing to lack of
washing instructions for the -Aminohexyl agarose beads, we attempted to formulate
washing buffers and develop washing protocol based on the known wash buffers and
protocols. Several bead-based affinity enrichment strategies have their own optimized
washing protocols that differ from study to study. The only common thing among them is
the repeated use of detergent- and salt-containing buffers. Detergents and salts in the
wash buffers are good agents for solubilization of proteins and can thus cause desorption
of non-covalently adsorbed proteins. A washing protocol or condition was evaluated by
comparing SDS-PAGE protein profiles of the original SPAAC feed, first washes, final
washes, DTT eluent and denatured beads. We considered a washing protocol ideal and
efficient if proteins are observed in the first washes, and none in the final washes, DTT
eluents as well as denatured beads. Since nonspecific binding proteins on affinity resins
cannot be avoided, presence of protein bands from denatured beads was expected.
However, reduction in protein bands in this fraction was preferable.
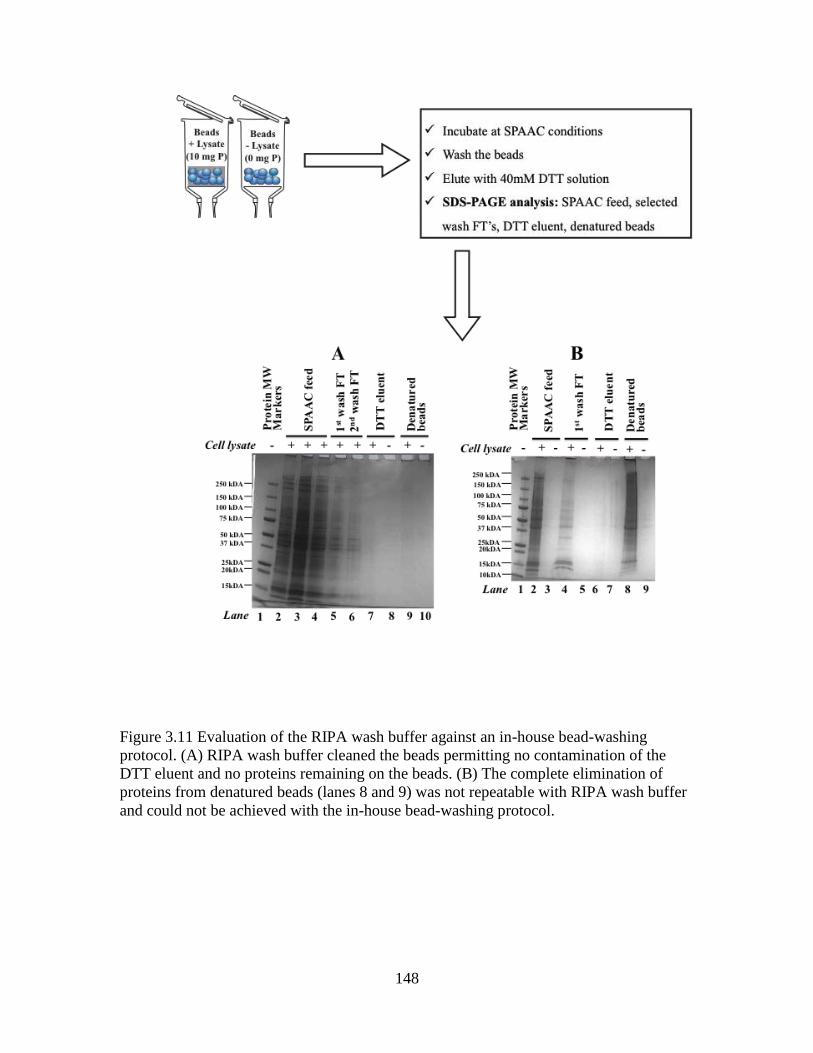
148
Figure 3.11 Evaluation of the RIPA wash buffer against an in-house bead-washing
protocol. (A) RIPA wash buffer cleaned the beads permitting no contamination of the
DTT eluent and no proteins remaining on the beads. (B) The complete elimination of
proteins from denatured beads (lanes 8 and 9) was not repeatable with RIPA wash buffer
and could not be achieved with the in-house bead-washing protocol.

149
Through recommended series of trail-and-error experiments testing and
combining different bead washing strategies, the washing protocol illustrated on fig.
3.12B was formulated. Some of the wash buffers and protocols tested prior to
formulation included RIPA wash buffer21, Click-iT bead-washing protocol that uses
SDS and 8M Urea/100 mM Tris, pH 8 wash buffers (Click-iT Enrichment Kit,
Invitrogen) and TBST that is commonly used to remove non-specific binding proteins in
immunoassays. TBST and Click-iT wash buffers did not work at all while RIPA wash
buffer did clean up the beads resulting in undetectableproteins in the DTT eluent and
denatured beads (Fig. 3.11A). The absence of non-specifically bound proteins remaining
on beads was however not repeatable (Fig. 3.11B). Taken together, we developed a wash
buffers comprising components from known wash buffers. Our in-house bead-washing
procedure (Figure 3.13B) resulted in no contamination in the DTT eluent and some
detectable proteins in the denatured bead fraction.
We evaluated the in-house procedure against the EAH Sepharose 4B manufacturer’s
bead-washing procedure (Protocols – Figure. 3.13B). We compared the efficiency of
removing cell lysate proteins and BSA from the beads after a typical SPAAC protein
coupling reaction. The resin employed in the evaluation as well as in the previous trial-
and-error bead-washing tests consisted of unmodified beads. On Figure 3.12, it was
observed that both bead-washing protocols resulted in no detectable proteins in the DTT
eluent, but that some proteins remained on the denatured beads. In analyses where
proteins were not quantifiable by Coomassie blue absorbance method, an aliquot was
mixed 1:1 with SDS loading buffer and loaded on the gel. On lane 8 of each gel, we
observed that thick BSA bands remained on the beads after applying our in-house bead-

150
Figure 3.12 Evaluation and comparison of effectiveness of the two bead-washing
protocols. The effectiveness is based on removal of cell lysate proteins and BSA from
beads that have been incubated with protein sample under SPAAC conditions. “+L”
means cell lysate added to beads; “-L” means no lysate added (negative control). DTT
eluents and denatured beads fractions are used to show removal of proteins from beads.
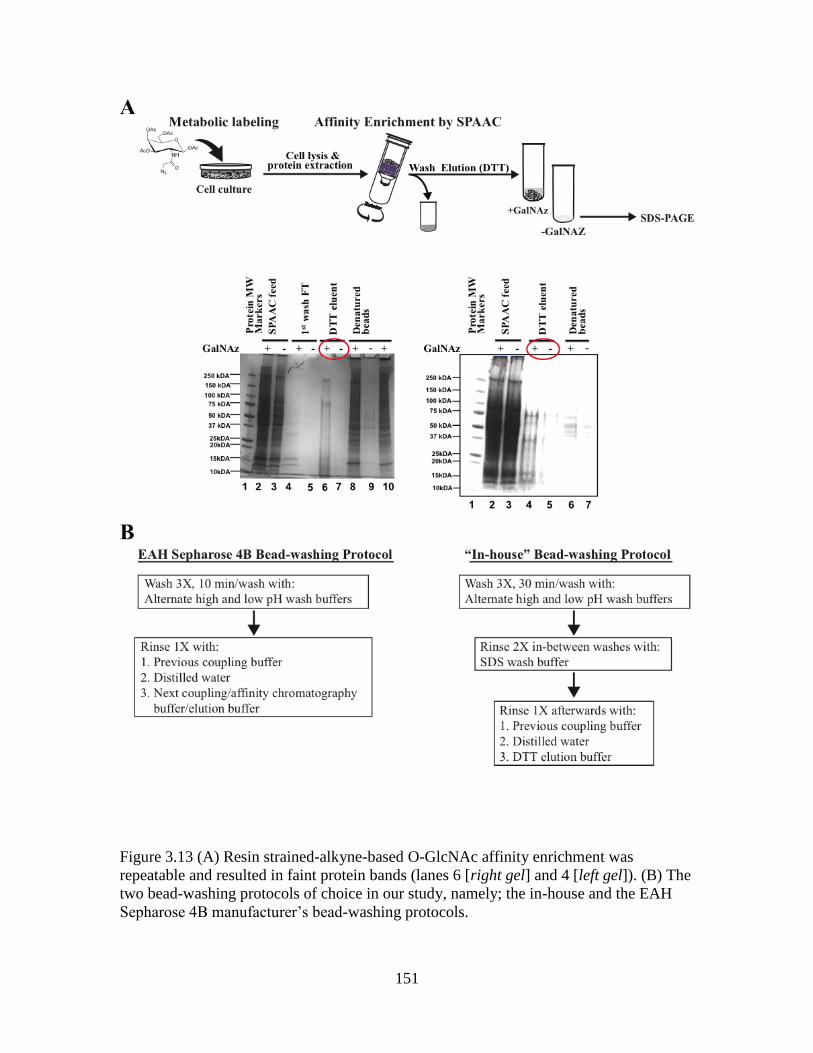
151
Figure 3.13 (A) Resin strained-alkyne-based O-GlcNAc affinity enrichment was
repeatable and resulted in faint protein bands (lanes 6 [right gel] and 4 [left gel]). (B) The
two bead-washing protocols of choice in our study, namely; the in-house and the EAH
Sepharose 4B manufacturer’s bead-washing protocols.

152
washing protocol compared with the manufacturer’s protocol. This observation and the
fact that the washing steps of the manufacturer’s protocol are very short motivated us to
select the manufacturer’s protocol for subsequent enrichment experiments.
3.4.6 Affinity Enrichment of Cellular O-GlcNAc Proteins and Label-free LC-MS/MS
Quantification and Identification
Following optimization of the bead washing, selectivity of the O-GlcNAc enrichment
strategy was assessed by resolving the enriched fraction using 1D SDS-PAGE. Figure
3.13A shows protein bands of the azido-labeled samples and not the control from DTT
eluents. The selectivity was further assessed by comparing the label-free LC-MS/MS
quantified intensities of the proteins from the azido-labeled (O-GlcNAz-modified) and
the control (O-GlcNAc-modified) samples, both TGF-β1-induced and non-induced. The
summed intensities, the enrichment factors and their logarithmic values were utilized for
comparisons. The summed intensities were initially corrected for by removing proteins
identified to be contaminants and had no mouse gene name associated with them. All of
the keratin proteins seem to be listed among the proteomics contaminants in the
UniProtKB database. However, only those with no mouse gene name associated with
them were discarded, and the others were retained since some cytokeratins are epithelial
markers and are relevant to cancer and EMT biology. Intensities of the discarded proteins
were reminiscent of biochemical noise and obscured observation of the actual differences
between the azido-labeled and control samples, as seen on Figure 3.14. In both the TGF-
β1-induced and non-induced sample the summed intensity of the azido-labeled was about
3-fold higher than that of the control. However, the median enrichment factors were
different, 3.2 in TGF-β1-induced and 1 in non-induced samples. Although the data

153
Figure 3.14 Summed intensities of identified proteins from raw and “contaminants-
filtered” data generated from five samples with modified or unmodified beads, with or
without metabolic labeling in NMuMG cells induced or non-induced with TGF-β1.
154
suggests that enrichment was not consistent between the TGF-β1-induced and non-
induced samples, it is inconclusive to rate the efficiency of enrichment since the
experiment was not repeated. Using the commercial resin-alkyne, Hahne et al. reported
efficient enrichment showing 60-fold higher summed intensity in azido-labeled than the
control and a median enrichment factor of 260. Although their enrichment efficiency is
higher, the degree of modification of their resin is unknown. Hence, the click chemistry-
based affinity enrichment reported in Hahne et al. and this study cannot be compared.
The distribution of protein intensities as a function of log2 [EF] is complex but has
the same sigmoidal pattern across all samples with many proteins having minimum
intensities covering a stretch of log2 [EF] values from -5 to 5, and beyond that the
intensities increase exponentially. For the non-induced sample majority of the proteins
(~120) had log2 [EF] around zero showing that they were not enriched. For the induced
sample the number of proteins with log2 [EF] around zero is still high but the number of
proteins log2 [EF] >0 forms a normal distribution that seems to peak around log2 [EF] =
3. Given that all the experimental conditions were the same, the data suggests that there
might have been fewer O-GlcNAc-modified proteins in non-induced than in the induced
sample. However, the global O-GlcNAcylation between TGF-β1-induced and non-
induced NMuMG was not determined. All the proteins with log2 [EF] around zero and
below were discarded from further analysis since they represented non-specifically bound
proteins. Out of about 200 proteins identified, 125 were regarded as the bead-enriched O-
GlcNAc proteome.
In a study on global profiling of O-GlcNAc proteome from HEK293 cells using
the commercial resin-alkyne, Hahne et al. identified about 1500 proteins (Ref). In this

155
Figure 3.15 Global identification of potentially O-GlcNAc proteins in TGF-β1-induced
EMT. (Upper panel) Pairs of tubes showing the samples used for determining the
biochemical enrichment factors of the identified proteins are displayed. Red panel:
Modified/Unmodified beads, +GalNAz, +TGF-β1; Blue panel: Modified/Unmodified
beads, +GalNAz, -TGF-β1; Green panel: Modified beads, +/-GalNAz, -TGF-β1. (Middle
panel) Scatter plots of intensity and log2 biochemical enrichment factors of identified
potentially O-GlcNAc proteins. (Lower panel) Distribution of the biochemical
enrichment factors. More proteins were enriched in the TGF-β1-induced compared to
non-induced samples.

156
study, only about 200 proteins out of the entire O-GlcNAc proteome of NMuMG cells
were identified. Unlike the commercial resin-alkyne, strained-alkyne resin employed in
affinity enrichment of the O-GlcNAc proteome in this study was applied for the first
timein proteomics. Although some parts of the enrichment procedure such as the
conjugation of the affinity tag to the agarose-cleavable linker, as well as the bead
washing were rigorously tested and optimized, the mass spectrometric component was
not optimized. The proteomics results therefore represent only a once-off measurement
that could have been preliminary and needed to be replicated for sufficient evaluation of
the selectivity of the enrichment strategy. Typical proteomic studies using high-resolution
orbitrap instruments generate massive data comprised of several thousands of proteins.
Such studies often involve extensive pre-fractionation of the cells and tissue samples. In
this study, only one subcellular fraction comprising nucleocytoplasmic proteins was
analyzed. The number of proteins would have been increased if the nuclear and
cytoplasmic fractions were analyzed separately. Also further fractionation to extract the
mitochondrial fractions should have been considered since the OGT resides in the
nucleus, cytoplasm and mitochondria where it carries out the O-GlcNAcylation of target
proteins.
3.4.7 Gene Ontology Analyses
3.4.7.1 Subcellular Localization
Of all the protein ID’s mapped by the IPA, 90% are nucleocytoplasmic proteins while
10% are plasma membrane and extracellular proteins. Although extensive pre-
fractionation of the samples was not carried out prior to affinity enrichment, the results of

157
A
B
Nucleus, 18.3%
Cytoplasm, 59.9%
Extracellular space, 1.4%
Plasma membrane, 5.6%
In silico, 14.8%
Figure 3.16 (A) Subcellular localization of the identified proteins. (B) Left panel: Scatter
plot of intensity and log2-fold change of TGF-β-induced protein expression; Right panel:
The distribution of log2 ratio (+/-TGF-β1) of the identified proteins. More proteins were
upregulated than downregulated during TGF-β1-induced EMT in NMuMG cells.

158
the GO term analysis are in agreement with the fact that the O-GlcNAc is a PTM of
nucleocytoplasmic proteins. However, some few plasma membrane and extracellular
proteins bearing O- and N-glycans were also enriched. This is not surprising because the
bioorthogonal reporter used this study, namely AC4GalNAz, is likely to be incorporated
in glycans where GalNac occurs thereby resulting in proteins with complex glycans being
enriched in mixture with the O-GlcNAc modified proteins. Nevertheless, efforts to
minimize azido-labeling of O- and N-glycans were undertaken as suggested and done in
other studies. Such efforts were successfully implemented since our data consists mostly
of nucleocytoplasmic proteins.
3.4.7.2.Canonical Pathways
The results of the GO analyses show that the highly represented and/or enriched
biological functions and diseases and well as pathways and networks in our data support
breast cancer and cancer metastasis. Figure 3.17 (Left panel) is a bar chart showing
canonical metabolic pathways that are significantly enriched in the experimental data.
Out of the 16 metabolic pathways that were significantly enriched, the first two,
Glycolysis I and Gluconeogenesis I, corresponding to glucose metabolism, are enriched
3-4 fold higher than the others. This corroborates proteomic findings in other studies and
supports the fact about elevation of glucose metabolism in cancer cells. Majority of the
metabolic pathways had 30% representative proteins (ratio=0.3) in the experimental data.
Figure 3.17 (Right panel) is a bar chart showing canonical signaling pathways that are
significantly enriched in the experimental data. A total of 68 signaling pathways were
significantly enriched in our data set. Of the first 6 highly enriched pathways, 3 have
been implicated in proteomic studies pertaining to TGF-β1-induced EMT. These are

159
8
Ratio0.0 0.1 0.2 0.3
0 1 2 3 4 5 6 7
-log(p-value)
Unfolded Protein Response
Remodeling of Epithelial Adherens
Junctions
Actin Cytoskeleton Signaling
Protein Ubiquitination Pathway
ILK Signaling
Aldosterone Signaling in Epithelial
Cells
Regulation of Cellular Mechanics
by Calpain Protease
eNOS Signaling
VEGF Signaling
NFR2-mediated Oxidative Stress
Response
Paxillin Signaling
Epithelial Adherens Junction
Signaling
Integrin Signaling
14-3-3-mediated Signaling
Lipid Antigen Presentation by CD1
Hypoxia Signaling in the
Cardiovascular System
Leukocyte Extravasation Signaling
FAK Signaling
PI3K/AKT Signaling
Regulation of Actin-based Motility
by Rho
Threshold
0 2 4 6 8
0.0 0.2 0.4
Glycolysis I
Gluconeogenesis I
Glutathione-mediated
Detoxification
Pyruvate Fermentation to Lactate
Arsenate Detoxification I
(Glutaredoxin)
Diphthamide Biosynthesis
NADH Repair
Methylglyoxal Degradation I
Ascorbate Recycling (Cytosolic)
Geranylgeranyldiphosphate
Biosynthesis
Trans, trans-farnesyl Diphosphate
Biosynthesis
Rapoport-Luebering Glycolytic
Shunt
Tetrapyrrole Biosynthesis II
Aspartate Degradation II
Theoredoxin Pathway
Pentose Phosphate Pathway (Non-
oxidative Branch)
Threshold
-log(p-value)
Ratio
Negative z-score Positive z-scorez-score = 0
PATHWAY ACTIVITY LEGEND
Ratio
No activity pattern available
Figure 3.17 Cellular metabolic (left panel) and signaling (right panel) pathways
responding to TGF-β1 induction in NMuMG cells. The y-axis represents the pathways
identified. The x-axis (upper) represents significance of each pathway based upon the p-
values determined using Right-tailed Fisher’s exact test with threshold less that 0.05 (p <
0.05). The ratio of the number of proteins in a given pathway satisfying the cutoff to the
total number of proteins present in that pathway was determined. In addition, each
pathway’s activity pattern represented by a Z-score showing decrease on increase in the
overall activity as contributed by individual proteins in the pathway has been displayed as
colored bars. Only a few signaling pathways had their activity patterns available.

160
Remodeling of Epithelial Adherens Junctions, Actin Cytoskeleton signaling and Protein
Ubiquitination pathway. Different to metabolic pathways, majority of the signaling
pathways have only about 5%representation in the experimental data, but similar to
metabolic pathways, many signaling pathways show no pattern of prediction direction.
3.4.7.3 Biological Functions and Networks
The biological functions that were most significant to the enriched networks were
determined and using the Fisher’s exact test, the probability that each biological function
assigned to a network was due to chance alone was calculated. Table 3.2 shows that the
top interacting networks of TGF-β1-responsive gene products were significantly enriched
for molecular and cellular functions of cancer metastasis, cell cycle, cellular movement
and carbohydrate metabolism, among others. Examination of the visualized network
reveals the observed functions. The upstream regulators in this network are genes for β-
Catenin, Cyclin D1, Caveolin 1, and Receptor tyrosine-protein kinase erbB-2 (also
known as human epidermal growth factor receptor 2). These regulators either singly or
associatively modulate activity of several genes relevant to EMT and cancer metastasis in
response to TGF-β1.
β-Catenin interacts with E-cadherin in the adherens junctions and both are down-
regulated during TGF-β1 treatment. In the experimental data such interactions resulted in
upregulation of ACTB, BTF3, CD44 and PSAP among the O-GlcNAc-modified proteins.
Simultaneousy the scaffolding protein Caveolin 1 indirectly modulates several keratins,
HSPA8 and Cyclin D1. All, but Cyclin D1 were upregulated in the experiment. The only
upstream regulator of E-cadherin in this network is Protein Kinase AMP-Activated,

161
MMP9 MMP9PSAPPSAP
CD44 CD44EZR EZR
ERBB2 ERBB2
NU
CL
EU
SC
YT
OP
LA
SM
PL
AS
MA
ME
MB
RA
NE
EX
TR
AC
EL
UL
AR
SP
AC
E
CDH1 CDH1
EGFR EGFRMST1R MST1R
PIK3CA PIK3CA
CAV1 CAV1
CDC37CDC37
KRT8KRT8
KRT19 KRT19
KRT18 KRT18
HSPA8 HSPA8VIM VIM
TGF-β1
PR
KA
A2
PR
KA
A2
ACTBACTB
YBX1
YBX1
PGRPGR
CCND1CCND1
CTNNB1 CTNNB1
BTF3 BTF3
SNAI1
OGT
A B
Cytokine
Peptidase
Receptor
Other
Enzyme
Transcription factor
Nuclear receptor
Transmembrane receptor
NODE SHAPES NODE EDGES
SOLID EDGE - Direct interaction
DASHED EDGE - Indirect interaction
Binding only
Acts on
Protein-protein binding
NODE COLORS (EXPRESSION LEVEL)
Downregulated Upregulated-7 9
Pink color: Relationships of additional
molecules of interest with
the network
Figure 3.18 (A) Ingenuity Pathway Analysis was used to extract and display nodes
overlaid with expression levels for proteins belonging to the top regulatory network
enriched in the experimental data. This network is involved in metastasis. The
upregulated proteins are displayed in red while the down-regulated proteins are in green.
The colorless nodes represent proteins extracted in silico. The scale bar shows the range
of fold changes. (B) Additional proteins SNAIL, TGF-β1 and OGT were included and
their relationships with the proteins in the network are displayed.

162
alpha 2 (PRKAA2), a molecule that also indirectly upregulated Vimentin and down-
regulated YBX1. Three extra genes, SNAI1, OGT and TGF-β1 were added to the
network occurring in breast cancer cell lines to see if they might interact with the existing
genes. These three regulators barely interact with any of the genes expressed in the
dataset. However, SNAI1 regulates several genes in the network including E-cadherin
gene. The down-regulated YBX1 acts upstream of SNAI1 and TGF-β1. The regulatory
activity of TGF-β1 in this network is limited to modulation of ECM protein MMP9 while
that of OGT includes interaction with Cyclin D1 and modulation of β-Catenin. The
network does not show any crosstalk between regulatory activities of OGT and TGF-β1.
However, there may be co-regulation on MMP9 originating from SNAI1 and TGF-β1.
3.4.8 Relevance of the Proteomics Data to EMT
In the post-genomic era proteome-wide genome-scale studies report gene expression
maps for understanding mechanisms underlying biological functions and disease
processes, the same way large-scale transcriptional analyses do. However, there are only
a few proteomic studies of EMT compared to genomic and transcriptomic studies. In
such proteomic analyses, tumor tissues undergoing EMT have been probed using tandem
mass spectrometry techniques to identify differentially expressed and hence EMT-
regulated proteins. In silico analyses of the protein-protein networks of these signatures
have enabled establishment of the roles of proteins involved in EMT and metastasis, thus
shedding new insights to the understanding of EMT. Biarc and co-workers have provided
comprehensive EMT signatures obtained from proteomic profiling of MCF-10A cells
following induction of EMT by two different signals, mutant K-Rasv12 and TGF-8. Gene
Ontology classification of these signatures pointed to enhancement of cellular processes

163
and functions that support cancer progression. Among the functional classes of proteins
differentially expressed were EMT inducers, ECM proteins, adhesion proteins,
cytoskeletal proteins, degradation machinery, translation machinery and glucose
metabolic machinery. The revelation of increase in glucose metabolism during EMT
raises a question about the influence of such metabolic changes to O-GlcNAcylation of
nucleocytoplasmic proteins, a possible alternate route for upregulation of EMT regulators
such as transcription factors through changing their localization and stability due to the
O-GlcNAc PTM. To this end no large-scale O-GlcNAc proteomic studies have been
reported on TGF-β1-induced EMT.
In this study we hypothesized that focusing functional proteomics to O-GlcNAc
signatures would provide insights into the crosstalk between TGF-β1-induced EMT and
O-GlcNAcylation, since both processes cause repression of E-cadherin leading to
invasion and metastasis. The O-GlcNAc signatures reported herein are only putative
since their O-GlcNAc modification sites were not mapped. The label-free quantification
was not replicated hence the level of confidence of differential expression as a result of
TGF-β1 induction could not be statistically determined. Moreover, the identification and
the O-GlcNAc PTM of the proteins were not validated by western blotting as well as
ETD-MS/MS for O-GlcNAc site-mapping. As a result, the novel analytical method is not
sufficiently comprehensive. However, despite these shortcomings, the proteomic results
obtained using the strained-alkyne terminated bead probe underscore several published
EMT and O-GlcNAc reports (Figure 3.19). As described in detail below, our potential O-
GlcNAc signature consists of functional classes of proteins shown in previous studies to
support EMT and metastatic phenotypes. Figure 3.19A shows that 75% of the identified

164
4
40
3
892
Putative in O-GlcNAc Enrichment Samples
Anti-O-GlcNAc Isolated
O-GlcNAc Site Mapped
1
1815%
A
B
Figure 3.19 (A) 75% of the potentially O-GlcNAc proteins in a TGF-induced EMT have
been previously identified in other related signatures2, 8, 44-45. EMT_1 (EMT signatures);
EMT_2 (EMT-associated signature). (B) Out of 121, 100 proteins have been previously
identified in putative O-GlcNAc enrichment samples23, 36, 46-47. Some of these proteins
have O-GlcNAc sites mapped while others have been isolated by anti-O-GlcNAc
immunoprecipitation21, 23, 46. 18 proteins do not appear in any of the O-GlcNAc literature.
165
proteome appears in EMT and metastatic signatures presented in other studies. However,
unlike previous studies that demonstrated a set of proteomic EMT signature, our study
shows only a subset that is potentially O-GlcNAcylated.
EMT is regulated at different levels of gene expression: transcriptionally and
epigenetically, post-transcriptionally by non-coding RNAs and alternative splicing,
translationally as well as post-translationally48. Our data contains some evidence of EMT
regulation. The heterogenous nuclear ribonucleoproteins HNRNPA2B1, HNRNPC and
HNRNPK were upregulated. This family of proteins is RNA-binding and is involved in
the regulation of EMT-specific differential splicing48. An mRNA-binding protein,
transcription factor, YB1 was downregulated. This protein controls translation of EMT-
associated transcription factors SNAIL and ZEB family members48. Its overexpression in
breast cancer is known to induce EMT. Its downregulation in our data suggests that
translation of EMT-associated transcription factors might have been controlled by other
factors. However, the in silico analysis shows that YB1 is upstream of SNAIL1
suggesting that at the time when the cells were harvested, i.e. towards completion of
EMT in NMuMG cells, YB1 was no longer in control and was downregulated.
Successful EMT relies on the ability of the EMT-associated transcription factors
to trigger cellular reprogramming49. Transcriptional regulation of EMT centers around
the activities of the nuclear factors SNAIL, ZEB and TWIST families, which interact
with several proteins in highly regulated networks to accomplish EMT50. None of these
nuclear factors were observed in our data. Epigenetically, the activity of the EMT-
associated transcription factors is known to be enhanced by their close interaction with
chromatin modifiers such histone deacetylases48. Although no epigenetic modifiers were

166
upregulated in our data, several histones, including histone H3 were upregulated
suggesting that they could be products of deacetylation associated with regulation of
EMT. One chromatin modifier HMGB1 was downregulated probably because by the end
of EMT it was no longer expressed and hence was downregulated.
Despite being tightly regulated, the EMT program involves many cellular changes
that include loss of E-cadherin-mediated intercellular adhesion, loss of apical-basal
polarity and concomitant acquisition of migratory behavior, as well as reorganization of
the actin cytoskeleton51. Similar to other proteomic studies2, 8, our data support EMT-
associated changes. Among the canonical pathways, remodeling of epithelial adherens
junctions and actin cytoskeleton signaling were over-represented. Some cytoskeletal
proteins of the intermediate filaments, keratins (KRT8/18/19) and vimentin were
upregulated. Keratins 8/18 pair, and vimentin are well characterized EMT markers52 that
are also O-GlcNAc proteins23, 46. Vimentin, in particular, is often ubiquitously isolated
from EMT and metastasis samples of many cancers2, 45. Actin microfilament associated
proteins, profilin-1, cofilin-1 and vinculin were upregulated. Microtubule-associated
proteins, annexin A8 and microtubule-associated protein R/B 1 were also upregulated
EMT is associated with elevated levels of translation8. In eukaryotic cells,
translation machinery occurs as translasome, the supercomplex structures within eIF3
interactome53. These structures contain proteins involved in translation initiation,
translation elongation, ribosome biogenesis, quality control and transport, all linked
together to facilitate efficient protein synthesis. In this study, representative proteins
indicative of these processes were identified. Although no translation initiation factors
were obtained, the translation elongation factors EEF1D and EEF2 were upregulated.
167
EEF2 has previously been associated with breast cancer metastasis45. For ribosome
biogenesis, ADP-ribosylation factor 5, a GTP-binding protein that is involved in protein
trafficking was upregulated. Ribosomal protein SA required for assembly and stability of
40S ribosomal subunit was upregulated. For quality control and transport, Importin-β, a
nuclear transporter was upregulated. Several components of the degradation machinery
were observed in our data and the proteasomal ubiquitination canonical pathway was
significantly overrepresented. Different Chaperonin-containing TCP1 subunits (CCT7
experimentally and CCT3/4/5/6/8 in silico), as well as heat shock proteins 90 kDA
(HSP90 AA1/AB1/B1), 70 kDA (HSPA 4//5/8/9) and 60 kDA (HSPD1) were
upregulated. HSP90B1 has been previously associated with breast cancer metastasis54.
Together with other heat shock proteins, calreticulin, an ER resident protein and calcium-
binding chaperone, was highly upregulated. The unfolded protein response, a canonical
pathway for cellular adaptation to ER stress was highly overrepresented in our data. The
cellular defense response to oxidative stress was also overrepresented since members of
the NRF2-mediated oxidative stress response pathway such as the Glutathione S-
transferase proteins were upregulated. Only 1of the 5 proteasomal subunits was
upregulated. Our data suggests that TGF-β induction might be inhibitory to expression of
the proteasomal proteins.
Due to a plethora of molecular changes, cells undergoing EMT have higher
energy requirements, especially for protein synthesis and general anabolism8. Both
glycolysis and gluconeogenesis I were among significantly enriched canonical pathways.
32% of Glycolytic enzymes were observed while 3% of the gluconeogenetic enzymes
were obtained. All these proteins were upregulated by TGF-β induction. Interestingly the
168
Glycolysis pathway enzymes observed among the O-GlcNAc proteome include the series
of enzymes from triose phosphate isomerase down to pyruvate kinase. Glycolysis
provides both energy and metabolic intermediates while Gluconeogenesis recycles non-
sugar intermediary carbon sources back to glucose for feeding into glycolysis55. Malate
dehydrogenase was upregulated in our data and it is known for producing NADPH for
fatty-acid synthesis8. The fatty-acid binding protein 5 was upregulated too.
Still on carbohydrate metabolism, CD44 a hydrolytic enzyme for hyaluronic acid
(HA) and a membrane receptor for HA and ECM proteins was upregulated. CD44
appears here as part of the metastatic regulatory network that was overrepresented in the
experimental data. CD44 is a glycoprotein with N-linked and O-linked complex glycans.
However, since the O-GlcNAc PTMs of proteins in the data have not been validated by
site-mapping, it is difficult to tell whether CD44 falsely appears in the O-GlcNAc
proteome or that CD44 has an unknown O-GlcNAc site. However, presence of CD44 in
the data is in line with a study showing that cells that have undergone EMT have stem-
like properties and TGF-β1 induction is known to promote stemness56-57. CD44 is a
marker for stemness and the expression pattern of CD44high/CD24low is characteristic of
cells with stem-like properties.
3.4.8 Does the O-GlcNAc EMT Signature Reflect any Role of the O-GlcNAc PTM?
O-GlcNAcylation has previously been found to promote breast cancer progression9. OGT
silencing and OGA pharmacological inhibition studies have shown that O-GlcNAcylation
alters migration and metastasis via downregulation of E-cadherin. Moreover O-
GlcNAcylation of β-Catenin and p120, the binding partners of E-cadherin, was thought to
169
play a role in cell surface localization as well as binding to E-cadherin in adherens
junctions. Those studies, however, did not provide sufficient information on the
molecular mechanisms behind the changes in migration and metastasis. In the current
study, the in silico analysis of the potentially O-GlcNAc proteome of the TGF-β1-
induced EMT implicates enrichment of EMT and metastasis-associated regulatory
network, the core of which features two transcription factors that are regulated by OGT,
namely; β-Catenin and Cyclin D1. This network strengthens our hypothesis that there
may be cooperation between TGF-β signaling and O-GlcNAcylation in promoting cancer
growth, EMT, migration and metastasis. Perhaps the hyperglycaemic conditions
associated with SNAIL O-GlcNAcylation in Park et al.10 would enhance such
cooperation by elevating the levels of UDP-GlcNAc. In order to test the hypothesis,
further studies are necessary to validate identification of some key proteins as well as
their O-GlcNAc PTM, and to ensure that they are differentially expressed in the context
of TGF-β1-induced EMT.
3.5 CONCLUSIONS
By coupling DBCO-SS-NHS ester to NH2-terminated beaded resin, a cleavable azide-
reactive dibenzocyclooctyne-disulphide resin was developed for the affinity enrichment
of O-GlcNAc modified proteins. UV-Vis measurements proved that the new affinity resin
had the similar loading capacity as the original resin, and MALDI-TOF measurements
showed that the resin is azide-reactive. Successful metabolic labeling of NIH3T3 and
NMuMG cells was detected by fluorescence microscopy and SDS-PAGE in combination
with in-gel fluorescence scanning. FITC-alkyne, DBCO-fluorescein, DBCO-
naphthalimide and 3-azido-7-hydroxycoumarin were used as fluorescent probes. Despite
170
of the strong signals in fluorescence microscopy, the in-gel fluorescence signals were
fairly weak and seemed to be impeded by abundant nonspecific binding proteins.
Successful affinity enrichment of GalNAz-labeled proteins from protein extracts
provided confidence to apply the affinity enrichment strategy to NMuMG cells
undergoing EMT.
Examination of the O-GlcNAc proteome of TGF-β1-induced EMT revealed some
insights that underscore findings in other cancer proteomics and O-GlcNAc studies.
Representative functional proteins were detected, and among them were enzymes of the
glycolysis pathway as well as EMT and metastasis markers such as vimentin. Gene
ontology analyses showed that majority of the proteins are nucleocytoplasmic and that,
the highly overrepresented pathways included glycolysis and many TGF-β non-canonical
pathways. NMuMG cells undergoing EMT resemble tumor progression stage in which
carcinoma in situ cells acquire mesenchymal characteristics and migrate to invade the
surrounding stroma. Upregulation of glycolysis is a characteristic of cancer, which due to
“Warburg effect” leads to upregulation of hexose biosynthetic pathway and increase in
UDP-GlcNAc, with the result that many nucleocytoplasmic proteins are aberrantly O-
GlcNAcylated11, 20, 58. The stability and nuclear localization of some transcription EMT
inducers such as Snail1 is regulated in this way10. Snail and other transcription factors
were not obtained in this study. However, in silico protein-protein interactions revealed a
metastatic regulatory network featuring genes that are regulated by Snail1 such as E-
cadherin and MMP-9. Previous Cell biology studies in which GlcNAcylation correlated
positively with metastasis and negatively with E-cadherin expression implicated
influence of GlcNAcylation on interactions of proteins E-cadherin, β-Catenin and p120

171
(Catenin delta-1), where E-cadherin level decreased probably due to GlcNAcylation of β-
Catenin and p1209. These studies did not investigate any cancer-associated signaling
processes. Neither did they identify GlcNAc site on adhesion proteins nor its role in
modulating E-cadherin. The β-Catenin regulated network generated in silico in this study
leads us to hypothesize that TGF-β signaling would cooperate with GlcNAcylation
during cancer progression to promote metastasis initiated via EMT. Future studies should
aim at validating protein identification and mapping the O-GlcNAc sites on identified
proteins to establish the role of site-specific GlcNAcylation.
Future research can also be conducted to improve the SPAAC “click chemistry”-based
affinity enrichment strategy. Selectivity and specificity of the bead probe could be better
ascertained by doing investigations with synthetic GalNAz-labeled proteins, instead of
unlabeled proteins. In addition, extensive but focused sample pre-fractionation for
enrichment of nuclear fraction would be ideal for identification of O-GlcNAc-modified
transcription factors.

172
REFERENCES
1. E. Foubert, B. De Craene, G. Berx, Key signalling nodes in mammary gland
development and cancer. The Snail1-Twist1 conspiracy in malignant breast cancer
progression. Breast Cancer Res., 2010, 12.
2. D. Vergara, P. Simeone, P. del Boccio, C. Toto, D. Pieragostino, A. Tinelli, et al.,
Comparative proteome profiling of breast tumor cell lines by gel electrophoresis and
mass spectrometry reveals an epithelial mesenchymal transition associated protein
signature. Mol. Biosyst., 2013, 9, 1127-1138.
3. J. P. Thiery, J. P. Sleeman, Complex networks orchestrate epithelial-
mesenchymal transitions. Nat. Rev. Mol. Cell Biol., 2006, 7, 131-142.
4. G. J. Inman, F. J. Nicolas, J. F. Callahan, J. D. Harling, L. M. Gaster, A. D. Reith,
et al., SB-431542 is a potent and specific inhibitor of transforming growth factor-beta
superfamily type I activin receptor-like kinase (ALK) receptors ALK4, ALK5, and
ALK7. Mol. Pharmacol., 2002, 62, 65-74.
5. S. Cha, M. B. Imielinski, T. Rejtar, E. A. Richardson, D. Thakur, D. C. Sgroi, et
al., In situ proteomic analysis of human breast cancer epithelial cells using laser capture
microdissection: annotation by protein set enrichment analysis and gene ontology. Mol.
Cell. Proteomics, 2010, 9, 2529-2544.
6. C. M. Perou, T. Sorlie, M. B. Eisen, M. van de Rijn, S. S. Jeffrey, C. A. Rees, et
al., Molecular portraits of human breast tumours. Nature, 2000, 406, 747-752.
7. J. D. Wulfkuhle, K. C. McLean, C. P. Paweletz, D. C. Sgroi, B. J. Trock, P. S.
Steeg, et al., New approaches to proteomic analysis of breast cancer. Proteomics, 2001,
1, 1205-1215.
8. J. Biarc, P. Gonzalo, I. Mikaelian, L. Fattet, M. Deygas, G. Gillet, et al.,
Combination of a discovery LC-MS/MS analysis and a label-free quantification for the
characterization of an epithelial-mesenchymal transition signature. J. Proteomics, 2014,
110, 183-194.
9. Y. Gu, W. Mi, Y. Ge, H. Liu, Q. Fan, C. Han, et al., GlcNAcylation plays an
essential role in breast cancer metastasis. Cancer Res., 2010, 70, 6344-6351.

173
10. S. Y. Park, H. S. Kim, N. H. Kim, S. Ji, S. Y. Cha, J. G. Kang, et al., Snail1 is
stabilized by O-GlcNAc modification in hyperglycaemic condition. EMBO J., 2010, 29,
3787-3796.
11. C. Slawson, R. J. Copeland, G. W. Hart, O-GlcNAc signaling: a metabolic link
between diabetes and cancer? Trends Biochem. Sci., 2010, 35, 547-555.
12. T. Issad, M. Kuo, O-GlcNAc modification of transcription factors, glucose
sensing and glucotoxicity. Trends Endocrinol. Metab., 2008, 19, 380-389.
13. S. Ozcan, S. S. Andrali, J. E. Cantrell, Modulation of transcription factor function
by O-GlcNAc modification. Biochim. Biophys. Acta, 2010, 1799, 353-364.
14. K. Kamemura, B. K. Hayes, F. I. Comer, G. W. Hart, Dynamic interplay between
O-glycosylation and O-phosphorylation of nucleocytoplasmic proteins: alternative
glycosylation/phosphorylation of THR-58, a known mutational hot spot of c-Myc in
lymphomas, is regulated by mitogens. J. Biol. Chem., 2002, 277, 19229-19235.
15. A. Moustakas, C. H. Heldin, Induction of epithelial-mesenchymal transition by
transforming growth factor beta. Semin. Cancer Biol., 2012, 22, 446-454.
16. J. Xue, X. Lin, W. T. Chiu, Y. H. Chen, G. Yu, M. Liu, et al., Sustained
activation of SMAD3/SMAD4 by FOXM1 promotes TGF-beta-dependent cancer
metastasis. J. Clin. Invest., 2014, 124, 564-579.
17. S. Thuault, E. J. Tan, H. Peinado, A. Cano, C. H. Heldin, A. Moustakas, HMGA2
and Smads co-regulate SNAIL1 expression during induction of epithelial-to-
mesenchymal transition. J. Biol. Chem., 2008, 283, 33437-33446.
18. T. Vincent, E. P. Neve, J. R. Johnson, A. Kukalev, F. Rojo, J. Albanell, et al., A
SNAIL1-SMAD3/4 transcriptional repressor complex promotes TGF-beta mediated
epithelial-mesenchymal transition. Nat. Cell Biol., 2009, 11, 943-950.
19. S. Olivier-Van Stichelen, V. Dehennaut, A. Buzy, J. L. Zachayus, C. Guinez, A.
M. Mir, et al., O-GlcNAcylation stabilizes beta-catenin through direct competition with
phosphorylation at threonine 41. FASEB J., 2014, 28, 3325-3338.

174
20. S. A. Caldwell, S. R. Jackson, K. S. Shahriari, T. P. Lynch, G. Sethi, S. Walker, et
al., Nutrient sensor O-GlcNAc transferase regulates breast cancer tumorigenesis through
targeting of the oncogenic transcription factor FoxM1. Oncogene, 2010, 29, 2831-2842.
21. L. Wells, K. Vosseller, R. N. Cole, J. M. Cronshaw, M. J. Matunis, G. W. Hart,
Mapping sites of O-GlcNAc modification using affinity tags for serine and threonine
post-translational modifications. Mol. Cell. Proteomics, 2002, 1, 791-804.
22. K. Vosseller, J. C. Trinidad, R. J. Chalkley, C. G. Specht, A. Thalhammer, A. J.
Lynn, et al., O-linked N-acetylglucosamine proteomics of postsynaptic density
preparations using lectin weak affinity chromatography and mass spectrometry. Mol.
Cell. Proteomics, 2006, 5, 923-934.
23. J. C. Trinidad, D. T. Barkan, B. F. Gulledge, A. Thalhammer, A. Sali, R.
Schoepfer, et al., Global identification and characterization of both O-GlcNAcylation and
phosphorylation at the murine synapse. Mol. Cell. Proteomics, 2012, 11, 215-229.
24. N. Khidekel, S. B. Ficarro, E. C. Peters, L. C. Hsieh-Wilson, Exploring the O-
GlcNAc proteome: direct identification of O-GlcNAc-modified proteins from the brain.
Proc. Natl. Acad. Sci. U. S. A., 2004, 101, 13132-13137.
25. N. Khidekel, S. B. Ficarro, P. M. Clark, M. C. Bryan, D. L. Swaney, J. E. Rexach,
et al., Probing the dynamics of O-GlcNAc glycosylation in the brain using quantitative
proteomics. Nat. Chem. Biol., 2007, 3, 339-348.
26. M. A. Nessen, G. Kramer, J. Back, J. M. Baskin, L. E. J. Smeenk, L. J. de
Koning, et al., Selective Enrichment of Azide-Containing Peptides from Complex
Mixtures. J. Proteome Res., 2009, 8, 3702-3711.
27. H. Hahne, N. Sobotzki, T. Nyberg, D. Helm, V. S. Borodkin, D. M. van Aalten, et
al., Proteome wide purification and identification of O-GlcNAc-modified proteins using
click chemistry and mass spectrometry. J. Proteome Res., 2013, 12, 927-936.
28. A. J. Howden, V. Geoghegan, K. Katsch, G. Efstathiou, B. Bhushan, O.
Boutureira, et al., QuaNCAT: quantitating proteome dynamics in primary cells. Nat.
Methods, 2013, 10, 343-346.
29. R. P. Temming, M. van Scherpenzeel, E. te Brinke, S. Schoffelen, J. Gloerich, D.
J. Lefeber, et al., Protein enrichment by capture-release based on strain-promoted
175
cycloaddition of azide with bicyclononyne (BCN). Bioorg. Med. Chem., 2012, 20, 655-
661.
30. G. A. Grant, S. L. Frison, J. Yeung, T. Vasanthan, P. Sporns, Comparison of
MALDI-TOF mass spectrometric to enzyme colorimetric quantification of glucose from
enzyme-hydrolyzed starch. J. Agric. Food Chem., 2003, 51, 6137-6144.
31. X. Duan, H. Li, H. Chen, Q. Wang, Discrimination of colon cancer stem cells
using noncanonical amino acid. Chem. Commun. (Camb.), 2012, 48, 9035-9037.
32. X. Duan, L. Cai, L. A. Lee, H. Chen, Q. Wang, Incorporation of azide sugar
analogue decreases tumorigenic potential of breast cancer cells by reducing cancer stem
cell population. Science China Chemistry, 2013, 56, 279-285.
33. K. E. Beatty, J. Szychowski, J. D. Fisk, D. A. Tirrell, A BODIPY-Cyclooctyne for
Protein Imaging in Live Cells. ChemBioChem, 2011, 12, 2137-2139.
34. K. Liu, P. Y. Yang, Z. Na, S. Q. Yao, Dynamic monitoring of newly synthesized
proteomes: up-regulation of myristoylated protein kinase A during butyric acid induced
apoptosis. Angew. Chem. Int. Ed. Engl., 2011, 50, 6776-6781.
35. S. Lamouille, E. Connolly, J. W. Smyth, R. J. Akhurst, R. Derynck, TGF-beta-
induced activation of mTOR complex 2 drives epithelial-mesenchymal transition and cell
invasion. J. Cell Sci., 2012, 125, 1259-1273.
36. B. W. Zaro, Y. Y. Yang, H. C. Hang, M. R. Pratt, Chemical reporters for
fluorescent detection and identification of O-GlcNAc-modified proteins reveal
glycosylation of the ubiquitin ligase NEDD4-1. Proc. Natl. Acad. Sci. U. S. A., 2011,
108, 8146-8151.
37. M. Boyce, I. S. Carrico, A. S. Ganguli, S. H. Yu, M. J. Hangauer, S. C. Hubbard,
et al., Metabolic cross-talk allows labeling of O-linked beta-N-acetylglucosamine-
modified proteins via the N-acetylgalactosamine salvage pathway. Proc. Natl. Acad. Sci.
U. S. A., 2011, 108, 3141-3146.
38. B. W. Zaro, L. A. Bateman, M. R. Pratt, Robust in-gel fluorescence detection of
mucin-type O-linked glycosylation. Bioorg. Med. Chem. Lett., 2011, 21, 5062-5066.

176
39. Q. Wang, T. R. Chan, R. Hilgraf, V. V. Fokin, K. B. Sharpless, M. G. Finn,
Bioconjugation by copper(I)-catalyzed azide-alkyne [3 + 2] cycloaddition. J. Am. Chem.
Soc., 2003, 125, 3192-3193.
40. K. Sivakumar, F. Xie, B. M. Cash, S. Long, H. N. Barnhill, Q. Wang, A
fluorogenic 1,3-dipolar cycloaddition reaction of 3-azidocoumarins and acetylenes.
Organic letters, 2004, 6, 4603-4606.
41. C. Le Droumaguet, C. Wang, Q. Wang, Fluorogenic click reaction. Chem. Soc.
Rev., 2010, 39, 1233-1239.
42. H. C. Hang, C. Yu, D. L. Kato, C. R. Bertozzi, A metabolic labeling approach
toward proteomic analysis of mucin-type O-linked glycosylation. Proc. Natl. Acad. Sci.
U. S. A., 2003, 100, 14846-14851.
43. S. Saha, X. Duan, L. Wu, P. K. Lo, H. Chen, Q. Wang, Electrospun fibrous
scaffolds promote breast cancer cell alignment and epithelial-mesenchymal transition.
Langmuir, 2012, 28, 2028-2034.
44. S. Ramaswamy, K. N. Ross, E. S. Lander, T. R. Golub, A molecular signature of
metastasis in primary solid tumors. Nat. Genet., 2003, 33, 49-54.
45. M. Sato, T. Matsubara, J. Adachi, Y. Hashimoto, K. Fukamizu, M. Kishida, et al.,
Differential Proteome Analysis Identifies TGF-beta-Related Pro-Metastatic Proteins in a
4T1 Murine Breast Cancer Model. PLoS One, 2015, 10, e0126483.
46. Z. Wang, N. D. Udeshi, C. Slawson, P. D. Compton, K. Sakabe, W. D. Cheung, et
al., Extensive crosstalk between O-GlcNAcylation and phosphorylation regulates
cytokinesis. Science signaling, 2010, 3, ra2.
47. Z. Gurel, B. W. Zaro, M. R. Pratt, N. Sheibani, Identification of O-GlcNAc
modification targets in mouse retinal pericytes: implication of p53 in pathogenesis of
diabetic retinopathy. PLoS One, 2014, 9, e95561.
48. B. De Craene, G. Berx, Regulatory networks defining EMT during cancer
initiation and progression. Nat. Rev. Cancer, 2013, 13, 97-110.

177
49. C. H. Heldin, M. Landstrom, A. Moustakas, Mechanism of TGF-beta signaling to
growth arrest, apoptosis, and epithelial-mesenchymal transition. Curr. Opin. Cell Biol.,
2009, 21, 166-176.
50. H. Peinado, D. Olmeda, A. Cano, Snail, Zeb and bHLH factors in tumour
progression: an alliance against the epithelial phenotype? Nat. Rev. Cancer, 2007, 7, 415-
428.
51. S. B. Jakowlew, Transforming growth factor-beta in cancer and metastasis.
Cancer Metastasis Rev., 2006, 25, 435-457.
52. K. Lee, C. M. Nelson, New insights into the regulation of epithelial-mesenchymal
transition and tissue fibrosis. Int. Rev. Cell Mol. Biol., 2012, 294, 171-221.
53. Z. Sha, L. M. Brill, R. Cabrera, O. Kleifeld, J. S. Scheliga, M. H. Glickman, et al.,
The eIF3 interactome reveals the translasome, a supercomplex linking protein synthesis
and degradation machineries. Mol. Cell, 2009, 36, 141-152.
54. H. H. Milioli, K. Santos Sousa, R. Kaviski, N. C. Dos Santos Oliveira, C. De
Andrade Urban, R. S. De Lima, et al., Comparative proteomics of primary breast
carcinomas and lymph node metastases outlining markers of tumor invasion. Cancer
Genomics Proteomics, 2015, 12, 89-101.
55. J. M. Berg, J. L. Tymoczko, L. Stryer, Biochemistry, 5th Edition. W. H. Freeman:
New York, 2002.
56. B. T. Hennessy, A. M. Gonzalez-Angulo, K. Stemke-Hale, M. Z. Gilcrease, S.
Krishnamurthy, J. S. Lee, et al., Characterization of a naturally occurring breast cancer
subset enriched in epithelial-to-mesenchymal transition and stem cell characteristics.
Cancer Res., 2009, 69, 4116-4124.
57. S. A. Mani, W. Guo, M. J. Liao, E. N. Eaton, A. Ayyanan, A. Y. Zhou, et al., The
epithelial-mesenchymal transition generates cells with properties of stem cells. Cell,
2008, 133, 704-715.
58. C. Slawson, G. W. Hart, O-GlcNAc signalling: implications for cancer cell
biology. Nat. Rev. Cancer, 2011, 11, 678-684.

178
APPENDIX A
PROTEIN IDENTIFICATION AND LABEL-FREE QUANTIFICATION DATA

179
Table A.1 SPAAC enriched O-GlcNAc putative IPA-identified proteins
Protein IDs Gene names Log2(Int-Ind.) Log2(Int-Non-ind) Fold Change
P68134 Acta1 21.51 14.87 81.17
P60710 Actg1 25.00 22.60 5.28
A1BN54 Actn1 22.85 14.87 205.88
P57780 Actn4 20.61 14.87 43.54
P45376 Akr1b1 18.63 14.87 10.99
P10518 Alad 14.87 17.75 -7.32
P84084 Arf5 14.87 17.39 -5.71
Q99PT1 Arhgdia 21.71 14.87 93.24
Q64152-2 Btf3 19.22 14.87 16.61
P14211 Calr 22.48 14.87 159.34
B1ARS0 Cap1 18.52 14.87 10.20
D3YW48 Capns1 14.87 14.87 -1.23
P80314 Cct2 14.87 15.40 -1.44
P80313 Cct7 18.39 14.87 9.32
Q3U8S1 Cd44 21.22 14.87 66.47
P60766 Cdc42 19.24 14.87 16.79
P18760 Cfl1 22.49 21.96 1.45
Q80WV3 Chst2 18.71 14.87 11.64
D3Z036 Cops3 15.16 14.87 -1.01
F6QD74 Cyfip1 14.87 20.13 -38.34
D3Z7N2 Eef1d 18.93 14.87 13.61
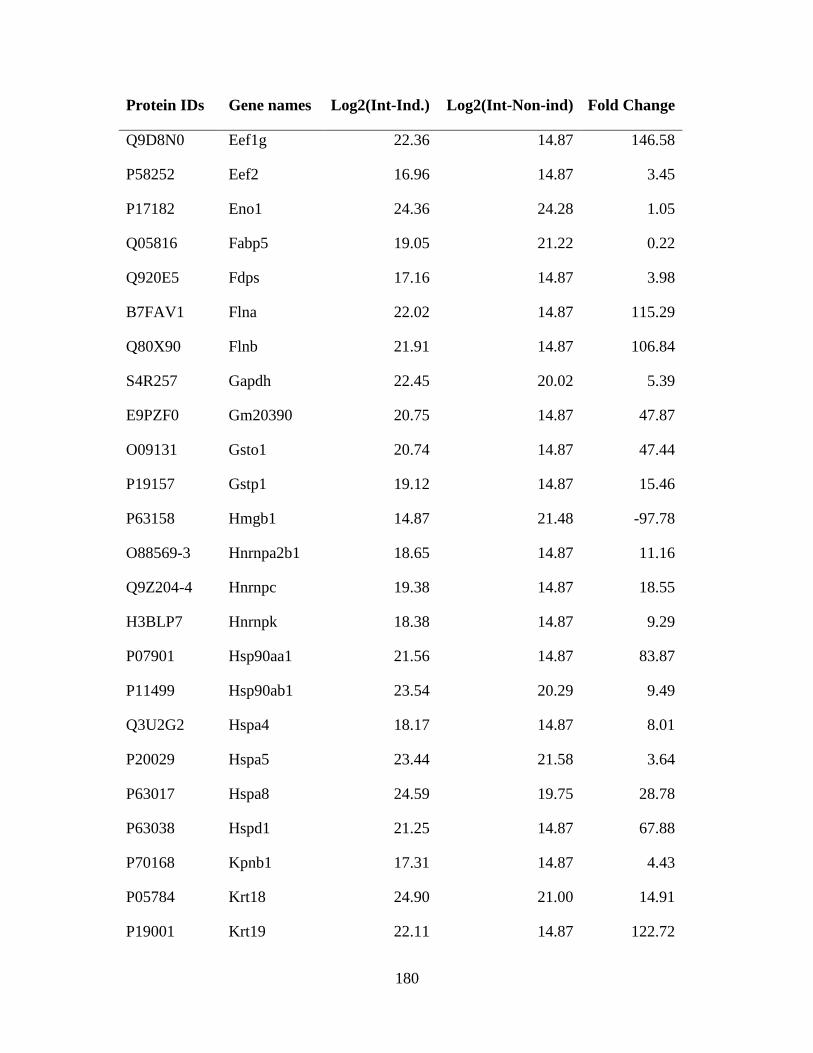
180
Protein IDs Gene names Log2(Int-Ind.) Log2(Int-Non-ind) Fold Change
Q9D8N0 Eef1g 22.36 14.87 146.58
P58252 Eef2 16.96 14.87 3.45
P17182 Eno1 24.36 24.28 1.05
Q05816 Fabp5 19.05 21.22 0.22
Q920E5 Fdps 17.16 14.87 3.98
B7FAV1 Flna 22.02 14.87 115.29
Q80X90 Flnb 21.91 14.87 106.84
S4R257 Gapdh 22.45 20.02 5.39
E9PZF0 Gm20390 20.75 14.87 47.87
O09131 Gsto1 20.74 14.87 47.44
P19157 Gstp1 19.12 14.87 15.46
P63158 Hmgb1 14.87 21.48 -97.78
O88569-3 Hnrnpa2b1 18.65 14.87 11.16
Q9Z204-4 Hnrnpc 19.38 14.87 18.55
H3BLP7 Hnrnpk 18.38 14.87 9.29
P07901 Hsp90aa1 21.56 14.87 83.87
P11499 Hsp90ab1 23.54 20.29 9.49
Q3U2G2 Hspa4 18.17 14.87 8.01
P20029 Hspa5 23.44 21.58 3.64
P63017 Hspa8 24.59 19.75 28.78
P63038 Hspd1 21.25 14.87 67.88
P70168 Kpnb1 17.31 14.87 4.43
P05784 Krt18 24.90 21.00 14.91
P19001 Krt19 22.11 14.87 122.72
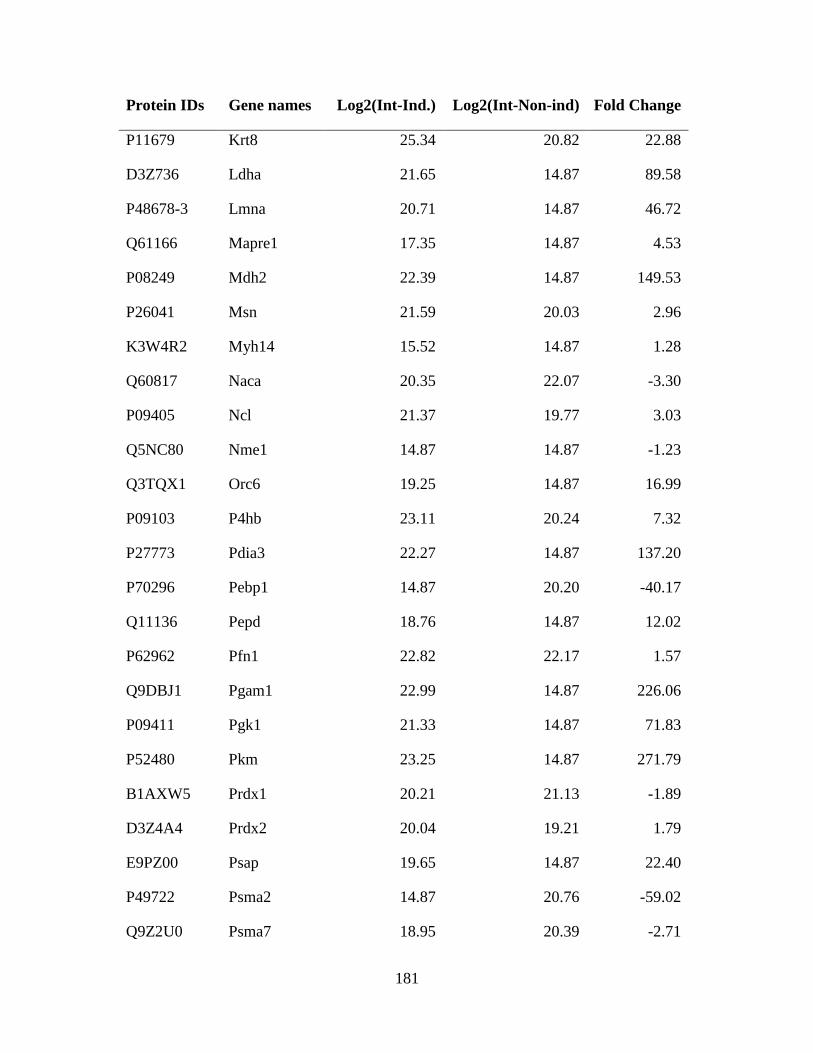
181
Protein IDs Gene names Log2(Int-Ind.) Log2(Int-Non-ind) Fold Change
P11679 Krt8 25.34 20.82 22.88
D3Z736 Ldha 21.65 14.87 89.58
P48678-3 Lmna 20.71 14.87 46.72
Q61166 Mapre1 17.35 14.87 4.53
P08249 Mdh2 22.39 14.87 149.53
P26041 Msn 21.59 20.03 2.96
K3W4R2 Myh14 15.52 14.87 1.28
Q60817 Naca 20.35 22.07 -3.30
P09405 Ncl 21.37 19.77 3.03
Q5NC80 Nme1 14.87 14.87 -1.23
Q3TQX1 Orc6 19.25 14.87 16.99
P09103 P4hb 23.11 20.24 7.32
P27773 Pdia3 22.27 14.87 137.20
P70296 Pebp1 14.87 20.20 -40.17
Q11136 Pepd 18.76 14.87 12.02
P62962 Pfn1 22.82 22.17 1.57
Q9DBJ1 Pgam1 22.99 14.87 226.06
P09411 Pgk1 21.33 14.87 71.83
P52480 Pkm 23.25 14.87 271.79
B1AXW5 Prdx1 20.21 21.13 -1.89
D3Z4A4 Prdx2 20.04 19.21 1.79
E9PZ00 Psap 19.65 14.87 22.40
P49722 Psma2 14.87 20.76 -59.02
Q9Z2U0 Psma7 18.95 20.39 -2.71

182
Protein IDs Gene names Log2(Int-Ind.) Log2(Int-Non-ind) Fold Change
Q9R1P1 Psmb3 19.51 20.60 -2.13
P99026 Psmb4 19.86 21.27 -2.67
P26516 Psmd7 18.55 14.87 10.46
Q5SW87 Rab1A 17.47 14.87 4.93
P54728 Rad23b 14.87 20.15 -38.90
P14206 Rpsa 20.54 14.87 41.38
P07091 S100a4 14.87 19.31 -21.66
Q62266 Sprr1a 14.87 14.87 -1.23
Q93092 Taldo1 14.87 17.43 -5.89
P26039 Tln1 17.51 14.87 5.07
H7BXC3 Tpi1 20.59 14.87 42.91
E9Q450 Tpm1 20.56 14.87 42.05
D3Z2H9 Tpm3 23.54 20.90 6.28
Q6IRU2 Tpm4 23.18 20.82 5.13
P10639 Txn 14.87 21.86 -127.12
Q64727 Vcl 21.06 14.87 59.35
Q01853 Vcp 19.01 14.87 14.38
P20152 Vim 24.56 20.20 20.53
A2BGG7 Ybx1 14.87 18.84 -15.69
P62259 Ywhae 23.30 14.87 281.49
P61982 Ywhag 18.31 14.87 8.81
F6YY69 Ywhaq 19.80 14.87 24.82
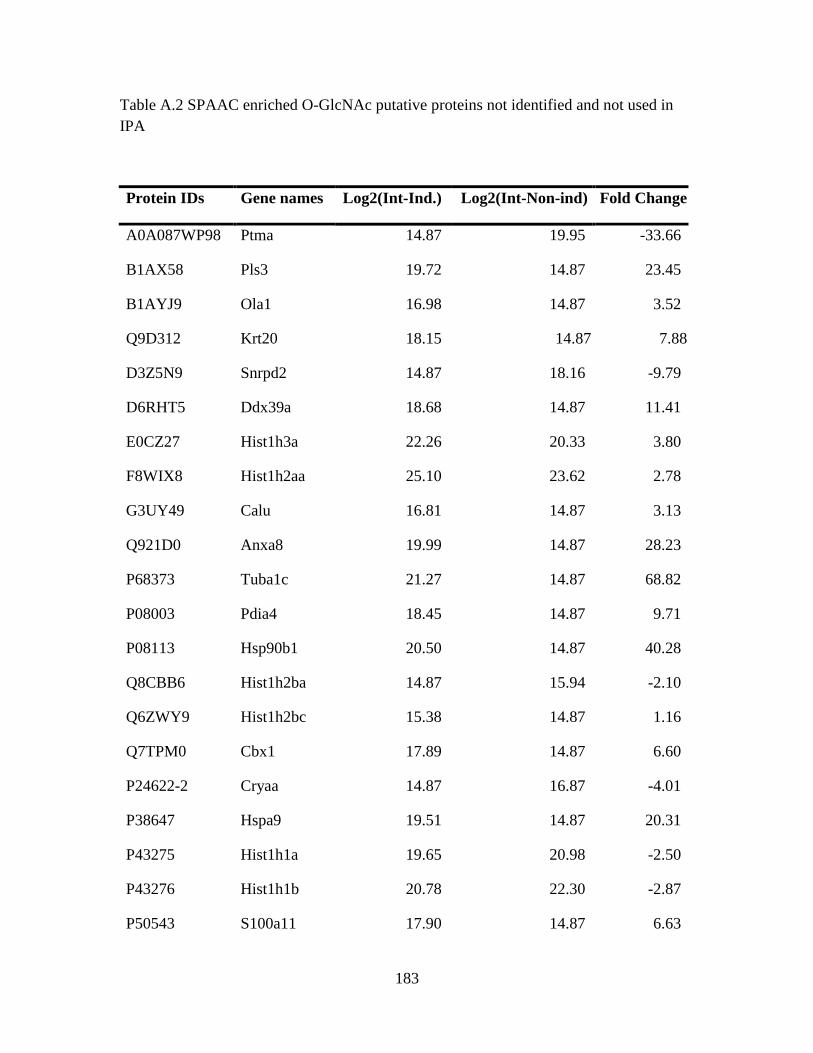
183
Table A.2 SPAAC enriched O-GlcNAc putative proteins not identified and not used in
IPA
Protein IDs Gene names Log2(Int-Ind.) Log2(Int-Non-ind) Fold Change
A0A087WP98 Ptma 14.87 19.95 -33.66
B1AX58 Pls3 19.72 14.87 23.45
B1AYJ9 Ola1 16.98 14.87 3.52
Q9D312 Krt20 18.15 14.87 7.88
D3Z5N9 Snrpd2 14.87 18.16 -9.79
D6RHT5 Ddx39a 18.68 14.87 11.41
E0CZ27 Hist1h3a 22.26 20.33 3.80
F8WIX8 Hist1h2aa 25.10 23.62 2.78
G3UY49 Calu 16.81 14.87 3.13
Q921D0 Anxa8 19.99 14.87 28.23
P68373 Tuba1c 21.27 14.87 68.82
P08003 Pdia4 18.45 14.87 9.71
P08113 Hsp90b1 20.50 14.87 40.28
Q8CBB6 Hist1h2ba 14.87 15.94 -2.10
Q6ZWY9 Hist1h2bc 15.38 14.87 1.16
Q7TPM0 Cbx1 17.89 14.87 6.60
P24622-2 Cryaa 14.87 16.87 -4.01
P38647 Hspa9 19.51 14.87 20.31
P43275 Hist1h1a 19.65 20.98 -2.50
P43276 Hist1h1b 20.78 22.30 -2.87
P50543 S100a11 17.90 14.87 6.63

184
Protein IDs Gene names Log2(Int-Ind.) Log2(Int-Non-ind) Fold Change
P60335 Pcbp1 14.87 14.87 -1.23
P62204 Calm1 21.00 21.69 0.62
P62806 Hist1h4a 24.06 14.87 476.30
Q14AA6 Ran 18.50 14.87 10.07
P63028 Tpt1 19.09 14.87 15.18
P99024 Tubb5 20.58 14.87 42.59
Q3TML0 Pdia6 14.87 16.96 -4.26
Q3U1J4 Ddb1 14.87 14.87 -1.23
Q8C9B9 Dido1 14.87 14.87 -1.23
Q9CPU0 Glo1 18.70 20.27 -2.99
Q9CQI6 Cotl1 18.37 19.76 -2.62
Q9D305 Thap2 20.40 14.87 37.62
Q9JMG7 Hdgfrp3 17.11 14.87 3.84

185
Table A.3 Biological functions overrepresented in high confidence in O-GlcNAc proteins
Categories Biofunctions p-value Molecules
Cancer, organismal
injury and
abnormalities
Metastasis 7.09E-03 PRDX2, PSAP,
S100A4, TLN1
Carbohydrate
metabolism, drug
metabolism, small
molecule biochemistry
Catabolism of hyaluronic
acid
9.30E-03 CD44
Carbohydrate
metabolism, drug
metabolism, small
molecule biochemistry
Internalization of
hyaluronic acid
9.30E-03 CD44
Embryonic
development, tissue
development
Branching
morphogenesis of
mammary organoid
1.85E-02 HSP90AB1
Cellular development,
cellular growth and
proliferation
Proliferation of
melanoma cell lines
1.85E-02 PRDX2
Cancer, organismal
injury and
abnormalities
Metastatic potential of
breast cancer cell lines
2.76E-02 PSAP