Embed Size (px)
Citation preview

Protein Mass Spectrometry(Proteomics)
Liwen ZhangMass Spectrometry and Proteomics Facility
The Ohio State University
Summer Workshop

Proteomics:Proteome=Protein + Genomethe large-scale study of proteins, particularly their structures and functions.
Why are proteins important:•The major elements of most cellular structures•Perform most cellular functions•Targets of drugs/toxicants

What Can Proteomics Do
Protein(s) identification
PTM Identification
Protein CrosslinkIdentification
Drug Binding SiteIdentification
Pathway AnalysisProtein Profile Analysis
Protein Interaction Analysis

Traditional Methods for Proteome Research
SDS-PAGEseparates based on molecular weight and/or isoelectric point10 fmol - > 10 pmol sensitivityTracks protein expression patterns
Protein SequencingEdman degradation or internal sequence analysis
Immunological MethodsWestern Blots
SDS-PAGE alone can track the appearance, disappearance or molecular weight shifts of proteins, but can not ID the protein or measure the molecular weight with any accuracy
Edman degradation requires a large amount of protein and does not work on N-terminal blocked proteins
Western blotting is presumptive, requires the availability of suitable antibodies and have limited confidence in the ID related to the specificity of the antibody.

Proteome Research by Mass Spectrometry
Measure M.W. of the protein/peptideSequence amino acid sequence of protein/peptides
High throughputSensitivityAccuracySpecificity
(M+2H)+2
M A S S Sp P E C K
(M+2H)+2
M A S S Sp P E C K

Protein Chemistry
MassSpectrometry
Computing (+ Bioinformatics)
Proteomics by Mass Spectrometry
Protein ID(s)
PTM(s)
Quantitation

Protein Chemistry
•Sample purification
Protein
fractions digest
peptides
•Sample isolation/clean-up

MassSpectrometry
All types of hardware used in proteomics
ESI
MALDI
FT ICR
Ion Trap LTQOrbitrapamaZon
TOF UltraFlexmaXis
Quandrupole Triple-Quad

Computing (+ Bioinformatics)

Molecular weight measurement of the protein/peptideProtein Identification/Confirmation
Protein Identification/PTM Investigation�Global Digestion/LC-MSMS/Bioinformatics�Fractionation/Digestion/LC-MSMS/Bioinformatics
Quantitative Proteomics�Gel-Based Technique
–- DIGE
�Non Gel-Based Techniques–-Isotopic Labeling Techniques:
ITraq/SILAC/18O, 15N. 2H Labeling–-Lable Free Quantitation:
Spectra Counting/Peak Area/EmPAI
MALDI Imaging
What Can Mass Spectrometry Do for Proteomics

Measure proteinPositives:fast experiment, observe changes in protein massNegatives:not good for protein id due to resolution & PTMs, requires clean sample
Measure peptidesPositives:fast experiment, identify proteins & PTMsNegatives:not good for mixtures of proteins, confidence in identification not ideal
Measure fragmentsPositives:identify protein & PTMs, high result confidence.Negatives:longer instrument time, longer database search
TOP DOWN Peptide Fingerprinting Middle DownBottom Up
MS/MS
ENZYME
MS/MS
800 900 1000 1100 1200 1300 1400 1500 1600 1700 1800 1900 2000m/z0
100
%
A15A16
A17
A18
A19
A20A21
A14A13
A12
A11
A10
10000 11000 12000 13000 14000 15000 16000 17000 18000 19000 20000mass74
100
%
A
m/z deconvolutesto16952
(M+H)+
(M+2H)+2
15000100005000 m/z
16950
MALDI of Myoglobin
Electrospray of Myoglobin
GLSDGEWQQVLNVWGKVEADIAGHGQEVLIRLFTGHPETLEKFDKFKHLKTEAEMKASEDLKKHGTVVLTALGGILKKGHHEAELKPLAQSHATKHKIPIKYLEFISDAIIHVLHSKHPGDFGADAQGAMTKALELFRNDIAAKYKELGFQG
Sequence of Myoglobin
MW = 16951
Molecular Weight Measurement of the Protein

Protein Identification by Top Down MS/MS
m/z750730710690670650630610590570550
c17+84
c26+70
c26+112
c12+42
c22+112
c12+42
c13+42
c25+112
c23+112
c40+70
c40+112
C24+70
c24+112
c7+42
c15+42
c37+70c55+112
c37+140
c37+112
c38+112
c26+70
c26+112
c52+70
c52+112
c54+70
c54+112
c18+84
z35+14
z35+56
z12
c59+70c59+112
z20
C60+112
m/z750730710690670650630610590570550
c17+84
c26+70
c26+112
c12+42
c22+112
c12+42
c13+42
c25+112
c23+112
c40+70
c40+112
C24+70
c24+112
c7+42
c15+42
c37+70c55+112
c37+140
c37+112
c38+112
c26+70
c26+112
c52+70
c52+112
c54+70
c54+112
c18+84
z35+14
z35+56
z12
c59+70c59+112
z20
C60+112
1000900800700600 780770760750
m/z
+1Ac + 2Me
+1 Ac+ 4Ac
+ 5Ac
+ 2Ac + 2Me
Parents ions (750 - 770, 15+) 758.0864 15+
754.7814 15+
+ 4Ac
- 15+
15+
1000900800700600 780770760750
m/z
+1Ac + 2Me
+1 Ac+ 4Ac
+ 5Ac
+ 2Ac + 2Me
Parents ions (750 - 770, 15+) 758.0864 15+
754.7814 15+
+ 4Ac
- 15+
15+
ECD MS/MS
m/z1000990980970960950940930920910900
z32
z48
z64
z49+14
z9
z65
z49z66 z25+16
z50
z34
z67
z76
z42
z42+14
z59
z51
z68
z43
z78z61 z79
z62
z27z75
m/z1000990980970960950940930920910900
z32
z48
z64
z49+14
z9
z65
z49z66 z25+16
z50
z34
z67
z76
z42
z42+14
z59
z51
z68
z43
z78z61 z79
z62
z27z75
Histone H4

N-AGRGK5GGK8GLGK12GGAK16RHRK20VLRDNIQGIT H4
Ac Ac Ac Ac AcMe Me
Ac Ac Ac
Known Modification
Modification Detected
Protein Identification by Top Down MS/MS

Middle Down
Why Middle Down:simplifies the complex mixtures offered by bottom up strategieswhile avoiding the diminished performance of top down experiments
GluC Cleavage
GluC Cleavage GluC Cleavage
GluC Cleavage
GluC Cleavage GluC Cleavage GluC Cleavage
GluC Cleavage

m/z Sequence 924.5149 43ISLSFTTR50
1050.5439 31APTVHGGAGGAR42
1078.6255 83LASYLEKVR91
1090.5375 374LLEGESEGTR383
1095.5905 284QGDIHELKR292
1108.6374 104ILKWHQQR111
1244.5477 51SCPPPGGSWGSGR63
1360.7141 235EDLIKVLEDMR245
1390.6995 92ALEEANMKLESR103
1494.8097 410LVLCQVNEIQKHA422
1584.9220 246QEYELIIKKKHR257
1972.9869 64SSPLLGGNGKATMQNLNDR82
2277.1279 181TLDNLTIVTTDLEQEVEGMR200
2673.2124 1MNSGHSFSQTPSASFHGAGGGWGRPR26
2790.4785 350QNNEYQVLLGIKTHLEKEITTYR372
2833.5088 384EESKSSMKVSATPKIKAITQETINGR409
2856.3543 322YSCKLQDMQEIISHYEEELTQLR344
2870.3261 258DLDTWYKEQSAAMSQEAASPATVQSR283 3332.6315 293TFQALEIDLQTQYSTKSALENMLSETQSR321 3368.6467 152MAVDDFNLKYENEHSFKKDLEIEVEGLR179
Bottom Up

Data Analysis for Peptide Mass Mapping
• Important data– multiple peaks– mass accuracy– confirming information
(pI, approx. mass, organism, etc.)
?MS
MS Peptide MWFound in Selected
DatabasesNDALYFPT...SWDLTAL...
PTDLDVSY...
protein peptides identify
rank

Cut protein into manageable pieces for the mass spectrometer to analyze.
mass position peptide sequence
927.486 161-167 YLYEIAR
1050.485 588-597 EACFAVEGPK
1282.703 361-371 HPEYAVSVLLR
1305.708 402-412 HLVDEPQNLIK
1439.504 360-371 RHPEYAVSVLLR
1478.788 421-433 LGEYGFQNALIVR
1567.735 347-359 DAFLGSFLYEYSR
1639.931 437-451 KVPQVSTPTLVEVSR
1667.893 469-482 MPCTEDYLSLILNR
1823.892 508-523 RPCFSALTPDETYVPK
2045.021 168-183 RHPYFYAPELLYYANK
2506.243 469-489 MOXPCTEDYLSLILNRLCVLHEK
1 MKWVTFISLL LLFSSAYSRG VFRRDTHKSE IAHRFKDLGE EHFKGLVLIA FSQYLQQCPF DEHVKLVNEL71 TEFAKTCVAD ESHAGCEKSL HTLFGDELCK VASLRETYGD MADCCEKQEP ERNECFLSHK DDSPDLPKLK141 PDPNTLCDEF KADEKKFWGK YLYEIARRHP YFYAPELLYY ANKYNGVFQE CCQAEDKGAC LLPKIETMRE211 KVLTSSARQR LRCASIQKFG ERALKAWSVA RLSQKFPKAE FVEVTKLVTD LTKVHKECCH GDLLECADDR281 ADLAKYICDN QDTISSKLKE CCDKPLLEKS HCIAEVEKDA IPENLPPLTA DFAEDKDVCK NYQEAKDAFL351 GSFLYEYSRR HPEYAVSVLL RLAKEYEATL EECCAKDDPH ACYSTVFDKL KHLVDEPQNL IKQNCDQFEK421 LGEYGFQNAL IVRYTRKVPQ VSTPTLVEVS RSLGKVGTRC CTKPESERMP CTEDYLSLIL NRLCVLHEKT491 PVSEKVTKCC TESLVNRRPC FSALTPDETY VPKAFDEKLF TFHADICTLP DTEKQIKKQT ALVELLKHKP561 KATEEQLKTV MENFVAFVDK CCAADDKEAC FAVEGPKLVV STQTALA
Bovine Albumin

mass position peptide sequence
927.486 161-167 YLYEIAR
1050.485 588-597 EACFAVEGPK
1283.703 361-371 HPEYAVSVLLR
1305.708 402-412 HLVDEPQNLIK
1439.504 360-371 RHPEYAVSVLLR
1479.788 421-433 LGEYGFQNALIVR
1567.735 347-359 DAFLGSFLYEYSR
1639.931 437-451 KVPQVSTPTLVEVSR
1667.893 469-482 MPCTEDYLSLILNR
1823.892 508-523 RPCFSALTPDETYVPK
2045.021 168-183 RHPYFYAPELLYYANK
2506.243 469-489 MOXPCTEDYLSLILNRLCVLHEK
YLY
EIA
R
EAC
FAVE
GPK
HP
EYA
VSV
LLR
LGE
YG
FQN
ALI
VR
RH
PYFY
APEL
LYYA
NK
RPC
FSAL
TPD
ETYV
PK
Peptide Mass Mapping


MKWVTFISLL FLFSSAYSRG VFRRDAHKSE VAHRFKDLGE ENFKALVLIA FAQYLQQCPF EDHVKLVNEV TEFAKTCVAD ESAENCDKSL HTLFGDKLCT VATLRETYGE MADCCAKQEP ERNECFLQHK DDNPNLPRLV RPEVDVMCTA FHDNEETFLK KYLYEIARRH PYFYAPELLF FAKRYKAAFT ECCQAADKAA CLLPKLDELR DEGKASSAKQ RLKCASLQKF GERAFKAWAV ARLSQRFPKA EFAEVSKLVT DLTKVHTECC HGDLLECADD RADLAKYICE NQDSISSKLK ECCEKPLLEK SHCIAEVEND EMPADLPSLA ADFVESKDVC KNYAEAKDVF LGMFLYEYAR RHPDYSVVLL LRLAKTYETT LEKCCAAADP HECYAKVFDE FKPLVEEPQN LIKQNCELFE QLGEYKFQNA LLVRYTKKVP QVSTPTLVEV SRNLGKVGSK CCKHPEAKRM PCAEDYLSVV LNQLCVLHEK TPVSDRVTKC CTESLVNRRP CFSALEVDET YVPKEFNAET FTFHADICTL SEKERQIKKQ TALVELVKHK PKATKEQLKA VMDDFAAFVE KCCKADDKET CFAEEGKKLV AASQAALGL
Human Albumin
m/z Missed Cleavages Sequence
1013.4244 0 589ETCFAEEGK597
1013.5990 0 599LVAASQAALGL609
1141.5194 1 589ETCFAEEGKK598
1141.6939 1 598KLVAASQAALGL609
1149.5759 1 25DAHKSEVAHR34
1149.6150 0 66LVNEVTEFAK75
1352.6661 1 497VTKCCTESLVNR508
1352.7685 1 427FQNALLVRYTK437
1623.7876 0 348DVFLGMFLYEYAR360
1623.9581 1 362HPDYSVVLLLRLAK375
1898.9952 1 169RHPYFYAPELLFFAK183
1898.9952 1 170HPYFYAPELLFFAKR184
0
MS alone CAN NOT distinguish peptides of similar molecular weight.
post-translational modification.sequence coverage determinations difficult.the identification of more than one protein in a sample impossible.Mass accuracy requirements

Mixture of Peptides
MS Analyzer
Retention Timea b c
m/z a
m/z b
m/z cCollision induced dissociation
(CID)
LC/MS or LC/MSMSPeptides with different m/z

Tandem (MS/MS) – Peptide Fragment Analysis

# b Seq. y #1 58.0287 G 132 171.1128 L 1362.7515 123 284.1969 L 1249.6674 114 413.2395 E 1136.5834 105 528.2664 D 1007.5408 96 641.3505 L 892.5138 87 698.3719 G 779.4298 78 861.4353 Y 722.4083 69 976.4622 D 559.3450 5
10 1075.5306 V 444.3180 411 1174.5990 V 345.2496 312 1273.6674 V 246.1812 213 K 147.1128
GLLEDLGYDVVVK
CASP4_MOUSECaspase-4OS=Mus musculus
LC/MSMS

MSMS Fragments and Different Fragmentation Technique
CID: a, b and y ion, loss of H2O, NH3, side-chain PSD: a, b and y ionIRMPD: b and y ion, loss of side-chainECD: c, y and z ionsETD: c, y and z ions
H2N C CO
NH
R1
HC C
ONH
R2
HC C
ONH
Rn-1
HC C
ORn
OH…
b1 a2 b2 c2 an-1 bn-1 cn-1
x1 y1 z1xn-2 yn-2 zn-2xn-1 yn-1
c1
zn-1
a1

b3b2b1
y1y2y3
1598
14241295
1166
1052
965852
723
586529
401Q G H E L S N E E R
Sequence Nomenclature for Mass Ladder
b2‐b1=56Da + R2 b3‐b2=56Da + R2
y3‐y2=56Da + R2 y2‐y1=56Da + R2
XX
Mass=56Da+R

200 300 400 500 600 700 800 900 1000 1100 1200 1300 1400m/z
246.00y2
345.32y3
444.29y4
559.27y5
722.22y6
892.36y8
1007.39y9
1136.48y10
1249.63y11
779.16y7
283.82b3
413.06b4
528.07b5
641.08b6
698.27b7
976.45b9
1075.51b11
1174.68b12
1273.72b13
861.35b8
99.32Val
98.97Val
114.98Asp
162.95Tyr
56.94Gly
113.20Leu
115.03Asp
129.09Glu
113.19Leu
99.17Val
99.06Val
115.10Asp
163.08Tyr
57.19Gly
113.01Leu
115.01Asp
129.24Glu
99.04Val
G L L E D L G Y D V V V Kb12b10 b11b7 b9b4 b5b3 b6 b8
y4 y2y5y6y8y10 y9y11 y7 y3

Data Dependent Top5 Method
Data Dependent Acquisition and Dynamic Exclusion 30143_WT_LEG #14457-14668 RT: 88.19-89.24 AV: 19 NL: 3.22E5T: FTMS + c ESI Full ms [350.00-2000.00]
400 450 500 550 600 650 700 750 800 850 900 950 1000 1050 1100 1150 1200m/z
0
5
10
15
20
25
30
35
40
45
50
55
60
65
70
75
80
85
90
95
100
Relative Abundance
743.89
649.66
997.60
736.42
499.30 729.64
584.62
758.15
562.36 643.41 788.92
445.12958.96
601.571063.19
947.46417.92 1044.181163.58538.31 668.66 876.43683.33
991.52
837.38480.61639.64
912.40817.43
1007.50
1193.31
508.31
1077.51 1154.23
724.35
1
32
54
67
8
MSMS
30143_WT_LEG #14664 RT: 89.25 AV: 1 NL: 1.39E3T: ITMS + c ESI d Full ms2 [email protected] [190.00-2000.00]
400 450 500 550 600 650 700 750 800 850 900 950 1000 1050 1100 1150 1200m/z
0
5
10
15
20
25
30
35
40
45
50
55
60
65
70
75
80
85
90
95
100
Rel
ativ
e A
bund
ance
898.13712.51
991.16
962.47776.52
918.39926.34
878.32589.17
638.90560.70
869.18734.69
525.26 693.22468.12 766.40 816.38
850.10660.95 1019.05
1048.37617.69
1167.301120.23424.27454.82
1092.28
30143_WT_LEG #14306 RT: 87.35 AV: 1 NL: 7.47E2T: ITMS + c ESI d Full ms2 [email protected] [260.00-2000.00]
400 450 500 550 600 650 700 750 800 850 900 950 1000 1050 1100 1150 1200m/z
0
5
10
15
20
25
30
35
40
45
50
55
60
65
70
75
80
85
90
95
100
Rel
ativ
e A
bund
ance
907.18
945.07624.99
738.98 850.52950.34
497.15722.80 767.95 1037.29898.17693.97 1167.831066.54
963.19833.56468.92 1136.33668.46601.35 1196.351022.35 1101.94418.44 511.27 579.50
30143_WT_LEG #14360 RT: 87.64 AV: 1 NL: 1.09E3T: ITMS + c ESI d Full ms2 [email protected] [140.00-1660.00]
400 450 500 550 600 650 700 750 800 850 900 950 1000 1050 1100 1150 1200m/z
0
5
10
15
20
25
30
35
40
45
50
55
60
65
70
75
80
85
90
95
100
Rel
ativ
e A
bund
ance
622.91
679.63
515.34
819.15
557.39
510.16
715.31651.39566.39 1001.25
466.65574.64
932.45
540.92409.65 724.31501.05420.13 611.22 809.47 1019.31 1132.30737.84 1100.22793.33 873.75
30143_WT_LEG #14467 RT: 88.20 AV: 1 NL: 4.03E3T: ITMS + c ESI d Full ms2 [email protected] [190.00-1485.00]
400 450 500 550 600 650 700 750 800 850 900 950 1000 1050 1100 1150 1200m/z
0
5
10
15
20
25
30
35
40
45
50
55
60
65
70
75
80
85
90
95
100
Rel
ativ
e A
bund
ance
1002.30
648.24
761.20 824.14
644.32
874.36711.34
1158.45
1097.28727.35 984.16470.06
442.20 598.03487.98
693.59805.93580.22509.03 622.06
562.69 919.63795.91 1193.021080.75868.80 967.13 1118.91424.11 1068.94
30143_WT_LEG #14359 RT: 87.63 AV: 1 NL: 3.35E2T: ITMS + c ESI d Full ms2 [email protected] [215.00-2000.00]
400 450 500 550 600 650 700 750 800 850 900m/z
0
5
10
15
20
25
30
35
40
45
50
55
60
65
70
75
80
85
90
95
100
Rel
ativ
e A
bund
ance
546.11
762.93 817.42
417.30 617.37 696.97878.39
706.20746.46
660.79
711.89822.64
842.66
489.08 869.10
641.63 807.75 854.16674.05 725.63
799.31881.19566.84 599.46540.10
580.62 886.21526.61
432.28
12 3
45
MS Cycle: 0.06SLC Peak Width >12S
Dynamic Exclusion
Make MSMS for the lower abundant ions possible!!

VFGTDMDNSR
IFDDSDQTK
LVNLGK
QAEDVNLLDQMSK
If all of these peptides belonged to anunknown protein, MS/MS couldpotentially reveal protein identity
More Peptides IdentifiedIncrease Confidence in ID

Data Analysis for MS/MS Method
?MS/MS
MS Peptide MWFound in Selected
DatabasesNDALYFPT...SWDLTAL...PTDLDVSY...
protein peptides identify
rank
200 400 600 800 1000 1200 1400 1600
Rel
ativ
e In
tens
ity
m/z
theoretical spectra200 400 600 800 1000 1200 1400 1600
0
20000
40000
60000
80000
100000
120000
Rel
ativ
e In
tens
ity
m/z
compare

Database SearchingMascot•16 node cluster for high-speed data processing
Protein sequences are digested and fragmented In Silico which produces an enormous peak list
Raw MS/MS data is converted to a peak list and compared against the In Silico peak list.
Critical point of database searching•The enzyme must work properly (no non-specific cleavage and missed cuts)•The mass accuracy limits must be set appropriately•Any modifications must be accounted for (modified cysteine)•The database must contain the protein

Mascot Database Search Engine
20ppm for orbitrap1.5 Da for LTQ
Enzyme Used

MASCOT Results

Protein Name
Protein Mascot Mowse Score
Protein Mol. Weight
# of spectra matched# of peptides matched
The Exponentially Modified Protein Abundance Index (emPAI)
MASCOT Results
*
*

Peptide Sequence and MS/MS Information

Protein Name
MASCOT Results
*

Peptide Sequence and Sequence Coverage

MASCOT Results

Protein Report

Post-translational Modifications
Modification Modified residue Mass Shift (Da)
Disulphide bond formation C -2.0157Deamidation of Asn and Gln Q/N 0.9840Methylation K/R 14.0157Hydroxylation P 15.9949Oxidation of Met M 15.9949Acetylation K 42.0106Carboxyamidomethylcysteine(iodoacetamide) C 57.0215
Phosphorylation S/T/Y 79.9663Biotinylation (amide bond to lysine) K 226.0776Nitration Y 44.9851Ubiquitination K 114.0429Oxidation of Cys C 31.9721/47.9847nitrosylation C 28.9902

Peptide Modifications
• Virtually anything that shifts the mass can be determined by MS
• Using MS/MS allows for identification of the modification AND location
• You must have an idea of what modification you are looking for
• First use protein stain to examine various modifications (multiplex analysis)
• Western analysis VS MS analysis

200 300 400 500 600 700 800 900 1000 1100 1200 1300 1400 1500 1600m/z
712.632+
y14
753.582+
b14
276.20y2
347.18y3
446.27y4
547.27y5
618.41y6
717.41y7 774.38
y8
911.36y9 1109.47
y11
1166.53y12
1295.49y13
1423.55y14
1010.47y10
357.19b2
486.30b3
543.30b4
642.31b5
741.36b6
878.49b7
935.48b8
1034.45b9
1206.44b11
1305.59b12
1376.51b13
1505.59b14
1105.51b10
44X K E G V V H G V A T V A E K60
X=C10H16N2O4 (228.1105 Da)
Theoretical m/z 826.45432+
Observed m/z 826.45732+
Mass Error 3.63 ppm
y4 y2
b13 b14
y5
b12
y6
b10 b11
y8y10 y9
b7 b9
y11y12
b4 b5
y13
b3 b6 b8
y7
b2
y3y14
70.98A
99.09V
101.00T
71.13A
99.00V
56.97G
136.98H
99.11V
99.00V
57.06G
128.96E
128.06K
70.92A
99.15V
100.93T
71.06A
97.97V
56.99G
137.13H
99.05V
99.01V
57.00G
129.11E
129.98E
Mass of X=(M+H)-y14=826.4543*2-1-1423.55=228.35

500 600 700 800 900 1000 1100 1200 1300 1400 1500m/z
638.892+
b8
638.312+
y9 1274.57y9
738.122+
b10
794.642+
b11
795.572+
y11
960.47y7
573.11b4
759.32b5
906.56b6
1062.49b7
1276.67b8
1474.67b10
186.21Trp
97.24Phe
155.93Arg
214.18(103+111)C-DMPO
198.00 (97+101)Pro-Thr
900E E W K W F R C907(DMPO) P T L L911
b4 b5 b6 b7 b8 b10 b11
y11 y9 y7
Theoretical m/z=859.942+
Observed m/z=859.892+
DMPO=C6H9NO (111.0684 Da)
DMPO Adduct

300 400 500 600 700 800 900 1000 1100 1200 1300 1400m/z
1500
317.28y3
404.24y4
503.32y5
617.36y6
718.37y7
817.37y8
984.39y9
1083.45y10
1197.51y11
1311.59y12
1426.56y13
391.12b4
505.27b5
619.29b6
718.37b7
1484.46b14
984.39b9
1085.46b10
1199.51b11
1298.46b12
1385.54b13
886.36y9*
1099.56y11*
1213.70y12*
886.36b9*
1101.51b11*
1200.51b12*
1287.76b13*
1386.63b14*
1457.78b15*
Ser Val Asn Thr Val
167.02 (87+80)Ser(PO4)
Val Asn Asn Asp
SerValAsnThr Val
266.02 (87+80+99)Ser(PO4)-ValValAsnAsn
41T S S D N N V S(PO4)48 V T N V S V A K56
bn*=bn-H3PO4yn*=yn-H3PO4m/z=850.542+
802.432+
M-H3PO4
b13b13*b4 b6 b7 b15*
b11b11*b5
y9y9*
y10 y3y4y5y6y8 y7
b14b14*
y11y11*
y12y12*
y13
b10b12b12*
b9b9*
Phosphorylation

200 300 400 500 600 700 800 900 1000 1100 1200 1300 1400m/z
241E A F P A Y246(N2O) R Q P P E S L253
b3 b4 b7 b8 b11
y3y4y8y9y10y11
219.15y2
348.10y3
445.22y4
542.31y5
670.43y6
826.20y7
1034.50y8
1105.51y9
1202.57y10
1349.69y11
675.552+y11
348.10b3
445.22b4
1105.51b9
1202.57b10
880.42b7
1008.45b8
1331.59b11
601.992+b10
666.502+b11 709.872+
b12
Glu Pro Pro Gln208.3 (163+45)
Tyr(N2O)Arg Ala Pro Phe
GluPro ProGlnPro
b9 b10 b12
y2y6y7 y5
Measured m/z = 775.612+Theoreticalm/z = 775.372+
Nitration

400 600 800 1000 1200 1400 1600 1800 2000m/z
460.24y4
623.30y5
736.40y6 823.41
y7
910.39y8
1023.55y9
1151.56y10
1280.54y11
1431.51y121488.48
y13
1617.48y14
1745.66y15
1858.62y16
930.162+
y16
1014.182+
b19
979.482+
y17
584.26b6
713.38b7 770.40
b8921.28
b9
1050.21b10
1178.34b11
1291.39b12 1378.34
b13
1465.42b14
1578.48b15
1741.58b161798.75
b17
1913.59b18
873.542+
y15
E G
150.88(103+48)C(SO3) E K I S S L Y G D
EGEKISSLY Q L
529V G S V L Q E G C(SO3) E K I S S L Y G D L R548y4y5y7y8y9y10y11y12y14
b6 b7 b8 b9 b10 b11 b12 b13 b14 b15 b16
y6y13y15y17 y16
b17 b18 b19
150.97(103+48)C(SO3)
Cysteine Oxidation

Generating Peptides containing modified residue --Different Enzymes
Low population of modifications--Enrichment--Targeted Method
Modification not stable--Experiment Condition (reducing reagents, enzymes)--Fresh sample
Modification labile in MS analysis--Neutral Loss Method--Different Fragmentation Method
Difficulties for PTMs Identification

Trypsin K-X and R-X
Endoprotease Lys-C K-X except when X = P
Endoprotease Arg-C R-X except when X = P
Endoprotease Asp-N X-D
Endoprotease Glu-C E-X except when X = P
Chymotrypsin L-X, F-X, Y-X and W-X
Cyanogen Bromide X-M
Enzymes for Proteome Research

1 MAALKLLSSG LRLGASARSS RGALHKGCVC YFSVSTRHHT KFYTDPVEAV 51 KDIPNGATLL VGGFGLCGIP ENLIGALLKT GVKDLTAVSN NAGVDNFGLG
101 LLLRSKQIKR MISSYVGENA EFERQFLSGE LEVELTPQGT LAERIRAGGA 151 GVPAFYTSTG YGTLVQEGGS PIKYNKDGSV AIASKPREVR EFNGQHFILE 201 EAITGDFALV KAWKADRAGN VIFRKSARNF NLPMCKAAGT TVVEVEEIVD 251 IGSFAPEDIH IPKIYVHRLI KGEKYEKRIE RLSLRKEGDG KGKSGKPGGD 301 VRERIIKRAA LEFEDGMYAN LGIGIPLLAS NFISPNMTVH LQSENGVLGL 351 GPYPLKDEAD ADLINAGKET VTVLPGASFF SSDESFAMIR GGHVNLTMLG 401 AMQVSKYGDL ANWMIPGKMV KGMGGAMDLV SSSKTKVVVT MEHSAKGNAH 451 KIMEKCTLPL TGKQCVNRII TEKGVFDVDK KNGLTLIELW EGLTVDDIKK 501 STGCDFAVSP NLMPMQQIST
Tryspin: 309AALEFEDGMYANLGIGIPLLASNFISPNMTVHLQSENGVLGLGPYPLK356Chymotrypsin: 329ASNF332, GluC: 315DGMYANLGIGIPLLASNFISPNMTVHLQSE344
Phosphorylation
Using the CORRECT Enzyme

Generating Peptides containing modified residue --Different Enzymes
Low population of modifications--Enrichment--Targeted Method
Difficulties for PTMs Identification

PTM Enrichment Techniques (Start with mg of samples)
Acetylation: Anti-acetyl lysine polyclonal antibody
Phosphopeptides: Immobilized Metal Affinity Chromatography (Fe3+)Metal Oxide Affinity Chromatography (TiO2, ZrO2)Reversible Covalent Binding
(Dunn JD1, Reid GE, Bruening ML, Techniques for phosphopeptide enrichment prior to analysis by mass spectrometry. Mass Spectrom Rev. 2010 Jan-Feb;29(1):29-54.)
Phospho-Threonine Antibody (P-Thr-Polyclonal)
Nitration: Anti‐Nitrotyrosine polyclonal antibody
Ubiquitination: K-ε-GG–specific antibody (enrichment has to be done prior to other treatment on lysine)
Glycopeptides: Lectin affinity enrichmentCovalent InteractionsChromatographic separation
Ongay S1, Boichenko A, Govorukhina N, Bischoff R., Glycopeptide enrichment and separation for protein glycosylation analysis., J Sep Sci. 2012 Sep;35(18):2341-72.
Methylation: Anti-methyl lysine/araginine antibody

RT: 10.04 - 89.85
15 20 25 30 35 40 45 50 55 60 65 70 75 80 85Time (min)
0
10
20
30
40
50
60
70
80
90
1000
10
20
30
40
50
60
70
80
90
100
Rel
ativ
e A
bund
ance
35.88
42.9541.90
49.23
49.07
40.05
45.5136.2769.9828.36
61.2660.55
65.79 71.3953.2834.20
59.1532.0427.80
61.7524.09 74.1717.6789.7880.23 82.6574.6210.19 14.63
44.39
35.70
65.64 69.7936.07
42.6641.65 44.57
39.72
53.0348.95 61.7528.19 61.2549.11 70.1849.40
57.3134.12 71.3327.61 65.82
17.77 74.1723.8680.19 82.5578.61 89.7314.23
NL:2.47E8Base Peak MS 17625_1_Rerun
NL:3.98E8Base Peak MS 17625_1_target_1
Full Scan
Scan for 479.27302+ (SLVLfGlyTPSR ) and 516.77932+ (SLVLC(CAM)TPSR)
17625_1_target_1 #1211-2280 RT: 27.51-40.35 AV: 25 NL: 4.96E2T: ITMS + c ESI d Full ms2 [email protected] [120.00-1450.00]
150 200 250 300 350 400 450 500 550 600 650 700 750 800 850m/z
0
5
10
15
20
25
30
35
40
45
50
55
60
65
70
75
80
85
90
95
100
Rel
ativ
e A
bund
ance
581.20
359.28
470.05
460.31757.37417.14
658.29545.37
413.03601.33
300.11201.06 670.45403.45286.23173.18 448.88
640.46255.07 487.34 730.46337.35219.26 511.32 812.38 833.42687.02 782.91
No MSMS spectrum for 479.29302+
Targeted MS Scan (for Known Modifications)
SLVLfGlyTPSR
99Val
113Leu
85fGly
101Thr

Generating Peptides containing modified residue --Different Enzymes
Low population of modifications--Enrichment--Targeted Method
Modification not stable--Experiment Condition (reducing reagents, enzymes)--Fresh sample
Difficulties for PTMs Identification

m/z400 600 800 1000 1200 1400 1600250
Chain A
Chain B
185N A C187 G S G Y D F D V F V V R199
138L V E G C142 L V G G R146
S
S
408.17 465.20 552.31 609.30 772.30 1034.35 1149.39 1248.41 1395.53 1494.50 1593.59
289.23y3B
342.33b3B
501.10y5B
274.25y2A
373.31y3A
520.42y4A
619.48y5A
734.51y6A
1303.64y11A
1159.62y9A
1216.57y10A
1360.66y12A
996.57y8A
y2Ay3Ay4Ay5Ay6Ay8Ay10Ay11Ay12A y9A
V F V D FD Y G S G
VFVDFDYGSG V
y3By5B
b3B
A
B
Adjust Experiment Condition to Preserve Modifications
200 300 400 500 600 700 800 900 1000 1100 1200 1300 1400m/z
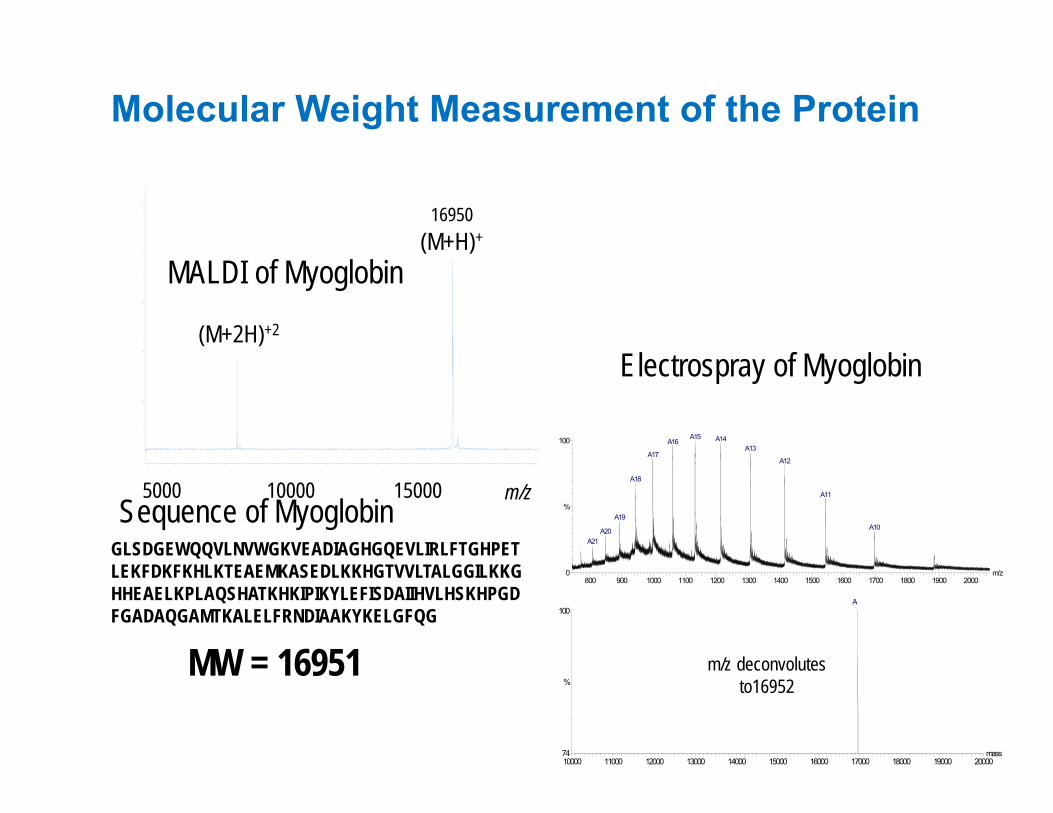
194A G R P G M G V O202 G P E T S L208
y4y5y7y8y9y10y12
b3 b5 b6 b7 b8 b9 b10 b11 b12 b13 b14
y6 y3
Theoretical m/z =783.40892+, Observed m/z =783.40802+, Mass Error =1.15ppm
674.472+b13
285.21b3
439.23b5
570.30b6
627.43b7
1020.49b10
726.35b8
963.39b9
1117.55b11
1347.71b13
1246.54b12
718.062+b14
623.822+b12
154.13 (97+57)P‐G
130.97M
57.13G
98.92V
237.04O
101.17T
57.10G
97.06P
128.99E
320.13y3
449.05y4
546.24y5
603.21y6
840.38y7
939.24y8
996.30y9
1127.37y10
1281.45y12
128.92E
97.19P
56.97G
237.17 O
98.86V
57.06G
131.07M
154.08 (57+97)G‐P
O=Pyrrolysine
Using Different Enzyme to Protect Modifications

Generating Peptides containing modified residue --Different Enzymes
Low population of modifications--Enrichment--Targeted Method
Modification not stable--Experiment Condition (reducing reagents, enzymes)--Fresh sample
Modification labile in MS analysis--Neutral Loss Method--Different Fragmentation Method
Difficulties for PTMs Identification

Scan ScanDissociate
Neutral Loss Scan
Phosphopeptides can lose phosphoric acid on CID (Serine, Threonine)
+ Pi(H3PO4)
98 amu Neutral (M+H)+
49 amu Neutral (M+2H)2+
LDIFpSDFGGLK
98//32.7
113
129

Neutral Loss Scan
Image from http://www.mcponline.org/content/9/3/579/F5.expansion

ECD/ETD: Keep the Phosphorylation Intact
PO3 or H3PO4 groups may leave upon CID activation
actual amino acid location of PO3 group may not be clear
Electron Capture Dissociation (ECD) requires an ICR; Electron Transfer Dissociation (ETD) in traps
• Peptide fragments without loss of phospho group
Sweet, Anal. Chem. 2006, 78, 7563-7569

Leann M. Mikesh et al. Biochimica et Biophysica Acta 1764 (2006) 1811–1822

Identification of PTMs:
High Mass Accuracy
High Samples Purity
High Concentration
Know the Modification (Stability, Mass Shift, possible modification site)

Protein Complex Identification(Whole cell lysate, IP Products)
Clean Sample!!!(Less Salt, No Detergent
Lipids, DNA Free, Keratin Free)
Better SeparationMore sensitive Instruments
On Bead DigestionPre-Fractionation

Method Separation based on
Separation done using Further steps
Gel Electrophoresis (1D) Molecular mass
Gel (which acts like a molecular sieve) and potential
In-gel digestion of proteins to peptidesLC-MS/MSGel Electrophoresis
(2D)
Isoelectric point (pI; IEF) & Molecular mass
Gel, potential and ampholytes
Reverse Phase (C8 or C4) chromatography
Combination of hydrophobicity and molecular weight
HPLC
Protein(s) Digest to peptides LC-MS/MS
Gel Filtration Molecular Weight HPLC
Ion Exchange Cation or Anion affinity FPLC
Affinity Chromatography DNA,RNA, Anti-body, peptides etc
HPLC
Types of Separation Technologies for Molecules

Pre-Fractionation Method
LC/MSMSLC/LC/MSMS
High Abundant Protein Depletion1D SDS FractionationOff-gel Fractionation
SCX Fractionation

1
2
3
4567
8
9
10
11
In Gel Digestion
In Gel Digestion
In Gel Digestion
In Gel DigestionIn Gel DigestionIn Gel DigestionIn Gel Digestion
In Gel Digestion
In Gel Digestion
In Gel Digestion
In Gel Digestion
Same Volume
LC/MSMS
LC/MSMS
LC/MSMS
LC/MSMSLC/MSMSLC/MSMSLC/MSMS
LC/MSMS
LC/MSMS
LC/MSMS
LC/MSMS
MASCOT Search
1D SDS PAGE Fractionation LC/MSMS Workflow
>1800 Proteins identifiedGlobal Digestion: 920 ProteinsSCX‐LC/MSMS: 981 Proteins1D SDS‐LC/MSMS: >1800 Proteins

Quantitative ProteomicsQuantitation in proteomics has become a popular area in recent proteomics research with the development of quantitation techniques such as DIGE, SILAC, ICAT, iTRAQ and Label Free.
•Difference Gel Electrophoresis•Gel based using cy-dye chemistry.
•Isobaric tag for relative and absolute quantitation – iTRAQ• is a non-gel based technique used to identify and quantify proteins/peptides from different sources in one single experiment by using isotope coded covalent tags that will label the N-terminus and side chain amines of peptides from protein digestions.
•Stable isotope labeling by amino acids in cell culture – SILAC• is a non-gel based approach for in vivo incorporation of a label into proteins for MS quantitative proteomics. It relies on metabolic incorporation of a given 'light' or 'heavy' form of the amino acid into the proteins.
•Label Free Quantitation•It has been observed the chromatographic peak areas and number of spectra/peptides observed for a protein in a LC/MS/MS run is correlated with the concentration of that particular protein.

DIGE (Difference Gel Electrophoresis)

Spot Volume = [spot 1 on treated]/[spot 1 on standard]
DIGE (Difference Gel Electrophoresis)

In Gel Digestion, LC/MSMS, MASCOT
DIGE (Difference Gel Electrophoresis)

high sensitivity
linearity of the dyes utilized
straightforward significant reduction of experiment error
High reproducibility
Pros and Cons to DIGE
300 – 500 µg of total protein is required for each biological replicate
Requires high resolution 2D gels
Not ideal for membrane proteins
Not ideal for serum type samples
Some protein spots identify more than one protein or do not have enough protein to identify the spot
Labor Intensive

Overview of iTRAQ™ Reagents Methodology
Labeling Lys and N‐terminus
Up to 8 samples
Fractionation offers more identification
Trypsin digestion
Cell Culture + Tissue
Isobaric tag for relative and absolute quantitation

Chemistry of TMT™ Reagents
Figure Provided Courtesy of Thermo Fisher Scientifics

Figure Provided Courtesy of Thermo Fisher Scientifics
Workflow of TMT™ Reagents

Group IS Normal Mod Mild Mix1 IS 1 (126) 2004 (127) 2041 (128) 2043 (129) 2069 (130)2 IS 2 (126) 2007 (131) 2042 (127) 2040 (128) 2066 (129)3 IS 3 (126) 2008 (130) 2065 (131) 2070 (127) 2037 (128)4 IS 4 (126) 2063 (129) 2046 (130) 2038 (131) 2014 (127)5 IS 5 (126) 2015 (128) 2068 (129) 2071 (130) 2036 (131)6 IS 6 (126) 2016 (127) 2067 (128) 2062 (130) 2035 (131)
Dry Eye Studies: 4 Groups: Normal, Moderate Dry Eye, Mild Dry Eye, Mixed Dry Eyes
100 300 500 700 900 1100 1300 1500m/z 19001700
232.12y2
331.31y3
559.25y5
674.35y6
821.55y7
968.30y8
1131.44y9
1245.38y10
1344.23y11
1401.32y121458.29
y131605.40y14
1706.27y15
1834.52y16
487.24b2
588.18b3
792.12b5 849.14
b6948.30b7
1062.54b8
1225.15b9
1372.42b10
1519.43b11
1634.48b12
1733.70b13
1862.61b14
735.20b4
359.16b1
Peptide Sequence:EQTFGGVNYFFDVEVGRProtein Name : Human Cystatin-S
Observed m/z= 1097.02702+
Theoretical m/z= 1097.04432+
124 126 128 130 132 134m/z05
101520253035404550556065707580859095
100
Rel
ativ
e A
yund
ance 126
127 129128
131Ratio 126:127:128:129:130:131=1:0.30:0.09:0.25:0.00:1.49
99.17Val
227.94 (129+99)Glu-Val
115.10Asp
147.20Phe
146.75Phe
163.14Tyr
113.94Asn
98.85Val
57.09Gly
56.97Gly
147.11Phe
100.87Thr
128.25Gln
99.22Val
115.05Asp
147.01Phe
147.27Phe
162.61Tyr
114.24Asn
99.16Val
56.92Gly
57.02Gly
147.02Phe
100.94Thr
128.08Gln
128.91Glu

iTraq MASCOT Results

Protein Name
DE/NDE (Ratio (# of Detection, p value))
FunctionMild/Normal Mod/Normal Mix/Normal
Aldehyde dehydrogenase, dimeric NADP-preferring OS=Homo sapiens (2.41, 6, 0.0030) (1.69, 6, 0.0471) oxidoreductase activity
Apolipoprotein A-I OS=Homo sapiens (1.75, 6, 0.0362) transporter activity; protein binding; enzyme regulator activity; lipid binding
Cystatin-S OS=Homo sapiens (0.51, 6, 0.0014) (0.43, 6, 0.0005) (0.60, 6, 0.0283) enzyme regulator activity
Deleted in malignant brain tumors 1 protein OS=Homo sapiens (0.60, 6, 0.0472) signal transducer activity; protein binding; bacterial cell surface binding
Ezrin OS=Homo sapiens (1.79, 6, 0.0101) protein binding; binding
Hemopexin OS=Homo sapiens (2.15, 6, 0.0384) (2.11, 6, 0.0486) binding; transporter activity; ion binding
Haptoglobin OS=Homo sapiens (1.97, 6, 0.0474) catalytic activity; protein binding; peptidase activity
Ig alpha-1 chain C region OS=Homo sapiens (0.59, 6, 0.0113) antigen binding; protein binding
Ig gamma-1 chain C region OS=Homo sapiens (1.94, 6, 0.0266) antigen binding; protein binding
Ig gamma-2 chain C region OS=Homo sapiens (1.87, 6, 0.0369) antigen binding
Ig gamma-3 chain C region OS=Homo sapiens (2.08, 6, 0.0408) antigen binding
Extracellular glycoprotein lacritin OS=Homo sapiens (0.28, 6, 0.0059) (0.23, 6, 0.0003) (0.48, 6, 0.0428) protein binding; extracellular matrix binding
Putative lipocalin 1-like protein 1 OS=Homo sapiens (0.43, 6, 0.0026) (0.39, 6, 0.0002) (0.50, 6, 0.0119) binding; transporter activity
Lipocalin-1 OS=Homo sapiens (0.33, 6, 0.0030) (0.32, 6, 0.0003) (0.43, 6, 0.0188) binding; transporter activity; protein binding; enzyme regulator activity
Lysozyme C OS=Homo sapiens (0.33, 6, 0.0019) (0.28, 6, 0.0031) catalytic activity; hydrolase activity; protein binding
Polymeric immunoglobulin receptor OS=Homo sapiens (0.51, 6, 0.0290) (0.43, 6, 0.0016) protein binding
Prolactin-inducible protein OS=Homo sapiens (0.36, 6, 0.0004) (0.38, 6, 0.0008) (0.58, 6, 0.0409) protein binding
Proline-rich protein 1 OS=Homo sapiens (0.44, 6, 0.0023) (0.39, 6, 0.0056) enzyme regulator activity
Proline-rich protein 4 OS=Homo sapiens (0.41, 6, 0.0042) (0.34, 6, 0.0081)
Secretoglobin family 1D member 1 OS=Homo sapiens (0.28, 6, 0.0032) (0.21, 6, 0.0006) (0.41, 6, 0.0169) binding
Mammaglobin-B OS=Homo sapiens (0.34, 6, 0.0076) (0.26, 6, 0.0009) (0.43, 6, 0.0215) steroid binding; binding; hormone binding
Serotransferrin OS=Homo sapiens (2.02, 6, 0.0429) protein binding; ion binding
Lactotransferrin OS=Homo sapiens (0.33, 6, 0.0019) (0.34, 6, 0.0072) peptidase activity; ion binding; pattern bindingcarbohydrate binding; hydrolase activity; protein binding
Vitamin D-binding protein OS=Homo sapiens (1.65, 6, 0.0449) (1.87, 6, 0.0206) transporter activity; steroid binding; vitamin binding;: protein binding
Zinc-alpha-2-glycoprotein OS=Homo sapiens (0.40, 6, 0.0047) (0.36, 6, 0.0029) (0.59, 6, 0.0502) lipid binding; carboxylic acid binding; hydrolase activity; transporter activity
Zymogen granule protein 16 homolog B OS=Homo sapiens (0.44, 6, 0.0383) carbohydrate binding
iTraq Results

Pros and Cons to iTRAQ
Requires less total protein than DIGE (50 µg or less)
One experiment can determine fold change, protein ID and Post translational modification
Up to 8-10 groups can be compared at the same time
Samples can come from both tissue or cell culture
• Mass Spectrometry requirements are rigorousHigh resolutionAdvanced LC chromatographyLong instrument timePQD/HCD needed on IT instrument
• Produces enormous amount of data
• Requiring detailed bioinformatic analysis
• Expensive

Regular Media (Lys Light)
Lys-depleted Media(Lys Heavy)
No Drug Drug Treatment
Combination/Extraction
Digestion/Peptide Identification
Change =
Digestion
Shotgun Proteomics
SILAC (Stable isotope labeling by amino acids in cell culture)
Heavy Isotopic Labeled Amino Acids:
L-Lysine: 13C6, (+6Da), 13C6/15N2 (+8Da), 13C6/15N2/D9 (+17Da), 15N2/D9 (+11Da), D4 (+4Da)
L- Arginine: 13C6 (+6Da), 13C6/15N4 (+10Da), 13C6/15N4, D7 (+17Da),15N4/D7 (+11Da)
L-Tyrosine: 13C9 (+9Da)
Fractionation/IP LC/MSMS

Optimization of Heavy Amino Acids IncorporationS G R G K5 G G K8 G L G K12 G G A K16 R H R K20 V L R D N I Q G I T K31 P A I R R
L A R R G G VK44 R I S G L I Y E E T R G V L K59 V F L E N V I R D A V T Y
T E H A K77 R K79 T V T A M D V V Y A L K91 R Q G R T L Y G F G G
∆ M =4*11= 44
11353
11396
11309
11279
11351
11393
11200 11300 11400 11500 11600
Mass
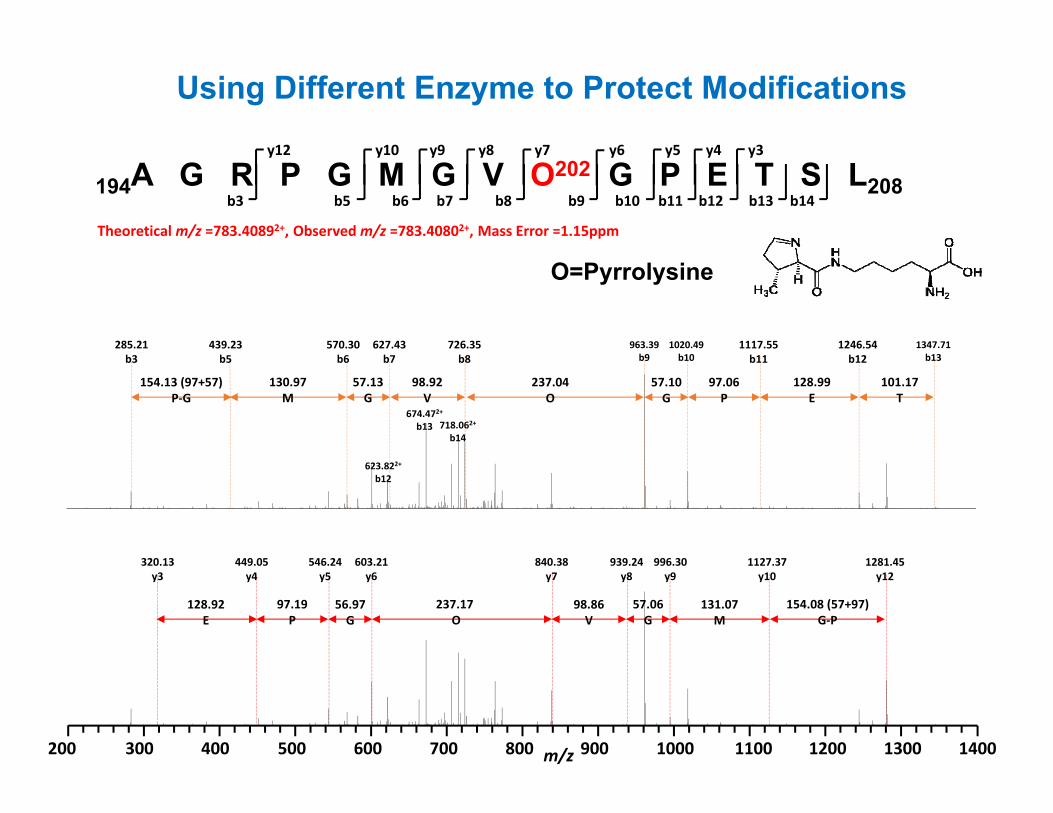
17881_13Days #21693-22317 RT: 127.45-130.89 AV: 100 NL: 6.03E5T: FTMS + c ESI Full ms [350.00-2000.00]
920 940 960 980 1000 1020 1040 1060 1080 1100m/z
0
5
10
15
20
25
30
35
40
45
50
55
60
65
70
75
80
85
90
95
100
Relative Abundance
935.19
944.68
1012.47
907.49
1082.79984.88
1044.02
945.93
982.84908.801086.07
1014.48
1047.03948.171001.85966.48 1057.00 1064.50924.47914.92
1032.53
1078.08
1041.70
957.65 979.78 1091.02
930.44 1009.11
1023.84
994.55
987.00
1095.56
K* =13C6/15N2 labeled LysR* =13C6/15N4 labeled Arg
Cell Culture Labeled for 7 days
Cell Culture Labeled for 7 days

17872_1_7 #1858-1959 RT: 22.95-23.41 AV: 13 NL: 5.19E4T: FTMS + p ESI Full ms [350.00-2000.00]
660 662 664 666 668 670 672 674 676 678m/z
0
5
10
15
20
25
30
35
40
45
50
55
60
65
70
75
80
85
90
95
100
Relative Abundance
663.38
672.39
663.88
672.90
664.39
673.40
675.40671.89
675.90664.89673.90667.18 670.41661.29
674.88
662.83 676.40 679.39668.18665.35 678.37666.42 668.89
17872_1_7 #1902 RT: 23.14 AV: 1 NL: 1.01E3T: ITMS + c ESI d Full ms2 [email protected] [170.00-1340.00]
200 300 400 500 600 700 800 900 1000 1100 1200m/z
0
5
10
15
20
25
30
35
40
45
50
55
60
65
70
75
80
85
90
95
100
Relative Abund
ance
685.43
606.03456.31
855.50
654.58
492.54 549.04
983.57
742.11511.08 798.47229.90 342.92 584.37
1151.56696.36298.04 428.40358.01 1168.47838.40784.19 1117.35921.24 1027.74279.94 423.46
873.56
615.20
703.42
663.81466.34
1001.27230.07558.07
602.24501.42 816.61342.89725.30
1143.22255.27
983.84825.94775.75 1012.89298.12 411.46
1068.81 1195.44975.96
18Da18Da
∆ M =10+8= 18Da
DNIQGITKPAIR DNIQGITK*PAIR*
K* =13C6/15N2 labeled LysR* =13C6/15N4 labeled Arg
MSMS of DNIQGITK*PAIR* MSMS of DNIQGITKPAIR
Ratio=Heavy/Light=1:1

Accession Description Ratio: Heavy/Light
Sample 1 Sample 2
P35527 Keratin, type I cytoskeletal 9 OS=Homo sapiens 0.096 0.049
P22314 Ubiquitin‐like modifier‐activating enzyme 1 OS=Homo sapiens 0.106 0.182
P23526 Adenosylhomocysteinase OS=Homo sapiens 0.250 0.151
P13645 Keratin, type I cytoskeletal 10 OS=Homo sapiens 0.257 0.265
P52597 Heterogeneous nuclear ribonucleoprotein F OS=Homo sapiens 0.260 0.254
O43175 D‐3‐phosphoglycerate dehydrogenase OS=Homo sapiens 0.262 0.276
P31943 Heterogeneous nuclear ribonucleoprotein H OS=Homo sapiens 0.284 0.337
P23771 Trans‐acting T‐cell‐specific transcription factor GATA‐3 OS=Homo sapiens 0.295 0.379
O00299 Chloride intracellular channel protein 1 OS=Homo sapiens 0.306 0.316
P07741 Adenine phosphoribosyltransferase OS=Homo sapiens 0.319 0.343
Q14103 Heterogeneous nuclear ribonucleoprotein D0 OS=Homo sapiens 0.359 0.390
Q9BQE3 Tubulin alpha‐1C chain OS=Homo sapiens 0.380 0.404
P13639 Elongation factor 2 OS=Homo sapiens 0.391 0.609
P31949 Protein S100‐A11 OS=Homo sapiens 0.394 0.626
P08107 Heat shock 70 kDa protein 1A/1B OS=Homo sapiens 0.412 0.435
P11586 C‐1‐tetrahydrofolate synthase, cytoplasmic OS=Homo sapiens 0.415 0.835
P23246 Splicing factor, proline‐ and glutamine‐rich OS=Homo sapiens 0.418 0.387
P31942 Heterogeneous nuclear ribonucleoprotein H3 OS=Homo sapiens 0.424 0.382
P58546 Myotrophin OS=Homo sapiens 0.429 0.420
P11021 78 kDa glucose‐regulated protein OS=Homo sapiens 0.442 0.514
P00558 Phosphoglycerate kinase 1 OS=Homo sapiens 0.450 0.574
P61978 Heterogeneous nuclear ribonucleoprotein K OS=Homo sapiens 0.472 0.445
P62826 GTP‐binding nuclear protein Ran OS=Homo sapiens 0.475 0.496
P35080 Profilin‐2 OS=Homo sapiens 0.484 0.409
O60506 Heterogeneous nuclear ribonucleoprotein Q 1.198 1.051
Q99623 Prohibitin‐2 OS=Homo sapiens 1.222 0.706
Q06830 Peroxiredoxin‐1 OS=Homo sapiens 1.251 1.183
P62244 40S ribosomal protein S15a OS=Homo sapiens 1.265 1.124
P07355 Annexin A2 OS=Homo sapiens 1.299 1.194
P28072 Proteasome subunit beta type‐6 OS=Homo sapiens 1.302 1.133
P21333 Filamin‐A OS=Homo sapiens 1.310 1.243

Pros and Cons to iTRAQ
Expensive
Special data analysis platform
Samples come from cell cultures
Time consuming
One experiment can determine fold change, protein ID and Post translational modification
Up to several groups can be compared at the same time
Mixing at the beginning, allow more sample preparation steps
significant reduction of experiment error
High reproducibility

doesn’t use a stable isotope containing compound tochemically label the protein. It can determine the relativeamount of proteins in two or more biological samples bycomparing peptide peak areas or spectral counting.
Label-free quantification
Peak AreaMASCOT
ProteomeDiscoverer
Spectral CountingMASCOTScaffold
ProteomeDiscoverer
Relative Concentration (emPAI)MASCOT

Label Free Quantitation by Spectral CountingRelative protein quantification is achieved by comparing the number ofidentified MS/MS spectra from the same protein in each of multipleLC/MS/MS
Hongbin Liu, Rovshan G. Sadygov and John R. Yates, III, A Model for Random Sampling and Estimation of Relative Protein Abundance in Shotgun Proteomics Anal. Chem. 2004, 76, 4193-4201

# of reports = # of Treatment Conditions X # of Bio-replicates
Scaffold
Label Free Quantitation by Spectral Counting

Spectral Counting Results-Scaffold
Conditions
Bio-Replicates
P-Value
# of Spectra

Spectral Counting Results-Scaffold

Spectral Counting Results-Scaffold

Spectral Counting Results

emPAI = 10PAI -1 Protein content (mol %) = emPAI/ ∑ (emPAI) x 100
Protein name Conc.
Fmol
emPAI
Protein Content RankConc. emPAI Conc. emPA
IElongation factor 1-a 1 870 9.00 15.04 16.18 2 1a enolase 596 6.50 10.30 11.69 3 2Heat shock protein HSP 90-a 940 6.26 16.25 11.26 1 3Vimentin 336 5.58 5.81 10.03 6 414-3-3 protein 381 4.62 6.58 8.31 5 540 S ribosomal protein S16 456 2.98 7.88 5.36 4 6Pyruvate kinase, M2 isozyme 216 2.06 3.73 3.70 9 740 S ribosomal protein S9 135 1.89 2.33 3.40 12 8GTP-binding nuclear protein RAN 255 1.85 4.41 3.33 8 9ADP, ATP carrier protein, fibroblast isoform
264 1.64 4.56 2.95 7 10
Peripherin 84 1.48 1.45 2.66 18 11Stress-70 protein, mitochondrial precursor
195 1.42 3.37 2.55 11 12
Fructose-bisphosphate aldolase A 210 1.15 3.63 2.07 10 13IgE-binding protein 122 1.15 2.11 2.07 13 14Calreticulin precursor 114 1.15 1.97 2.07 14 1560 S ribosomal protein L11 108 1.15 1.87 2.07 15 1660 S ribosomal protein L17 90 1.00 1.56 1.80 17 17Peroxiredoxin 4 72 0.85 1.24 1.53 20 18Voltage-dependent anion-selective channel protein
54 0.85 0.93 1.53 21 19
T-complex protein 1, e subunit 96 0.81 1.66 1.46 16 20ATP synthase oligomycin sensitivity conferral protein
78 0.70 1.35 1.26 19 21
Phosphate carrier protein, mitochondrial precursor
48 0.55 0.83 0.99 22 22
T-complex protein 1, a subunit B 36 0.52 0.62 0.94 23 23Nucleolar RNA helicase II 30 0.45 0.52 0.81 24 24
Relative Quantitation Using emPAI
Ishihama Y1, Oda Y, Tabata T, Sato T, Nagasu T, Rappsilber J, Mann M. Exponentially modified protein abundance index (emPAI) for estimation of absolute protein amount in proteomics by the number of sequenced peptides per protein.Mol Cell Proteomics. 2005 Sep;4(9):1265-72

Relative Quantitation of PTM Using Peak Area
RT: 19.96 - 50.19 SM: 7B
20 22 24 26 28 30 32 34 36 38 40 42 44 46 48 50Time (min)
0
10
20
30
40
50
60
70
80
90
100
0
10
20
30
40
50
60
70
80
90
100
Rel
ativ
e Abu
ndan
ce
RT: 31.46AA: 6948813009
RT: 36.22AA: 12379095
RT: 33.66AA: 3238508
RT: 41.54AA: 3445463
RT: 44.32AA: 3944626
RT: 48.01AA: 2336711
RT: 39.67AA: 66098364
RT: 42.77AA: 41752420
RT: 38.84AA: 31864608
RT: 33.82AA: 596224
RT: 35.79AA: 304562
RT: 31.35AA: 126488
RT: 45.02AA: 90790
RT: 49.46AA: 72789
NL: 1.75E8Base Peak m/z= 514.7983-514.8189 F: FTMS + c ESI Full ms [350.00-2000.00] MS ICIS 30138_TRY
NL: 2.39E6Base Peak m/z= 535.8032-535.8246 F: FTMS + c ESI Full ms [350.00-2000.00] MS ICIS 30138_TRY
Sequence m/z Mass Error
Peak Area RT (min)
Total Peak Area
Percentage (%)Theoretical Observed
115GELLEAIKR123 514.80862+ 514.80632+ ‐4.47 6948813009 31.46 99.40
115GELLEAIK(Ace)R123 535.81392+ 535.81362+ ‐0.56 41739255 42.77 6.99E+09 0.60
115GELLEAIKR123
115GELLEAIK(Ac)R123
(Based on Retention Time and SIC)

MALDI Imaging
Image from 2014 ASMS Workshop
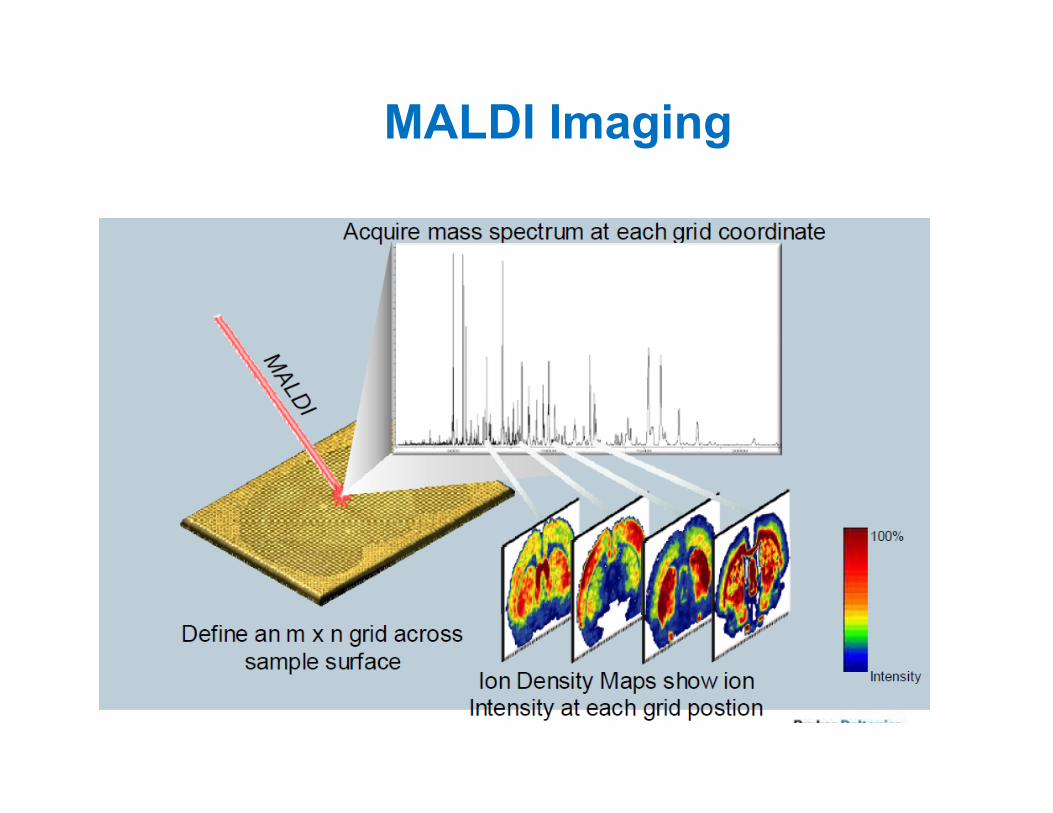
MALDI Imaging

Laser Capture Microdissection Proteomics
50 60 70 80 90 100 110 120 130 140 150 160 170 180 190 200 21Time (min)
0
10
20
30
40
50
60
70
80
0
10
20
30
40
50
60
70
80
Rel
ativ
e A
bund
ance
0
10
20
30
40
50
60
70
80172.3651.09 74.43
147.2873.4659.81
83.0067.5146.9484.43
125.6190.98 98.24102.59 154.41135.68
107.81 113.21 129.55 156.09140.88 161.85121.24 203.90186.96 193.16175.36
96.3074.03
72.89 97.42 164.8778.17 82.2072.6559.3690.1855.88 185.19123.9166.13 128.35
101.89153.68113.47 188.09 199.8052.73
50.86 130.21 163.13141.80 195.09178.09 208.48120.3046.39
146.51 171.8573.23 171.2978.49
97.0378.6667.29
56.18 59.48 82.84 85.96 128.6398.06 185.93113.7690.37168.18124.41 189.02 200.9953.11 153.97105.4151.41
124.14 135.09 155.6747.08 210.16184.39 200.06120.75

�Thermo LTQ Orbitrap�Bruker ultrafleXtreme MALDI-TOF TOF�Thermo Scientific LTQ�Bruker maXis UHR QTOF�Bruker amaZon ion trap with ETD�Ettan Spot Handling Workstation�Thermo Trace GC-MS�Thermo DSQ II GC-MS�Micromass Q-TOF II�FPLC System
Facility Instruments

![A Review on Quantitative Multiplexed Proteomics...A Review on Quantitative Multiplexed Proteomics Nishant Pappireddi, [a, b] ... Protein Identification and Quantification in Mass Spectrometry-Based](https://img.dokumen.tips/doc/110x75/5e7f3f3acedae249de4f489a/a-review-on-quantitative-multiplexed-proteomics-a-review-on-quantitative-multiplexed.jpg)