Embed Size (px)
Citation preview

‐ 1 ‐
MaRMot, a tool for experimental MRM transitions design from Mascot repository
Master of Bioinformatics and Proteomics
Samuel Croset
Project supervisor: Willy Bienvenut
October 2009 – May 2010

‐ 3 ‐
Summary
Summary ....................................................................................................................................................... 3
Abbreviations............................................................................................................................................- 5 -
Introduction................................................................................................................................................... 7
Software implementation and workflow..................................................................................................... 11
a- Mascot archives bank.................................................................................................................... 111
b- MaRMot bank and related index................................................................................................... 111
c- Protein query and peptides filtering ................................................................................................ 12
d- Peptide clustering............................................................................................................................ 12
e- Peptides ranking.............................................................................................................................. 13
f- Peptides consensus spectrum and fragments identification. ........................................................... 13
g- MRM transition selection................................................................................................................ 15
h- Graphical interface: Input, output and export forms....................................................................... 15
Discussion ................................................................................................................................................... 19
a- Mascot peptide validation and MaRMot bank creation .................................................................. 19
b- Clusterization of homologous MS/MS spectra ............................................................................... 20
c- Precursor peptide scoring................................................................................................................ 22
d- Transition selection......................................................................................................................... 29
e- Export of the transition list and the Consensus Spectrum............................................................... 30
f- Further configuration ...................................................................................................................... 31
Conclusion .................................................................................................................................................. 33
References................................................................................................................................................... 34


‐ ‐ 5 ‐ ‐
Abbreviations
AC: Protein Accession Number
CID: Collision Induced Dissociation cell
CS: Consensus Spectrum
DB: Database
FPF: Fragmented Peptide Fingerprint
GAPP: Genome Annotating Proteomic Pipeline
QqQ: Triple quadrupole
Q1: First Quadrupole
Q3: Third Quadrupole
QS: Q STARTM
QT: Q TRAPTM
MGF: Mascot Generic Format
MRM: Multiple Reaction Monitoring
SRM: Single Reaction Monitoring
TPP: Trans-Proteomic-Project

‐ 7 ‐
Introduction
Nowadays, biologists need techniques to quantify several proteins simultaneously particularly
for biomarkers validation. The current trend is to combine multiple biomarkers for increasing the
specificity and accuracy of the diagnostic 1. Biomarkers are traditionally validated through
immunoassays e.g., ELISA or dipstick 2-4. However, production of antibodies is time and cost
consuming and may not be suitable for multiple screening. This observation has leaded to use
mass-spectrometry for biomarkers validation. Indeed, mass-spectrometry is one of the main
platform for biomarkers discovery 1. This technique has proven to be suitable for relative protein
quantification, with stable isotope, where samples with different labelling can be compared. The
inclusion of an internal standard allows also an absolute quantification 5, 6.
Single Reaction Monitoring (SRM) or as an extension Multiple Reaction Monitoring (MRM) are
mass-spectrometry approaches for relative quantification and this technique has been employed
for over 30 years for small molecules 7, 8. More recently, it has been successfully applied to
protein/peptide quantification 9, 10. Triple quadrupole (QqQ) mass spectrometers are now more
sensitive and have a mass-range suitable for peptide analysis such as the Q TRAP™ 4000 (AB
Sciex Concorde, ON) 11 or the Xevo TQ MS™ (Waters, Milford, Ma) can undertake MRM with
peptides.
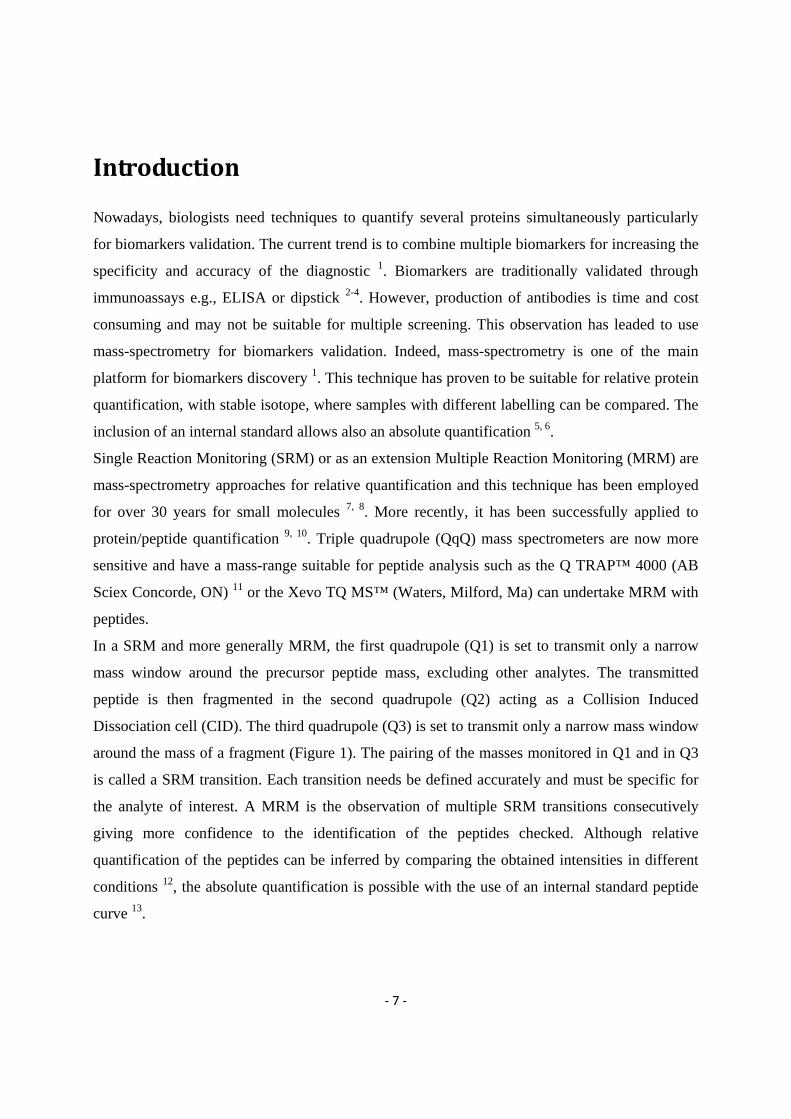
In a SRM and more generally MRM, the first quadrupole (Q1) is set to transmit only a narrow
mass window around the precursor peptide mass, excluding other analytes. The transmitted
peptide is then fragmented in the second quadrupole (Q2) acting as a Collision Induced
Dissociation cell (CID). The third quadrupole (Q3) is set to transmit only a narrow mass window
around the mass of a fragment (Figure 1). The pairing of the masses monitored in Q1 and in Q3
is called a SRM transition. Each transition needs be defined accurately and must be specific for
the analyte of interest. A MRM is the observation of multiple SRM transitions consecutively
giving more confidence to the identification of the peptides checked. Although relative
quantification of the peptides can be inferred by comparing the obtained intensities in different
conditions 12, the absolute quantification is possible with the use of an internal standard peptide
curve 13.

‐ 8 ‐
Figure 1: Schematic representation adapted from Kitteringham et al. 1 of a single reaction monitoring (SRM). The precursor peptide is selected by the first quadrupole (Q1). This peptide is then fragmented by the collision induced dissociation cell (Q2). One of the fragments is selected by the third quadrupole (Q3). The relative quantification is
based n the number of counts recorded by the detector for the monitored transition.
One of the critical stages in MRM experiments design is the choice of the transitions monitored.
A precursor peptide needs first to be carefully selected, with one or more associated fragments
i.e., the precursor peptide selected should not have any miscleavages and should have an
observable size within mass range of the instrument. To overcome false positive results, the
selected peptide should also uniquely match the sequence of the protein of interest. This
characteristic is referred as proteotypicity14, 15. Furthermore, the precursor should not carry PTM
or chemical modifications e.g., methionine oxydation, phosphorylation 16, 17 or acetylation 18,
unless it is the aim of the experiment. Selection of these transitions is the bottleneck of the MRM
experiments. Indeed, each of them needs to be carefully chosen for a maximal sensitivity.
Several tools have been developed to help picking up reliable transitions. Some of them, such as
MRMaid 19 or TIQUAM 14 are based on the observation of real data coming from public
repositories. This empirical approach is combined with general knowledge on MRM to predict
putative transitions and the precursors are selected according to their sequences helped with a
scoring algorithm. Fragments are deduced from experimental MS/MS spectra. MRMaid uses The
Genome Annotating Proteomic Pipeline 20 (GAPP) whereas TIQUAM mines PeptideAtlas 21.
However, the material available in these freely available databases is not always pertinent. The
type of instrument and experimental conditions can differ from the various laboratories they have
been acquired impairing an easy prediction of the transitions required for the task. Commercially
available software’s such as MRM PilotTM (AB Sciex), QuanOptimiseTM (Waters), SRM
WorkflowTM (Thermo-Fisher), MassHunter OptimiserTM (Agilent) and MIDASTM 22 predict in
silico peptides and fragments. A supplementary experimental validation stage is then mandatory.
‐ 9 ‐
Indeed, theoretical peptides must be assessed through a succession of MS scans on the in-house
instrument. The final transition list should fit observable peptides, but a verification stage is then
time consuming. The observed peptides have not been extensively characterized and are thus not
necessarily the best to monitor.
Local data accumulated throughout the years are a more reliable starting material for the design
of MRM transitions as they have been generated locally in regards to instrumentation and sample
processing protocols. This idea is used by MaRiMba 23, a software which has been developed for
the Trans-Proteomic-Project (TPP) that can exploits and ranks personal spectral libraries (*.msp
file) to predict MRM transitions. This strategy bypasses a laboratory validation stage and gives
confident transitions. Since our laboratory is not using the TPP but only the Mascot software 24 25
for protein identification the basis of this project is to develop a tool able to use Mascot
repository data for the identification of relevant and experimental MRM transition. The Mascot
repository contains all the searches made by the user throughout the years. Proteins are
potentially present several times in the archive, associated with different set of peptides used to
infer their identification. Some of these peptides are identical from one experiment to another
and the expected redundancy is use as a valuable factor to define precursors for MRM
transitions. The best ion fragments to monitor are deduced from MS/MS spectra recovered from
this archive. Then, MaRMot is a new tool dedicated to data-mine Mascot repository to identify
and to rank MRM transitions for a protein.

‐ 11 ‐
Software implementation and workflow
a Mascot archives bank
Data used as source material for the determination of experimental MRM transitions is based on
the archives stored in our on-site Mascot server. These data are related to analyses performed by
the Proteomics facility at the Beatson Institute for Cancer Research (Glasgow UK) for the last 4
years. It contains more than 17000 searches worth 168 Go of data storage. Samples were mainly
related to H. sapiens, E. coli, Rodents (M. musculus and R. norvegicus), G. gallus, D.
discoideum, A. thaliana, C. reinhardtii. Most of the data were acquired with ESI-MS/MS
instruments (Q-Trap 4000 and Q-Star XL instruments; ABi, Concorde ON) despite few
sample/data could have been related to external sources and then alternative instruments and
preparation. Commonly available databases (DB) such UniProtKB/Swiss-Prot, NCBInr have
been used for searches. Some home-made DB containing redesigned protein sequences
developed internally have also been queried. These specific sequences have an internally defined
protein accession number (AC) based on the UniProtKB/Swiss-Prot identification system.
b MaRMot bank and related index
The previously described Mascot archives are parsed to first create a more restricted bank
(MaRMot bank) used later to determine the MRM transitions. To populate the MaRMot bank,
we developed a series of dedicated Perl and Linux Shell scripts involving Mascot Parser (Ver.
2.2.6, Matrix Science UK) to retrieve the information from the Mascot archives (*.dat files).
Only the proteins and peptides validated above a user defined threshold i.e., Mascot peptide
score higher than 20 and a p-value below 0.05 by default, are integrated in the MaRMot bank.
For each *.dat file, all proteins identified are saved with their associated list of matched peptides.
Each of these peptides are retrieved with their associated sequence, chemical modifications,
charge, Mascot titles, experimental and theoretical masses, Mascot peptide score and name of the
DB where they have been identified. Their MS/MS spectra are also stored using the Mascot
Generic Format (MGF) i.e., “a list of pairs of mass and intensity values” 26. Finally, these

‐ 12 ‐
recovered data are treated with a Perl script able to create an index of protein ACs listed in the
MaRMot bank. Both the MaRMot bank and its index are updated weekly to include new results
in it. At the present time, our index includes over 96000 protein AC.
c Protein query and peptides filtering
The AC of the protein of interest is entered by the user to determine MRM transition couples.
Data related to this protein are retrieved from the MaRMot bank. Multiple copies of the same
peptide related to the dame raw source can be present among the data retrieved. This artefact is
mainly due to multiple searches of the same original experimental data (*.mgf file). To remove
them, a scrip checks peptides title, sequence and chemical modifications. In case of complete
similarity only one entry is retained over the few identical ones. Furthermore, some entries are
also homologous mainly due to recalibration procedure. They are only different by their peptides
title, assigned before Mascot search step. These cases are not detected by the previous filter. In
consequence, a second one has been defined to discards entries having the same amino-acid
sequence, same number of peaks in their MS/MS spectrum and the same Mascot score rounded
at two decimals. Spectra fitting these criteria are considered as a redundant entry and are thus
removed to retain a final single one. Since few instruments are used in the facility i.e., Q
STARTM (QS) and Q TRAPTM (QT), and this information is included in the peptide’s title, we
decided to add an instrument-specific filter based on the title. An empty field will considered all
data indistinctively of the instrument type.
d Peptide clustering
Peptides of selected protein having successfully passed through these filters and showing the
same sequence, chemical modifications and charge state are grouped together in classes defined
as “Fragmented Peptide Fingerprint” (FPF). Each FPF includes at least one to several thousand
MS/MS spectra harvested all over Mascot archives e.g., 4069 MS/MS spectra for the peptide
SLDLDSIIAEVK (charge state of 2+ and no chemical modification) related to the keratin
K2C1_HUMAN (UniProtKB/Swiss-Prot AC: P04264).
‐ 13 ‐
e Peptides ranking
To determine the proteotypicity15, 27 of the listed peptide, the taxonomy of the protein of interest
is required and harvested from UniProtKB/Swiss-Prot. If the protein AC is not found in this DB
e.g. internally defined protein sequence, the taxonomy field is left empty and all species will be
investigated for that task.
All FPF classes are ranked to display their quality to sort out the best MRM precursor candidate
for the defined protein. The score is determined by the product (Equation 2) of six coefficients
representing:
- (A) The amino-acid’s sequence composition and modifications present on the FPF (Table 1 and
2, Equation 3),
- (B) The Mascot score of peptides present in the FPF (Equation 4),
- (C) The presence of a miscleavage in the FPF sequence (Table 3),
- (D) The charge of the FPF (Table 4),
- (E) The FPF frequency among all experiments
- (F) The proteotypicity of the FPF sequence for the taxonomy studied (Table 5).
f Peptides consensus spectrum and fragments identification.
It is commonly accepted that peptides with same sequence, charge and modification (FPF) give
very similar MS/MS. Thus, all spectra from a single FPF are merged together. This “spectral
alignment” is treated with a sliding window approach over the m/z axis leading to a final
consensus spectrum (CS, Figure 2). The width of the sliding window is defined depending of the
instrument e.g., 0.1 Da for Q-Star data and 0.2 Da for Q-Trap data. The window is moving with a

‐ 14 ‐
step equal to one-fifth of its width. For each step the intensities of all peaks inside the window
are summed and the corresponding intensity is attributed to the midpoint. This process is
repeated until the entire spectrum is covered. The resulting spectrum is smoothed using a
derivative function to retrieve only the highest points of the intensity distribution (Figure 2b).
Masses with intensity higher than 1% of the most intense peak are compared to the in-silico
generated masses of theoretical ion series. Masses within 0.1 Da error range are labelled with
their corresponding ion type limited to yn+, bn
+, yn++ and bn
++ series.
Figure 2: Scheme of the process to generate the Consensus spectrum: a) The individual spectrum of 3 peptides are merged together. The peak A corresponds to the signal of a fragment. The other peaks are related to noise signal. b)
the sliding window is applied over the m/z axis of the spectrum A. c) Consensus spectrum: spectrum (b) is treated with a derivative function to retrieve only the highest point of each distribution to clusterize the spectra. The peak A
has an improved signal over noise ratio compared to the original spectra.

‐ 15 ‐
g MRM transition selection
Relevant fragment to define a MRM couple are determined from the consensus spectrum. No
fragment masses below the m/z of b2 or y2 ions are considered and three possible MRM
transition per FPF are reported in the final result. Thus, the mass of the most intense labelled
fragment peak of the spectrum is selected by default. If its m/z value is below the parent ion
mass and its most common artefacts e.g., dehydrated by-product, the two highest peaks with
masses larger than the precursor ion will also be included. In the other case, the three most
intense fragment peaks larger than the precursor ion are considered.
h Graphical interface: Input, output and export forms
Figure 3: Result table generated by MaRMot for the protein Q96C19 (Swiprosin-1 ). The columns contain: A) A check box for the export of the consensus spectrum in MGF. B) The sequence of the peptide, chemical modifications are underlined. The characters of the sequence are a link to the consensus spectrum for the peptide (Figures 4 and
5). C) The name of the modifications found in the peptide D) The proteotypicity of the peptide E) The theoretical and the experimental mean mass of the peptide F) The number of miscleavages in the sequence G) the charge state of the
peptide H) the number of identical peptides found in all previous experiments I) The final score for the peptide J) The list of selected transitions by MaRMot

‐ 16 ‐
Figure 4: Part of the Consensus Spectrum for the peptide LSEIDVSSEGVK (AC: Q96C19). Peaks are labeled with
their corresponding ion (y+, y2+, b+ and y2+).
The MaRMot input form requesting a protein AC to investigate is written in Perl. After data
processing, the suggested transitions are outputted with peptide sequences, and the proposed
transitions (Figure 3). The first line of the output table (light blue) is related to the top scored
FPF. The following white rows show the FPFs sharing the same peptide sequence as the first
FPF but subject to different chemical modifications or ion charges. The consensus peptide
MS/MS spectrum is accessible through an interactive link on the peptide sequence (Figures 4 and
5). This scheme is repeated up to the last non-redundant peptide sequence. On the extreme left
side of the result table, an interactive box can be checked. Then, the peaks list of the selected
peptide(s) is (are) exported as a MGF file. On the main table, the checked transitions can be
exported as a *.csv file and directly used by the software controlling the MRM acquisition.

‐ 17 ‐
Figure 5: Table containing the theoretical ion masses. Fragments matched on the spectrum are in bold red, with the
relative intensity of the peak in parentheses. This relative intensity corresponds to the percentage of the maximum intensity of the spectrum.


‐ 19 ‐
Discussion
MRM is a MS technique for measuring the relative quantity of one or more proteins at the same
time. To determine the abundance of a protein, a triple quadrupole is set to monitor only a list of
pre-defined and specific transitions. The determination of this list is the most important and
crucial step of a MRM experiment. These transitions could be predicted in silico by calculating
theoretical peptides and fragments or, empirically by exploiting previous experimental data. The
second approach is the closest to the laboratory reality and can avoid to the user an experimental
validation stage of the selected transitions. We have used this strategy with MaRMot by mining
the data repository of Mascot, a well-known tool for protein identification. This information
present in Mascot archives comes from previous local experiments done by the user. These data
are complemented with empirical and advance knowledge on the selection of interesting
precursors and associated fragments.
a Mascot peptide validation and MaRMot bank creation
To design MRM transitions, MaRMot first parses and retrieves the information from the Mascot
repository. A MaRMot bank is created this way and is used later to identify suitable MRM
transitions. The Mascot archives used to populate the MaRMot bank is composed of *.dat files.
However, the reported list of peptides coming from a saved *.dat file is not a directly usable
material. Indeed, Mascot uses a statistical approach to identify peptides and proteins in a given
DB. Some of these identified peptides and/or proteins have a low probabilistic score are most
likely false positive. The significance threshold and the peptide score are the two parameters
which can be adjusted to skim the most likely false positive match out of this list. The remaining
peptides and proteins matches are then included in the MaRMot bank.
Mascot score related to peptide MS/MS is based on a probability calculation. This value i.e., P, is
calculated considering the match of the peptide in the DB is a random event. P depends on the

‐ 20 ‐
significance threshold and on the size of the DB searched 24, 28. The Mascot score for each
peptide is derived from this probability value (Equation 1).
Equation 1: Equation used for the calculation of the Mascot score from the absolute probability that consider the
match of the peptide with the DB as a random event
Mascot Score = -10 x log (P)
So the higher the score is, the more confident the peptide has been characterised. This score is
used as a threshold while retrieving the information from Mascot to populate the MaRMot bank.
Our experience shows that a threshold of twenty removes most of the potent false positive
matches and prevents the loss of too many true positive. Applying this value to extract data from
the *.dat files should gives an acceptable confidence level of the data imported in the MaRMot
bank. A higher cut-off could be used to improve the quality of the data available in this bank,
used later for the identification of the most relevant MRM transition. However, a too strict
threshold can excludes some proteins and peptides with low scores that could still have an
interest in MRM transitions determination e.g., poorly characterized proteins in previous
experiments, or proteins with chemical modifications such as phosphorylation. The user as the
possibility to change in the configuration file the peptide score cut-off and the significance value
and then define the level of confident he wants for the MaRMot bank.
b Clusterization of homologous MS/MS spectra
As previously described, MaRMot bank contains a large number of MS/MS spectra. Although
the theoretical number of endoproteotytic peptide sequence is limited for the selected protein,
this number could expends tremendously due to co- or post-translational modification or various
charge states for the same peptide sequence. Some of these experimental peptides could be
present one to several times in the MaRMot bank. Then, they could be related to few MS/MS
spectra to thousands of occurrences. The selection of the best MS/MS spectra could be an option
but this approach would loose most of the experimental data available. The idea of the

‐ 21 ‐
Figure 6: Impact of sliding window on a low intensity signal: 1) Merged MS/MS spectra of 2604 peptides from P60709 (Actin cytoplasmic) 2) Consensus spectrum obtained after treatment of the spectrum (1) with the sliding
window and the derivative function. The intensity of the peaks A and C strongly decreases after treatment, as these peaks do not correspond to a fragment and have been seen only in few experiments. Peaks below B are noise and
are almost removed after the treatment. The peak D corresponds to a fragment and is consolidated and clearly rises from the spectra.
clusterization approach is to valorise all of this experimental information and use it later for the
identification of the best possible transition. Indeed, the spectra accumulation approach is well
known to improve signal over noise ratio and to decrease spectrum to spectrum peak variability.
Peptides with similar charge state, sequence and chemical modifications have the same m/z and
produce very similar MS/MS spectrum. Thus, these spectra are grouped together in a sub-set so
called “Fragmented Peptide Fingerprint” (FPF). The MS/MS spectra of the peptides in a FPF
will be use to produce one unique consensus MS/MS spectrum which is analyzed in fine to
determine MRM transitions. The consensus spectrum is obtained by merging all the MS/MS
spectra of one FPF followed by data treatment to remove data redundancy. First, summed
MS/MS spectra are treated with a sliding window approach to help to remove the noise and
emphasizes the real fragments. Indeed, the noise on a MS/MS spectrum is distributed randomly,
whereas peaks corresponding to real fragments are supposed to be at the same m/z. In practice,
due to the error of the instrument, the experimental m/z is distributed around the theoretical
mass. The sliding window enhances fragment peak intensities and averages the noise while

‐ 22 ‐
covering the merged spectra. Since MRM transitions are strongly related to the precursor and
fragment intensity, this approach has also the advantage to identify more robust transitions
couples (see Figure 6).
c Precursor peptide scoring
Depending of the protein, few to hundreds of peptides could be related to a single protein entry.
All of these peptides are not equivalent and some of them are more suitable to satisfy MRM
requirements. A few parameters are used to score and rank peptides from the most effective one
to the less for the identification of MRM transitions. These parameters are:
- The frequency that a peptide is identified all over the Mascot repository. Indeed, the more
frequently a peptide is identified in the repository, the most likely it would be visible in the
future analysed.
- Proteotypicity of the peptide; to avoid bias in the quantification, the peptide sequence shall
be proteotypic to the protein selected.
- The quality of the MS/MS spectrum obtained from the peptide; Peptides with a
fragmentation pattern close to the theoretical one, with high intensity signals and a low
noise level are better candidates for MRM transitions.
- Presence of miscleavages; as miscleaved peptides are less reproducible, it is better to use
sequences correctly cut by the Trypsin.
These parameters are used to score and sort out the most relevant peptides for the identification
of the MRM precursor mass of a selected protein. In consequence, each FPF is characterized by a
score (Equation 2), composed by the product of 6 coefficients representing the properties
introduced before and balanced to fit datasets of any size.
‐ 23 ‐
Equation 2: Calculation of the score for a FPF. The calculation of coefficients is detailed below.
Score (FPF) = A x B x C x D x E x F
Coefficient A - Sequence composition and chemical modification:
The detection and reliability of a peptide can be influenced by it sequence and the chemical
modifications present on it, as they change it physical properties. The peptide sequence has a
direct influence on their signal in ESI-MS analysis. Recently, a few studies highlight these
influences where some residues and/or associated physico-chemical properties are much more in
favour of the ionisation of the peptide whereas some others have detrimental effects 29 30 31. In
MRM experiments, a peptide precursor selected for the identification of a transition needs to be
clearly detected. Then, some sequences with favoured residues are therefore preferred. To
represent the influence of the peptide sequence in each FPF sub-set, each residue is balanced
with a positive number which can be either “1” related to a bad influence, “2” for no significant
influence or “3” for a positive influence. These values have been determine using recent
publication 30 and our own experimental knowledge (Table 1).
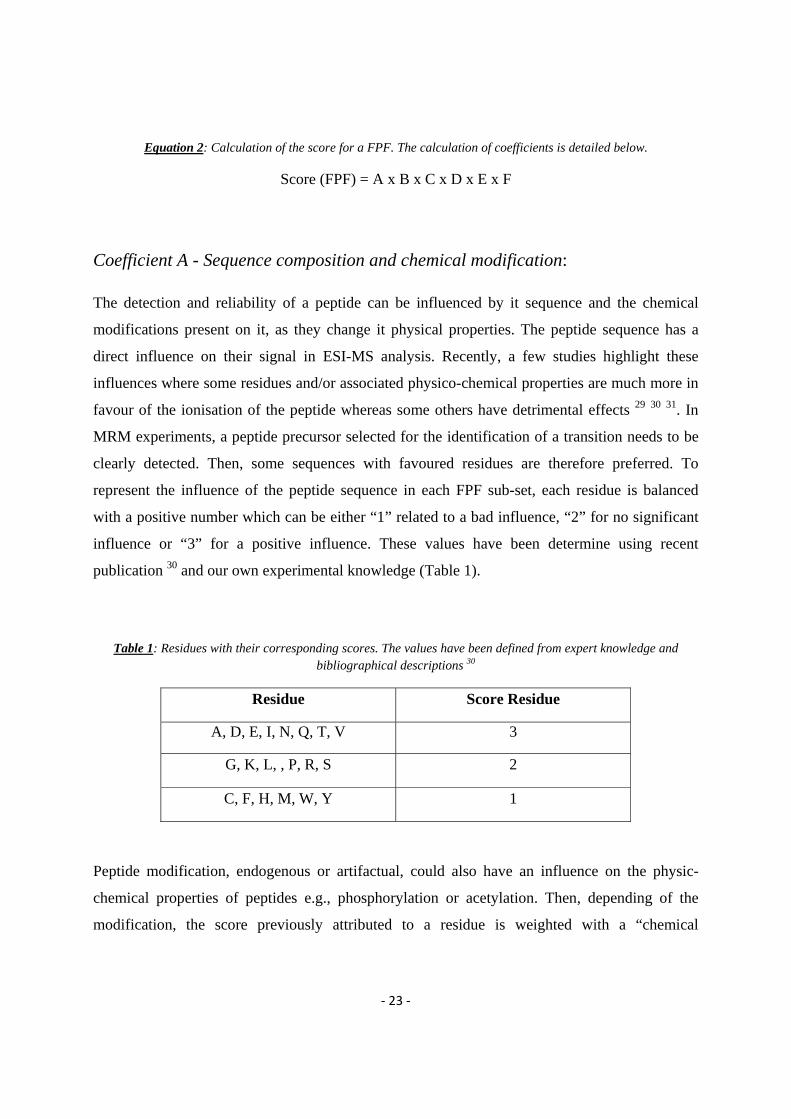
Table 1: Residues with their corresponding scores. The values have been defined from expert knowledge and bibliographical descriptions 30
Residue Score Residue
A, D, E, I, N, Q, T, V 3
G, K, L, , P, R, S 2
C, F, H, M, W, Y 1
Peptide modification, endogenous or artifactual, could also have an influence on the physic-
chemical properties of peptides e.g., phosphorylation or acetylation. Then, depending of the
modification, the score previously attributed to a residue is weighted with a “chemical
‐ 24 ‐
modification score”. These scores are defined according the search and the characterisation of
each modification (Table 2).
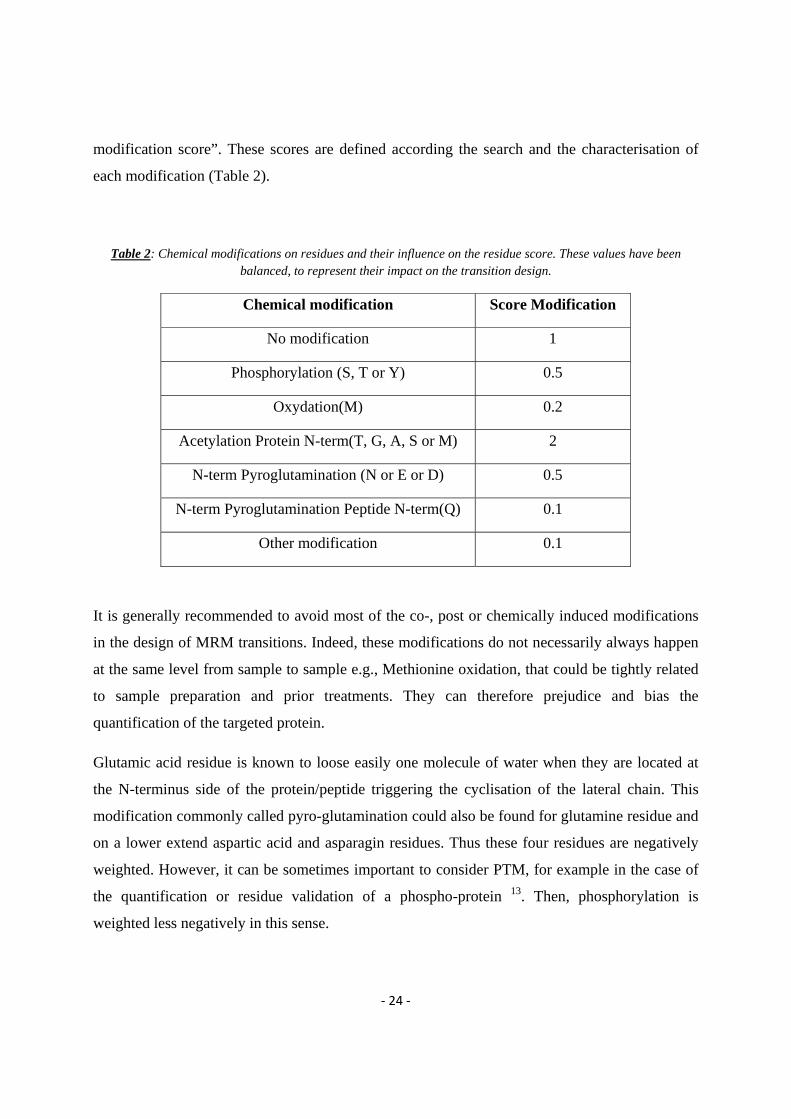
Table 2: Chemical modifications on residues and their influence on the residue score. These values have been balanced, to represent their impact on the transition design.
Chemical modification Score Modification
No modification 1
Phosphorylation (S, T or Y) 0.5
Oxydation(M) 0.2
Acetylation Protein N-term(T, G, A, S or M) 2
N-term Pyroglutamination (N or E or D) 0.5
N-term Pyroglutamination Peptide N-term(Q) 0.1
Other modification 0.1
It is generally recommended to avoid most of the co-, post or chemically induced modifications
in the design of MRM transitions. Indeed, these modifications do not necessarily always happen
at the same level from sample to sample e.g., Methionine oxidation, that could be tightly related
to sample preparation and prior treatments. They can therefore prejudice and bias the
quantification of the targeted protein.
Glutamic acid residue is known to loose easily one molecule of water when they are located at
the N-terminus side of the protein/peptide triggering the cyclisation of the lateral chain. This
modification commonly called pyro-glutamination could also be found for glutamine residue and
on a lower extend aspartic acid and asparagin residues. Thus these four residues are negatively
weighted. However, it can be sometimes important to consider PTM, for example in the case of
the quantification or residue validation of a phospho-protein 13. Then, phosphorylation is
weighted less negatively in this sense.

‐ 25 ‐
One modification i.e., N-terminal protein acetylation, is the only one to be positively weighted.
Indeed, from our experience, the acetylation of the N-terminus of a protein favours a clean
fragmentation and clearly reveals the yn and some of the bn ion series. Furthermore, protein
sequence at the N-term is especially discriminating for homologous protein 32, 33 that could be
highly valuable peptide to select for MRM experiments.
Finally, each residue score weighted by the associated modification are summed. To circumvent
the influence of the peptide length, the result is divided by the number of residues. The
calculation of the final score associated to the peptide sequence including its modification is
resumed in Equation 3. Coefficient A represents the ability of a peptide to be observed and
therefore suitable for the MRM transition. It has been defined to have a value superior than zero
but lower or equal to three.
Equation 3: Calculation of the coefficient to score the suitability of a peptide through its sequence (Coef. A); n is
the number of residue related to the scored peptide. The product of the residue score (RSi) and the modification
score (ModSi) is calculated for each residue (i). Finally, the average of these score gives the A value.
A = ∑=
n
in 1
1 Residue Score (RSi) x Modification Score (ModSi)
Coefficient B - Mascot’s peptide score:
The score attributed by Mascot reflects the probability (P) that the peptide has been correctly
identified. The higher the Mascot score is, the better chances the data from the MS/MS matches
correctly a defined sequence. It can be assesses as a MS/MS spectrum quality coefficient: spectra
with a good signal to noise ratio and clear fragments should have a higher Mascot score. These
two observations are crucial while choosing the precursors for MRM transitions. Then,
coefficient B reflects the Mascot score of all of the peptides present in a single FPF sub-set.
Since Mascot peptide score has a wide dynamic range starting i.e. 20 (selected threshold) up to
few hundreds, its contribution needs to be weighted in regards to other coefficients. First, the
final average Mascot score is divided by 10. Thus, a logarithm in base 2 is applied to condense
even more the range from 1 (neutral effect from threshold score equal to 20) to few units e.g.,
3.32 for a score of 100 (Equation 4).

‐ 26 ‐
Equation 4: Calculation of the Mascot scoring factor (Coef. B); “i" is the number of the peptide and MaSi the score
related to this peptide;
B = )10
1(log1
2 ∑=⋅
n
inMascot Score(MaSi)
Coefficient C – cleavage and missed cleavage:
Proteins are generally digested with the Trypsin before their bottom-up analysis by ESI-MS/MS 34, 35. Some peptides are irregularly cleaved due to change in parameters from in one experiment
to another e.g., the temperature or the ratio enzyme/sample. This phenomenon is not
reproducible and is affected by several factors e.g., the temperature. Therefore peptides with
missed cleavages may introduce a bias in the quantification due to the unspecific amount of
material related to peptide sharing part of the same sequence. Such peptides should be avoided in
the selection of the MRM precursors. The coefficient C takes in account the presence and
number of miscleavages in a FPF sequence. The presence of one miscleavage is strongly
penalized (Table 3). If more miscleavages are present, the FPF is not considered anymore for a
MRM transition and are set to zero. The final score of a FPF with a sequence fully cleaved by
trypsin is not influenced and the coefficient is set to one.
Table 3: Value of the Coefficient C according the number of miscleavages present in the FPF sequence.
Number of miscleavage(s) Value of coefficient C
0 1
1 0.2
> 1 0

‐ 27 ‐
Coefficient D - Charge of the precursor:
Tryptic peptides in electrospray analyses are usually multi-charged cations whereas singly
charged ions are mostly related to contaminant such as polyethylene glycols. Basically, one
charge is coming from the N-terminus part of the peptide and a second is related to the lateral
chain of the arginine or lysine residue present at the C-terminus. Due to various factors e.g., large
peptides or His containing peptides, higher charge state can be observed on tryptic peptides. An
average charge distribution would be 70-90% of doubly charged ions, 10-30% of triply charged
ions and a maximum of 1% for higher charged ions (data from different large data set i.e., more
than 10000 identified peptides on 3 different data set related to H. sapiens, D. discoideum and A.
thaliana samples).
Since the vast majority of the characterised MS/MS spectra are related to doubly charged
material and in contrast, triply charged precursors tend to produce more complex fragmentation
patterns increasing the risk of fale fragment assigment, doubly charged precursors are favoured.
Coefficient D which ponders the charge of the FPF is listed in Table 4: FPF with more charges
than three are rare and ignored while designing a MRM transitions. Since no proteic material is
expected on singly charged ions for ESI-MS/MS analyses, this precursor type is set to zero.
Table 4: Value of the Coefficient D according the charge state of the FPF
Charge state of the FPF Value of coefficient D
1 0
2 1
3 0.8
> 3 0.1
Coefficient E - Number of time the peptide has been observed:
While choosing MRM transitions, it is important to focus on precursors which are easily
observable. The number of time a peptide has been observed in previous experiments is a clear

‐ 28 ‐
indication of the “visibility level” compared to the other potential FPF related to a target protein.
The most frequently observed/matched peptides for a selected protein have better chances to be
observable during MRM analysis if this protein is present in the analysed mixture. The
coefficient E gives importance to peptides well characterized from previous experimentation.
The number of identification can vary from 1 to several thousands, depending on the protein
selected and the size of the repository. To decrease the dynamic range of this value and make it
comparable to the other coefficient, we applied the logarithm in base two to the peptide
frequency in each FPF. It still favoured FPF with huge number of identifications, but does not
hide FPF with a smaller number of peptides.
Coefficient F - Proteotypicity of the sequence:
The sequence of a peptide can be found in multiple proteins. For a MRM assay, unique precursor
sequences would be preferred. Due to protein homology, it is not always possible to distinguish
different proteins with a single peptide. A bias would be therefore introduced in the
quantification. This characteristic is known as peptide “proteotypicity”. Unfortunately, for some
highly homologous proteins e.g., actins, the access to proteotypic peptides could be challenging.
Thus, non proteotypic peptides are down-scored but, still listed in the final result table, giving the
user the option to select them otherwise.
To determine the proteotypicity for the related FPF sequence, MaRMot uses the
UniProtKB/Swiss-Prot bank as a reference. Beside the good quality of data in it, this bank
presents the advantage of a low redundancy for protein sequences 36: The false positive peptides
matched against identical protein sequences with different AC are prevented this way. The
proteotypicity is consequently more accurate. MaRMot determines the proteotypicity of a FPF
sequence restricted to the taxonomy of the protein studied to reduce the calculation time
required. However, it might sometimes introduce a bias if protein orthologs are considered. If the
taxonomy of the protein has not been determined, all species are considered for the search of
proteotypicity.
The coefficient E is linked to the proteotypicity of the FPF sequence. If this sequence is found
only in the protein selected, it is equal to one with no impact on the final score. Otherwise, if the

‐ 29 ‐
sequence is found in more than one protein, the FPF is strongly penalized (Table 5). Such FPF
are usually less suitable to be monitored but, listed in the final result table.
Table 5: Value of the coefficient F according the proteotypicity of the FPF sequence.
Match in Swiss Prot (taxonomy selective) Value of coefficient F
Only one (protein of interest) – Peptide proteotypic 1
More than one 0.1
d Transition selection
MRM transitions are defined by at least two m/z values i.e., the precursor ion mass and, one or
few fragment ion masses. The first one is determined once the selected precursor peptide is
chosen. In MaRMot, this value is related to the FPF classes which represent a strictly non-
redundant peptide sequence including charge and modification. The previous scoring description
should have revealed the most suitable precursor i.e., FPF class with higher calculated score, to
define the first value required in MRM transition couples.
The second m/z value is determined from the MS/MS spectrum of the selected precursor peptide.
MaRMot considers FPF classes rather than individual peptides. Indeed, each FPF class has one
to several thousand peptides in it and therefore the CS is much more representative than a single
MS/MS spectrum peaked for one of the peptide. The second mass of the transition couple is then
selected from CS.
MaRMot suggests up to three fragments to monitor for each FPF. Only peaks corresponding to
an identified ion i.e., yn+, yn
2+, bn+, bn
2+ are considered. These peaks are most likely to be specific
for the precursor peptide and give more confidence in the transition than the other non-matched
peaks. Two observations are critical in the choice of the fragment to monitor:
- First, fragments with high intensities are always preferred as they are easier to detect
and lead to a more accurate quantification.
‐ 30 ‐
- Second, the observation of m/z value of the fragment.
Since a MS/MS spectrum is noisier in the m/z range lower than the mass of the precursor, this
part of the spectrum is thus avoided if possible to identify relevant MRM transition. Moreover,
the largest mass between b2+ and/or y2
+ ion is used as the limit value. No fragments are selected
below these values to prevent false positives, coming from the internal peptide fragmentation.
According these considerations, MaRMot selects first the most intense fragment of the CS. The
m/z of this fragment could however be lower than the mass of the precursor e.g., fragments with
Proline give a very intense and useful peak, but can have a low m/z depending on the position of
the Proline in the peptide sequence. The two other m/z selected are the next most intense
fragments with m/z necessarily above the precursor value.
e Export of the transition list and the Consensus Spectrum
MaRMot displays the ranked precursor peptides with their transition in a table. For each protein,
the user is able to select one to a few precursor peptides (FPF) and up to three transitions for
each FPF. These MRM transitions values can be export as a *.csv file and used later to fill the
instrument method related to the acquisition of MRM experiments. The transitions have been
suggested directly from the experimental archive of the user. No more laboratory validation is
then necessary to assess that these transitions are observable.
MaRMot also features an extra tool for exporting the CS of one or more FPF. The CS is
outputted in the MGF format i.e., a list m/z with the corresponding intensity. It can be saved to
further analysis or verification, using Mascot or another peak identification software.

‐ 31 ‐
f Further configuration
As we have developed MaRMot with our local mass-spectrometers, the parameters for the
creation of the MaRMot bank and the CS have been optimized to our settings. They can be easily
changed in a configuration file, to fit the special requirements of any instrument or experiment
.


‐ 33 ‐
Conclusion
Determination of MRM transition is a challenging task and despite a few tools are available, it is
still difficult to use them successfully. Since Mascot identification is one of the most used search
engine, the idea was to use the experimental data available in our on-site Mascot repository to
mine the data available and to use them to identify experimentally base MRM transitions. Then,
we propose MaRMot as a tool dedicated to any user possessing a Mascot repository providing
probable MRM transitions from local data. The experimental data used as a starting material
gives a most reliable results, as they are specific to the basic laboratory practices e.g., sample
preparation protocol or instrumentation.
This approach uses the new concept of FPF combined with the CS to first, rank the precursors
and second, identify the best fragments to create the most successful MRM transition possible
from experimental data. Other tools available involve a lot of filter to set-up before the search for
MRM transition e.g., size of the precursor, charge states allowed, etc… MaRMot is more
straightforward and flexible: The discrimination is based on the scoring system and all peptides
are considered as potential candidate for a MRM transition. The score retrieves the best peptides
and allows the user to save time and choose the suitable transitions. Peptides with modifications
are also maintained in the final result, to suit the current trend in proteomics to study PTM.
Laboratory validation stage can be avoided as MaRMot identifies, more than predicts, suitable
peptides by comparison of tools such as Midas that predicts MRM transition in-silico.
Nevertheless, using local data imposes to have a consistent data repository, containing proteins
well-characterized in different experiments. It is also not possible to determine transitions for
proteins not previously identified in Mascot. Indeed, the bigger this repository is, the more
reliable are the results generated by MaRMot. The regular update of the MaRMot bank improves
the scope of our software over the years and experiments conducted. MaRMot is the ideal tool
for a long-time user of Mascot, who wants to quickly and easily implement robust MRM assays,
for biomarker validation or proteomics experiments for example.


‐ 35 ‐
References
1. Kitteringham, N.R., Jenkins, R.E., Lane, C.S., Elliott, V.L. & Park, B.K. Multiple reaction monitoring for quantitative biomarker analysis in proteomics and metabolomics. J Chromatogr B Analyt Technol Biomed Life Sci 877, 1229-1239 (2009).
2. Merrick, B.A. The plasma proteome, adductome and idiosyncratic toxicity in toxicoproteomics research. Brief Funct Genomic Proteomic 7, 35-49 (2008).
3. Aebersold, R. et al. Perspective: a program to improve protein biomarker discovery for cancer. J Proteome Res 4, 1104-1109 (2005).
4. Cho, W.C. OncomiRs: the discovery and progress of microRNAs in cancers. Mol Cancer 6, 60 (2007).
5. Jenkins, R.E. et al. Relative and absolute quantitative expression profiling of cytochromes P450 using isotope-coded affinity tags. Proteomics 6, 1934-1947 (2006).
6. Ong, S.E. et al. Stable isotope labeling by amino acids in cell culture, SILAC, as a simple and accurate approach to expression proteomics. Mol Cell Proteomics 1, 376-386 (2002).
7. Yao, M., Ma, L., Humphreys, W.G. & Zhu, M. Rapid screening and characterization of drug metabolites using a multiple ion monitoring-dependent MS/MS acquisition method on a hybrid triple quadrupole-linear ion trap mass spectrometer. J Mass Spectrom 43, 1364-1375 (2008).
8. Baty, J.D. & Robinson, P.R. Single and multiple ion recording techniques for the analysis of diphenylhydantoin and its major metabolite in plasma. Biomed Mass Spectrom 4, 36-41 (1977).
9. Stahl-Zeng, J. et al. High sensitivity detection of plasma proteins by multiple reaction monitoring of N-glycosites. Mol Cell Proteomics 6, 1809-1817 (2007).
10. Keshishian, H., Addona, T., Burgess, M., Kuhn, E. & Carr, S.A. Quantitative, multiplexed assays for low abundance proteins in plasma by targeted mass spectrometry and stable isotope dilution. Mol Cell Proteomics 6, 2212-2229 (2007).
11. Le Blanc, J.C. et al. Unique scanning capabilities of a new hybrid linear ion trap mass spectrometer (Q TRAP) used for high sensitivity proteomics applications. Proteomics 3, 859-869 (2003).
12. Kay, R.G., Gregory, B., Grace, P.B. & Pleasance, S. The application of ultra-performance liquid chromatography/tandem mass spectrometry to the detection and quantitation of apolipoproteins in human serum. Rapid Commun Mass Spectrom 21, 2585-2593 (2007).
13. Gerber, S.A., Rush, J., Stemman, O., Kirschner, M.W. & Gygi, S.P. Absolute quantification of proteins and phosphoproteins from cell lysates by tandem MS. Proc Natl Acad Sci U S A 100, 6940-6945 (2003).
14. Lange, V., Picotti, P., Domon, B. & Aebersold, R. Selected reaction monitoring for quantitative proteomics: a tutorial. Mol Syst Biol 4, 222 (2008).
15. Bertsch, A. et al. Optimal de novo Design of MRM Experiments for Rapid Assay Development in Targeted Proteomics. J Proteome Res.
16. Cox, D.M. et al. Multiple reaction monitoring as a method for identifying protein posttranslational modifications. J Biomol Tech 16, 83-90 (2005).
17. Ciccimaro, E., Hevko, J. & Blair, I.A. Analysis of phosphorylation sites on focal adhesion kinase using nanospray liquid chromatography/multiple reaction monitoring mass spectrometry. Rapid Commun Mass Spectrom 20, 3681-3692 (2006).
18. Griffiths, J.R. et al. The application of a hypothesis-driven strategy to the sensitive detection and location of acetylated lysine residues. J Am Soc Mass Spectrom 18, 1423-1428 (2007).
19. Mead, J.A. et al. MRMaid, the web-based tool for designing multiple reaction monitoring (MRM) transitions. Mol Cell Proteomics 8, 696-705 (2009).

‐ 36 ‐
20. Chem Mead, J.A., Bianco, L. & Bessant, C. Mining proteomic MS/MS data for MRM transitions. Methods Mol Biol 604, 187-199.
21. Desiere, F. et al. The PeptideAtlas project. Nucleic Acids Res 34, D655-658 (2006). 22. Unwin, R.D. et al. Multiple reaction monitoring to identify sites of protein phosphorylation with
high sensitivity. Mol Cell Proteomics 4, 1134-1144 (2005). 23. Sherwood, C.A. et al. MaRiMba: a software application for spectral library-based MRM
transition list assembly. J Proteome Res 8, 4396-4405 (2009). 24. Perkins, D.N., Pappin, D.J., Creasy, D.M. & Cottrell, J.S. Probability-based protein identification
by searching sequence databases using mass spectrometry data. Electrophoresis 20, 3551-3567 (1999).
25. Xu, C. & Ma, B. Software for computational peptide identification from MS-MS data. Drug Discov Today 11, 595-600 (2006).
26. http://www.matrixscience.com. 27. Lange, V. et al. Targeted quantitative analysis of Streptococcus pyogenes virulence factors by
multiple reaction monitoring. Mol Cell Proteomics 7, 1489-1500 (2008). 28. http://www.matrixscience.com/help/interpretation_help.html. 29. Sanders, W.S., Bridges, S.M., McCarthy, F.M., Nanduri, B. & Burgess, S.C. Prediction of
peptides observable by mass spectrometry applied at the experimental set level. BMC Bioinformatics 8 Suppl 7, S23 (2007).
30. Scherl, A. et al. Genome-specific gas-phase fractionation strategy for improved shotgun proteomic profiling of proteotypic peptides. Anal Chem 80, 1182-1191 (2008).
31. Fang, J., Dong, Y., Williams, T.D. & Lushington, G.H. Feature selection in validating mass spectrometry database search results. J Bioinform Comput Biol 6, 223-240 (2008).
32. Wilkins, M.R., Gasteiger, E., Sanchez, J.C., Appel, R.D. & Hochstrasser, D.F. Protein identification with sequence tags. Curr Biol 6, 1543-1544 (1996).
33. Wilkins, M.R. et al. Protein identification with N and C-terminal sequence tags in proteome projects. J Mol Biol 278, 599-608 (1998).
34. Bogdanov, B. & Smith, R.D. Proteomics by FTICR mass spectrometry: top down and bottom up. Mass Spectrom Rev 24, 168-200 (2005).
35. Wysocki, V.H., Resing, K.A., Zhang, Q. & Cheng, G. Mass spectrometry of peptides and proteins. Methods 35, 211-222 (2005).
36. The Universal Protein Resource (UniProt) in 2010. Nucleic Acids Res 38, D142-148.