Embed Size (px)
Citation preview

Markov Discrete Choice
Process for Dividend Policy
University of Naples �Federico II�
Department of Economics and Statistics
Author:
Claudio Chino
Supervisor:
Prof. Antonio Acconcia
Ph.D. Program in Economics - Cycle XXXI
Coordinator: Prof. Maria Gabriella Graziano
June 2019

ii

Contents
Abstract v
Acknowledgments vii
Introduction ix
1 Literature Review 1
1.1 The Irrelevance Proposition Theorems . . . . . . . . 21.1.1 Market Frictions . . . . . . . . . . . . . . . . 31.1.2 Miller and Modigliani's Theory: Criticism . . 6
1.2 Dividends and Taxation . . . . . . . . . . . . . . . . 71.3 Dividends and Asymmetric Information . . . . . . . 14
1.3.1 Signaling Theory . . . . . . . . . . . . . . . . 181.3.2 Agency Theory . . . . . . . . . . . . . . . . . 19
1.4 Dividends and Transaction Costs . . . . . . . . . . . 231.5 Pecking Order Theory . . . . . . . . . . . . . . . . . 251.6 Empirical Evidence . . . . . . . . . . . . . . . . . . . 26
1.6.1 Evidence on Aggregated Data . . . . . . . . . 271.6.2 Evidence on Firm-level Data . . . . . . . . . 28
1.7 Conclusion . . . . . . . . . . . . . . . . . . . . . . . 37
2 Dynamic Discrete Choice Model 39
2.1 Payout Policy Model . . . . . . . . . . . . . . . . . . 41
iii

CONTENTS
2.1.1 Three Periods without Uncertainty . . . . . . 412.1.2 Three Periods with Uncertainty . . . . . . . . 452.1.3 In�nite Horizon with Uncertainty . . . . . . . 47
2.2 MLE Estimation for DDC Model . . . . . . . . . . . 492.2.1 Speci�cation of Manager's Preferences . . . . 54
2.3 Estimation Analysis . . . . . . . . . . . . . . . . . . 572.3.1 The Sample Data . . . . . . . . . . . . . . . . 572.3.2 Estimation of the Manager's Beliefs . . . . . 592.3.3 Estimation of the Manger's Utility Function . 602.3.4 Dividend Policy with Multiple Options . . . . 63
3 Case Study: The ACE Tax Regime 67
3.1 Empirical Predictions of the Dividend Literature . . 683.2 The ACE Implementation in Italy . . . . . . . . . . 703.3 Econometric Models and Results . . . . . . . . . . . 723.4 Counterfactual Analysis of Tax Relief . . . . . . . . 91
Conclusion 97
Bibliography 99
iii

CONTENTS
iv

Abstract
This thesis aims to understand the dynamics underlying payout poli-cies for companies listed on the public stock exchange.
The dividend policy a�ects the liquid assets of companies bothdirectly, given the size of the dividend paid, and indirectly, a�ect-ing the ability of companies to attract sources of �nancing in theimmediate future.
The thesis proposes an optimal dividend payout model that de-scribes managers' behavior. Every year, managers have to choosewhether to change their payout policy (by increasing or decreasingdividends) or to maintain the level of dividends paid in the previousperiod. We assume that the dividend policy is based on observ-able state variables (earnings at the beginning of the period andpayout policy during the last period) and unobservable state vari-ables (con�icts between managers and shareholders/bondholders, id-iosyncratic risks and growth opportunities). We derive the optimaldividend policy from the solution of the stochastic discrete choicedynamic programming problem. The model depends on unknownprimitive parameters that regulate the expectations of managers onfuture values of state variables. The maximization of the utilityfunction provides the optimal strategy for the manager.
Using annual balance-sheet data for companies operating in theEuro area, we estimate the structural parameters of the model usinga nested �xed point algorithm, and we test whether managers choicesare consistent concerning the model predictions.
v

CONTENTS
vi

Acknowledgments
I would like to express my deep gratitude to my supervisor, Prof.Antonio Acconcia, for his continuous support and as a source ofinspiration.
I would like to thank Prof. Maria Gabriella Graziano for herinvaluable guidance during my Ph.D. studies.
I sincerely thank Prof. Massimo Aria, Prof. AntonioD'Ambrosio, Prof. Tommaso Oliviero, and Prof. Giovanni WalterPuopolo for their generous advice.
I would also like to thank the whole department of economicsat the University of Naples �Federico II�. I chose to take this path,knowing that I would �nd the ideal environment to train myself anddevelop my ideas. For this, I would like to thank all my colleagues;in particular, Dr. Francesco Caruso and Dr. Annamaria Fioriniello.
Finally, I want to thank my brother Dr. Marco Chino for hisvaluable help.
I dedicate the thesis to all my family and friends who have sup-ported me despite my many absences.
vii

CONTENTS
viii

Introduction
Periodically, the board of directors of listed companies, to �nancethe businesses, must choose between internal and external sourcesof �nancing.
The choice of the source inevitably has an impact on the dividendpolicy. Indeed, a company that chooses to �nance investment onlythrough internal fund would set dividends as a remaining part ofthe investment policy. On the other hand, a company that decidesto �nance its investments through external fund alone may freelytransfer net pro�ts to the shareholders.
The economic literature on corporate �nance has long been ques-tioning the actual costs and bene�ts of alternative sources of �nanc-ing and how the management of cash �ows a�ects the �rms' value.
Neoclassical economic theory provides valuable insights into thisspeci�c aspect of corporate �nance. Keynes (1934) assumes that amanager who wants to maximize shareholders' equity retains a levelof internal funds such that the marginal bene�t equals the marginalcost. Assuming perfect capital markets,1 Miller and Modigliani(1958) show that �nancing choices do not in�uence the companies'value; therefore the di�erent sources of �nancing are considered per-fect substitutes by the manager. Furthermore, Miller and Modigliani(1961) show that the decisions on dividend payments do not a�ect
1The perfect capital market hypothesis consists of a perfectly competitivemarket, with rational agents, without information asymmetries and frictionsgenerated by transaction costs, taxes and regulatory constraints.
ix

INTRODUCTION
the companies' valuation, because shareholders are indi�erent be-tween dividends and the cash held within the company increasingthe shares' value.
Their analysis is based on the perfect market hypothesis; how-ever, issues such as uncertainty about future cash �ows, taxation,agent's irrationality, market competition, and information asymme-tries determine the distance between neoclassical theory predictionsand empirical evidence on dividends (Cohen, 2002).
The objective of the thesis is to verify whether the managers'payout decision coincides with an optimal payment rule that deter-mines the dividend policy as a function of observable and unobserv-able state variables. We assume that managers, the decision-makers,employ the dividend policy to control agency con�ict and maximizetheir utility function.2 As a consequence, managers take sequen-tial decisions regarding the payment of dividends under uncertaintyabout future cash �ows.
By assuming the rationality of the agents, we de�ne the optimaldecision rule as the solution of the stochastic dynamic programmingdiscrete choice model.
The dynamic programming allows determining a procedure ableto calculate the optimal decision rule by breaking the problem intoa sequence of deterministic optimization problems. The features ofthis model enable us to measure what we consider the fundamentalfactors that a�ect the manager's payout choices: agency con�ictand sunk costs of dividend omissions. Arguably, the estimate ofthe impact of these costs on the manager's utility is necessary tode�ne how the conditional probability of paying dividends varies ifthe government wants to implement �scal policy, aimed to reducethe exposure of the economy to excessive corporate leverage, throughallowances on corporate debt.
2See Jensen and Meckling (1976) and Jensen (1986).
x

Chapter 1
Literature Review
The managers of companies with liquidity excess have to choosewhether to distribute the extra cash among shareholders (as a divi-dend payment or through share repurchases) or to keep it to �nancefuture projects.1
Several studies show that share prices temporarily change as aresult of changes in payout policy. Therefore, increasing the dividendlevel may increase �rms' market value. Moreover, several empiricalstudies show that investors interpret dividend cuts as bad news,causing a reduction in the �rms' market value. Hence, the managersmay choose to quit or scale down investment projects so as not tobe forced to cut dividends. However, both the e�ects in some casesare stable in others are temporary.
Over the years, di�erent theories and models have been devisedto analyze and explain:
1. the degree of substitutability among sources of �nancing;
2. the changes in the level of dividends in the di�erent periods;
3. the timing of dividends;
1Easterbrook (1984) and Jensen (1986).
1

CHAPTER 1. LITERATURE REVIEW
4. the degree of substitutability among payment methods toshareholders (i.e., the optimal mix between dividends andshare repurchases).
In the next sections, we examine the main theories and mod-els proposed in the literature, focusing primarily on Miller andModigliani (1958, 1961); then we investigate the �nancial marketimperfections that a�ect the assumption of market perfection andcompleteness (Acharya, Almeida, and Campello, 2007; Almeida,Campello, and Weisbach, 2004).
1.1 The Irrelevance Proposition Theo-
rems
Miller and Modigliani (1958) seek to establish how variations of thedebt to equity ratio a�ect the value of a company. They used forthe �rst time the political economy analytical tools (speci�cally, thestandard Fisherian framework with an in�nite time horizon) in theanalysis of corporate �nance issues. Miller and Modigliani elaboratea model of equilibrium assuming perfect competition with rationaland symmetrically informed agents. Moreover, they assume a worldwithout market frictions such as taxation, transaction costs, anduncertainty about future share prices.
Therefore, assuming a perfect capital market, Miller andModigliani demonstrate that the capital composition does not al-ter the value of the company; the irrelevance proposition theorem.It implies that the forms of �nancing (external and internal) areperfect substitutes, thus the companies have no bene�t in accumu-lating �nancial resources to �nance investment opportunities or todeal with future adverse shocks.
Modigliani and Miller (1963) extend the previous model by in-troducing a tax rate on corporate earnings. They show that thecompany can bene�t from external �nancing with the so-called taxshield. Moreover, they �nd that the advantage of external funding
2

1.1. THE IRRELEVANCE PROPOSITION THEOREMS
depends on the deductibility of interests paid on debt. Thus, thevalue of a company that has a debt will be higher than that of acompany totally equity �nanced by an amount equal to the presentvalue of the tax advantages. Consequently, one of the predictionsof this model is that there should be a substantial prevalence of so-called corner solutions. In other words, we should observe a largenumber of companies that �nance the major part of investments withdebt. Therefore, Miller e Modigliani demonstrate how the introduc-tion of a tax system a�ects the substitutability degree of externaland internal sources of �nancing.
Miller and Modigliani (1961) state the irrelevance of payout pol-icy on the company's value. The authors illustrate the possible con-sequences of a change in dividend policy through the famous home-made dividend hypothesis.
According to this hypothesis, in perfect �nancial markets, in-vestors are indi�erent between the return generated by dividendsand the expected return given by the growth of the share price. In-deed, if the manager chooses not to distribute pro�ts, the share priceshould increase proportionally given the extra-liquidity retained inthe company. The shareholders should be able to replicate the samereturn through the sale of an equal share of stock. Furthermore, themanager could pay a dividend higher than the free-cash �ow gen-erated by the company. In this case, the board would be forced toenhance external funds �lling the di�erence between the dividendand the free-cash �ow, not increasing the value of the company.
Therefore, Miller and Modigliani show that investors will not bewilling to pay a higher price for shares of a �rm that regularly payout dividends than shares of a company that does not. However, itis necessary that agents rationally assume that companies sooner orlater distribute the total value generated by their investments.
1.1.1 Market Frictions
Miller and Modigliani's theorems are a cornerstone for the evalua-tion of choices related to the capital structure and dividend policy
3
CHAPTER 1. LITERATURE REVIEW
of a company. However, the authors themselves are aware of thelimitations of their model. In their articles, they stress that the as-sumptions of the model are so stringent as to make the results ofirrelevance a benchmark for further analysis.
We present the main frictions that a�ect the market perfectionassumption:
1. Taxes. In the previous section, we have seen how the degreeof substitutability of sources of funding varies by introducingtaxation that a�ects the pro�ts of the company. However,Miller (1998) notes that US companies do not make the mostof the potential for leverage, burning around 150 billion peryear in taxes. Moreover, in the United States, Europe, andmany other countries, dividend income is taxed at a higher(personal) rate than the capital gains generated by investedcapital. Therefore, rational investors should prefer the capitalgains generated by buying and selling shares, particularly thoseinvestors who are already subject to high taxation (Foley etal., 2007).
2. Transaction costs. They are all costs that a company or in-vestor sustains in making any exchange. Choosing the �nancialsource, a company has to bear costs such as brokerage fees,sales commissions, legal expenses, and incidental expenses.Transaction costs are extremely high when an individual de-cides to liquidate an investment.2 Therefore, this kind of costchanges according to the economic sector in which the com-pany operates. The transaction cost can modify the debt andpayout policies, as well as the preferences of an investor.
3. Precautionary motives. Firms tend to prefer internal sourcesof �nance to cover unforeseen expenses or contingencies whosedevelopment is uncertain. In unstable and extremely volatile
2The liquidation of a machinery/equipment can be very di�cult for a �rmbecause it could be tough to �nd a buyer and so, the �rm could be obliged todepreciate its asset.
4

1.1. THE IRRELEVANCE PROPOSITION THEOREMS
economies, the frequency with which negative shocks occur forthe company is very high. Therefore, under the same condi-tions, companies operating in these economies need a greateravailability of liquid resources to counter unexpected drops insales, to take timely advantage of investment opportunitiesthat may arise suddenly, and in some cases to not be forced tochange the predetermined payout policy.
4. Financial constraints. Firms structurally accumulate liquid-ity when access to the credit market is limited. Speci�cally, acompany is de�ned as �nancially constrained when its accessto the capital market is more expensive than other �rms withthe same growth opportunities. Firms �nancially constrainedare, therefore, forced to manage liquidity in such a way asto maximize the value of the �rm and mitigate the highercost of external �nancing (Acharya, Almeida, and Campello,2007; Almeida, Campello, and Weisbach, 2004). Financialconstraints limit the ability of companies to both raise newcapital to �nance new investments and to obtain the liquid-ity necessary to meet programmed payout policies. In fact, ineconomies where capital markets are not e�cient, companieswill need more cash to �nance investments and not be forcedto give up projects with positive net present value (NPV ).Moreover, as mentioned, companies are reluctant to reducethe dividends paid to shareholders. Thus, if they do not havedirect access to the capital market would be forced to createreserves ad hoc.
5. Agency con�icts. The separation between ownership (share-holders) and management (managers) generates the agencycon�ict condition due to the asymmetric information. Themanager's need to withhold funds by taking advantage of in-vestment opportunities that, in some cases, can be consideredtoo risky by the shareholders, impact the decision to distributepro�ts (Myers, 1977). Moreover, shareholders are also in con-�ict with bondholders. The latter are creditors of the com-
5

CHAPTER 1. LITERATURE REVIEW
pany. Thus, bondholders could require managers to hold liq-uid assets (reducing dividend payments) to protect themselvesagainst possible �nancial failure and from the risk of insolvency(Jensen, 1986; Jensen and Meckling, 1976).
1.1.2 Miller and Modigliani's Theory: Criticism
Initially, both academia and the �nancial world were skeptical aboutMiller and Modigliani's propositions because the prevailing theoryat the time was based on the concept that exists an optimal levelof debt per company. According to the static theory of the optimalcapital structure, the debt ratio is positively related to the returnon assets, given that the most pro�table companies have a lowerrisk of insolvency and are subject to a higher marginal tax rate thancompanies with lower returns (DeAngelo and Masulis, 1980).
As a result, high-yield companies are stimulated to heavily usethe leverage mechanism, having a higher capacity to increase pro�ts.According to this theory, the role of payout policy is fundamentalin determining the value of a company. Indeed, the static theory ofthe optimal capital structure presumes the existence of an optimaldividend level and deviating from it a�ects the �rm's market value.Consequently, a company with an optimal level of debt will see thevalue of its shares decrease both if the company pays a dividend toolow (since investors will adjust their portfolios in search of stocksthat generate more returns) and if the company pays a dividend toohigh (since the company will have insu�cient liquidity to �nance itsinvestments).
Gordon (1959, 1963) with his bird in the hand theory explains theexistence of dividends by introducing the possibility that investorsprefer a positive return (the dividend) over an uncertain return in-�uenced by market dynamics (increase in share prices). His modelprovides the option for companies to keep a fraction of the pro�tsto �nance new projects. This policy of reinvesting pro�ts withinthe company's business generates wealth which, possibly, will re-�ect in a higher value of shares on the market. However, risk-averse
6

1.2. DIVIDENDS AND TAXATION
investors prefer regular dividend than the possibility of future cap-ital returns. Thus, as a result of an increase in the percentage ofretained earnings, risk-averse investors demand a higher dividendyield according to the Gordon model. However, Gordon's theorydoes not allow companies to invest in projects with zero-net presentvalue (NPV). Rubinstein (1985) shows that retain earnings does notgenerate any change in the value of the company if the possibility ofinvesting in zero-NPV projects is allowed. Thus, in line with Millerand Modigliani, Bhattacharya (1979) states that a change in cash�ows riskiness may in�uence the dividend distribution policy, but inany way, a dividend policy variation may in�uence the cash �owsriskiness and consequently the riskiness of the company. In the nextsection, we speci�cally examine the e�ects of taxation and trans-action costs on a company's payout policy, showing the prominentmodels in the literature with the primary empirical evidence.
1.2 Dividends and Taxation
As anticipated, in the United States, Europe, and many other in-dustrialized countries, the personal tax rate applied to capital gainsgenerated by the share sales is lower than the rate applied to thedividend yield. The literature on corporate �nance has, for a longtime, focused on the e�ects of the disparity in tax treatment be-tween dividends and capital gains. Intuitively, if all investors aresubject to the same tax rate, then a rational investor should pre-fer companies that do not pay dividends or that distribute smalldividends. Therefore, at the same conditions, �rms that distributesigni�cant dividends should be penalized. However, throughout the20th century, we observe that most companies regularly paid mas-sive dividends and that the repurchase of shares was considered amarginal payment instrument.
Miller and Modigliani (1961) suggest that di�erent groups of in-vestors (di�erent clientele) are taxed at di�erent rates. As a con-sequence, there will be investors with higher tax rates which will
7

CHAPTER 1. LITERATURE REVIEW
prefer to invest in companies that do not pay dividends, and in-vestors (whose portfolio is strongly oriented towards pension funds)who are exempt from dividend taxes, therefore indi�erent to thedividend policy. In this context, each company should adjust itspayout policy to maximize shareholders' wealth by increasing theshare price. In equilibrium, companies cannot in�uence the stockprice by changing its dividend policy to attract a speci�c clienteleof investors. Therefore, it is possible to obtain the irrelevance ofdividend policies if the supply of dividends can fully satisfy the de-mand and, at the same time, if investors can adjust their portfoliosquickly.
For the �rst time, Brennan (1971) develops a version of theCAPM (capital asset pricing model) by introducing a personal taxregime. The author shows that investors, with the same risk level,require compensation on returns for �rms that choose to distribute adividend, as a result of the tax regime that penalizes dividend incomeover capital gains. To reconcile empirical observations with theory,Brennan deduces that a real or perceived constraint must determinethe companies' behavior on share repurchases. He then includes inhis model a constraint on the share repurchase that constrains com-panies to distribute the proceeds through dividends. Speci�cally, theBrennan equation for the capital asset pricing model is as follows:
E(Rit −Rft) = a1 + a2βit + a3(dit −Rft) (1.1)
where E(Rit) represents the expected return for the company i attime t, Rft is the risk-free interest rate for the period t, dit is thedividend announced by the company i and βit represents its system-atic risk. The Brennan model suggests that the coe�cient a3 willbe positive and statistically signi�cant to compensate for the highertax burden associated with the dividend.
Black and Scholes (1974) point out that it is complicated,through cross-section analysis, to empirically demonstrate that theexpected returns of companies that distribute large dividends arestatistically higher than expected returns of �rms that don't (both
8

1.2. DIVIDENDS AND TAXATION
before and after individual taxation). Indeed, it is di�cult to con-trol for systematic risk and other factors, so observations cannot beconsidered independent.
To test the Brennan model, Black and Scholes make somechanges to the equation (1.1) to get better estimates. The resultsobtained do not allow them to determine whether the payout policya�ects share prices. Therefore, perplexity is expressed about the hy-pothesis that the market requires higher returns to compensate forthe tax disadvantages of dividends.
Litzenberger and Ramaswamy (1980) extend the Brennan modelby including restrictions on shareholder borrowing and restrictionson short selling. According to Brennan (1970, 1973), they �nd thatcompensation for a higher dividend is positively correlated to the dif-ference between the dividend rate and the capital gain rate. More-over, their methodology of analysis di�ers signi�cantly from thatused by Black and Scholes (1974). Indeed, Litzenberger and Ra-maswamy (1980) analysis involves three steps to estimate the equa-tion (1.1). The �rst step consists in the estimation of the beta ofeach share contained in the sample through the following equation:
RiT −RfT = ait + βit(RmT −RfT ) + εjT
with T = t− 60, .., t− 1(1.2)
where Rmj is the return on a market portfolio proxy at the timej, Rij is the return on the share i, Rfj is the risk-free interest rate,and εij is the error term. Furthermore, the βit coe�cient representsthe estimated beta for the share i at the time t. The second stepconsists in estimating for all the months included in the analysisthe coe�cient that measures the e�ect of the di�erence between theexpected dividend and the risk-free interest rate on the asset i riskpremium. In this regression the beta estimate for the security iduring the month t, βit, and the estimated expected dividend, dit isused as control variable. The researchers to estimate the expecteddividend used the last dividend paid in the previous 12 months. Inthe previous 12 months, the �rm did not pay any dividend, then
9

CHAPTER 1. LITERATURE REVIEW
Litzenberger and Ramaswamy assume that the expected dividend isequal to zero. The cross-section regression for the month t is givenby:
Rit −Rft = a1t + a2tβit + a3t(dit −Rft) + εit (1.3)
So, thanks to this equation, Litzenberger and Ramaswamy getan estimate of the historical series of a3t for the months from 1936to 1977. The third and �nal step computes the a3 estimation of the(1.1) equation. The coe�cient value is calculated as the average ofthe series of coe�cients, a3t, estimated in the previous step.
The standard error in the estimate of a3 is determined by theformula: σa3t/
√t′ , where σa3t is the standard deviation of the his-
torical series a3t, and t′represents the number of months in the sam-
ple. The results of the Litzenberger and Ramaswamy's tests con�rmthat dividends have a positive and statistically signi�cant e�ect onreturns and interpret these results as evidence of the in�uence oftaxation on dividend policies.
Miller and Scholes (1982) argue that the relationship betweenreturns and dividends is a�ected by the various short-term mea-sures of expected return on dividends, which may have undesirablee�ects due to the possibility that the dividend provides to the mar-ket information on future returns. Miller and Scholes criticize theLitzenberger and Ramaswamy's methodology because it produces adistorted estimation of the expected monthly dividends due to thelack of data on dividend announcements. Managers do not alwaysannounce the dividend, or sometimes they mislead by promising adividend that does not take place at the end of the �nancial year.These announcements are bad news for the market, and they havenegative e�ects on the stock price.
Ultimately, it is complex to empirically demonstrate that theshares expected returns that of �rms that distribute high dividendsare statistically higher than the expected returns of shares that donot pay dividends, both before and after personal taxation. They donot �nd any signi�cant relationship between share yields and divi-dend payments, advancing perplexity over the hypothesis that the
10

1.2. DIVIDENDS AND TAXATION
market requires higher yields to compensate for the tax disadvan-tages of dividends.
Subsequently also Chen, Grundy, and Stambaugh (1990), Famaand French (1993), and Kalay and Michaely (2000) underline se-vere endogeneity problems (due to the strong correlation betweendividends and di�erent risk factors) and serial correlation (due todi�culties in estimating the expected dividend).
Fama (1998) seek to measure the e�ect of dividend taxation onthe value of the �rm using equations that are not explicitly derivedfrom a theoretical model, but equations that exploit di�erent waysof expressing the �rm's market value, dividends and interest on thedebt. The objective of this regression strategy is to control for thein�uence of the company's growth opportunities on payment de-cisions. Moreover, Fama and French also include in the equationfuture values to absorb changes in investors' expectations. Theydeduce, however, that it is very complex to control all the e�ectsof pro�tability on dividends and interest paid on debt through thevariables usually used in the literature. Indeed, the results on theimpact of taxation on dividends through a regression of returns arenot unique.
An approach that diverges from the theory of static clientele isrepresented by the hypothesis of investors making dynamic invest-ments.Miller and Scholes (1978) consider the possibility for investorsto implement dynamic trading strategies to reduce or eliminate thetaxation e�ect on securities returns. The basic idea is that an in-vestor subject to a high tax rate on dividends will change his in-vestment plans because of the day of the ex-dividend day. Followingthe announcement of dividend payment, an investor that risks toend up in a di�erent tax bracket, he surely would like to avoid divi-dend income so as not to be subject to a higher tax rate. Probablyhe would sell his shares to investors who are exempt from dividendtax. Therefore, it is assumed that investors subject to low rates buyshares in the days before the ex-dividend day and resell them in thefollowing days, to earn on the price di�erence and on the dividenditself. There is strong indirect evidence to support this theory. Un-
11

CHAPTER 1. LITERATURE REVIEW
fortunately, indirect evidence only, since it is tough to establish withcertainty the identity of the investors who trade the shares.
Rantapuska (2008) makes an interesting study based on data onthe choices of Finnish investors. He analyses the trading data-sets ofall investors in the Finnish stock market and demonstrates that lowtaxed investors tend to buy shares before the coupon detachment,whereas heavily taxed investors tend to sell before the stock paysthe dividend.
Poterba and Summers (1984) �nd that the average drop in shareprices between the announcement and the days immediately follow-ing the dividend distribution is lower than the dividend amount andalso they notice that the average return on shares increases as thedividend increases.
An interesting analysis of the abnormal increase in trading vol-ume around ex-dividend date is provided by Michaely, Vila, andWang (1996). The increase in trading activity around these dayscon�rms the importance of dividend taxation.
Several studies use an analysis methodology based on the detec-tion of the impact of sudden changes on the dividend income andcapital gains taxation to study their in�uence. This approach fo-cuses on the e�ects of exogenous events on corporate distributionpolicy and investor behavior. Typically, these analyses are limitedto the time horizon in which a new tax reform becomes e�ective. Theadvantage of this strategy consists in the possibility of capturing theimpact of taxation by minimizing the in�uence of variables omitteddue to lack of data or the di�culty of isolating payment policy fromother unwanted dynamics (such as transaction costs and corporatepro�tability).
Poterba and Summers (1984) analyze the e�ects of two major taxreforms on the British market using both daily and monthly data.3
If taxes a�ect decisions to buy or sell shares on the ex-dividend day,
3They refer to the 1965 reform that introduced a dividend capital gain taxof 30% and the 1973 reform that integrated the corporate income tax. Thesereforms e�ectively reduced dividend income tax for private and corporate in-vestors.
12

1.2. DIVIDENDS AND TAXATION
then a change in the dividend tax regime should a�ect share prices.As mentioned above, this approach makes it possible to overlookthe criticism of Miller and Scholes (1982) regarding the distortionof the estimation of Litzenberger and Ramaswamy (1979). Indeed,both the �information e�ects" and the measurement problems willbe common to both tax systems. They conclude that, since the in-crease in dividend taxes in 1913, the investors have been demandinga higher return from companies paying dividends, con�rming thehypothesis of Brennan (1971) and Litzenberger's and Ramaswamy's(1979) that taxation represents a signi�cant part of the positive re-lationship between dividends and stock yields.
Chetty and Saez (2005) take advantage of the reduction in themaximum tax rate on dividends (e�ectively equating the rate ondividends to the rate on capital gains) that took place in the U.S.A.in 2003. They note that the reform has signi�cantly contributedto the increase in the number of companies distributing pro�ts andchanging the dividend trend had in the previous decades.
However, Farre-Mensa, Michaely, and Schmalz (2014) criticizeChetty and Saez's conclusions, and again, they denounce distortedestimations because of the information e�ect. Speci�cally, Farre-Mensa, Michaely, and Schmalz emphasize the possibility that man-agers, anticipating the future tax reform, have decided to postponedividend payments until the period in which the reform would comeinto force. The �rms have therefore decided to delay the paymentof dividends to the period in which the reform would come intoforce. The companies would, therefore, have chosen to defer pay-ments to take advantage of the reduction in the maximum rate. Inthis case, the e�ect of the tax reform obtained by Chetty and Saezwould be overestimated. Brav et al. (2008) con�rm the hypothesisthat companies have only postponed the payment of dividends; asthey show that the number of companies paying dividends increasessigni�cantly in the quarter following the reform and then returns topre-reform levels.
Summarizing, the results of cross-section analyses are particu-larly ambiguous, as they do not de�nitively con�rm the e�ect of
13

CHAPTER 1. LITERATURE REVIEW
taxation on share yields due to dividend payments. On the otherhand, the studies con�rm an unusual behavior of the share priceand transaction volumes in the days following the announcement.Consequently, it is possible to partially con�rm a dynamic clientelee�ect.4 (limited to days around the announcement and paymentof dividends) but conditioned by transaction costs that block tradebetween investors subject to di�erent tax rates5.
Several studies observe that transaction costs inhibits trades,thus placing some limits on the assumptions of the clientele theory.Indeed, by directly analyzing investors' portfolio preferences, severalstudies suggest that investors subject to high taxation hold a stag-gering number of shares in companies paying signi�cant dividends,thus weakening the hypothesis of the in�uence of tax on investors'portfolios.6
1.3 Dividends and Asymmetric Informa-
tion
Several empirical analyses show that announcements of variationsin companies' dividend policies determine strong activities in stockmarkets.7
4It is a theory that explains how a company's share price moves accordingto the demands and objectives of investors in response to a tax, dividend orother policy change. It assumes, �rst of all, that speci�c investors are attractedto di�erent corporate policies and that when the policy of a company changes,investors adjust their shareholdings accordingly. As a result of this adjustment,the share price moves upwards or downwards
5Michaely and Vila (1996) show that the volume of one-day transactions isa decreasing function of transaction costs.
6Blume, Crockett, and Friend (1974) survey investors' portfolios. Lewellen,Stanley, Lease, and Schlarbaum (1978) carry out analyses on the clientele of abrokerage �rm. Del Guercio (1996) notes that the portfolios are quite similarwhen analyzing the composition of the portfolios of certain mutual funds (highlytaxed) and pension funds (exempt from taxation).
7See Michaely, Vila, and Wang (1996), Karpo� (1987), and Pettit (1972).
14

1.3. DIVIDENDS AND ASYMMETRIC INFORMATION
Typically, the announcement of an increase in dividends is suc-ceeded by an increase in the price of the shares; conversely, theannouncement of a cut in dividends is followed by a decrease. Itis, therefore, necessary to develop new models capable of explainingthe high payout ratio of listed companies and capture the dynamicsof the �nancial markets following the announcement of a change inthe payment of dividends.
This is how the theory of signals was born, as opposed to thetheory of Miller and Modigliani. This theory states that dividendpayments provide positive signals about the company's prospects forstability and growth. Most models in the signaling theory assumethat managers have more information (about the pro�tability of thecompany) than other market agents.
Bhattacharya (1979) adopts a two-period model where the man-ager maximizes the value of the company. This model links man-ager's compensation to the company's pro�ts to recreate a contextin which the interests of shareholders and managers are perfectlyaligned. However, the manager alone observes the pro�tability ofthe investment, and he decides whether to implement a project. In-vestors do not observe the expected return of the investment. How-ever they observe the dividend that the manager pays and decidewhether to invest in the company. Basically, the manager �signals�the pro�tability of the project through the payout policy promisedfor the next period. If the pro�t generated in the �rst period is in-su�cient to cover the promised dividend, then the manager will beforced to recourse to external funding and bear the related transac-tion costs to cover the promised dividend. The dividend is insteaddirectly paid if the pro�t made at the beginning of period 1 is greaterthan or equal to the promised dividend. Bhattacharya shows that inequilibrium managers of companies with low expected returns willnot �nd it convenient to promise a high dividend otherwise theywould be forced to continuously resort to external �nancing, andconsequently to incur high transaction costs.
Miller and Rock (1985) also develop a two-period model withcorrelated pro�ts. Through a framework very similar to the one used
15

CHAPTER 1. LITERATURE REVIEW
by Bhattacharya, the researches assume that to give positive signalsto the market managers have the possibility of reducing investmentsand increasing dividends. So they introduce the hypothesis that thedistortion occurs in the investment policies of a company, ratherthan in the choices of �nancing as previously assumed.
However, both models do not take into account share repurchasesand speci�cally the di�erent tax treatment of repurchases and divi-dends.
The model of John andWilliams (1985), on the other hand, intro-duces the possibility for �rms to repurchase their shares, reproducinga di�erentiated tax treatment between dividends and repurchases.In particular, repurchases are not taxed, so they are a more advan-tageous means of repaying shareholders. However, companies thatchoose to distribute a dividend despite the tax disadvantage signalthat the price of their shares is undervalued, causing an increase.
John and Williams assume that the managers are the only whoknow the real value of the stocks. Moreover, they assume that someshareholder is forced to sell a portion of its shares to satisfy liquidityneeds. They show that in equilibrium, only managers of underval-ued companies have an incentive to pay dividends. In fact, for thesecompanies, the increase in the share price due to the payment ofdividends will be su�cient to o�set the cost of taxes. However, thismodel does not provide shareholders the access to external �nanc-ing to satisfy their liquidity needs. Indeed, through external funding,shareholders could satisfy their liquidity needs without being con-strained to sell shares.
The tendency of companies to gradually adjust their dividendpayments is one of the limitations of the signal theory.
The classic signaling models (Bhattacharya, 1979; John andWilliams, 1985; Miller and Rock, 1985), are not suitable to explainthe gradual adjustment of dividends. This is because only two kindsof equilibrium are assumed:
1. an equilibrium in which dividends completely reveal the pri-vate information of the manager (complete separating equilib-
16

1.3. DIVIDENDS AND ASYMMETRIC INFORMATION
ria);
2. an equilibrium in which dividends do not reveal any informa-tion (complete pooling equilibria).
Kumar (1988) and Guttman, Kadan, and Kandel (2010) insteaddevelop models based on the signal theory that explain the gradualadjustment of dividends.
Assuming that the manager's return is decreasing respect to theshareholders' investment, Kumar shows the existence of a equilib-rium of �partial� signaling where the �bad� managers may not havethe convenience of paying a dividend equal to that distributed bythe �good� managers to not risk over-investment by the sharehold-ers. He shows that the policy of dividend payment in equilibriumis represented by a step function with respect to the productivityof the manager. In practice, all managers on the same partitionwill pay the same dividend. This element characterizes the gradualadjustment of dividends.
Guttman, Kadan, and Kandel di�erently elaborate a modelwhere the gradual adjustment of dividends derives from managers'willingness to keep dividends stable until revenues change signi�-cantly. An equilibrium is reached in which for intermediate levelsof revenues managers pay the same dividend, for levels of revenuesoutside this range (therefore particularly high or low) there is a com-plete disclosure of the private information of the manager.
Allen, Bernardo, and Welch (2000) make an interesting contri-bution to signal theory. In their model, dividends are a useful signalto attract more informed investors. According to their assumptions,companies with good growth prospects for undervalued equity mar-kets try to attract large �nancial institutions (such as investmentfunds) that can monitor the potential of a company and the perfor-mance of managers. On the contrary, �rms that are overvalued withlittle investment opportunity have no incentive to have institutionsamong their shareholders that can measure the real value of the �rm.Moreover, once institutional investors have been attracted, they canimpose a large sanction in response to dividend cuts, so managers
17

CHAPTER 1. LITERATURE REVIEW
are forced to o�set dividends. Therefore, distributing dividends al-lows managers of undervalued companies to report the real valueand generate an increase in the shares' price. This hypothesis is inline with the clientele theory described in the previous section andwith the widespread practice of gradual adjustment of dividends (infact, in such a context the reduction of dividends would send theopposite signal).
The examined models assume that the manager considers hisown company undervalued and therefore sends positive signals tothe markets about the expected return of the company through thepayout policy.
1.3.1 Signaling Theory
The assumptions and conclusions described in the previous sectioncan be tested through empirical analyses. The main predictions ofthe dividend signaling model concern a:
1. positive relationship between changes in dividends and the re-action of prices to changes in dividends;
2. positive relationship between the change in dividends and thefuture earnings of companies;
3. positive relationship between the changes in dividends and thepro�t forecasts of the company's analysts.
However, the empirical analyses developed so far have not beenable to con�rm the relationships predicted by the models.
Recent studies evaluate the possibility that the dividend will sendsignals about the company's risk rather than the expected return.Consequently, changes in dividend policy would be interpreted aschanges in the volatility of returns rather than changes in the ex-pected value of future cash �ows.
Grullon, Michaely, and Swaminathan (2002) develop the so-called theory of the "�rms maturity". This theory is rooted in a
18

1.3. DIVIDENDS AND ASYMMETRIC INFORMATION
recurrent concept in business management and administration man-uals according to which companies go through several stages duringtheir life cycle, following a maturation process. According to Grul-lon, Michaely, and Swaminathan, when a company matures, thereare two e�ects: it bene�ts from the reduction of systematic risk, butat the same time it su�ers from a reduction of investment opportu-nities.
In this context, researchers claim that an increase in the dividendis a positive sign, �rst of all, because the markets may not be awareof the reduction in the company's risk, and then the increase in thedividend would be a positive surprise. Besides, since the greater thematurity of the company corresponds to a greater shortage of posi-tive net present value projects, according to Grullon, Michaely andSwaminathan the markets appreciate that the manager, rather thanburning resources in bad investment projects, increases paymentsto shareholders. Therefore, the market reacts positively for agencyreasons, as proposed in Jensen (1986) and Stulz (1990).
1.3.2 Agency Theory
Simplifying, we can de�ne a �rm as a complex structure of contrac-tual agreements between di�erent actors (i.e., shareholders, man-agers, employees, and bondholders). The economic literature haslong addressed the issue of con�icting interests between the com-pany management and control. In this framework, the dividendpolicy can be framed as one of the tools to balance the complicatedrelationships between the various actors. The investigations focusedmainly on two con�icts of interest: the bondholder-shareholder andthe manager-shareholder con�ict. We start by illustrating the dy-namics of the con�ict between bondholders and shareholders andthe associated empirical literature.
19

CHAPTER 1. LITERATURE REVIEW
Agency Theory: the Bondholders-Shareholders Con�ict
The nature of the con�ict between bondholders and shareholdersderives from the substantial asymmetry in their payo� pro�les. In-deed, in case the cash �ow generated by the economic activity is notsu�cient to repay the debt, bondholders have the right to take overthe company's assets to o�set (at least partially) their claim on thecompany. Therefore, bondholders usually solicit managers to have abehavior aimed at minimizing the default risk. On the other hand,the shareholders' payo� is given by the di�erence between revenuesand debt. Therefore, the shareholders would like to make the dif-ference between revenues and payments to bondholders as large aspossible, at the cost of undermining the business solvency.
The con�ict of interest between shareholders and bondholdersin�uences the �rm's payout policy. The manager can draw awayresources from the bondholders' disposal through dividend payouts.Consequently, unexpected dividend payments can virtually increasethe company insolvency risk and thus reduce the value of the debt.However, generally, bondholders impose restrictions on dividendpayments.
Kalay (1982) examines a sample of stock contracts, speci�callyfocusing on lenders restrictions imposed on dividend payout. Theseconstraints can be either direct or indirect. Direct restrictions placelimits on dividend payment and share repurchases over the life ofthe bond. Indirect constraints, on the other hand, essentially placerestrictions on some balance-sheet items (i.e., requiring a minimumamount for equity or working capital, or else a maximum level forthe debt to asset ratio). Usually, indirect constraints are much morepowerful than direct constraints because once violated; they forceshareholders to contribute with new capital or to lose shares. Ac-cording to Kalay, the nature of the restrictions supports the assump-tion that dividends represent a tool to limit the con�ict of interestbetween shareholders and bondholders.
Successive studies analyze the e�ect of an unexpected change individends on shares and stock prices. Consistently with the agency
20

1.3. DIVIDENDS AND ASYMMETRIC INFORMATION
theory, an unexpected dividend increase should cause an increasein share price and at the same time, a reduction in bond price.However, if the increase in dividends indicates an increase in thecompany's growth opportunities, then it is plausible to think thatan unexpected increase in dividend payout should also be consid-ered as good news for bondholders. The main obstacle for this kindof analysis is given by the isolation of the e�ect of the payout pol-icy variation, keeping constant all other variables. Handjinicolaouand Kalay (1984), Jayaraman and Shastri (1988), and Dhillon andJohnson (1994) con�rm that the behavior of bond and equity pricesconcerning signi�cant changes in dividends is consistent with theagency hypothesis.
Agency Theory: the Manager-Shareholders Con�ict
The managers-shareholders con�ict (as for the bondholders-shareholders con�ict) stems from the divergence between their objec-tive functions. This discrepancy becomes heavier as the dispersionof the shares' ownership increases. Essentially, the more the owner-ship is shared by a large number of shareholders the more expensiveit will be for a single shareholder to monitor the manager perfor-mance since the bene�ts will be equally distributed among the allthe shareholders.
Also, shareholders have the opportunity to diversify their port-folio. Therefore they are exposed to systematic/un-diversi�able riskonly. Conversely, the manager compensation and prestige cruciallydepend on the success of the company. Indeed, the manager can-not diversify the insolvency or bankruptcy risk. Thus, the managerrisk-aversion could be quite relevant for the �rm investment policy(e.g., a risk-oriented manager may prefer a short-term view threaten-ing the long-term pro�tability and stability of the company, Jensenand Meckling (1976)). Once again, the agency con�ict increases asmany �outside� security holders (i.e., shareholders who do not havemanagement tasks) are involved in the company ownership.
Therefore, the asymmetry between the managers and sharehold-
21

CHAPTER 1. LITERATURE REVIEW
ers' returns a�ects the company's dividend policy. Indeed, the di-vergences between the managers and shareholders' objectives couldinduce the former to accumulate liquid assets to obtain greater dis-cretion on the operational choices of the company, and the latter toput constraints on the management to avoid behaviors that wouldrisk burning the company's liquidity. It is complex to assess whetherthe manager's choices are not maximizing the �rm's value. There-fore, very often, the shareholders use remuneration contracts to aligntheir interests with those of the managers. Stock options are anexample of managers' remuneration designed to alleviate manager-shareholders con�ict. Indeed, the stock options give the manager theright to buy the company's shares at a predetermined price (strikeprice). However, stock options negatively a�ect dividend paymentsalso. Indeed, in perfect capital markets, the shares' price is reducedby an amount equal to the dividend. As a result, managers are en-couraged to reduce or avoid dividend payments until they have theopportunity to exercise the stock option.
Easterbrook (1984) argues that dividends mitigate shareholders'monitoring costs. The researcher assumes that shareholders expectdividends to be distributed so that the manager is forced to raise ex-ternal funds to �nance new investment projects. Thus, shareholdersprefer a certain debt level because the bondholders, such as invest-ment banks and funds, provide further control over the management.Dividend payments allow shareholders to �externalize� monitoring,thus reducing agency costs. Therefore, we expect that companieswith dispersed shareholding ownership and high debt-to-equity ra-tio, payout a constant level of dividends. On the contrary, compa-nies with a single large shareholder, who has a strong incentive tomonitor the manager's choices, will pay little or no dividends. East-erbrook's model is also compatible with the evidence on companiesthat pay dividends and, at the same time, raise capital by issuingbonds on capital markets. Several studies con�rm the Easterbrookhypothesis and note that shareholders impose dividend payments toreduce the free cash �ows available to the manager and to preventsub-optimal investments (e.g., investing in unpro�table acquisitions
22

1.4. DIVIDENDS AND TRANSACTION COSTS
and/or mergers).Numerous empirical analyses con�rm the in�uence of agency
problems on payment policy. Lang, Stulz, and Walkling (1989) andlater Yoon and Starks (1995) report that the shares' prices in compa-nies with poor investment opportunities are much more sensitive tochanges in payout policy than companies with better growth oppor-tunities. This result con�rms the importance of the dividend policyin resolving con�icts of interest, which are particularly relevant inthe case of companies with low investment opportunities.
Lambert, Lanen, and Larcker (1989) examine agency con�ictsby analyzing the connections between manager compensation andpayout policy. The researchers �nd that most of the managers' re-muneration is aligned with shareholders goal; fewer dividends arepaid. Indeed, Eckbo and Verma (1994) and Agrawal and Narayanan(1994) �nd that the managers with greater control over the companymake lower cash payments to shareholders.
La Porta et al. (2000a) exploit countries variation in sharehold-ers protection laws. They �nd that higher shareholders protectionincreases the probability to pay out dividends, in particular for �rmswith low investment opportunities.
1.4 Dividends and Transaction Costs
A method for classifying �nancial markets refers to the measurementof transaction costs. The level of transaction costs can in�uence theinvestors' trading choices.
It is possible that investors would opt for stocks of companiesthat do not pay dividends to avoid the transaction costs associatedwith the dividend reinvestment. Conversely, investors who want toperiodically obtain a speci�c return from their capital investments(e.g., to �nance their consumption) may prefer shares that pay div-idends.
Hence, companies could exploit investors preferences to enhancetheir market value. However, as suggested by Black and Scholes
23

CHAPTER 1. LITERATURE REVIEW
(1974), in equilibrium the �rms will adjust their payout policy suchthat the marginal investor would be indi�erent to the level of divi-dend paid. Moreover, Allen and Michaely (2003) register a signi�-cant reduction of small investors on the �nancial markets, but thesize of aggregate dividends has not changed signi�cantly.
Roze� (1982) investigates on the relationship between dividendpolicy, agency costs, and transaction costs. Roze� assumes thatan increase in dividend payout ratio (keeping constant the pro�t)reduces agency costs but increases transaction costs related to ex-ternal �nancing.8 The optimal dividend level is the result of theminimization of the cost. Roze�'s model is based on the trade-o�theory of optimal capital structure.9 According to this theory at theend of each period managers compare costs and bene�ts of holdingliquid assets; consequently, the optimal liquidity level is given by theamount of cash �ow that equates the marginal cost and the marginalrevenue. Speci�cally, the cost is given by the opportunity cost linkedto investments with the same degree of risk; the bene�t instead isgiven by the possibility to avoid �nancial constraints.10 The trade-o� theory forecasts a negative relationship between dividends andthe level of external �nancing. Essentially, it assumes that heavilyindebted companies with high volatile yields (e.g., growing youngcompanies)11 do not distribute dividends to avoid high transactioncosts associated with external funds acquisition.
Del Guercio (1996) estimates the impact of transaction costs onthe portfolio composition of some institutional investors. Exploitinga reform on the U.S. securities market aimed at reducing transactioncosts for small investors, Del Guercio concludes that dividends donot a�ect the portfolio composition of the mutual funds observed.
8Transaction costs associated with external funding are given by subscriptionfees, administration costs, management time, and legal fees.
9Initially proposed by Kraus and Litzenberger (1973)10Ferreira and Vilela (2004).11Dempsey and Laber (1992) and Moh'd, Perry, and Rimbey (1995).
24

1.5. PECKING ORDER THEORY
1.5 Pecking Order Theory
Myers (1984) develops an alternative capital structure theory totrade-o� theory. Basically, the model (called the hierarchical modelof �nancing decisions or simply the pecking order) assumes a resid-ual role of dividends about the investment needs of the company.
Meyers assumes that transaction costs and costs arising frominformation asymmetries between managers and investors aboutprospects and the value of the company determine a hierarchicalorder between sources of �nance. In this context, capital increasesthrough the issuance of new shares are the most expensive sourceof �nancing. Intuitively, if a manager predicts an increase in futureearnings, shareholders should not be willing to share higher earningswith new investors. Consequently, the issue of new securities is in-terpreted by the market as a desire to share more risks and investors;therefore, su�er from the problem of asymmetric information on theprice of new shares issued. In some cases, managers may even beforced to abandon pro�table investment projects because of the costof information asymmetries. Therefore, �rms are forced to �nancetheir projects mainly through retained earnings, that is consideredthe source of �nancing with the lowest cost. Only when the liquidassets are exhausted companies ask for new debt, and ultimatelychoose to issue new shares.
Meyers assumes that payout policies are strongly in�uenced byconsiderations on the hierarchical order of �nancing decisions. Themodel's predictions imply that companies that expect to make largeinvestments with extremely volatile returns and companies with highleverage avoid paying dividends.
Fama and French (2002) for the �rst time compare trade-o� the-ory with the pecking order theory, and they �nd that data supportmany of the predictions of both models. The results con�rm the re-lationship between pro�tability and the use of leverage in a company.The trade-o� theory predicts that the most pro�table companies willmake greater use of the possibilities of external funding, but the testresults do not support this hypothesis. Fama and French also �nd
25

CHAPTER 1. LITERATURE REVIEW
that companies paying dividends make signi�cantly fewer equity is-sues. Moreover, Fama and French �nd that among the companiesthat distribute dividends, the small and quickly growing companiesare those that make the most use of the issuance of new securities,contrary to the theory of hierarchical order. Ultimately, Fama andFrench �nd that the results do not fully support either theory.
1.6 Empirical Evidence
The empirical analysis of the dividend policy is made incrediblycomplicated by the strong simultaneity in the manager's decisions.Indeed, in the empirical corporate �nance, it is unlikely that aneconometrician observes reasonable exogenous variation in a vari-able. Furthermore, the scarcity of data does not make it possibleto extend the results from the sample to the population, withoutgenerating strong doubts about the stability of the results obtained.Indeed, researchers are continually looking for new data-sets thatgive the possibility to extrapolate more information about investors'and managers preferences.
Black and Scholes (1974), in their famous article "The E�ects ofDividend Yield and Dividend Policy on Common Stock Prices andReturns", wrote:
There have been many attempts in recent years to verify whetheror not the payout policy of a �rm a�ects the price of its shares,but these tests have never been su�ciently satisfactory. Most of theauthors used sampling-based tests of companies, which attempt tocompare the share prices of companies that di�er only in dividendpolicy. A problem with such tests is that it is very di�cult to controlvariables other than payout policy, and it is tough to obtain accurateestimates of the meaning of the results obtained from regressionsbased on sampling. It is challenging to say whether a relationshipfound in a regression represents a causal relationship, and if so, in
26

1.6. EMPIRICAL EVIDENCE
which direction does the randomness run.
The constant search for precise identi�cation, a ceteris paribuscomparison, has led academic literature to analyze in isolation thechoices on dividends and repurchases concerning all other momentsof the life of a company. Indeed, the analysis method most widelyadopted in the literature on dividend payout policy is the quasi-experimental approach. In these applications, economists are inter-ested in the e�ects of structural government interventions on sharesprice and dividend variables. These studies aim to isolate the impactof payout policy on �nancing and investment choices.
However, despite the considerable di�culties, has been made sig-ni�cant progress in the empirical analysis on the e�ects of paymentpolicy on �rms' value. Below we summarize the main results ob-tained in the literature. In the next section, we start by assessingthe quantitative incidence of payments, and we continue by high-lighting the main features of dividends and repurchases.
1.6.1 Evidence on Aggregated Data
Until the early 80s, dividends were the main mean of payment, andshare repurchases was a marginal phenomenon. However, Skinner(2008) shows that in the last decades, the number of buybacks ex-ceeded the companies' dividend payments, becoming the dominantform of payment. Grullon, Michaely, and Swaminathan (2002), ob-serve that the noticeable increase in repurchases is a sign of the regu-lar dividends replacement. The proportion of companies distributingdividends on the total number of listed companies has progressivelydecreased from 80s to the early years of the new century. Until theearly 2000s, empirical studies tried to discern the reasons for theobserved payment patterns by focusing mainly on the e�ect of tax-ation, agency costs, and signaling. Fama and French (2001) showthat one of the main reasons for the fall in dividends is the explo-sion in the number of small companies with low pro�tability (e.g.,
27

CHAPTER 1. LITERATURE REVIEW
all dot-com listed �rms in the 90s linked to the internet expansion).
New theories consider the managers' remuneration as the mainreason for the dizzying growth in the use of share repurchase asshareholders payment method. Speci�cally, Young and Yang (2011)note that managers' compensation is very often linked to earningsper share (EPS), i.e., managers are rewarded as this measure in-creases. Since this ratio increases as the number of outstandingshares decreases, managers are inclined to prefer to share repurchaserather than pay out dividends. Researchers �nd strong evidence tosupport these assumptions.
At the same time, the reduction in the proportion of companiesthat distribute dividends has been followed by a substantial increasein the amount of the dividends paid by companies that distributedhigher dividends in previous years.
However, in the last decade we observe a trend reversal.12 Therehas been an increase in the number of (U.S. and European) listedcompanies distributing dividends. This evidence suggests that man-agers consider dividends and share repurchase as complementarymethods.
1.6.2 Evidence on Firm-level Data
Lintner (1956) conducts the �rst survey on payout policies in 1956,which was aimed at managers of major U.S. listed companies. An-alyzing the surveys from 28 selected �rms, Lintner �nds that formost managers, the stability of payout policy is a priority, even overinvestment policy. He notes that a large percentage of managers pre-fer to increase debt rather than cut dividend payments to �nance aninvestment.
According to this survey, the main objective for managers is toensure the payout stability of shareholders compensations. However,in case a change in dividend policy is deemed necessary, Lintnershows that the entity of the variation in payments is decided based
12Floyd, Li, and Skinner (2015) document this new upsurge for dividends.
28

1.6. EMPIRICAL EVIDENCE
on the variation in pro�ts.
Based on the results of the study, Lintner elaborates an equationthat captures the behavior underlying the payout policy of a generic�rm i:
∆Dit = ai + ci(D∗it −Di(t−1)) + uit with D∗it = riPit,
where Pit represents the after-tax pro�t during the period, andr represents the percentage of pro�t that the manager would liketo pay its shareholders. The parameter c represents the rate withwhich managers change their payout policy, taking into account thedividend paid in the previous year. Lintner tests this model andcon�rms the assumptions and shows that this equation can capturethe 85% of the variations in payout policies in the sample.
Baker, Powell, and Weaver (1999) conduct a very similar anal-ysis through a survey on managers of the major companies listedon the New York Stock Exchange (NYSE) in 1997. Their resultscon�rm Lintner's �ndings. According to Baker and Powell, past,current, and expected pro�ts prove to be the variables that mostin�uence managers' payment decisions. Besides, researchers observethat company managers are incredibly aware that investors interpretpayout policy corrections as changes in the company's pro�tability.Moreover, Baker and Powell �nd that managers avoid increasingdividends, and consequently alter the dividend to pro�t ratio whenthey predict that the increase will not be sustainable in subsequentperiods.
Brav et al. (2005) conduct further survey interviewing �nancialexecutives and obtaining their thought on payment policy choices.They also con�rm Lintner's central �nding, i.e., managers primar-ily pursue a stable payment policy. The survey also con�rms theunderlying assumption of both signaling models (Miller and Rock,1985) and agency models (Jensen, 1986) that managers are willing togive up positive net present value investment projects before cuttingdividends. It is clear from the survey that dividend payments are ex-tremely binding on managers, with more than 65% of the managers
29

CHAPTER 1. LITERATURE REVIEW
surveyed saying that they are also willing to use funds outside thecompany to avoid dividend reductions. Also, around 80% of �nan-cial executives agree that dividends provide information to investors.According to the managers, the information transmitted through thepayment of the dividend is not intended to attract a particular classof investors (as assumed by the clientele theory) or the level of fu-ture returns (as described by the theory of signal).13 Rather, somemanagers argue that the transmitted information a�ects the volatil-ity of returns and speci�cally the systematic risk associated withthe company. Brav, Graham, Harvey, and Michaely also point outthat share repurchases transmit almost the same information as div-idends. However, the analysis of the survey shows that managers donot consider buyback plans as binding as dividend payment plans.It appears that managers are not willing to increase external debtor equity, nor to give up investment projects to �nance repurchases.This distinctive element between the two payment methods wouldcon�rm that buybacks and dividends cannot be regarded as perfectsubstitutes (as noted by Grullon and Michaely, 2002).
All over the world, �rms that distribute dividends exhibit simi-lar dynamics. The propensity to pay dividends is higher among thelargest and relatively stable �rms, as well as among companies forwhich retained earnings constitute a larger fraction of the total cap-ital and with low growth rates. The increase in dividends recordedsince the early years of the new century is mainly due to large com-panies that liquidate substantial dividend amounts. In fact, throughan analysis conducted on 15 member nations of the European Unionfrom 1989 to 2005, von Eije and Megginson (2006) show that thenumber of listed companies that pay dividends is steadily decreased,despite the overall dividends have increased. Also in Europe, as inthe case of US companies, repurchases increased signi�cantly from17% of total payments in 1989 to 35% in 2005.
DeAngelo, De Angelo, and Stulz (2004) study the dividend poli-cies using an approach based on the theory of optimal capital struc-
13Grullon and Michaely (2004) �nd a similar result for buybacks.
30

1.6. EMPIRICAL EVIDENCE
ture that assumes an optimal dividend level based on the speci�ccharacteristics of a company. The researchers hypothesize that com-panies with a high ratio between retained earnings and total capitalare mature companies, able to set aside pro�ts and distribute theoptimal level of dividend, not su�ering the distorting e�ects of mar-ket frictions, such as agency con�icts, transaction costs, asymmetricinformation, etc. According to this theory, they focus on the char-acteristics of the companies that distribute dividends, presumingthat the companies that generate more pro�ts are also those mostlikely to borrow to obtain the maximum pro�t in favorable marketconditions. However, Baskin (1989) reports a negative relationshipbetween the pro�tability ratios and the debt ratios of a company,con�rming the mixed empirical evidence about the relationship be-tween pro�ts, debt, and dividends.
Booth and Cleary (2006) empirically analyze the connection be-tween the presence of information asymmetries and the propensity ofmanagers to gradually adjust dividends. They �nd that companieswith a bond rating pay dividends following Lintner's rule. On thecontrary, �rms without a bond rating that rely exclusively on pri-vate (banking) debt do not make gradual adjustments to dividendsand seem to follow a residual payout policy compared to investmentpolicy. Leary and Michaely (2011) show that more mature com-panies with low revenue volatility have a lower dividend variability.The researchers conclude that the gradual adjustment of dividends isnegatively correlated with information asymmetry indices. Indeedthey �nd that �rms with more �nancial analysts and consultantshave a higher propensity to dividend smoothing.
Michaely and Roberts (2011), on the other hand, hypothesizethat agency con�icts in�uence dividend smoothing. The researchersconducted an interesting analysis of private companies where the�rm's ownership is highly concentrated, so the con�icts betweenownership and control are minimized. In these �rms, Michaely andRoberts note that the choice of the number of dividends is residualconcerning investment and �nancing policies. Furthermore, the re-searchers observe that unlisted companies have a signi�cantly lower
31

CHAPTER 1. LITERATURE REVIEW
probability of reducing dividends, and consequently, the gradual ad-justment of dividends does not seem to be a priority for these com-panies. These results con�rm the in�uence of agency costs on com-panies' payout policies. However, Michaely and Roberts stress thatagency costs cannot fully explain the practice of gradual adjustmentof dividends.
Dividends and Cash Holdings
Several empirical studies carry out analysis of the increasing seculartrend of cash and cash equivalents (Bates, Kahle, and Stulz, 2009;Opler et al., 1999; Ozkan and Ozkan, 2004). Studying the balance-sheets of U.S. companies, they identify four main causes for theincrease in cash holdings:
• a substantial increase in expenses for research and develop-ment;
• superior management and consequently a reduction in unusedcash;
• a reduction in investment in �xed assets;
• an increase in cash �ow risk.
Pinkowitz, Stulz, and Williamson (2006), estimate the e�ect ofagency costs on the �rm's value. In practice, they assume thatthe market value of cash holdings is greater in countries with a �-nancial system strongly oriented towards the protection of minorityshareholders. Therefore the controlling shareholders have a lowerpossibility to obtain personal bene�ts from the management of liq-uidity. For all the years examined, Pinkowitz, Stulz, and Williamsondivide the sample to the median country's protection level. The au-thors �nd that the relationship between cash holdings and marketvalue is much weaker in countries with poor regulation on minorityshareholders' protection. Moreover, as evidence of the in�uence of
32

1.6. EMPIRICAL EVIDENCE
agency costs, Pinkowitz, Stulz, and Williamson �nd that the rela-tionship between dividends and the value of the company is weakerin countries with strong shareholder protection. Therefore they con-clude that agency costs have a strong impact on �rms' value.
Pinkowitz and Williamson (2007) estimate the market value of aunit of �rms' liquid assets. Employing a sample of 13,000 U.S. com-panies observed from 1965 to 2004, they try to determine the actualvalue attributed to cash holdings by investors. Through their analy-sis, they �nd a wide variety in the way �rms evaluate a marginal dol-lar of liquid assets. The valuation ranges from 0$ to 1.60$ dependingon company's characteristics and industry in which it operates.
If the real expected rate of return necessary for a company isconstant, then its intrinsic value per share at time t, V (t), is de�nedas the present value of the company's expected future real cash �owsthat will be available to be distributed for each share currently is-sued. Given the well-known accounting identity. It follows that acompany's payout policy must necessarily satisfy the following equa-tion:
V (t) = Et
[ ∞∑k=0
D(t+ k)
(1 + r)k+1
]Although the manager can in�uence the intrinsic value of his
company through his investment decisions, he cannot control thestochastic process or unexpected deviations of V (t). However, themanager has control over the dividends paid by the company underthe constraint described above.
This constraint is very similar to the inter-temporal budget con-straint on rational consumption choices in the problem of consump-tion choices over the lifetime of an individual. In this analogy, theintrinsic value of an enterprise, V (t), corresponds to the permanentincome or wealth of the individual, and the payout policy of theenterprise corresponds to the consumption policy of the individual.Just as there is an in�nite number of rational consumption plansthat satisfy the consumer's budget constraint for a given amountof wealth, so there is an endless number of dividend policies that
33

CHAPTER 1. LITERATURE REVIEW
satisfy the constraint for a given intrinsic value of the enterprise.14
As previously seen, the choices relating to the �nancial policy ofa company are extremely interconnected and, at the same time, theyare not immune to changes in the internal equilibrium of the share-holder structure. Information asymmetries represent the reason forthe synchronous among mutual in�uences. Debt, dividend policies,and changes in private ownership are all tools used to reduce asym-metric information; but these tools involve costs. Indeed, managerswho want to increase control incur in costs resulting from the mis-diversi�cation of their portfolio. At the same time, debt reduces freecash �ows under the control of the manager, but it generates newcon�icts between creditors and shareholders. Similarly, a reductionin dividends may favor creditors at the cost of diverting resourcesfrom shareholders, whereas an increase in dividends may reduce in-formation asymmetries at the cost of diverting liquid resources frommanagers.15
Dividends and Earnings' Volatility
As noted in previous sections, according to the complete market'sassumption, the dividend payment should generate a decrease inshare value equal to the amount of the dividend. Moreover, if acompany decides not to distribute dividends from one year to thenext, we should not observe any market reaction.
However, an unexpected dividend increase leads to a rise inshares price and, conversely, an unexpected dividend cut generatesa sharp fall in shares price (Michaely, Thaler, and Womack, 1995a).Moreover, Healy and Palepu (1988) show that market reactions aremore intense for companies that for the �rst time announce to dis-tribute a dividend or for companies that, from one year to the nextone, decide to omit dividend payment.
Grullon and Michaely (2004) also note that the reaction of themarket is proportional to the entity of the variation in dividends
14Mash and Merton, (1986).15See Jensen, Solberg, and Zorn (1992).
34

1.6. EMPIRICAL EVIDENCE
or share repurchases. Indeed, more the dividend di�ers from theexpected one, stronger the impact on the share price.
According to Fama and Babiak (1968), earnings' volatility ishigher than dividends' volatility. This observation is supported bynumerous analyses that demonstrate the aversion of managers tomodify the payout policy.
Conversely, several studies show that share repurchases arehighly pro-cyclical and that a variation in repurchase policy has noconsequences on shares price.Lee and Rui (2007), through a struc-tural vector autoregressive analysis, show that share repurchasesare associated with transitory increases in pro�ts, whereas divi-dends are related to the maturity of a company and are thereforeused to distribute the gains considered stable over time. Jagan-nathan, Stephens, and Weisbach (2000) con�rm that repurchasesare more �exible than dividends. They show that more than 70percent listed companies do not complete the announced repurchaseprogram, moreover these �rms do not su�er any signi�cant marketdisadvantage.
In summary, dividends indicate the company's past performance,but its trend is not able to signal future pro�tability, as predictedby signaling theory (Benartzi, Michaely, and Thaler, 1997).
However, Roze� (1982) notes that �rms that increase dividendsshow a signi�cant decrease in systematic risk, vice versa �rms thatreduce dividends su�er a signi�cant increase in systematic risk. Be-sides, Roze� notes an improvement in bond ratings and a reductionin short-term investments and cash holdings for companies that in-crease dividends. In line with these results, Grullon, Michaely, andSwaminathan (2002) �nd a signi�cant relationship between the pay-out policy and the systematic risk of a company. They supposethat the variation in returns following the announcement of divi-dend payment may be associated with variation in the company'srisk pro�le. Indeed, they �nd that variations in returns linked to an-nouncements of dividend payment that persist over the long term arenegatively correlated with future variation in systematic risk. There-fore, they conclude that dividend payments facilitate investors, who
35

CHAPTER 1. LITERATURE REVIEW
learn about the variation in a company's risk pro�le only gradually,in equity pricing.
These results suggest the existence of �rms' transition from aphase of sustained growth to a phase of low growth. The maturitytheory, also called life-cycle theory,16 de�nes a negative relationshipbetween the pro�tability of a company and dividends. Accordingto this theory, �rms in an expansionary phase with strong invest-ment opportunities, tend to take advantage of periods of growth andtherefore, consider pro�ts as necessary resources to increase invest-ment and thus achieve higher revenues. On the contrary, maturecompanies face a decline in investment opportunities, a reductionin systematic risk and, consequently, greater availability of liquidresources that can be used to pay out dividends.
According to the life-cycle theory of dividends, DeAngelo, DeAn-gelo, and Stulz (2006) de�ne mature companies as those capableof self-�nancing, i.e., with a high ratio of retained earnings to eq-uity. They test the existence of �rm's life-cycles examining the re-lationship between the payout policy and the degree of maturity ofthe company and �nd a positive statistically signi�cant relationship,consistent with life-cycle theory. Systematic risk, therefore, plays animportant role in the de�nition of payout policy.
According to Venkatesh (1989), a �rm's speci�c risk componentalso a�ects the volatility of the �rm's payments, especially if dis-tributes dividends for the �rst time. In line, Grullon and Michaely(2012) discover the existence of an inverse relationship between thelevel of competition in the sector in which the company operates andthe payout policy. They �nd that companies in sectors with a lowerdegree of competition (i.e., low idiosyncratic risk) exhibit a lowerprobability of increasing dividends.
So, we can conclude that both systematic and speci�c risk in-�uence the payout policy, speci�cally an increase in dividends willresult in a reduction in business risk and vice versa.
16Mueller (1972).
36

1.7. CONCLUSION
1.7 Conclusion
This chapter aims to provide an overview of the di�erent strands ofcritical theories formulated to explain the payout policy. However,any theory nor empirical analysis completely explain the featuresof the optimal payout policy. The results of the empirical analysisare inconclusive, mixed, or contradictory. Frankfurter and Wood Jr(1997) observes that:
Dividend-payment patterns (or what is often referred to as �pay-out policy") of �rms are a cultural phenomenon, in�uenced by cus-toms, beliefs, regulations, public opinion, perceptions and hysteria,general economic conditions and several other factors, all in con-stant change, impacting di�erent �rms di�erently. Accordingly, itcannot be modeled mathematically and uniformly for all �rms at alltimes.
This is the starting point for the next chapter. We develop anoptimal payout policy model by considering all the previous resultsand paradigms to identify the relevant factors that collectively de-termine the manager's payout decisions.
37

CHAPTER 1. LITERATURE REVIEW
38

Chapter 2
Dynamic Discrete Choice
Model
Our goal in this chapter is to understand the behavioral processthat leads to the managers' choices. We begin by establishing thebases of stochastic discrete choice dynamic programming models,such as to formulate a parametric speci�cation of the utility functionof a generic manager who must choose the optimal dividend policy.Ultimately we conduct a counterfactual analysis to study the e�ectsderiving from the introduction of a subsidy on retained earnings, theso called allowances for corporate equity.
The objective of discrete choice analysis is to investigate thedecision-making process of an agent, de�ning the factors that collec-tively determine the agent's choice. Dynamic choice models di�erfrom static models in the speci�cation of the latent variable. Indeed,in dynamic models agents take into account the e�ect of their choiceand accordingly maximize their expected intertemporal utility. Instatic models, the latent variable is given by the di�erence betweenthe alternative single period utility, while in the case of dynamicmodels the latent variable is given by the di�erence between the
39

CHAPTER 2. DYNAMIC DISCRETE CHOICE MODEL
value functions given by the alternative choices. The value func-tions represent the expected value of future payo�s, and are givenby the solution to the dynamic programming problem.
The parameters to be estimated are de�ned as �structural� be-cause they describe the preferences and expectations of an agent andthe evolution of the state variables that characterize the model. Thetheory of revealed preferences provides the conditions such that it ispossible to estimate the parameters of interest through micro-dataon agent choices and state variables. Therefore, the choice modelsallow to empirically test the assumptions and the implications of atheoretical model through a simple interpretation of the parametersthat govern the Markov decision process. Moreover, these modelsrepresent useful tools for counterfactual analysis. Indeed, they areregularly used for the evaluation of the e�ects of the implementa-tion of speci�c public policy.1 Hence, this close link between eco-nomic theory and the econometric model provides new perspectivesfor the comprehension of controversial empirical issues. Among themost relevant works in the literature we mention Wolpin (1984) onchild fertility and mortality, Miller (1984) on occupational choices,Griliches, Pakes, and Hall (1986) on patent renewal, and Rust (1987)on machine replacement.2
However, in addition to the classic problems of any econometricchoice model (such as endogeneity, measurement errors, truncateddata, and permanent unobservable heterogeneity) the complexity ofthe estimation of structural dynamic programming discrete choicemodels is further complicated by computational issues. The es-timation of these models generally requires the use of algorithmswhere the solution to the dynamic programming problem is nestedwithin the maximization of the parameter's estimates. Therefore,the expected value function must be calculated for each point of thestate space. Clearly, with continuous state variables the problem ofdimensionality makes quite impossible the solution to the program-
1See Wolpin (1996).2See Aguirregabiria and Mira (2010).
40

2.1. PAYOUT POLICY MODEL
ming problem for every point of the state space. Instead, consideringa representation in a �nite state space, the size of the space growsexponentially with the number of state variables.3
Thus, the estimation requires that the dynamic programmingproblem is solved for each trial vector of parameters in order to ob-tain the solution for maximizing the estimation criterion (generallythe objective is to maximize the likelihood function). Hence, in somecase it is necessary to solve the programming problem thousands oftimes. Over the years, di�erent methodologies have been developedin order to reduce the dimensionality problem deriving from thecomputation of the expected value function for all the alternativeagent's options: the discretization of state variables, the approxi-mation and interpolation of the expected value function4, and therandomization of the Bellman equation5.
In the next section we introduce the reader to the basic structurefor this type of model, having in mind the �nal purpose of evalu-ating the dividend policy of a company listed on the stock market.Speci�cally, in the next section we evaluate the payout policy of amanager in a framework without uncertainty and considering onlythree periods.
2.1 Payout Policy Model
2.1.1 Three Periods without Uncertainty
In this section, we consider the optimal dividend policy problemfor a manager of a listed �rm. Assume the company's pro�ts areindependent on the number of companies active in the market. Thus,we are considering a �rm operating in a monopolistic or a perfectlycompetitive market. The optimal dividend policy problem consistsin a rational manager who must choose whether to settle a dividend
3This issue is referred as curse of dimensionality. See Bellman (1957).4See Kean and Woplin (1994).5See Rust (1997).
41

CHAPTER 2. DYNAMIC DISCRETE CHOICE MODEL
payment with shareholders or not.We develop a model with only three periods, where in the �rst
two periods the manager has to choose whether to payout a dividendor not, and in the third period the manager is forced to shutdownthe �rm and to payout the �rm's value to shareholders.
Among all the factors that in�uence the decision of the managerwe concentrate on the agency con�ict. Essentially, we assume thatthe manager is under shareholders pressure, who require the divi-dend payments to reduce the risk associated to the possibility thatthe manager wastes their wealth in unsuccessful projects. Moreover,we assume that the payment of a dividend represents a disutility forthe manager given by a lower resources availability.
For simplicity we assume that the manager is perfectly able toobserve the second period utility, conditional on the choice madein the �rst period. Let's de�ne with UD1 the manager's utility inthe �rst period whether the manager chooses to payout a dividendD, and with U0
1 the manager's utility in the �rst period in caseof no-dividend payment. UD2j indicates the utility obtained by themanager in the second period (with j = {D, 0}) in case the managerhas chosen to payout a dividend in the �rst period, and U0
2j de�nesthe manager's utility whether in the �rst period the manager haschosen to do not distribute a dividend. Considering the absenceof uncertainty about future impacts of manager's decision, we knowthat in the second period the manager will choose the dividend policythat provides the maximum utility, U j2 = maxj(U
jj2). Finally, U jj3is the manager's utility deriving from the �rm's liquidation in thethird period, which depends on the dividend policy in the previousperiods.
Therefore, assuming a time-separable utility, we can de�ne themanager's total expected utility (TEU) as:
TEUD = UD1 + βUD2 + β2UDj3
TEU0 = U01 + βU0
2 + β2U0j3
where TEUD and TEU0 are the total expected utility respectively
42

2.1. PAYOUT POLICY MODEL
in case the manager has chosen to payout a dividend in the �rstperiod or not, and β is the discount factor. Thus, the manager willchoose to pay a dividend if and only if TEUD > TEU0:
TEUD = UD1 + βUD2 + β2UDj3 > TEU0 = U01 + βU0
2 + β2U0j3
⇒ UD1 − U01 > β(U0
2 − UD2 ) + β2(U0j3 − U
Dj3 )
However, the researcher observes only a limited set of the factorsthat a�ect the manager's utility. Therefore, we need to decomposeeach manager's utility into an observed and unobserved part:
UD1 = uD1 + εD1
U01 = u01 + ε01
for the �rst period,
UDj2 = uDj2 + εDj2
U0j2 = u0j2 + ε0j2
for the second period, and
UDj3 = uDj3 + εDj3
U0j3 = u0j3 + ε0j3
for the last period.
Denoting with fε(ε) the density function for the vector of unob-served factors, ε = {εj1, ε
jj2 , ε
jj3 }, we can de�ne the probability of a
43
CHAPTER 2. DYNAMIC DISCRETE CHOICE MODEL
dividend payout in the �rst period as:
PD =Prob(TEUD > TEU0
),
=Prob[UD1 + βmax
j(UDj2) + β2UDj3 >
U01 + βmax
j(U0j2) + β2U0j
3
],
=Prob[uD1 + εD1 + βmax
j(uDj2 + εDj2 ) + uDj3 + εDj3 >
u01 + ε01 + βmaxj
(u0j2 + ε0j2 ) + u0j3 + ε0j3],
=
∫I[uD1 + εD1 + βmax
j(uDj2 + εDj2 ) + uDj3 + εDj3 >
u01 + ε01 + βmaxj
(u0j2 + ε0j2 ) + u0j3 + ε0j3
]f(ε)dε,
where I[·] is an indicator function which is equal to one when thestatement inside the parenthesis is true, and zero otherwise. TakingN di�erent draws from fε(ε) it is possible to compute the total ex-pected utility for the two choices and calculate the simulated choiceprobability as the average of the N values for the indicator function:PD =
∑n I
n/N . Clearly, a �myopic� manager (i.e., β = 0) willchoose the payout policy without taking into account the e�ects ofhis choice on future utility.6
In the next subsection we introduce uncertainty about futureimpacts of the current choices. For instance, assume the manageris no more able to perfectly foresee the state of the economy in thenext period. Moreover, we specify how to handle the dimensionalityproblem that arises from the introduction of greater realism into themodel.
6Therefore, the manager chooses to pay a dividend only if UD1 > U01 . Ac-
cordingly, it would be possible to compute the simulated probability of payinga dividend. See McFadden (1984).
44

2.1. PAYOUT POLICY MODEL
2.1.2 Three Periods with Uncertainty
In this subsection we assume that the manager is no more able topredict the transition of the state variables. Thus, the manager nolonger observes the utility of the second period conditional on the�rst-period choice, UD2j and U
02j ∀ j ∈ {0, D}.
Although the manager is not able to perfectly predict the re-alization of the state variables, we assume that he has subjectivebeliefs about the probability associated to a speci�c realization ofthese variables (i.e., the manager associates a probability to eachpossible realization of the state variables).
Therefore, we rewrite the second period utility as a function ofunknown factors e: UD2j(e) and U
02j(e). The variable e represents all
those factors that the manager does not observe in the �rst period,but will become known to the manager in the second period. Themanager ascribes a probability to each possible future realization ofthe factors that belong to the variable e. Therefore, we indicate withg(e) the density function for the unobservable variable e.
However, for any value assumed by e we know that in the secondperiod the manager will choose the policy that gives him the max-imum utility. For example, the second period manager's expectedutility in case he chooses to payout the dividend in the �rst period,can be written as: ∫
[maxj
(UD2j(e))]g(e)d(e).
Consequently, we can write the total expected utilities for the twodividend policies as:
TEUD = UD1 + β
∫[maxj
(UDj2 (e))]q(e)d(e) + β2UD3 (2.1)
TEU0 = U01 + β
∫[maxj
(U0j2 (e))]q(e)d(e) + β2U0
3 (2.2)
Thus, a rational manager will choose to payout a dividend in the�rst period only if TEUD > TEU0. In the second period, the
45

CHAPTER 2. DYNAMIC DISCRETE CHOICE MODEL
unobervable factors will be revealed and if the manager chose tosettle a dividend payment with shareholders in the �rst period, thenhe will choose to pay a dividend again only if UDD2 (e) > UD0
2 (e),where e is the realized value of e.
Therefore, for the researcher a further complication is addedgiven by the impossibility to observe the manager's distributionfunction, g(e). The solution to this problem is given by the spec-i�cation of a parameterization of the probability, h(e|θ), assumingthat for the true values of θ the two density functions are equivalent:h(e|θ∗) = g(e). As a consequence, the probability that a managerpayouts a dividend is now given by:
PD =Prob(TEUD > TEU0),
=
∫I
[uD1 + εD1 + β
∫ {maxj
(uDj2 (e) + εDj2 (e)
)+
+ β(uDj3 (e) + εDj3 (e)
)}h(e|θ)d(e)
)>
u01 + ε01 + β
∫ {maxj
(u0j2 (e) + ε0j2 (e)
)+
+ β(u0j3 (e) + ε0j3 (e)
)}h(e|θ)d(e)
)]f(ε)dε.
We could approximate this probability through multiple drawsfor ε from fε(ε) and for e from he(e|θ) simulating the inside in-tegral within the simulation of the outside integral, and averagingthe results for the indicator function I[·]. However, the computa-tional burden becomes extremely severe as the dimension of statesincreases.7
In order to handle the dimensionality problem, in the next sub-sections we introduce the conditional independence assumption pro-posed by Rust (1987). Moreover, assuming the manager has anin�nite lifetime, we specify a parametrization of the manager's util-ity function and describe the assumptions needed to estimate theparameters of the utility and the density he(e|θ).
7See Train (2009).
46

2.1. PAYOUT POLICY MODEL
2.1.3 In�nite Horizon with Uncertainty
In the previous subsections we introduced the basic concepts of thediscrete choice dynamic programming models in a simple three pe-riods framework. In this subsection, we further extend the modelassuming an in�nite horizon choice model. Hence, the time evolvesdiscretely and it is indexed by t, for t = 0, ..., T , with T =∞.
Again, we assume that �rms' pro�ts are independent relativeto the number of active companies in the market (i.e., consider adynamic model of monopolistic competition). Therefore, we focuson the optimal dividend policy problem of a rational manager. Everyperiod the manager decides whether to keep inside the company thefree-cash �ow without making a dividend payment (d = 0), or topayout a dividend (d = 1).
The manager chooses the dividend payout policy to maximizethe expected and discounted stream of current and future valuesof his utility function. Once again, we assume that the manager'spreferences are represented by a time-separable function. There-fore, the manager's preferences are given by an in�nite discountedsum of a state-dependent utility function
∑Tt=0 β
tU(dt, xt, et), whereβ ∈ (0, 1) is the discount factor, U(dt, xt, et) is the utility functionat time t, xt represents the state variables that the manager ob-serves, and et represent the unknown factors that becomes knownto the manager after his choice. We specify the managers' beliefson the evolution of future values of the state variables by a Markovtransition distribution function F (xt+1, et+1|xt, et, dt).
Blackwell's Theorem establishes that under very general condi-tions the solution to a Markovian decision problem exists and isunique.8 The solution to the dynamic model takes the form of adecision rule that relates the state variables to the manager's choice{dt = ft(xt, εt)
Tt=0} that speci�es the agent's optimal action dt in
state (xt, εt). The function δ = {d = f(x, e)} de�nes the opti-mal agent's decision rule and is considered deterministic. Namely,conditional on the realizations of x and e, and observing the man-
8Blackwell (1965).
47

CHAPTER 2. DYNAMIC DISCRETE CHOICE MODEL
ager's beliefs, then the manager's choice will be completely deter-minable.9 By Bellman's �principal of optimality�, we can separatethe manager's current decision-making from the future decision pro-cess. Using the recursive expression, we de�ne the value function ofthe dynamic programming problem by:
V (x, e) = maxd∈{0,1}
{U(d, x, e)+β
∫V (x′, e′)dF (x′, e′|x, e, d)
}, (2.3)
accordingly, the optimal decision rule is given by:
δ(d, x, e) = arg maxd∈{0,1}
{U(d, x, e) + β
∫V (x′, e′)dF (x′, e′|x, e, d)
}.
(2.4)From a causal perspective, our objective is to analyze the man-
ager's decision process by de�ning the factors that jointly cause themanager's choice. Unfortunately we are able to observe only a lim-ited set of variables that in�uence the manager choice, as a conse-quence the choice of the manager cannot be exactly predicted. Aswe have seen in the previous paragraph, the computational burden isvery high, especially in a framework with uncertainty and in�nitelylived �rms/managers.
The dynamic conditional logit model �rst advocated by Rust(1987) provides a large gain in computational feasibility, allowingthe estimation of the structural parameters in the manager's pref-erences, transition probabilities, and the discount factor. The in-tuition behind the Rust model is to consider the factors that theagent/manager observes only after he took his choice, as the samefactors that the researcher does not observe either before or afterthe agent's decision.
In the next section we state the assumptions entailed by thedynamic programming conditional logit model, and we specify theestimation strategy for the primitive structural parameters.
9Notice that we omitted the time subscripts. In an in�nite-horizon frame-work we assume that the dynamic problem is stationary. Therefore, the optimalpolicy rule and the corresponding value function are time invariant.
48

2.2. MLE ESTIMATION FOR DDC MODEL
2.2 MLE Estimation for DDC Model
In this section we de�ne the assumptions so that it is possible toobtain a closed form of the conditional choice probability.
Indicate with the variable x the vector of observable factorswithin the data set (i.e. �rm's and market's demographics, �rm'sfree-cash �ow, and the dividend policy of the previous period), andwith the variable ε the vector of unobservable factors for the re-searcher. As in the section 2.1.3, de�ne with θ the vector of struc-tural parameters for the utility function and the transition of x, andwith li(θ) the log-likelihood function for manager i. Accordingly, themanager's decision problem is then to choose a sequence of payoutdecision rules δ = {d = f(x, ε, θ)} to maximize the expected anddiscounted stream of current and future values of his lifetime utility.
Assumption 1. The unobservable state variables are indepen-dently and identically distributed over agents, alternatives, and time.The CDF Fε(ε) has �nite �rst moments and is continuous and twicedi�erentiable in ε. Speci�cally, we assume that the shocks εt havean extreme value type I distributions centered around 0.
Assumption 2. Assume that the unobservable state variablesε(d) enter additively in the manager's utility function. They can bethought as transitory shocks to the manager's utility.
Given these assumptions we can rewrite the Bellman's equationfrom the researcher perspective as:
Vθ(x, ε) = maxd∈{0,1}
{u(d, x, θ) + ε(d) + βEVθ(d, x, ε)
}, (2.5)
with the function EVθ(x, ε, d) de�ned by:
EVθ(d, x, ε) ≡∫y
∫η
Vθ(y, η)p(dy, dη|x, ε, d, θ), (2.6)
where the expectation is taken with respect to the transi-tion density for the controlled stochastic process {x, ε} de�ned
49

CHAPTER 2. DYNAMIC DISCRETE CHOICE MODEL
by the decision rule δ(x, ε) ∈ D(x) and the transition densityp(x′, ε′|x, ε, d),D(x) represents the �nite choice set of payout policygiven x.10 Blackwell's theorem states that the sequence of decisionrules {δt, δt+1, δt+2, ...} is stationary and Markovian, so the agent'soptimal decision rule depends only on the current values of the statevariables, and is determined by �nding the alternative payout policythat provides the maximum in Bellman's equation. Speci�cally, theoptimal time-invariant policy rule is given by:
δ(x, ε, θ) = arg maxd∈{0,1}
{u(d, x, θ) + ε(d) + βEVθ(d, x, ε)
}. (2.7)
Our objective is to �nd the vector θ∗ that maximizes the sum ofthe log-likelihood for the N managers selected from a random sam-ple. In particular, the sample likelihood function is derived from theconditional choice probabilities P (d|x), which are obtained from theagents' optimal decision rule by integrating out over the unobservedstate variable ε given fε(ε|x). However, since ε is a continuouslydistributed on RS , where S = #D(x), the approximation of (2.7) iscomputationally unattainable. Moreover, from the last equation no-tice that ε enters nonlinearly in the unknown conditional value func-tion EVθ, therefore the computation of P (d|x) requires to integratethe value function with respect to the density p(xt+1, εt+1|xt, εt, dt)to solve the Bellman's equation (2.5). Rust proposed the followingconditional independence assumption on the Markovian transitionprobabilities to alleviate the computational burden:
Assumption 3. The future realizations of the observable statevariables are independent of the present unobservable factors condi-tional on the current choice and realization of the observable statevariables. That is: p(xit+1|xit, εit, dit) = p(xit+1|xit, dit). This as-sumption implies that the joint probability of the state variables canbe written as:
p(xit+1, εit+1|xit, εit, dit) = p(xit+1|xit, dit)q(εit+1|εit). (2.8)
10In the bivariate case: D(x) ∈ {0, 1}
50

2.2. MLE ESTIMATION FOR DDC MODEL
The additive separability and the conditional independence as-sumptions are su�cient to guarantee that the conditional choiceprobability is positive for all possible parameters: P (d|x, θ) > 0.As Rust (1987) noted, this result is equivalent to say that the set{ε|d = δ(x, ε)} has positive probability under q(dε|x).11 Under theassumptions 2 and 3 it's possible to write again the Bellman equa-tion:
V (x, ε) = maxd∈(0,1)
[υ(x, d) + ε(t)] (2.9)
with
υ(x, d) ≡ u(x, d) + β
∫x
∫ε
V (x′, ε′)q(dε|x′)p(dx|x, d). (2.10)
Therefore, it is possible to reach the same structure of staticdiscrete choice problems, the only di�erence is the value functionυ that substitutes the single period utility function u as argumentof the conditional choice probability. The optimal decision rule δ isgiven by
δ(x, ε) = arg maxd∈(0,1)
[υ(x, d) + ε(d)], (2.11)
where υ is the solution to the dynamic programming problem.The conditional choice probability P (d|x) can be de�ned in terms ofthe social surplus function:12
G([υ(x, d) + ε(d)]|x) =
∫maxd∈(0,1)
[υ(x, d) + ε(d)]q(dε|x), (2.12)
11Rust (1987) de�nes saturated a speci�cation for unobservables if does notexists a combination of choice and state variables that contradicts the DDPmodel for any value of ε.
12See McFadden (1981) to go deeply in the de�nition and properties of thesocial surplus function.
51

CHAPTER 2. DYNAMIC DISCRETE CHOICE MODEL
taking the partial derivative of G with respect to υ(x, d)
∂G([υ(x, d) + ε(d)]|x)
∂υ(x, d)=
∫ (∂maxd∈{0,1}[υ(x, d) + ε(d)]
∂υ(x, d)
)q(dε|x)
=
∫I{d = arg max
d′∈(0,1)[υ(x, d′) + ε(d′)]}q(dε|x)
= P (d|x).
(2.13)
Hence, the conditional choice probability P (d|x) will be equal tothe partial derivative of G with respect to the unique �xed point υ.The assumption 3 of conditional independence allows us to deter-mine the �xed point υ, avoiding having to integrate over the entirestate space (x, ε). Hence, the controlled process {xt, εt} is Markovianwith transition probability:
Pr{dxt+1, dt+1|xt, dt} = P (dt+1|xt+1)p(dxt+1|xt, dt). (2.14)
Thus, substituting the 2.9 into 2.10 we can rewrite the equationfor υ as:
υ(x, d) = u(x, d) + β
∫x
∫ε
maxd∈(0,1)
[υ(x, d) + ε(d)]q(dε|x′)p(dx|x, d)
= u(x, d) + β
∫x
G([υ(x′, d′), d′ ∈ {0, 1}|x′]p(dx|x, d).
(2.15)
With the assumption 1 we assumed that the unobservable statevariable {εt(dt)} follows an i.i.d. bivariate extreme value process.Therefore, we can write the conditional choice probability as:
P (d|x) =exp{υ(x, 0)}∑
d∈{0,1} exp{υ(x, d)}, (2.16)
52

2.2. MLE ESTIMATION FOR DDC MODEL
where υ is the unique �xed point to the contraction mapping Ψ:
Ψ(υ)(x, d) = u(x, d) + β
∫x
log
[ ∑d∈{0,1}
exp{υ(x, d)}
]p(dx|x, d).
(2.17)
Given these assumptions we obtain a closed-form expression forG(·) and P (·), and we can de�ne the estimation criterion for thestructural parameters of the controlled process {xt, dt}. We assumedthat the observable state variables (x) have a discrete and �nite sup-port, and from the initial values x0 they follow a �rst-order Markovchain with transition probability matrix Π.13 Lastly, we de�ne thelikelihood function for N independent managers:
N∏i=1
`(x, d|x0, d0, θ) =
N∏i=1
T∏t=1
P (dit|xit, θ)p(xit|xit−1, dit−1). (2.18)
We employ the nested �xed point (NFXP) algorithm to esti-mate the parameters of the model. The NFXP algorithm proposedby Rust (1987) involves a 3-stage procedure that yields consistent,asymptotically normal and e�cient estimates. In the �rst stage wenonparametrically estimate the partial likelihood for the transitionof the observable state variable. In the second stage we estimate thevector Θ of parameters of the utility function using the �rst stageestimate as if we knew the true process of x:
Θp = arg max
N∏i=1
T∏t=1
P (dit|xit, θ). (2.19)
As showed, we need to solve the discrete decision problem ateach likelihood function evaluation. The third stage consists inone more Newton-Raphson iteration on the full likelihood function
13With element pj,k representing the conditional probability of moving fromstate j to state k, pi,j = Pr[xt+1 = j|xt = i].
53

CHAPTER 2. DYNAMIC DISCRETE CHOICE MODEL
`(x, d|x0, d0, θ) using as starting values the estimates of the �rst twostages.14
The next subsection provides a parametric speci�cation of themanager's preferences such that we are in the position to estimatethe structural parameters governing the dividend payout policy.
2.2.1 Speci�cation of Manager's Preferences
In this section we specify the parametric structure of the utility func-tion for a representative rational manager, so as to identify the set ofprimitives (u, p, β) of the MDP. The construction of the theoreticalmodel re�ects constraints relative to computational feasibility andavailability of good data.
In the literature review we have seen that signaling motives andagency costs are identi�ed as the main causes of dividend policychanges. Indeed, Roze� (1982), Jensen (1986), and La Porta et al.(2000b), consider that dividend payments represent a tool to reduceagency costs. Asquith and Mullins Jr (1983) �nd that dividend ini-tiations have a positive announcement e�ect on stock prices. Theresearchers conclude that investors interpret dividend initiations asgood news in terms of �rm growth opportunities, thus they put apremium on the stocks of dividend payers versus non-payers. Con-sistently, Baker and Wurgler (2004) argue that managers cater toinvestors by initiating dividends, and they show results in favor ofthis theory. Moreover, according to Michaely, Thaler, and Wom-ack (1995b), �rms that omit dividend payments are characterizedby negative excess returns.
Consequently, we examine whether the entry bene�t and exitcost are able to explain the widely established smoothed behavior ofdividends. In particular, we test whether managers behave �myopi-cally� or take into account the e�ects on future periods of the policychosen in the current period.
Although our partial equilibrium model does not endogenously
14Rust (1994).
54

2.2. MLE ESTIMATION FOR DDC MODEL
incorporate shareholders and investors reactions to the manager'sdividend policy we assume that managers' beliefs are coherent withthe standpoint that investors always reward companies that dis-tribute dividends, and vice versa they punish companies that stopdistributing dividends. This assumption is consistent with the em-pirical evidences on manager-shareholders agency con�ict, dividendinitiations and omissions.
Therefore, our model incorporates these factors that simulta-neously a�ect the managers' decisions. Speci�cally, we allow forthree features in the manager's utility function: the entry bene�t forinitializing a dividend payment; the exit cost of omitting dividendpayouts; the agency con�ict between manager and shareholders. Ar-guably, in this way it is possible to explain the managers' reluctanceto modify the dividend policy.
Basically, we present a model where every period a rational man-ager wants to minimize the disutility of agency cost deciding whetherpayout a dividend or not. Thus, the expected one-period utilityfunction for manager i is given by:
u(xt, ε, dt, θ) =
{−θ01yt − θ02at − θ03kt + εt(0) if dt = 0
− θ11yt + θ12(1− kt) + εt(1) if dt = 1
(2.20)
where yt is the free-cash �ow at the beginning of time t, and atrepresents the number of periods since last dividend payment. Theinclusion of the i.i.d. error term (εt(dt)) in the manager's utilityfunction controls for exogenous factors that a�ect the payout plans.
The term at is included in the agency cost function consistentlywith life-cycle theory of dividends, where managers of more matureand pro�table companies face higher agency costs of cash reten-tion.15 The state variable kt ≡ dt−1 is an indicator of the manager'schoice in the previous period, which is equal to �1� if the managerchose to payout the dividend. What follows is a discussion on the
15See Denis and Osobov (2008) for international evidence supportive ofagency-cost based on dividend lifecycle theory.
55

CHAPTER 2. DYNAMIC DISCRETE CHOICE MODEL
interpretation of the parameters we are going to estimate.
The parameter θ01 is the agency con�ict disutiltiy of the managerwhen he decides not to pay dividends. We assume that shareholdersobserve yt at beginning of the period, thus the shareholders-managercon�ict is proportional to the free-cash �ow level.16 The parameterθ11 captures the disutility of paying dividends, representing the man-ager's agency cost to commit �nancial resources. We assume thatthe disutility of paying dividends is decreasing with respect to thefree-cash �ow level at beginning of the period, consistently with Bravet al. (2005) who �nd that managers consider dividends less �exiblethan repurchases and provide dividend payments only when they canbe sustained. The parameter θ03 in (2.22) is the lump-sum cost of adividend omission, (i.e., dt = 0 and kt = 1). Speci�cally, this param-eter measures the sunk cost e�ect extensively documented by socialscientists (see Thaler, 1980 and Staw, 1981): once having committedto a course of action, the decision maker sticks to the same policydespite he discovers new information that indicates that continuingthe earlier commitment would likely result in worse consequencesthan switching.17 Finally, the parameter θ12 is the entry gain ofinitiating an enduring dividend program, (i.e., dt = 1 and kt = 0).
In order to estimate the vector θ∗ that maximizes the sum of thelog-likelihood for the N managers, we �rstly estimate the transitionprobabilities for the observable state variables, then we employ themethod of successive approximations to compute the �xed pointV ∗. Once computed the �xed point, we may establish the optimaldecision rule δ(x, ε).
In the next section we describe the selection method for the com-panies in our sample and we provide descriptive statistics for thevariables of interest.
16We specify this structure of the agency costs consistently with the �ndingsof DeAngelo, DeAngelo, and Stulz (2006). In particular, they �nd a highlysigni�cant relation between the decision to pay dividends and the earnings tototal assets ratio.
17Kanodia, Bushman, and Dickhaut (1989).
56

2.3. ESTIMATION ANALYSIS
2.3 Estimation Analysis
In this section we describe the sample and de�ne the set of observablestate variables. Furthermore, we provide estimates for the transitionprobabilities and the speci�cation of the manager's utility functionthat characterize the dividend policy. Finally, through the DCDPmodel, we estimate the primitives for the manager's decision rule,δ(x, ε).
2.3.1 The Sample Data
The data are taken from the Orbis database compiled by the Bureauvan Dijk (BvD) which provides detailed accounting information ofmore than 10 million companies worldwide.
In this section we focus on listed �rms located in the Euro-areafor the period 2009-2017. Given the assumption of homogeneityamong �rms, we focus on French and German companies, as therespective countries are the most similar economies among thosewithin the monetary union.18 We excluded from the sample thecompanies that report one or more missing values in the dividendvariable in the time-span considered. Moreover, we removed fromthe sample all the �nancial �rms and those �rms that experienced ex-ceptional liquidity events (e.g. capital increase, management buy-inor buy-out, mergers and acquisitions, initial public o�ering, privateequity and venture capital �nancing). Lastly, we dropped those �rmsthat exhibit extraordinary variation in the main observable statevariable, return to asset (ROA) index.19 The �nal sample consistsof 473 companies, Table 2.1 and 2.2 shows descriptive statistics.
18Despite the Italian economy shares several aspects with the French andGerman economies, we excluded Italian companies as in 2011 the Italian gov-ernment implemented a reform that likely changed the managers' preferences.We investigate the Italian case in the next chapter.
19We removed those �rms that for at least one year are below the 1st per-centile and above the 99th percentile of the ROA year-di�erences distribution.
57

CHAPTER 2. DYNAMIC DISCRETE CHOICE MODEL
Table 2.1: Summary Statistics
Mean Median Std.Dev.
EBITDA 9.33% 10.00% 0.13Equity 43.52% 4.60% 0.38Fix. 47.97% 46.26% 0.21Mrkt Cap 105.06% 64.00% 3.26Dividends 1.76% 0.89% 0.04
Note: Summary statistics refer to the period
2009-2017 for 473 �rms located in France and
Germany. All the variables are scaled by �rm's
total assets.
The Orbis dataset provides an indicator of ownership indepen-dence based on the percentage of shares outstanding owned by asingle shareholder. Table 2.2 presents the companies' distributionby ownership indicator. In particular, a �rm is indicated with �A� ifare not recorded shareholders that directly or indirectly own morethan 25% of shares outstanding. The �rms indicated with �B� donot present a shareholder with more than 50% direct or indirectownership, but one or more shareholders are recorded with morethan 25% direct or total ownership. Finally, the �rms in the group�D� have one shareholder with a direct ownership of over 50%. TheTable 2.2 con�rms the predictions of the agency theory. In fact,companies with greater shareholders dispersion distribute dividendsmore frequently.
In the next subsection, we estimate the conditional probabilitydistribution for the state xt+1 at time t+ 1 conditional on the cur-rent state (xt) and plan (dt). Then we present the estimates ofthe parameter vector θ. In the basic model we consider the binarychoice to distribute the dividend or not. In order to di�erentiatethe dividend omission cost, in subsection 2.3.4 we extend the modelallowing for more payout policies.
In both models we consider two sub-samples based on the indica-
58

2.3. ESTIMATION ANALYSIS
tor of share ownership dispersion. Consistently with Roze� (1982),we expect that the agency cost estimates monotonically increasewith respect to the dispersion indicator.
Table 2.2: Choice Distribution: Owner-ship Dispersion
Indep. Indicator d = 0 d = 1 Total
A−B 834 1,502 2,336C −D 531 917 1,448
Total 1,365 2,419 3,784
Note: The observation are divided by the
ownership concentration identi�er and the
yearly payout policy.
2.3.2 Estimation of the Manager's Beliefs
In this section we estimate the transition probabilities of the statevariables yt and at. The two variables are assumed to be discrete,therefore we estimate the transition matrix (Π) for the joint distri-bution of the observable state variables.
The decision period is assumed to be a year. The discrete decisiondt is the manager's �plan� regarding dividend payment at the endof the year, that is revised at one-year time intervals. The statevariables xt refer to the manager's state at beginning of the year.Speci�cally, the variable y is computed as the earnings to total assetsratio, while the variable a is the number of periods since the lastdividend payment. We discretized the variable y into 20 intervals ofequal length. We assume that the transitions of y from t to t + 1follows a �rst-order Markov process. at follows a clear deterministicdistribution and it is discretized into 30 intervals, with amax = 30as absorbing state.20
20at = T means that the company does not pay dividends for T consecutive
59

CHAPTER 2. DYNAMIC DISCRETE CHOICE MODEL
The Rust's conditional independence assumption implies that thetransition probability of the vector of observable state variables xtis:
p(xt+1|xt) ≡ p(yt+1, at+1|yt, at, dt). (2.21)
We nonparametrically estimate this joint transition probabilityusing the corresponding sample relative frequencies for the grid val-ues of xt and dt. In particular, we compute a frequency estimate ofthe Markov transition matrix from the transition data:
pij = Prob(xt = j|xt−1 = i)
=nij∑ms=1 nis
,
where nis is the number of times that the process moved from statei to s, and the denominator is the number of transitions out of statei.
The conditional independence assumption ensures that the ex-pected value function is also independent with respect to unobserv-able state variables, i.e. EVθ(x, ε, d) = EVθ(x, d).
Given the discretization of yt and at, the �xed point EV (·) iscomputed as an element of the Banach space B = R20x30.
With the estimate of p(xt+1|xt) and EV (·), we are in the positionto estimate the vector of parameters θ by the two stage algorithm.
2.3.3 Estimation of the Manger's Utility Func-
tion
We formalize the revealed preference problem as a problem of sta-tistical inference. The null hypothesis is that the data {d, x} arerealizations of a controlled stochastic process generated from the so-lution to a stochastic dynamic programming problem with utilityfunction u that depends on a vector of unknown parameters θ. The
periods. If the manager chooses to payout the dividend at time t (dt = 1), nextyear state is equal to one (at+1 = 1).
60

2.3. ESTIMATION ANALYSIS
underlying preferences u are �uncovered� by �nding the parametervector θ that maximizes the likelihood function for the sample ofdata. The associated log-likelihood function is:
L(θ) =
480∑i=1
8∑t=1
[I(dit = 0)log
(exp0(·)
exp0(·) + exp1(·)
)+
+ I(dit = 1)log
(exp1(·)
exp0(·) + exp1(·)
)]with exp0(·) = exp
(−θ01y − θ02at − θ03kt + βEV (x′|x, d = 0)
),
and exp1(·) = exp
(−θ11yt
+ θ12(1− kt) + βEV (x′|x, d = 1)
).
We do not directly estimate β because is highly collinear withthe preference parameters.21 However, as usual in dynamic modelsestimation, we establish subjective discount factor β via grid search:we start maximizing the likelihood function at β = 0 and use theseestimates as initial values for estimations with higher values of β.
Table 2.3 presents estimates of the utility function with discountfactor β = 0.95, and separately for the group of �rms with owner-ship dispersion indicator (A-B) and (C-D). The maximum likelihoodestimates are statistically signi�cant. The predictions provided bythe agency theory are con�rmed. The pool of �rms with higherownership dispersion (A-B) show higher cost of cash retention withrespect to �rms with low ownership dispersion (C-D). Table 2.3 pro-vides the �Heterogeneity test� that assess the equality of the agencycost parameters between the two groups of �rms. The data rejectthe hypothesis that the structural coe�cients (θ01) are the same for�rms groups (A-B) and (C-D).
The estimates obtained �xing the discount rate at zero (β = 0)provides the �myopic test�, as suggested by Rust (1987). Basically,with β = 0 the manager chooses to payout the dividend evaluatingthe single period utility only. Comparing the estimations with β = 0and β = 0.95, we can asses whether the manager takes in considera-tion the e�ect on the future of the current choice. Table 2.3 provides
21See Rust (1994).
61

CHAPTER 2. DYNAMIC DISCRETE CHOICE MODEL
the likelihood ratio test with the null hypothesis of equality betweenthe two models. We rejected the null and conclude that the dynamicmodel explains the data better than the static model.
The χ2 goodness-of-�t statistic provides an overall test of thenull hyphothesis that the econometric model is correctly speci�ed,(Rust, 1994). The test assesses whether managers are rational, inthe sense of acting �as if� they were solving the speci�ed dynamicprogramming problem. If the data appear to be consistent withthe dynamic programming model, the estimated model can be usedto forecast the e�ect of policy changes such as the introduction ofa reform. In our model, the χ2 has 35 degrees of freedom (thenumber of relevant cells (20 × 2) minus the numbers of parameters4 minus one), and it is equal to 3.6. Thus, it may be concluded thatstatistically our model describes the data well.
The next subsection provides the estimation results allowing themanager to choose among �ve dividend policies.
62

2.3. ESTIMATION ANALYSIS
Table 2.3: Structural Estimates for the Agency Cost
Function
Parameter Estimate Std Error
Firm's ownership indicator: A-Bθ01 (agency cost) -0.0799 0.0033θ02 (time) -1.5419 0.7820θ03 (d = 1 → d = 0) -2.7193 0.1328θ11 (opport. cost) -0.8870 0.0811
Firm's ownership indicator: C-Dθ01 (agency cost) -0.0610 0.0038θ02 (time) -1.0224 0.5312θ03 (d = 1 → d = 0) -2.7620 0.1550θ11 (opport. cost) -0.6232 0.0960
β = 0.95
Heterogeneity Test: (A-B) vs (C-D)LR Statistic (df = 4) 20.54
�Myopia� Test: β=0 vs β=95LR Statistic (df = 1) 23.56 28.64
χ2 (df = 35) = 3.621
Note: the covariance matrix is computed by inverting the infor-
mation matrix for the partial likelihood function 2.19.
2.3.4 Dividend Policy with Multiple Options
In this subsection we increase the manager's dividend policy options.Expanding the set of manager's options gives us the possibility todistinguish between dividend payout reductions and omissions, andbetween dividend payout increases and initiations. Therefore, thechoice variable is no more binary but we consider d as the dividendfree-cash �ow ratio, and the manager has the possibility to chooseamong �ve di�erent policies.
63

CHAPTER 2. DYNAMIC DISCRETE CHOICE MODEL
Grullon and Michaely (2004) note that the reaction of the marketis proportional to the entity of the variation in dividends or sharerepurchases. Indeed, more the dividend di�ers from the expectedone, stronger the impact on the share price. The model with multipleoptions re�ects the Grullon and Michaely evidence in the manager'sutility function.
Basically, we split the dividend payout ratio (computed as thedividend to equity ratio) in �ve intervals of the same length. Thesingle period utility function for the manager becomes:
u(xt, ε, dt; θ) =
−θ01y − θ02at +4∑j=1
θ03jI{dt = 0, kt = j}+ εt(0)
if dt = 04∑i=1
5∑j=1
− θ1iyt− θ1ij + εt(i)
if dt = i
(2.22)where I{·} is an indicator function that de�nes the transitions
of the dividend policy from t − 1 to t. In case the dividend policydoes not change from a period to the subsequent we assume that thelump-sum cost or bene�t are equal to zero.
For the estimation procedure of the DPDC model nothingchanges except the computational cost which increases considerably.The Table 2.4 presents the estimates. We see that our predictionsare con�rmed also by providing more �exibility to the manager'schoice.
In the next chapter we use the structural estimates obtainedin the two versions of the dividend payout model to simulate theprobability of paying a dividend to the introduction of the so-called�Allowances for Corporate Equity�, (ACE). The ACE (also knownas Notional Interest) is a tax system able to equalize the tax treat-ment between debt and equity at the corporate level. We brie�yexplain the ACE tax system. Then, we evaluate the impact of theACE relief on Italian companies. Indeed, in 2011 Italian governmentimplemented the ACE regime. Finally, through the DPDC model,
64

2.3. ESTIMATION ANALYSIS
we simulate the variation of the probability to payout a dividend fordi�erent percentages of the ACE relief.
Table 2.4: Structural Estimates for the Agency Cost Func-
tion
Firm's ownership indicator: A-B C-D
θ01 (agency cost) -0.0282 -0.0252(0.0034) (0.0044)
θ11 (opp. cost) -1.6117 -0.8140(0.1722) (0.1881)
θ12 (opp. cost) -1.4276 -1.4841(0.1672) (0.1863)
θ13 (opp. cost) -2.6300 -4.3164(0.2535) (0.4547)
θ14 (opp. cost) -1.8348 -1.6413(0.2234) (0.2071)
θ02 (time) -1.7135 -1.5420(1.022) (0.9561)
θ031 (d = 0, k = 1) -3.5852 -3.8690(0.5517) (0.9290)
θ032 (d = 0, k = 2) -5.5929 -5.9137(0.4316) (0.5820)
θ033 (d = 0, k = 3) -7.1369 -7.7413(0.4091) (0.6591)
θ034 (d = 0, k = 4) -8.2632 -9.6813(0.4351) (0.6075)
θ110 (d = 1, k = 0) 0.0000 0.0000(0.5169) (0.8792)
θ112 (d = 1, k = 2) -2.7612 -3.4968(0.5921) (0.9082)
θ113 (d = 1, k = 3) -5.5096 -6.9193(0.6562) (1.1509)
65

CHAPTER 2. DYNAMIC DISCRETE CHOICE MODEL
θ114 (d = 1, k = 4) -6.7009 -7.8273(0.5968) (0.7832)
θ120 (d = 2, k = 0) 0.8058 1.0239(0.3608) (0.5439)
θ121 (d = 2, k = 1) 0.0000 0.0000(0.5928) (0.9096)
θ123 (d = 2, k = 3) -2.6820 -2.9922(0.3582) (0.5886)
θ124 (d = 2, k = 4) -5.4121 -5.8109(0.4422) (0.5858)
θ130 (d = 3, k = 0) 1.7898 2.4207(0.2587) (0.4195)
θ131 (d = 3, k = 1) 0.0000 0.0000(0.7953) (1.3137)
θ132 (d = 3, k = 2) 0.0000 0.0000(0.4229) (0.5800)
θ134 (d = 3, k = 4) -2.3675 -2.8289(0.1932) (0.3572)
β = 0.95
Heterogeneity Test:(A-B) vs (C-D)LR Statistic (df = 35) 15.33
�Myopia� Test: β=0 vs β=95LR Statistic (df = 1) 34.65 37.21
χ2 = 4.978
Note: Standard errors in parentheses.
66
Chapter 3
Case Study: The ACE
Tax Regime
In almost all developed economies we �nd a tax system that allowsthe deductibility of interest payments, while equity returns are fullytaxed. This tax discrimination between debt and equity generatesthe so-called debt bias, that is an excessive use of leverage by com-panies. In countries with weak equity markets and strong expositionto debt this distortion can make the entire economy extremely vul-nerable to business cycle downturns, in fact the failure of multiplecompanies could cause signi�cant damage to the �nancial system.1
In 2011 the Italian government, within the �scal policy packageaimed at limiting the �nancial and sovereign debt crisis of the lastdecade, enforced a tool to limit the equity-debt distortion: the Al-lowances to Corporate Equity (ACE) tax regime. The ACE systemprovides for a tax relief calculated by applying a notional interestrate to a net equity base.2 The ACE base is determined as the
1See De Mooij (2012) for an extensive discussion on the e�ects of debt biason the �nancial sector.
2The ACE notional rate was set at 3% for the �rst three years of the program,
67

CHAPTER 3. CASE STUDY: THE ACE TAX REGIME
positive variation of equity occurred since the end of the year 2010.The relevant variation in equity for the computation of the ACEbase is determined as the sum of contributions in cash from share-holders and the retained earnings that increment reserve provisions(except non-distributable reserves) minus voluntary distributions toshareholders and reductions due to anti-avoidance rules.3
Intuitively, the implementation of the ACE regime should havestraightforward consequences on the corporate dividend policy. In-deed, we expect that those Italian companies that are used to dis-tribute dividends to interrupt dividend payments in order to takeadvantage of the subsidy. Furthermore, those companies that havenot paid any dividend in the previous year, we expect they do notinitialize a dividend payment after the 2011 ACE reform.
In this chapter, we �rst estimate the impact of the ACE re-lief on Italian companies' dividend decisions with a reduced formequation. Then, in a structural estimation framework, we simulatethe manager response for di�erent values of the ACE relief. Thestructural estimation provides a useful environment to achieve thispurpose since we can explicitly solve the optimization problem anddetermine a new optimal decision rule.
3.1 Empirical Predictions of the Dividend
Literature
In this section of the chapter we brie�y reviews the predictions on thedeterminants of corporate dividend policy provided by the empiricaldividend literature. Based on these �ndings, we develop a model inreduced form that allows us to correctly estimate the impact of the
and to 4%, 4.5%, 4.75%, 1.6% and 1.5% for the years 2014, 2015, 2016, 2017,and 2018 respectively.
3The anti-avoidance rule aims at eliminating the �cascade e�ects� of taxreliefs. Therefore, if shareholders injects new equity in a company and thiscapital is again transferred to a subsidiary, then only the subsidiary bene�ts ofthe tax relief.
68

3.1. EMPIRICAL PREDICTIONS OF THE DIVIDEND
LITERATURE
ACE subsidy taking into account all the speci�c determinants thata�ect dividend decisions.
Based on the literature review made in the �rst chapter, we pro-vide a list of the relevant predictions for the speci�cation of theregression model that we employ in the next section:
1. Firms that have higher uncertainty about future earnings tendto payout none or lower dividends, indeed Jensen, Solberg, andZorn (1992) report a negative relation between business riskand dividend policy supporting this hypothesis.
2. Myers (1984) and Myers and Majluf (1984) hypothesizethat companies �nance their investments through a hierarchyamong funding resources. According to this theory internalfunds are the main source of �nancing, thus dividend paymentsare negatively related to �rm's investment opportunities.
3. According to Bhattacharya (1979), Miller and Rock (1985),and John and Williams (1985) initiations and increases of div-idend payments signal an improvement in the company's prof-itability. Therefore, there is a positive relationship betweenpro�tability and the dividend payments.
4. According to Jensen and Meckling (1976) and Jensen (1986),debt and dividend policies are the most relevant mechanismsto regulate agency costs of free-cash �ow. Hence, the dividendliterature predicts a negative relationship between debt policyand the dividend payments.
The following sections describe the methodology used in thischapter of the thesis. First of all, the sample data is explained,subsequently the variables, and the models are presented, lastly theresults from the estimations are shown and commented.
69

CHAPTER 3. CASE STUDY: THE ACE TAX REGIME
3.2 The ACE Implementation in Italy
The purpose of this section is to investigate the sample data em-ployed in order to test the research hypothesis after the implementa-tion of the ACE regime in Italy. In order to achieve this purpose thenext section proposes a Di�erences-in-Di�erences (DiD) approachto obtain casual estimates of the ACE policy change that a�ectedItalian �rms since the end of 2011. We compare Italian �rms af-fected by the reform before and after and �rms from the Euro-areauna�ected by this reform. We need to assume that the �rms in thetwo groups are subject to the same time trends such that the DiDapproach estimates the e�ect of the ACE reform. For this reason werestrict the analysis to companies located in countries very similar toItaly, speci�cally we chose France and Germany. Among the coun-tries belonging to the eurozone, we selected France and Germany onthe basis of the companies distribution by economic sectors, nominalgross domestic product, and dividend on equity ratio of these coun-tries. Figure 3.1 shows the average dividends time series comparingItaly with France and Germany.
Figure 3.1: Average Dividends Time Series
050
000
1000
0015
0000
2000
00M
ean
2008 2010 2012 2014 2016 2018year
France Italy
050
000
1000
0015
0000
2000
00M
ean
2008 2010 2012 2014 2016 2018year
Germany Italy
The two �gures con�rm the assumption of common trend beforethe implementation of the ACE reform. The source of the data is
70

3.2. THE ACE IMPLEMENTATION IN ITALY
the Orbis database that contains detailed accounting and �nancialinformation. Following the related literature we excluded those �rmsoperating in the �nancial and utilities sector. We consider the 2009-2017 period and we exclude from the sample those �rms with missingvalues in the dividend variable in any of the selected years, and those�rms that during this period experienced relevant liquidity eventssuch as: acquisition, initial public o�ering, institutional buy-out,management buy-in and buy-out, private equity and venture capital�nancing. The sample selection criteria result in a panel data set of555 non-�nancial companies: 209 French, 306 German and 40 Italiancompanies.
Table 3.1: Summary Statistics: Dividends
Country Mean Median Std.Dev. Obs.
France 130.3 2.7 509.2 1,881Germany 73.6 1.0 344.5 2,754Italy 127.5 2.9 584.4 360
Total 98.9 1.6 434.0 4,995
Note: Summary statistics refer to 559 �rms over the
period 2009-2017. Values are expressed in millions
of euros.
Table 3.1 and 3.2 present some descriptive statistics for the div-idend variable for each country. The tables show that these com-panies pay very high dividends both in absolute terms and withrespect to the amount of liquid assets. However, from the Table 3.2it is possible to note that on average Italian companies started toreduce the dividend payments since the year 2012. As can be seenfrom Table 3.3, the reduction in dividends is not a consequence ofa reduction in earnings, in fact the average earnings to liquid assetsratio remains stable over the period. These data con�rm that dueto changes in the Italian corporate tax system Italian �rms haveprogressively reduced the dividend payouts. However, it seems that
71

CHAPTER 3. CASE STUDY: THE ACE TAX REGIME
Table 3.2: Dividend Payout
France Germany Italy
Div. D.P.R. Div. D.P.R. Div. D.P.R.
2009 118.3 3.69% 39.5 2.49% 174.4 5.07%2010 116.8 4.21% 58.9 4.02% 174.9 5.07%2011 127.4 3.65% 68.4 4.05% 186.3 5.42%2012 130.3 4.40% 70.8 4.21% 179.3 5.23%2013 130.3 3.44% 69.2 3.92% 157.7 4.60%2014 131.7 3.09 % 75.0 4.19% 145.5 4.00%2015 139.9 2.88% 85.8 4.28% 129.3 3.93%2016 141.7 2.93% 90.2 4.05% 0.00 0.00%2017 151.0 3.21% 100.4 3.92% 0.00 0.00%
Note: The table reports the time series of the average dividend
payout in millions of euros and the average dividend payout ratio.
The dividend payout ratio is given by the dividend payment divided
by the total equity at the beginning of the year.
Italian companies have needed to take time to adjust their dividendpolicies. We believe that the di�culty of Italian �rms to adjusttheir dividend policy is mainly due to the high costs resulting froma sudden reduction of the dividend payout ratio.
3.3 Econometric Models and Results
In this section, we estimate the impact of the ACE reform on thedividend payout policy of Italian �rms. Intuitively, since dividendpayouts reduce the net equity base for the calculation of the subsidy,Italian companies that regularly payout a dividend before the imple-mentation of the ACE reform should signi�cantly reduce their div-
72

3.3. ECONOMETRIC MODELS AND RESULTS
Table 3.3: Earnings
France Germany Italy
Earnings to Earnings to Earnings toLiquid Assets Liquid Assets Liquid Assets
Ratio Ratio Ratio
2009 1.22 1.52 1.262010 1.42 1.62 1.282011 -2.73 1.36 1.282012 1.00 1.37 1.272013 0.91 1.34 1.252014 1.13 1.25 1.262015 0.18 0.77 1.252016 0.98 1.34 1.272017 1.29 1.31 1.30
Note: The table reports the time series of the average
of EBITDA at the end of the year plus liquid assets at
the beginning of the year divided by liquid assets at the
beginning of the year.
idend payments.4 Moreover, �rms that omitted dividend paymentsbefore the reform should not initiate a dividend payment after theimplementation of the ACE reform.
We employ the identi�cation strategy for the direct e�ect of theACE subsidy on the dividend payout policy of Italian companies.Namely, we assume a linear model for dividends:
yit = α+ β2Italyi + β3Postt ⊗ Italyi + xitβββ + τt + εit, (3.1)
where i and t index companies and years respectively. The em-pirical speci�cation in equation (3.1) is implemented to measure the
4The Italian companies could bene�t from the subsidy without limitations.However, the reform states that the subsidy cannot exceed the net worth of thecompany existing at the end of the tax year.
73

CHAPTER 3. CASE STUDY: THE ACE TAX REGIME
impact of the ACE allowance both on the dividend level and thedividend payout ratio.5 The dummy Post is �1� for the period afterthe implementation of the ACE regime and zero otherwise. WhileItaly is a dummy variable equal to unity for Italian companies andzero otherwise. Therefore, the coe�cient β3 for their interaction(Postt⊗ Italyi) is �1� for Italian companies in the post-ACE reformperiod and �0� otherwise, and it measures the e�ect of the ACEsubsidy on Italian companies.
Following Fama and French (2001), the basic equation (3.1) in-cludes a vector 1 × K of explanatory variables (x) to control forpossible confounding factors. Clearly, to each dependent variable isassociated a speci�c vector of regressors x.
Namely, considering the dividend level as dependent variable,the vector x includes the level of earnings (Earnings) to controlfor �rm's pro�tability, the level of current liabilities (CurrentLiab.)and net debt (NetDebt) to control for the �rm's debt policy, andthe �rm's market capitalization (MarketCap) to capture in�uencesof the �nancial markets on �rm's dividend policy. Moreover, weinclude net assets (NetAssets) and equity (Equity) to control forthe �rm's size, and retained earnings (RetainedEarn.) to capturethe company's propensity to keep �nancial assets inside the �rm.Lastly, we added year dummies to control for time-varying factorssuch as macroeconomic dynamics that a�ect �rms' dividend policy.
On the other hand, when we consider the dividend payout ra-tio as dependent variable the vector x includes the return on asset(ROA) that is given by the ratio of net earnings to total assetsand accounts for �rms' pro�tability. Following Parkinson (1980) weproxy the business risk for each company with the stock returnsvolatility (Ret.V ol.) of the �rm, which is computed as the standarddeviation of the log-returns calculated as the di�erence between thehighest, the lowest, and the closing log-price minus the open log-price for every year from 2009 to 2017. We add the market-to-book
5The dividend payout ratio is measured as the ratio of the dividend levelpaid to shareholders in a year on the equity level at the beginning of the sameyear.
74

3.3. ECONOMETRIC MODELS AND RESULTS
ratio (M/B) to control for �rms' investment opportunities. Theratio of cash and equivalents to total liquid assets (Liq.Ratio) isadded to capture the �rm's highly liquid assets disposal, on theother hand, we capture the �rm's �exibility with the ratio of �xedassets on total assets (FixedAss.Ratio). The ratio of total debt tototal assets (Debt Ratio) to account for �rms' debt policy, the ratiobetween retained earnings and liquid asset (RE) is added to measurethe �rm's propensity to accumulate �nancial resources, moreover weadded year dummies (τt).
Table 3.4 presents the estimation results considering the dividendlevel as dependent variable, while Table 3.5 shows the estimates con-sidering the dividend payout ratio as dependent variable. The tablespresent regressions with and without �rm �xed e�ects. Furthermore,the estimates of the ACE relief e�ect are una�ected by the decisionto pool French and German companies considering a unique con-trol group. Thus, we chose to separately compare them with Italiancompanies. In the �rst two columns, we consider France as a com-parison country, while in the third and fourth columns we considerGerman companies as a comparison group.
In the regressions without �rms �xed e�ects, we also includeda set of dummy variables to control: for age; ownership dispersion;industry e�ects. The age dummies are added to capture �rms' �ma-turity�.6,7 The ownership dispersion (OD) dummy is added to con-trol the e�ect of the manager-shareholders con�ict on the dividendpolicy.8 Lastly, industry dummies are included in the vector of re-
6Grullon, Michaely, and Swaminathan (2002) proposed the maturity hy-
pothesis which suggests that stable dividend increases signal the �rm's life cyclechange, in particular they signal a transition to a more mature phase.
7The companies were divided into four groups based on the year in which theinitial public o�ering (IPO) took place. Speci�cally, the age group 1 includescompanies that submitted the IPO in the years after 2005; the age group 2includes the companies that submitted the IPO between the years 2000 and2005; the age group 3 includes the companies that submitted the IPO betweenthe years 1995 and 2000; and the age group 4 includes companies that submittedthe IPO before 1995.
8The Orbis database provides an indicator of the ownership dispersion. A
75

CHAPTER 3. CASE STUDY: THE ACE TAX REGIME
gressors x in case some industries rely more on dividend paymentsthan others.
The estimates consistently suggest a negative e�ect of the ACEreform on dividends.
During the 2009-2011 period, the average payout of Italian com-panies is 178.5 million euros, while the average payout ratio is5.18%.9 Given the DiD estimates, Italian companies paid on av-erage 30,000 euros in dividends less than French companies, whichrepresents about 16.8%
(30,056.937178,500 × 100
)of the pre-treatment pe-
riod average amount. Besides, Italian companies paid 48,000 eurosin dividends less than German companies, which represents about23.3%
(48,115.928178,500 × 100
)of the pre-ACE reform period amount. On
the other hand, following the implementation of the ACE reform,the dividend payout ratio decreased by about 1.8 p.p. (percentagepoints) relative to French companies, and by about 2.5 p.p. relativeto German companies.
Considering the lowest ACE rate we calculate that Italian com-panies have bene�ted from a tax relief equal to 901,708.11 euros(30,056,937×3%), or 1,443,477.84 euros (48,115,928×3%) depend-ing whether we consider France or Germany as comparison country.If Italian companies had not paid dividends in the years following thereform they could have bene�ted from an overall tax relief of about18 million euros.10 Therefore, Italian companies have renouncedon average to an ACE relief of about 17 million euros, in the pe-riod 2012-2017. This result supports the theoretical hypothesis that
�rm is classi�ed with �A� if are not recorded shareholders that directly or in-directly own more than 25% of shares outstanding. A �rm is classi�ed with�B� if it is not recorded a shareholder that directly or indirectly owns more than25% of shares outstanding, but one or more shareholders are recorded with morethan 25% direct or total ownership. A �rm is classi�ed with �C� or �D� if thereis a shareholder that directly or indirectly owns over 50% of shares outstand-ing. Given this classi�cation the dummy variable OD is equal to �1� if a �rm isclassi�ed with �A� or �B�, and zero otherwise.
9These data are taken from Table 3.2.10We applied the ACE rate to the dividends actually paid during the period
2012-2017.
76

3.3. ECONOMETRIC MODELS AND RESULTS
public listed companies face substantial sunk cost following a suddenomission of dividend payments.
The model estimations are signi�cant at the 1% level as evi-denced by the F-statistic reported at the bottom of the tables. Mostof the results found in the literature are con�rmed. We observe apositive e�ect of the earnings, indicating that �rms with higher prof-itability present a higher dividend level and dividend payout ratio.Moreover, we �nd a negative e�ect of returns volatility on dividendpayouts con�rming that higher uncertainty negatively a�ects thedividend payout ratio. The estimates of the coe�cient for the netdebt variable are positive, con�rming that a negative debt positionenhances agency con�icts between bondholders and shareholders re-sulting in lower dividend payout ratios. However, the results forthe e�ect of the growth opportunities (captured by the market tobook ratio coe�cient) are contradictory with respect to the litera-ture. Although, the market-to-book ratio (or Tobin's q) is also usedas a proxy for many other variables such as corporate performance,intangibles, the quality of management, agency problems, and �rmvalue. Thus, its value as a proxy for growth opportunity remainsunclear.11 The age-dummies con�rm that young companies have alower dividend payout ratio. Moreover, the dummy for the owner-ship dispersion con�rms the e�ectiveness of agency theory, indeedcompanies with higher share ownership dispersion tend to distributehigher dividends.
In order to capture the dynamic e�ects of dividend policy andto control for autocorrelation, we consider a lagged dependent vari-able (LDV) model by adding the lagged value of dividends in theright-hand side of the equation (3.1).12,13 The results for the LDVestimation are reported in Table 3.6 and 3.7. In both tables, we ob-
11Adam and Goyal (2008).12Such models are often referred to as partial adjustment models.13Lintner (1956) assumes that shareholders prefer steady dividend payments.
Therefore, Lintner developed a model where the manager determines the levelof dividend based on the deviation of past dividends from the optimal dividendlevel.
77

CHAPTER 3. CASE STUDY: THE ACE TAX REGIME
serve that the lagged dependent variable represents the main driverfor determining both the current dividend level and the current div-idend payout ratio. Estimates of the impact of the ACE subsidyremain negative and statistically signi�cant when we consider thedividend payout ratio as dependent variable.
As evidenced by Nickell (1981) the limited availability of yearsdetermines bias in the LDV model, especially when we add �rms�xed e�ects. Indeed, due to the demeaning operation, the lagged de-pendent variable cannot be independently distributed with respectto the error term. We employ a System Generalized Method of Mo-ments (GMM) estimator to deal with this issue.14 The results forthe System-GMM estimation model are reported in Table 3.8. Thisestimator derives from a system of two simultaneous equations: onein levels with lagged �rst di�erences as instruments, and the other in�rst di�erences with lagged levels as instruments. Following Rood-man (2009) advises, we employ small-sample adjustments, orthogo-nal deviations, and two-step robust standard errors.15
Arellano and Bond (1991)'s test is provided at the bottom ofthe table and it checks for serial correlation. If the model is wellspeci�ed then we expect to not reject the null hypothesis of no auto-correlation of the second order (AR(2)). The tests support the modelspeci�cations. Moreover, the Table 3.8 presents the Hansen (1982)overidenti�cation test (J statistic) for the validity of instruments,where under the null hypothesis the over-identifying restrictions arevalid. The high p-values for both comparison groups suggest thatthe instruments are exogenous, therefore valid.
As a further robustness check, we focus on the likelihood to pay-
14See Blundell and Bond (1998).15With small-sample adjustments t test statistic are applied instead of z test
statistic for the coe�cients, and F test instead of Wald X2 test for the overall�t of the model. Moreover, we use the "forward orthogonal deviations" (Arel-lano and Bover, 1995) subtracting all future available observations of a variableinstead of subtracting the previous observation from the contemporaneous one.Lastly, the estimation for the System-GMM estimator is performed with thetwo-step robust standard errors that provide Windmeijer (2005)'s �nite-samplecorrection for the two-step covariance matrix.
78

3.3. ECONOMETRIC MODELS AND RESULTS
out a dividend, accordingly we consider as dependent variable a bi-nary variable that is equal to �1� if the company has paid a dividendduring the year and zero vice versa. Here we brie�y describe thevariables employed in order to test the research hypotheses.
Logit(yit) = α+ β2Italyi + β3Postt ⊗ Italyi + xitβββ + τt + εit.(3.2)
Table 3.9 presents the estimates of the log odds for this spec-i�cation model. The estimator for the DiD dummy is once againsigni�cantly di�erent from zero and negative, therefore the ACEsubsidy had a statistically signi�cant impact on the likelihood ofItalian �rms of paying out a dividend.
Hence, we conclude that the ACE regime had a negative impacton the dividend payout ratio and more generally on the likelihoodof paying a dividend. The evidences suggest that companies didnot fully exploit the tax bene�ts provided by the ACE reform. Therigidity of the dividend policy of Italian companies is in line withprevious evidences on the e�ectiveness of sunk costs deriving froma sudden omission of dividend payouts. Through a back-of-envelopecalculations we provided a lower-bound of the agency and signalingcost the manager's decisions.
In the last section, we simulate the response of a manager to theintroduction of a tax relief as the ACE regime using the estimatedmanager's preference parameters obtained from the estimation of thedynamic programming discrete choice model in the previous chapter.The objective is to simulate how the subsidy can reduce or eliminatethe cost of varying the dividend policy.
79

CHAPTER 3. CASE STUDY: THE ACE TAX REGIME
Table 3.4: Di�erence-in-Di�erences Analysis
Empirical Di�erence-in-Di�erences
Model:
Dependent Dividend Level
Variable:
Comparison France Germany
Country:
Italy 24382.1∗ 41536.7∗∗
(13463.0) (16885.7)
Post⊗Italy -30056.9∗∗ -28409.1∗∗ -48115.9∗∗ -23529.5∗
(14985.6) (12827.9) (20810.7) (12353.8)
Earnings 0.122∗∗∗ 0.170∗∗∗ 0.116∗∗∗ 0.128∗∗∗
(0.021) (0.013) (0.029) (0.034)
Current Liab. -0.010∗∗∗ 0.016 -0.001 -0.014(0.004) (0.010) (0.005) (0.012)
Net Debt -0.018∗ 0.017 -0.009∗∗ 0.001(0.009) (0.013) (0.004) (0.008)
Market Cap. 0.012∗∗∗ 0.003 0.016∗∗∗ 0.005∗
(0.002) (0.004) (0.002) (0.003)
Net Assets -0.181∗∗∗ -0.093∗∗∗ -0.186∗∗∗ 0.029(0.040) (0.030) (0.057) (0.020)
Equity 0.201∗∗∗ 0.088∗∗∗ 0.173∗∗∗ 0.006(0.040) (0.023) (0.061) (0.023)
Retained -0.027∗∗ -0.011∗∗ 0.003 -0.021∗∗∗
Earn. (0.013) (0.005) (0.004) (0.006)
OD 22900.6∗∗∗ 4985.2(5048.881) (4026.211)
Age-Group 1 -2480.0 35236.3∗∗∗
(7056.4) (8307.0)
Age-Group 2 -5857.9 35080.3∗∗∗
(7929.9) (8049.7)
Age-Group 3 16045.3∗∗ 17946.3∗∗
(7076.6) (7808.0)
80

3.3. ECONOMETRIC MODELS AND RESULTS
Constant 4885.0 -16117.2 -17174.8 -10059.2(9720.9) (26332.1) (11007.4) (15130.2)
Year Yes Yes Yes YesIndustry Yes - Yes -Firm Fixed - Yes - YesE�ects
No. of Obs. 1808 1808 2501 2501R-Squared 91% 55% 91% 63%F-Statistic 117.53∗∗∗ 362.41∗∗∗ 60.58∗∗∗ 194.04∗∗∗
LR X2 547.87∗∗∗ 144.23∗∗∗ 761.09∗∗∗ 111.51∗∗∗
Note: The table reports the di�erence in di�erences estimates of the
ACE subsidy. t statistics are reported in parentheses, and ∗, ∗∗, ∗∗∗
stand for signi�cance at the 1%, 5%, and 10% levels respectively.
The independent variables are one-year lagged. The models are
tested with White's corrected heteroscedasticity robust regressions.
81

CHAPTER 3. CASE STUDY: THE ACE TAX REGIME
Table 3.5: Di�erence-in-Di�erences Analysis
Empirical Model: Di�erence-in-Di�erences
Dependent Var.: Dividend Payout Ratio
Comparison France Germany
Country:
Italy 0.016∗∗ 0.018∗∗
(0.007) (0.007)
Post⊗Italy -0.018∗∗ -0.017∗∗ -0.025∗∗∗ -0.026∗∗∗
(0.007) (0.007) (0.008) (0.007)
ROA 0.001∗∗ 0.000∗ 0.000 -0.000(0.000) (0.000) (0.000) (0.000)
Ret. Vol. -0.032∗∗∗ 0.005 -0.044∗∗∗ -0.001(0.012) (0.013) (0.007) (0.005)
M.B. Ratio 0.006∗∗ 0.004 0.000 0.000(0.003) (0.003) (0.000) (0.000)
Liq. Ratio 0.009 0.032∗ 0.031∗∗∗ 0.024(0.010) (0.018) (0.009) (0.022)
Fixed Ass. -0.000∗∗∗ -0.000 -0.000∗∗∗ -0.000Ratio (0.000) (0.000) (0.000) (0.000)
Debt Ratio 0.001∗ 0.000 0.000∗ 0.000(0.000) (0.000) (0.000) (0.000)
RE Ratio 0.009∗∗∗ 0.000 0.000∗∗∗ 0.000(0.002) (0.005) (0.000) (0.000)
Age-Group 1 -0.008∗∗ -0.010∗∗∗
(0.004) (0.004)
Age-Group 2 -0.008∗ -0.000(0.004) (0.004)
Age-Group 3 -0.010∗∗∗ -0.005(0.003) (0.004)
OD 0.015∗∗∗ 0.005(0.002) (0.003)
Constant 0.024∗∗∗ 0.032∗∗∗ 0.023∗∗∗ 0.035∗∗∗
(0.007) (0.005) (0.006) (0.006)
82

3.3. ECONOMETRIC MODELS AND RESULTS
Year Yes Yes Yes YesIndustry Yes - Yes -Firm Fixed - Yes - YesE�ects
No. of Obs. 1776 1776 2464 2464R-Squared 9% 3% 6% 2%F-Statistic 10.85∗∗∗ 4.06∗∗∗ 6.59∗∗∗ 2.52∗∗∗
Note: The table reports the di�erence in di�erences estimates of the
ACE subsidy. t statistics are reported in parentheses, and ∗, ∗∗, ∗∗∗
stand for signi�cance at the 1%, 5%, and 10% levels respectively.
The independent variables are one-year lagged. The models are
tested with White's corrected heteroscedasticity robust regressions.
83

CHAPTER 3. CASE STUDY: THE ACE TAX REGIME
Table 3.6: Di�erence-in-Di�erences with Lagged Dependent
Variable
Empirical Di�erence-in-Di�erences
Model:
Dependent Dividend Level
Variable:
Comparison France Germany
Country:
Italy 12334.9 6178.5(12778.2) (9951.1)
Post⊗Italy -20279.1 -25808.7∗∗ -22305.1 -14389.2(12702.3) (11775.0) (14600.0) (10693.1)
Earnings 0.064∗∗ 0.148∗∗∗ 0.025 0.083∗∗
(0.031) (0.024) (0.036) (0.034)
Current Liab. -0.003 0.012∗ 0.005∗ -0.013(0.004) (0.007) (0.003) (0.009)
Net Debt -0.014 0.015 -0.003 -0.000(0.009) (0.014) (0.002) (0.006)
Market Cap. 0.008∗∗∗ 0.002 0.008∗∗∗ 0.004∗∗
(0.003) (0.004) (0.003) (0.002)
Net Assets -0.123∗∗∗ -0.088∗∗∗ -0.052∗∗ 0.028∗
(0.039) (0.024) (0.023) (0.015)
Equity 0.132∗∗∗ 0.088∗∗∗ 0.039∗ -0.003(0.041) (0.020) (0.023) (0.017)
Retained Earn. -0.022∗ -0.012∗∗ -0.000 -0.021∗∗∗
(0.013) (0.005) (0.003) (0.003)
OD 14501.9∗∗∗ -484.4(4673.2) (1842.4)
Age-Group 1 -3133.7 11763.5∗∗
(6100.1) (5861.0)
Age-Group 2 -3957.5 8855.7(5240.3) (5500.2)
Age-Group 3 6502.2 6524.2
84

3.3. ECONOMETRIC MODELS AND RESULTS
(7249.7) (4972.0)
Lag. Div. 0.476∗∗∗ 0.166 0.729∗∗∗ 0.388∗∗∗
(0.144) (0.223) (0.105) (0.067)
Constant 8001.2 -17221.1 7469.6 -212.7(7897.1) (24309.5) (6631.3) (11386.4)
Year Yes Yes Yes YesIndustry Yes - Yes -Firm Fixed - Yes - YesE�ects
No. of Obs. 1808 1808 2501 2501R-Squared 93% 57% 96% 69%F-Statistic 335.99∗∗∗ 567.71∗∗∗ 283.20∗∗∗ 364.27∗∗∗
LR X2 547.87∗∗∗ 144.23∗∗∗ 761.09∗∗∗ 111.51∗∗∗
Note: The table reports the di�erence in di�erences estimates of the
ACE subsidy. t statistics are reported in parentheses, and ∗, ∗∗, ∗∗∗
stand for signi�cance at the 1%, 5%, and 10% levels respectively.
The independent variables are one-year lagged. The models are
tested with White's corrected heteroscedasticity robust regressions.
85

CHAPTER 3. CASE STUDY: THE ACE TAX REGIME
Table 3.7: Di�erence-in-Di�erences with Lagged Dependent
Variable
Empirical Di�erence-in-Di�erences
Model:
Dependent Dividend Payout Ratio
Variable
Comparison France Germany
Country:
Italy 0.009 -0.001(0.006) (0.005)
Post⊗Italy -0.015∗∗ -0.016∗∗∗ -0.008 -0.018∗∗∗
(0.006) (0.006) (0.005) (0.005)
ROA 0.000 0.000∗ -0.000 -0.000(0.000) (0.000) (0.000) (0.000)
Ret. Vol. -0.007 0.010 -0.004 0.003(0.013) (0.015) (0.004) (0.005)
M.B. Ratio 0.003 0.003 -0.000 0.000(0.002) (0.003) (0.000) (0.000)
Liq. Ratio 0.005 0.027 0.010∗ 0.018(0.010) (0.018) (0.006) (0.019)
Fixed Ass. Ratio -0.000 -0.000 -0.000∗∗ -0.000(0.000) (0.000) (0.000) (0.000)
Debt Ratio 0.000 0.000 0.000∗∗ 0.000(0.000) (0.000) (0.000) (0.000)
RE Ratio 0.004∗∗∗ -0.001 0.000∗∗∗ 0.000(0.001) (0.004) (0.000) (0.000)
Age-Group 1 -0.005 -0.003(0.004) (0.002)
Age-Group 2 -0.003 0.000(0.004) (0.002)
Age-Group 3 -0.007∗∗ -0.001(0.003) (0.002)
OD 0.007∗∗∗ 0.002
86

3.3. ECONOMETRIC MODELS AND RESULTS
(0.002) (0.002)
Lag. D.P.R. 0.519∗∗∗ 0.183∗∗ 0.801∗∗∗ 0.367∗∗∗
(0.127) (0.074) (0.051) (0.088)
Constant 0.010 0.025∗∗∗ 0.008∗ 0.023∗∗∗
(0.007) (0.007) (0.004) (0.006)
Year Yes Yes Yes YesIndustry Yes - Yes -Firm Fixed - Yes - YesE�ects
No. of Obs. 1776 1776 2460 2460R-Squared 28% 6% 62% 13%F-Statistic 22.47∗∗∗ 5.68∗∗∗ 31.36∗∗∗ 6.86∗∗∗
Note: The table reports the di�erence in di�erences estimates of the
ACE subsidy. t statistics are reported in parentheses, and ∗, ∗∗, ∗∗∗
stand for signi�cance at the 1%, 5%, and 10% levels respectively.
The independent variables are one-year lagged. The models are
tested with White's corrected heteroscedasticity robust regressions.
87

CHAPTER 3. CASE STUDY: THE ACE TAX REGIME
Table 3.8: Dynamic Panel Data Estimation
Empirical Model: System-GMM
Dependent Var.: Dividend Payout Ratio
Comparison France Germany
Country:
Italy 0.008 0.003(0.006) (0.006)
Post⊗Italy -0.013∗∗ -0.012∗∗
(0.005) (0.006)
ROA 0.000 0.000(0.000) (0.000)
Ret. Vol. -0.019∗∗ -0.013(0.009) (0.010)
M.B. Ratio 0.003 -0.000(0.004) (0.000)
Liq. Ratio 0.004 0.012(0.010) (0.008)
Fixed Ass. Ratio -0.000∗∗ -0.000(0.000) (0.000)
Debt Ratio 0.001∗ 0.000(0.000) (0.000)
RE Ratio 0.009 -0.000(0.007) (0.000)
OD 0.007∗∗ 0.002(0.003) (0.002)
Age-Group 1 -0.005 -0.004(0.004) (0.003)
Age-Group 2 -0.004 -0.000(0.005) (0.003)
Age-Group 3 -0.006 -0.001(0.005) (0.003)
Lag. D.P.R. 0.450∗∗∗ 0.630∗∗∗
(0.133) (0.162)
88

3.3. ECONOMETRIC MODELS AND RESULTS
Constant 0.025∗∗ 0.024∗∗
Year Yes YesIndustry Yes Yes
No. of Obs. 1776 2460F-Statistic 9.98 23.99
Arellano-Bond testfor AR(1): 0.013 0.004for AR(2): 0.118 0.596
Hansen overidentifying testProb > chi2 = 0.116 0.486
Number of instruments29 29
Note: The table reports the estimates for the system-GMM
model. t statistics are reported in parentheses, and ∗, ∗∗, ∗∗∗
stand for signi�cance at the 1%, 5%, and 10% levels respectively.
The models are tested with two-step robust standard errors.
89

CHAPTER 3. CASE STUDY: THE ACE TAX REGIME
Table 3.9: Panel Logit Estimation
Empirical Model: Panel Logit
Dependent Var.: Dividend Payout Ratio
Comparison France Germany
Country:
Post 0.246 0.356(0.387) (0.280)
Post⊗Italy -2.093∗∗∗ -2.831∗∗∗
(0.811) (0.771)
ROA 0.098 0.309(0.075) (0.280)
Ret. Vol. 0.296 -0.321(0.648) (0.615)
M.B. Ratio 0.270 0.768∗∗∗
(0.413) (0.293)
Liq. Ratio 2.219∗ -0.321(1.322) (0.890)
Fixed Ass. Ratio 0.017 -0.040(0.036) (0.038)
Debt Ratio -0.207 0.018(0.178) (0.050)
RE Ratio 1.011 1.634∗∗
(1.391) (0.804)
Lag. D. 1.887∗∗∗ 1.553∗∗∗
(0.247) (0.181)
Fixed E�ects Yes Yes
No. of Obs. 705 1027LR chi2(15) 207.07∗∗∗ 187.94∗∗∗
Note: The table reports the logit estimates with �rms �xed
e�ects. t statistics are reported in parentheses, and ∗, ∗∗, ∗∗∗
stand for signi�cance at the 1%, 5%, and 10% levels respectively.
The models are tested with two-step robust standard errors.
90

3.4. COUNTERFACTUAL ANALYSIS OF TAX RELIEF
3.4 Counterfactual Analysis of Tax Relief
Policy forecasts very often require a �structural� approach that at-tempts to uncover the underlying preferences u, di�erently from thetraditional �reduced-form� approach which can be viewed as uncov-ering the historical stochastic process for {dt, xt}. The issue relatedto reduced-form methods is that policy changes induce managers tore-optimize, yielding a new controlled stochastic process for {dt, xt},generally di�erent from the historical process of the previous policyregime.16 The structural approach instead allows us to solve thedynamic programming problem under a new policy regime and toderive the predicted stochastic process for {dt, xt}.
We evaluate the impact of a policy change on the conditionalprobability to payout dividends consistent with the ACE tax relief .
First of all, we provide further evaluation of the DP model di-rectly comparing the nonparametric estimates of the actual condi-tional choice probability P (d|x) to the nonparametric estimates of
the simulated conditional choice probability P (d|x, θ). Given thediscreteness of the state and control variables, the nonparametricestimate of P is simply the sample histogram of choices made by�rms whose state is x. The conditional choice probability functionP (d|x, θ) for the dynamic programming model is computed as fre-quency estimator from the simulated series of managers' choices. Tosimulate the manager choices and calculate the conditional choiceprobability, we implemented the same estimation procedure pro-vided in Section 2.3.3.17
We calculate the expected utility at time t and the expecteddiscounted utility net of ε(d) for each choice d, earning level x, andfor the state dependence deriving from the choice of the previousperiod. Then, using the method of successive approximations wecompute the �xed points υ of the Bellman operator Ψ (Equation2.17), that converges linearly and globally to a speci�c tolerance
16See Marschak (1953) and Lucas (1976).17Speci�cally, we estimate the parameters of the manager's utility function
pooling the sample, thus not considering the ownership dispersion indicator.
91

CHAPTER 3. CASE STUDY: THE ACE TAX REGIME
level.18
Once computed the di�erences in the expected discounted utilityfor all (x, d) ∈ X × {0, 1}, we simulate the dividend policy for N�rms and T periods. We settle N = 1, 000 for a time-horizon often years (T = 10). We consider homogeneous companies, thereforeadding one more year is equivalent to adding one more �rm forthe estimation. Furthermore, we assume that dividend choices areindependent of the company's investment policy and the dividendpolicies of other companies on the market.19
The observable state variable (xt) is a stationary ergodic process,and we assume that the �rst-period dividend payout equals to zero:d0 = 0. Hence, we draw the �rst period earnings (xi1) from thestationary probability P∞k = limt→∞Pr(xit = x).
Hence, we simulate N choices for the �rst period. Speci�cally,we randomly draw the values of εi1(1) and εi1(0) and comparethem with the di�erence in the utilities U(xi1, 1) and U(xi1, 0). If∆U(xi1, 0) > −∆εi1 then we set di1 = 1; otherwise, di1 = 0. Then,N new values of xit are simulated using the transition probabilitymatrix Π. Therefore, we iteratively proceed adding new rows andultimately forming the T x N matrix of earnings histories, and theT x N matrix of dividend policy histories.
Figure 3.2 compares the actual and simulated conditional choiceprobability for each cell in x. We observe that the DP model canreplicate the dividend choice frequencies of the sample, providingfurther validation. Hence, we are con�dent in the validity of themodel's predictions, so we proceed to exploit the features of thestochastic dynamic programming model.
We aim to investigate the sensitivity of the payout conditionalprobability to di�erent levels of tax relief. Therefore, we add to themanager's utility function a tax relief (τ) on dividend payments.Equation (3.3) shows the new speci�cation for the manager's utilityfunction.
18We set the maximum tolerance level to 1 ∗ 10−10.19Thus, dividend policy of �rm i is not a�ected by the dividend policy of �rm
j.
92
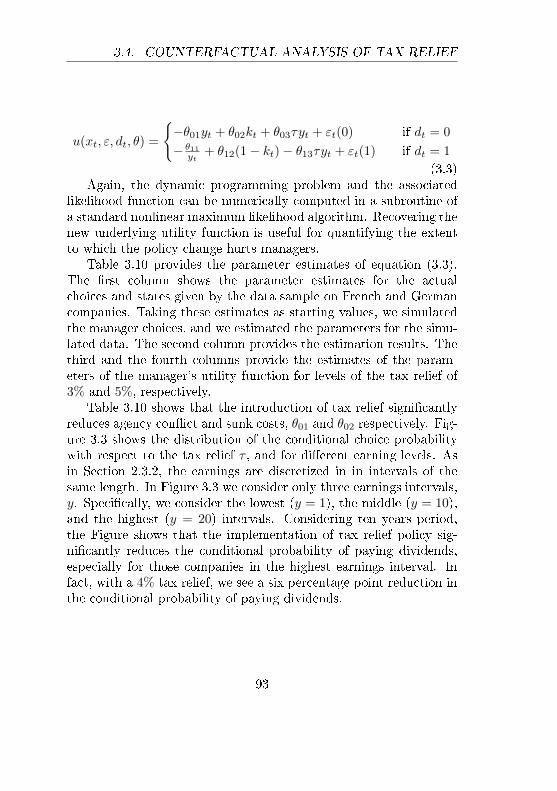
3.4. COUNTERFACTUAL ANALYSIS OF TAX RELIEF
u(xt, ε, dt, θ) =
{−θ01yt + θ02kt + θ03τyt + εt(0) if dt = 0
− θ11yt + θ12(1− kt)− θ13τyt + εt(1) if dt = 1
(3.3)Again, the dynamic programming problem and the associated
likelihood function can be numerically computed in a subroutine ofa standard nonlinear maximum likelihood algorithm. Recovering thenew underlying utility function is useful for quantifying the extentto which the policy change hurts managers.
Table 3.10 provides the parameter estimates of equation (3.3).The �rst column shows the parameter estimates for the actualchoices and states given by the data sample on French and Germancompanies. Taking these estimates as starting values, we simulatedthe manager choices, and we estimated the parameters for the simu-lated data. The second column provides the estimation results. Thethird and the fourth columns provide the estimates of the param-eters of the manager's utility function for levels of the tax relief of3% and 5%, respectively.
Table 3.10 shows that the introduction of tax relief signi�cantlyreduces agency con�ict and sunk costs, θ01 and θ02 respectively. Fig-ure 3.3 shows the distribution of the conditional choice probabilitywith respect to the tax relief τ , and for di�erent earning levels. Asin Section 2.3.2, the earnings are discretized in in intervals of thesame length. In Figure 3.3 we consider only three earnings intervals,y. Speci�cally, we consider the lowest (y = 1), the middle (y = 10),and the highest (y = 20) intervals. Considering ten years period,the Figure shows that the implementation of tax relief policy sig-ni�cantly reduces the conditional probability of paying dividends,especially for those companies in the highest earnings interval. Infact, with a 4% tax relief, we see a six percentage point reduction inthe conditional probability of paying dividends.
93

CHAPTER 3. CASE STUDY: THE ACE TAX REGIME
Table3.10:
ΘEstim
ates
Actu
alChoices
Sim.with
τ=
0Sim.with
τ=
3%Sim.with
τ=
5%
θ01
0.0720
0.0731
0.0700
0.0688
(0.0024)
(0.0029)
(0.0019)
(0.0027)
θ02
2.7880
2.8181
2.7281
2.6952
(0.1016)
(0.0553)
(0.0531)
(0.0598)
θ11
0.7870
0.8181
0.8120
0.8410
(0.0615)
(0.0446)
(0.0485)
(0.0575)
Note:
β=
0.95;θ03=θ13=
1;θ12=
0.
Inalltheestim
atio
ns,
theunobserv
able
state
varia
bles
εi,t (d
i,t )are
keptconsta
ntfor
each
�rm
iandtim
et.
Standard
errors
inparen
theses.
94

3.4. COUNTERFACTUAL ANALYSIS OF TAX RELIEF
Figure 3.2: Dividend Payout Conditional Probability - Actual vsPredicted
0 2 4 6 8 10 12 14 16 18 20
Earnings Intervals: y
0.1
0.2
0.3
0.4
0.5
0.6
0.7
0.8
0.9
1
Con
ditio
nal C
hoic
e P
roba
bilit
y
DP Actual
95

CHAPTER 3. CASE STUDY: THE ACE TAX REGIME
Figure 3.3: Simulation of the Conditional Choice Probability
0 0.01 0.02 0.03 0.04 0.05 0.06 0.07 0.08 0.09 0.1
Tax Relief:
0
0.2
0.4
0.6
0.8
1
Con
ditio
nal C
hoic
e P
roba
bilit
y
y = 1 y = 10 y = 20
96

Conclusion
This thesis starts reviewing the di�erent theories on dividends andthe empirical results in the literature. By following the dividend lit-erature, we formulated a model to measure some of the regularitiesof the dividend payout policy, and to understand if company char-acteristics in�uence investors' preferences and therefore the decisionto accumulate cash or pay shareholders. Speci�cally, we developeda discrete choice model where a rational, forward-looking managerchooses the optimal dividend payout policy to minimize the agencycost deriving from the manager-shareholders con�ict. Moreover, weembodied the sunk cost fallacy within the manager's utility function,(Arkes and Blumer, 1985; Thaler, 1980). The de�nition and estima-tion of the sunk cost in dividend policy represent the novelty of thisstudy. In particular, we estimated the discrete choice dynamic pro-gramming model through the nested �xed point algorithm proposedby Rust (1987). Our discrete choice model yields estimates consis-tent with existing empirical evidence; in particular, we observe thatthe ownership dispersion signi�cantly a�ects the managers' dividendpolicy, (Eckbo and Verma, 1994; Jensen, Solberg, and Zorn, 1992).
Finally, we analyzed the allowances on corporate equity (ACE),a policy aimed at lowering the use of leverage by incentivizing thecompanies to retain earnings. Italy implemented this reform duringthe years 2011-2019. The reform has signi�cantly impacted the divi-dend policy of Italian companies. However, we observed that Italiancompanies haven't fully exploited the tax relief because of the sunk
97

CHAPTER 3. CASE STUDY: THE ACE TAX REGIME
cost of dividend policy changes.Con�dent of the reliability of our dynamic discrete choice model,
we implemented the e�ect of the ACE reform and measured the vari-ation in the conditional probability of paying dividends for di�erentlevels of tax relief. We have estimated that the implementation of atax relief of 4% for ten years results in an average decrease of 50%of the conditional probability of paying dividends.
Possible future developments of this work include the consider-ation of unobserved permanent state dependence and the endoge-nization of the managers' investment policy. The greater realismand sophistication of the model would reward the considerable com-putational complexity.
98

Bibliography
Acharya, Viral V, Heitor Almeida, and Murillo Campello (2007). �Iscash negative debt? A hedging perspective on corporate �nancialpolicies�. In: Journal of Financial Intermediation 16.4, pp. 515�554.
Adam, Tim and Vidhan K Goyal (2008). �The investment oppor-tunity set and its proxy variables�. In: Journal of Financial Re-search 31.1, pp. 41�63.
Aguirregabiria, Victor and Pedro Mira (2010). �Dynamic discretechoice structural models: A survey�. In: Journal of Econometrics156.1, pp. 38�67.
Allen, Franklin, Antonio E Bernardo, and Ivo Welch (2000). �A the-ory of dividends based on tax clienteles�. In: The Journal of Fi-nance 55.6, pp. 2499�2536.
Allen, Franklin and Roni Michaely (2003). �Payout policy�. In:Hand-book of the Economics of Finance. Vol. 1. Elsevier, pp. 337�429.
Almeida, Heitor, Murillo Campello, and Michael S Weisbach (2004).�The cash �ow sensitivity of cash�. In: The Journal of Finance59.4, pp. 1777�1804.
Arellano, Manuel and Stephen Bond (1991). �Some tests of speci�-cation for panel data: Monte Carlo evidence and an applicationto employment equations�. In: The review of economic studies58.2, pp. 277�297.
99

BIBLIOGRAPHY
Arkes, Hal R and Catherine Blumer (1985). �The psychology of sunkcost�. In: Organizational behavior and human decision processes35.1, pp. 124�140.
Asquith, Paul and David W Mullins Jr (1983). �The impact of ini-tiating dividend payments on shareholders' wealth�. In: Journalof business, pp. 77�96.
Baker, H Kent, Gary E Powell, and Daniel G Weaver (1999). �DoesNYSE listing a�ect �rm visibility?� In: Financial Management,pp. 46�54.
Baker, Malcolm and Je�rey Wurgler (2004). �A catering theory ofdividends�. In: The Journal of Finance 59.3, pp. 1125�1165.
Baskin, Jonathan (1989). �An empirical investigation of the peckingorder hypothesis�. In: Financial management, pp. 26�35.
Bates, Thomas W, Kathleen M Kahle, and René M Stulz (2009).�Why do US �rms hold so much more cash than they used to?�In: The journal of �nance 64.5, pp. 1985�2021.
Bellman, Richard (1957). �A Markovian decision process�. In: Jour-nal of Mathematics and Mechanics, pp. 679�684.
Benartzi, Shlomo, Roni Michaely, and Richard Thaler (1997). �Dochanges in dividends signal the future or the past?� In: The Jour-nal of Finance 52.3, pp. 1007�1034.
Bhattacharya, Sudipto et al. (1979). �Imperfect information, divi-dend policy, and �the bird in the hand� fallacy�. In: Bell journalof economics 10.1, pp. 259�270.
Black, Fischer and Myron Scholes (1974). �The e�ects of dividendyield and dividend policy on common stock prices and returns�.In: Journal of �nancial economics 1.1, pp. 1�22.
Blackwell, David (1965). �Discounted dynamic programming�. In:The Annals of Mathematical Statistics 36.1, pp. 226�235.
Blume, Marshall E, Jean Crockett, and Irwin Friend (1974). �Stockownership in the United States: Characteristics and trends�. In:Survey of Current Business 54.11, pp. 16�40.
Blundell, Richard and Stephen Bond (1998). �Initial conditions andmoment restrictions in dynamic panel data models�. In: Journalof econometrics 87.1, pp. 115�143.
100

BIBLIOGRAPHY
Booth, Laurence and Sean Cleary (2006). �Cash �ow volatility, �-nancial slack, and investment decisions�. In: EFMA 2006 MadridMeetings Paper.
Brav, Alon et al. (2005). �Payout policy in the 21st century�. In:Journal of �nancial economics 77.3, pp. 483�527.
Brav, Alon et al. (2008). �Hedge fund activism, corporate gover-nance, and �rm performance�. In: The Journal of Finance 63.4,pp. 1729�1775.
Brennan, Michael J (1971). �Capital market equilibrium with diver-gent borrowing and lending rates�. In: Journal of Financial andQuantitative Analysis 6.5, pp. 1197�1205.
Chen, Nai-Fu, Bruce Grundy, and Robert F Stambaugh (1990).�Changing risk, changing risk premiums, and dividend yield ef-fects�. In: Journal of Business, S51�S70.
Chetty, Raj and Emmanuel Saez (2005). �Dividend taxes and cor-porate behavior: Evidence from the 2003 dividend tax cut�. In:The Quarterly Journal of Economics 120.3, pp. 791�833.
Cohen, Ruben (2002). �The Relationship Between the Equity RiskPremium, Duration, and Dividend Yield�. In:
De Mooij, Ruud A (2012). �Tax biases to debt �nance: Assessing theproblem, �nding solutions�. In: Fiscal Studies 33.4, pp. 489�512.
DeAngelo, Harry, Linda DeAngelo, and René M Stulz (2006). �Div-idend policy and the earned/contributed capital mix: a test ofthe life-cycle theory�. In: Journal of Financial economics 81.2,pp. 227�254.
DeAngelo, Harry and Ronald W Masulis (1980). �Optimal capitalstructure under corporate and personal taxation�. In: Journal of�nancial economics 8.1, pp. 3�29.
Del Guercio, Diane (1996). �The distorting e�ect of the prudent-manlaws on institutional equity investments�. In:
Dempsey, Stephen J and Gene Laber (1992). �E�ects of agency andtransaction costs on dividend payout ratios: further evidence ofthe agency-transaction cost hypothesis�. In: Journal of Financialresearch 15.4, pp. 317�321.
101

BIBLIOGRAPHY
Denis, David J and Igor Osobov (2008). �Why do �rms pay divi-dends? International evidence on the determinants of dividendpolicy�. In: Journal of Financial economics 89.1, pp. 62�82.
Dhillon, Upinder S and Herb Johnson (1994). �The e�ect of dividendchanges on stock and bond prices�. In: The Journal of �nance49.1, pp. 281�289.
Easterbrook, Frank H (1984). �Two agency-cost explanations of div-idends�. In: The American Economic Review 74.4, pp. 650�659.
Eckbo, B Espen and Savita Verma (1994). �Managerial shareowner-ship, voting power, and cash dividend policy�. In:
Fama, Eugene F (1998). �Market e�ciency, long-term returns, andbehavioral �nance1�. In: Journal of �nancial economics 49.3,pp. 283�306.
Fama, Eugene F and Harvey Babiak (1968). �Dividend policy: Anempirical analysis�. In: Journal of the American statistical Asso-ciation 63.324, pp. 1132�1161.
Fama, Eugene F and Kenneth R French (1993). �Common risk fac-tors in the returns on stocks and bonds�. In: Journal of �nancialeconomics 33.1, pp. 3�56.
� (2001). �Disappearing dividends: changing �rm characteristicsor lower propensity to pay?� In: Journal of Financial economics60.1, pp. 3�43.
� (2002). �Testing trade-o� and pecking order predictions aboutdividends and debt�. In: The review of �nancial studies 15.1,pp. 1�33.
Farre-Mensa, Joan, Roni Michaely, and Martin Schmalz (2014).�Payout policy�. In: Annu. Rev. Financ. Econ. 6.1, pp. 75�134.
Ferreira, Miguel A and Antonio S Vilela (2004). �Why do �rms holdcash? Evidence from EMU countries�. In: European FinancialManagement 10.2, pp. 295�319.
Floyd, Eric, Nan Li, and Douglas J Skinner (2015). �Payout pol-icy through the �nancial crisis: The growth of repurchases andthe resilience of dividends�. In: Journal of Financial Economics118.2, pp. 299�316.
102

BIBLIOGRAPHY
Foley, C Fritz et al. (2007). �Why do �rms hold so much cash? Atax-based explanation�. In: Journal of Financial Economics 86.3,pp. 579�607.
Frankfurter, George M and Bob G Wood Jr (1997). �The evolutionof corporate dividend policy�. In: Journal of �nancial education,pp. 16�33.
Gordon, Myron J (1959). �Dividends, earnings, and stock prices�.In: The review of economics and statistics, pp. 99�105.
� (1963). �Optimal investment and �nancing policy�. In: The Jour-nal of �nance 18.2, pp. 264�272.
Griliches, Zvi, Ariel Pakes, and Bronwyn H Hall (1986). The valueof patents as indicators of inventive activity.
Grullon, Gustavo and Roni Michaely (2004). �The information con-tent of share repurchase programs�. In: The Journal of Finance59.2, pp. 651�680.
Grullon, Gustavo, Roni Michaely, and Bhaskaran Swaminathan(2002). �Are dividend changes a sign of �rm maturity?� In: Thejournal of Business 75.3, pp. 387�424.
Guttman, Ilan, Ohad Kadan, and Eugene Kandel (2010). �Dividendstickiness and strategic pooling�. In: The Review of FinancialStudies 23.12, pp. 4455�4495.
Handjinicolaou, George and Avner Kalay (1984). �Wealth redistri-butions or changes in �rm value: An analysis of returns to bond-holders and stockholders around dividend announcements�. In:Journal of Financial Economics 13.1, pp. 35�63.
Hansen, Lars Peter (1982). �Large sample properties of generalizedmethod of moments estimators�. In: Econometrica: Journal ofthe Econometric Society, pp. 1029�1054.
Healy, Paul M and Krishna G Palepu (1988). �Earnings informationconveyed by dividend initiations and omissions�. In: Journal of�nancial Economics 21.2, pp. 149�175.
Jagannathan, Murali, Cli�ord P Stephens, and Michael S Weisbach(2000). �Financial �exibility and the choice between dividendsand stock repurchases�. In: Journal of �nancial Economics 57.3,pp. 355�384.
103

BIBLIOGRAPHY
Jayaraman, Narayanan and Kuldeep Shastri (1988). �The valuationimpacts of specially designated dividends�. In: Journal of Finan-cial and Quantitative Analysis 23.3, pp. 301�312.
Jensen, Gerald R, Donald P Solberg, and Thomas S Zorn (1992). �Si-multaneous determination of insider ownership, debt, and divi-dend policies�. In: Journal of Financial and Quantitative analysis27.2, pp. 247�263.
Jensen, Michael C (1986). �Agency costs of free cash �ow, corporate�nance, and takeovers�. In: The American economic review 76.2,pp. 323�329.
Jensen, Michael C and William H Meckling (1976). �Theory of the�rm: Managerial behavior, agency costs and ownership struc-ture�. In: Journal of �nancial economics 3.4, pp. 305�360.
John, Kose and Joseph Williams (1985). �Dividends, dilution, andtaxes: A signalling equilibrium�. In: the Journal of Finance 40.4,pp. 1053�1070.
Kalay, Avner (1982). �Stockholder-bondholder con�ict and dividendconstraints�. In: Journal of �nancial economics 10.2, pp. 211�233.
Kalay, Avner and Roni Michaely (2000). �Dividends and taxes: Are-examination�. In: Financial management, pp. 55�75.
Kanodia, Chandra, Robert Bushman, and John Dickhaut (1989).�Escalation errors and the sunk cost e�ect: An explanation basedon reputation and information asymmetries�. In: Journal of Ac-counting research 27.1, pp. 59�77.
Karpo�, Jonathan M (1987). �The relation between price changesand trading volume: A survey�. In: Journal of Financial andquantitative Analysis 22.1, pp. 109�126.
Keynes, J Maynard (1934). �The Propensity to Invest�. In: Mog-gridge, D., Hg.: The Collected Writings of John Maynard Keynes,Bd 13, pp. 450�456.
Kraus, Alan and Robert H Litzenberger (1973). �A state-preferencemodel of optimal �nancial leverage�. In: The journal of �nance28.4, pp. 911�922.
104

BIBLIOGRAPHY
Kumar, Praveen (1988). �Shareholder-manager con�ict and the in-formation content of dividends�. In: The Review of FinancialStudies 1.2, pp. 111�136.
La Porta, Rafael et al. (2000a). �Agency problems and dividendpolicies around the world�. In: The journal of �nance 55.1, pp. 1�33.
� (2000b). �Agency problems and dividend policies around theworld�. In: The journal of �nance 55.1, pp. 1�33.
Lambert, Richard A, William N Lanen, and David E Larcker (1989).�Executive Stock Option Plans and Corporate Dividend Policy,24 J�. In: FIN.; QUAN. ANAL 409, pp. 412�14.
Lang, Larry HP, RenéM Stulz, and Ralph A Walkling (1989). �Man-agerial performance, Tobin's Q, and the gains from successfultender o�ers�. In: Journal of �nancial Economics 24.1, pp. 137�154.
Lee, Bong-Soo and Oliver Meng Rui (2007). �Time-series behaviorof share repurchases and dividends�. In: Journal of Financial andQuantitative Analysis 42.1, pp. 119�142.
Lintner, John (1956). �Distribution of incomes of corporationsamong dividends, retained earnings, and taxes�. In: The Ameri-can Economic Review 46.2, pp. 97�113.
Litzenberger, Robert H and Krishna Ramaswamy (1980). �Divi-dends, short selling restrictions, tax-induced investor cliente-les and market equilibrium�. In: The Journal of Finance 35.2,pp. 469�482.
McFadden, Daniel L. (1981). �Econometric models of probabilisticchoice�. In: Structural Analysis of Discrete Data with Economet-ric Applications. Ed. by C. F. Manski and D. L. McFadden. MITPress. Chap. 07, pp. 198�272.
McFadden, Daniel L (1984). �Econometric analysis of qualitative re-sponse models�. In: Handbook of econometrics 2, pp. 1395�1457.
Michaely, Roni and Michael R Roberts (2011). �Corporate dividendpolicies: Lessons from private �rms�. In: The Review of FinancialStudies 25.3, pp. 711�746.
105

BIBLIOGRAPHY
Michaely, Roni, Richard H Thaler, and Kent L Womack (1995a).�Price reactions to dividend initiations and omissions: Overreac-tion or drift?� In: The journal of �nance 50.2, pp. 573�608.
� (1995b). �Price reactions to dividend initiations and omissions:Overreaction or drift?� In: The journal of �nance 50.2, pp. 573�608.
Michaely, Roni and Jean-Luc Vila (1996). �Trading volume withprivate valuation: Evidence from the ex-dividend day�. In: TheReview of Financial Studies 9.2, pp. 471�509.
Michaely, Roni, Jean-Luc Vila, and Jiang Wang (1996). �A modelof trading volume with tax-induced heterogeneous valuation andtransaction costs�. In: Journal of Financial Intermediation 5.4,pp. 340�371.
Miller, M. H. and F. Modigliani (1958). �The cost of capital, corpo-ration �nance and the theory of investment�. In: The Americaneconomic review 48.3, pp. 261�297.
� (1961). �Dividend policy, growth, and the valuation of shares�.In: the Journal of Business 34.4, pp. 411�433.
Miller, Merton H and Kevin Rock (1985). �Dividend policy un-der asymmetric information�. In: The Journal of �nance 40.4,pp. 1031�1051.
Miller, Merton H and Myron S Scholes (1978). �Dividends andtaxes�. In: Journal of �nancial economics 6.4, pp. 333�364.
Miller, Robert A (1984). �Job matching and occupational choice�.In: Journal of Political Economy 92.6, pp. 1086�1120.
Modigliani, Franco and Merton H Miller (1963). �Corporate incometaxes and the cost of capital: a correction�. In: The Americaneconomic review 53.3, pp. 433�443.
Moh'd, Mahmoud A, Larry G Perry, and James N Rimbey (1995).�An investigation of the dynamic relationship between agencytheory and dividend policy�. In: Financial Review 30.2, pp. 367�385.
Myers, Stewart C (1977). �Determinants of corporate borrowing�.In: Journal of �nancial economics 5.2, pp. 147�175.
106

BIBLIOGRAPHY
� (1984). �The capital structure puzzle�. In: The journal of �nance39.3, pp. 574�592.
Myers, Stewart C and Nicholas S Majluf (1984). �Corporate �nanc-ing and investment decisions when �rms have information thatinvestors do not have�. In: Journal of �nancial economics 13.2,pp. 187�221.
Nickell, Stephen (1981). �Biases in dynamic models with �xed ef-fects�. In: Econometrica: Journal of the Econometric Society,pp. 1417�1426.
Opler, Tim et al. (1999). �The determinants and implications ofcorporate cash holdings�. In: Journal of �nancial economics 52.1,pp. 3�46.
Ozkan, Aydin and Neslihan Ozkan (2004). �Corporate cash hold-ings: An empirical investigation of UK companies�. In: Journalof Banking & Finance 28.9, pp. 2103�2134.
Parkinson, Michael (1980). �The extreme value method for estimat-ing the variance of the rate of return�. In: Journal of business,pp. 61�65.
Pettit, R Richardson (1972). �Dividend announcements, securityperformance, and capital market e�ciency�. In: The Journal ofFinance 27.5, pp. 993�1007.
Pinkowitz, Lee, René Stulz, and Rohan Williamson (2006). �Doesthe contribution of corporate cash holdings and dividends to �rmvalue depend on governance? A cross-country analysis�. In: TheJournal of Finance 61.6, pp. 2725�2751.
Pinkowitz, Lee and Rohan Williamson (2007). �What is the mar-ket value of a dollar of corporate cash?� In: Journal of AppliedCorporate Finance 19.3, pp. 74�81.
Poterba, James M and Lawrence H Summers (1984). The persistenceof volatility and stock market �uctuations.
Rantapuska, Elias (2008). �Ex-dividend day trading: Who, how, andwhy?: Evidence from the Finnish market�. In: Journal of Finan-cial Economics 88.2, pp. 355�374.
107

BIBLIOGRAPHY
Roodman, David (2009). �How to do xtabond2: An introduction todi�erence and system GMM in Stata�. In: The Stata Journal 9.1,pp. 86�136.
Roze�, Michael S (1982). �Growth, beta and agency costs as de-terminants of dividend payout ratios�. In: Journal of �nancialResearch 5.3, pp. 249�259.
Rubinstein, Mark (1985). �Nonparametric tests of alternative optionpricing models using all reported trades and quotes on the 30most active CBOE option classes from August 23, 1976 throughAugust 31, 1978�. In: The Journal of Finance 40.2, pp. 455�480.
Rust, John (1987). �Optimal replacement of GMC bus engines: Anempirical model of Harold Zurcher�. In: Econometrica: Journalof the Econometric Society, pp. 999�1033.
� (1994). �Structural estimation of Markov decision processes�. In:Handbook of econometrics 4, pp. 3081�3143.
Skinner, Douglas J (2008). �The evolving relation between earnings,dividends, and stock repurchases�. In: Journal of �nancial eco-nomics 87.3, pp. 582�609.
Staw, Barry M (1981). �The escalation of commitment to a courseof action�. In: Academy of management Review 6.4, pp. 577�587.
Thaler, Richard (1980). �Toward a positive theory of consumerchoice�. In: Journal of Economic Behavior & Organization 1.1,pp. 39�60.
Train, Kenneth E (2009). Discrete choice methods with simulation.Cambridge university press.
Venkatesh, PC (1989). �The impact of dividend initiation on the in-formation content of earnings announcements and returns volatil-ity�. In: Journal of Business, pp. 175�197.
Von Eije, J Henk and William L Megginson (2006). �Dividend policyin the European Union�. In:
Windmeijer, Frank (2005). �A �nite sample correction for the vari-ance of linear e�cient two-step GMM estimators�. In: Journal ofeconometrics 126.1, pp. 25�51.
108

BIBLIOGRAPHY
Wolpin, Kenneth I (1984). �An estimable dynamic stochastic modelof fertility and child mortality�. In: Journal of Political economy92.5, pp. 852�874.
� (1996). �Public-policy uses of discrete-choice dynamic program-ming models�. In: The American Economic Review 86.2, pp. 427�432.
Yoon, Pyung Sig and Laura T Starks (1995). �Signaling, investmentopportunities, and dividend announcements�. In: The Review ofFinancial Studies 8.4, pp. 995�1018.
Young, Steven and Jing Yang (2011). �Stock repurchases and ex-ecutive compensation contract design: The role of earnings pershare performance conditions�. In: The Accounting Review 86.2,pp. 703�733.
109