Embed Size (px)
Citation preview

Maritime Head-Up Display: A Preliminary Evaluation
Eric Holder (1) and Samuel R. Pecota (2)
(1 Anacapa Sciences, Inc., 2 California Maritime Academy) (Email: [email protected], [email protected])
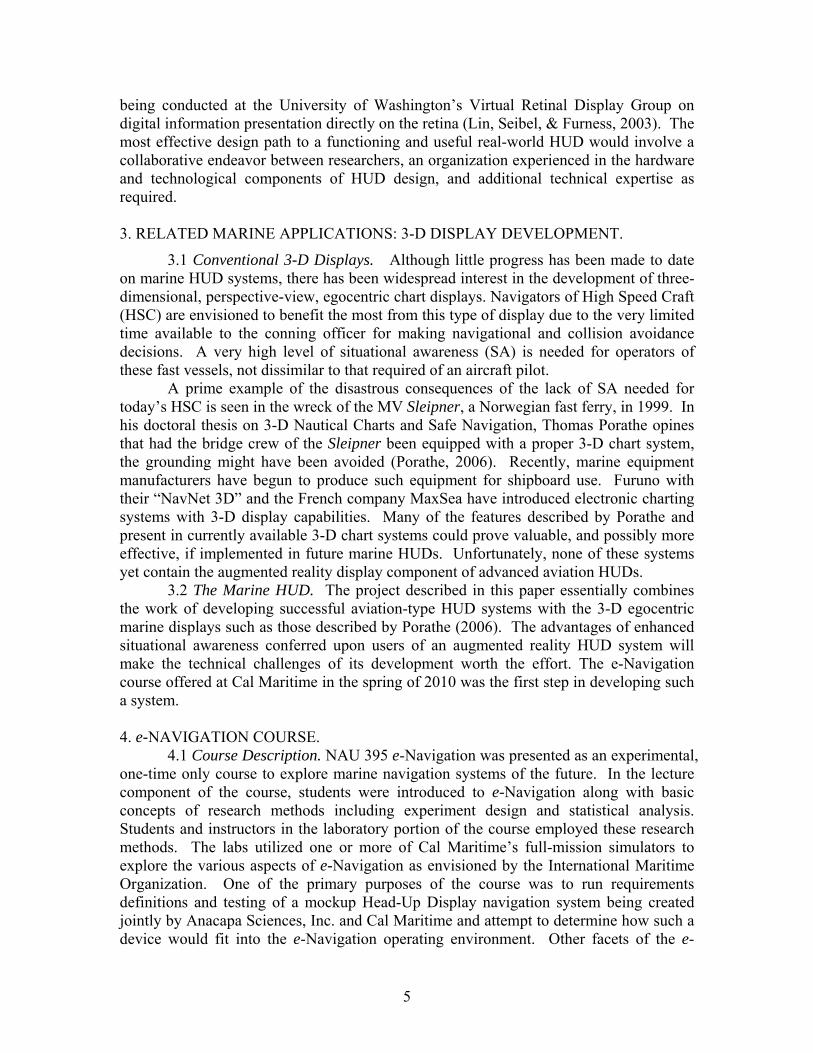
A major disadvantage of nearly every marine electronic navigation device introduced to date is the necessity for the navigator to turn his or her attention away from the view outside the bridge windows, even momentarily. Indeed, the uncomfortable feeling experienced by seasoned mariners that this ‘head down’ posture creates has led many to be initially reluctant to adopt some marine electronic devices (radar, ARPA, ECDIS, to name a few) that have proven their worth over time as useful, even vital navigational aids. Unfortunately, the use of such equipment has always required the marine navigator to leave behind the real world perspective view and enter an unnatural, two-dimensional plan view of the area surrounding the vessel. Mariners have accepted this type of view by necessity rather than by choice. That may be about to change. Advances in technology and a proven track record of performance benefits from Head-Up Display (or HUD) information in the aviation field have made it possible to consider if such a device would be useful in a maritime context. Accordingly, the authors of this paper conducted a preliminary evaluation to examine empirically what the effects of providing this same type of head-up information would be on marine navigation performance. A series of tests were conducted in the California Maritime Academy’s advanced simulation facilities utilizing a full-mission simulator, a laptop-based HUD prototype, a projector, and student participants from an experimental undergraduate course entitled e-Navigation. The goals were to: 1) define the operational requirements and concept(s) of operations for a maritime HUD system; 2) identify essential information, risks, and concerns; and 3) examine performance variations by conditions (environmental, vessel, crew) and tasks. The results indicate great potential for a maritime HUD system, especially for improving situational awareness in low visibility conditions, confined waters, and for vessels where information changes rapidly (i.e., high speed vessels). The results also suggest that there are some standard information requirements across situations that could be augmented with task and vessel specific information.
KEY WORDS
1. Head-Up Display 2. e-Navigation 3. Full-Mission Simulator 1. INTRODUCTION. Head-Up Display systems for aviation and automobile applications have existed for decades. As of the date of this writing, no comparable HUD equipment has been developed for the civilian maritime domain although there have been some preliminary experiments conducted by a few groups as described below. HUDs may in fact hold one of the keys to the effective application of the wide-ranging, ambitious demands that e-Navigation concepts place on command and control of commercial marine vessels of the future. The purpose of the current research is not to solve all the technical problems associated with the development of a working marine HUD intended for shipboard use, but rather, to begin to establish which functions and features would be most useful and
1

desirable in a marine HUD system. The simulator chosen for this project uses five plasma view screens to generate a simulated 225o outside view from the bridge of ownship. The HUD mockup used in this study generated a properly scaled perspective view of user selected waypoints and tracklines. This augmented reality egocentric presentation was then projected onto the centerline plasma view screen. Because each plasma screen generates a fixed 45o wide view as seen from the center of the pilothouse, there were no problems with the HUD generated information (tracklines and waypoints) becoming displaced from the simulator visual presentation. Parallax issues, a major concern in the development of any actual shipboard marine HUD, were not a problem for the mockup HUD because both the HUD and simulator images are presented directly onto the flat center panel. Accordingly, the mockup HUD served as an effective research tool for requirements definitions and testing. The HUD mockup is described in more detail in Section 5 below. 2. HUD RESEARCH & DEVELOPMENT. Head-Up Display systems are designed to provide a user with a display that allows him or her to view objects and cues in the real world scene (the far domain) concurrently with the presentation of additional information, typically information from on-board instruments and displays (the near domain) (Newman, 1987; Fadden, Ververs, & Wickens, 1998). Although HUD technology has been utilized in other application domains, such as the aviation and automobile industries and military applications, to varying degrees for some time, its use in the maritime world has been limited. The limited work that has been conducted for marine operations has mostly been conducted in simulator studies with a simulated (projected) HUD, such as the current project, or by utilizing video or synthetic vision systems rather than overlaying information on the operator’s view of the outside world. For examples of the latter see the seascape coordination work combining AIS, radar, and a video image conducted in Japan by the National Maritime Research Institute and the Tokyo University of Marine Science and Technology (Imazu, 2006; Fukuto, Hayama, Takanori, & Fukui, 2008) and the ARVCOP work by Technology Systems, Inc. (Technology Systems, Inc., 2010). In 2003 the US Coast Guard also sponsored some prototype research on a Mobile Augmented Reality System (MARS) that provided augmented reality virtual aids to navigation utilizing head-worn displays (Kirkley & Walker, 2003).
In the current research the focus is on the concept of fixed display HUDs that require the user to look through a stationary display element rather than head- (or helmet-) mounted displays. The information needs and requirements results of our research could be applied to both fixed and head-mounted (HMD) HUDs but the overall concept of operations is specific to a fixed display HUD. Initial mariner inputs suggest a reluctance to utilize head or helmet-mounted displays. As technology advances and HMD systems become lighter and more reliable this might change. For instance, mariners may be more inclined to use a HMD the size of a typical pair of glasses connected wirelessly to the control unit.
There are three essential components in the standard fixed HUD (Newman, 1987; Rockwell Collins, Inc., 2010). The first is the combiner which is the surface on which the information is projected. In the aviation world the combiner is often stowable and can be brought out for use. In automobile applications it is often embedded within, or is the actual, windshield surface. The projected display is typically collimated to prevent the
2
need for the user to constantly change focus in order to see both the HUD displayed objects and objects in the outside world. This focal point is typically optical infinity for aviation applications and the distance of the bumper for automotive applications (Head-up Display, n.d.). The collimation process can require an additional collimator component using refractive, reflective, diffraction or other techniques (Newman, 1987).
The second component is the projector unit used to project the image onto the combiner. The positioning of this unit can vary but is typically directly above or below the combiner. The combiner is designed only to reflect the light spectrum transmitted by the projector and hence allows the user to view the HUD information through the combiner without distorting the user’ view of the information available in the outside world (Rockwell Collins, 2010).
The third component is the computer that generates the information to display (Newman, 1987). To produce information that is in synch with the outside world the computer requires input from on-board systems concerning the required variables of interest (e.g., chart data, location, heading, speed, etc.). The HUD can provide both conformal information, where the HUD information visually overlies the real-world objects it represents, or non-conformal information that does not overlap (e.g., a digital speed gauge).
There are several important concepts to understand when designing or evaluating a real-world HUD system and these can be impacted by the hardware and software options available, as well as the situational constraints. The first is the eyebox, which is the 3-dimensional envelope that the user can be positioned in from which the HUD information can be accurately viewed (Newman, 1987). The eye-box and accurate viewing are especially important for conformal information that requires alignment of the presented information with real-world objects. Mariners typically are walking around the bridge rather than seated in a stationary position like aviators or automobile drivers, which provides an additional design challenge.
The second concept, the field of view (FOV), is the spatial angle (lateral and vertical cone or wedge) in which HUD information is presented (Newman, 1987). For instance HUD information could be provided only within 18, 30, 90, etc. horizontal/vertical degrees in front of the viewer. When designing a HUD it is essential to consider what the available HUD FOV is and how that compares to the overall FOV utilized by the operators.
The third is the contrast ratio, which is the ratio of the display information brightness to the external visual cue brightness and is impacted by the ambient brightness level. Consideration must also be given to various sources of potential discrepancies, disparities, and alignment issues, including distortion and displacement errors caused by the combiner, as well as by differences in the apparent position of images as presented to each eye, different viewing positions, or multiple viewers. Newman (1987) expands on these and other variables in more detail.
So what are the advantages and disadvantages of a HUD? Many of the features and advantages are domain and application specific because tasks, related information needs, and contexts vary. These differences are due to factors such as variations in the training, tasking, environment, and the speed, accuracy, and control dynamics required for each domain. One of the primary goals of this study was to look at the concept of
3

operations for a HUD system specifically for the maritime domain and begin to define the appropriate advantages, risks, and situational requirements.
Overall, increased “eyes out the window” time is seen as a primary advantage of a HUD system. Keeping an operator’s eyes on the outside visual scene reduces the probability that a critical real-world event will be missed (Gish & Staplin, 1995). The ability to present conformal imagery is also seen as one of the primary advantages of a HUD (Yeh, Merlo, Wickens, & Brandenburg, 2003). Some of the conformal features hypothesized to be applicable across transportation domains include information concerning the planned route, boundaries of safe travel, upcoming alterations required, obstacles, and other potential dangers in the projected route. Studies have shown consistent HUD-related performance advantages for path following and trajectory control measures (Wilson, Hooey, Foyle, & Williams, 2002). Another primary HUD advantage found in the literature is reducing the amount of scanning, reaccomodation, and head movement required in order to utilize both near and far domain information (Yeh, et al., 2003; Gish & Staplin, 1995). This benefit can be realized with non-conformal HUD information as well (i.e., speed, notification or aids for required actions such as shifting or turning, targeting information, etc.) and becomes a greater advantage in high-speed operations when risk dramatically increases and the operator removes his or her view from the outside world to retrieve this information. A further reduction in the time it takes to integrate this information can be produced by the intelligent design and placement of HUD information in reference to the outside visual cues.
The potential for clutter is one of the primary risks or disadvantages with HUD presentation. This risk, and the related cost, increases as more information is added to the HUD (Yeh, et al., 2003). There are two basic types of clutter. The first type results in increased time to search and find a specific item of information. This same disadvantage also occurs with information presented through normal head down displays. The second type is due to irrelevant information items overlapping (obscuring) or interfering with (masking) the perception or interpretation of target information items (Tsang & Vidulich, 2003). Another risk often presented in the HUD literature is attentional tunneling, where the HUD related information captures the operator’s attention and he or she misses important information in the outside world, or from the on-board environment (Gish & Staplin, 1995). The missed information can be within the HUD FOV or outside the FOV. A related disadvantage is the restricted FOV that is available with most HUDs (Tsang & Vidulich, 2003). Misaccomodation and misconvergence effects (“Mandelbaum effect”) also can occur when trying to view a distant object through a nearer object or surface. These effects would impact size and distance judgments (Gish & Staplin, 1995).
All of the factors mentioned above illustrate the point that careful thought and analysis need to be put into the design of the HUD system overall, including hardware as well as the specific features and functionalities available within the display. More information is not always better and the design of the system needs to be appropriate to the overall system context it will be implemented in and the tasks that will be completed in that context. Furthermore, the design of a real-world HUD system should take account of recent innovations in technology that can address or circumvent some of the typical problems and constraints experienced in past applications and produce a HUD that is ideally suited for the marine environment. These can include larger combiner surfaces, emerging innovations in holographic technologies, and cutting edge research such as that
4
being conducted at the University of Washington’s Virtual Retinal Display Group on digital information presentation directly on the retina (Lin, Seibel, & Furness, 2003). The most effective design path to a functioning and useful real-world HUD would involve a collaborative endeavor between researchers, an organization experienced in the hardware and technological components of HUD design, and additional technical expertise as required.
3. RELATED MARINE APPLICATIONS: 3-D DISPLAY DEVELOPMENT.
3.1 Conventional 3-D Displays. Although little progress has been made to date on marine HUD systems, there has been widespread interest in the development of three-dimensional, perspective-view, egocentric chart displays. Navigators of High Speed Craft (HSC) are envisioned to benefit the most from this type of display due to the very limited time available to the conning officer for making navigational and collision avoidance decisions. A very high level of situational awareness (SA) is needed for operators of these fast vessels, not dissimilar to that required of an aircraft pilot.
A prime example of the disastrous consequences of the lack of SA needed for today’s HSC is seen in the wreck of the MV Sleipner, a Norwegian fast ferry, in 1999. In his doctoral thesis on 3-D Nautical Charts and Safe Navigation, Thomas Porathe opines that had the bridge crew of the Sleipner been equipped with a proper 3-D chart system, the grounding might have been avoided (Porathe, 2006). Recently, marine equipment manufacturers have begun to produce such equipment for shipboard use. Furuno with their “NavNet 3D” and the French company MaxSea have introduced electronic charting systems with 3-D display capabilities. Many of the features described by Porathe and present in currently available 3-D chart systems could prove valuable, and possibly more effective, if implemented in future marine HUDs. Unfortunately, none of these systems yet contain the augmented reality display component of advanced aviation HUDs. 3.2 The Marine HUD. The project described in this paper essentially combines the work of developing successful aviation-type HUD systems with the 3-D egocentric marine displays such as those described by Porathe (2006). The advantages of enhanced situational awareness conferred upon users of an augmented reality HUD system will make the technical challenges of its development worth the effort. The e-Navigation course offered at Cal Maritime in the spring of 2010 was the first step in developing such a system. 4. e-NAVIGATION COURSE.
4.1 Course Description. NAU 395 e-Navigation was presented as an experimental, one-time only course to explore marine navigation systems of the future. In the lecture component of the course, students were introduced to e-Navigation along with basic concepts of research methods including experiment design and statistical analysis. Students and instructors in the laboratory portion of the course employed these research methods. The labs utilized one or more of Cal Maritime’s full-mission simulators to explore the various aspects of e-Navigation as envisioned by the International Maritime Organization. One of the primary purposes of the course was to run requirements definitions and testing of a mockup Head-Up Display navigation system being created jointly by Anacapa Sciences, Inc. and Cal Maritime and attempt to determine how such a device would fit into the e-Navigation operating environment. Other facets of the e-
5

Navigation concept were examined such as: 1) Advanced Bridge Resource and Bridge Team Management (BRM/BTM); 2) Proposed light sequencing patterns for Aids to Navigation; and 3) Comparing the use of north-up and head-up orientations of radar and ECDIS displays. For the purposes of this paper, only the parts of the course dealing specifically with HUD research will be described.
4.2 Lab Structure. Each laboratory session consisted of a pre-brief by the instructor to explain the purpose of the simulation session to follow. Students were assigned to their various simulators, stations and tasks. All students were active participants in each simulation. Each student, at the conclusion of the simulation session, completed a post-simulation survey. A post-brief discussion between instructor and students completed each lab session.
4.3 Methodology. During the Week 6 simulation session, students in Bridge 3 (the simulator employing the HUD mockup) were asked to observe the HUD display while ownship transited through San Francisco Bay on course-control autopilot. There was no student interaction with the simulation – they merely observed the HUD display for approximately 30 minutes. During Week 11, the students were asked to pilot a tug and barge down the Mississippi River using the HUD, ECDIS, and radar, in fully interactive simulation. The instructor set up and adjusted the HUD equipment when necessary; the students were not allowed to adjust the HUD on their own.
4.4 Participants. The students used as participants in this study were sophomores, juniors or seniors in the Marine Transportation program at Cal Maritime. There were a total of twenty-four students in the Week 6 simulation and twenty-one in the Week 11 simulation. The sophomores had received instruction in terrestrial navigation, Rules of the Road and radar/ARPA (Automatic Radar Plotting Aids) and had completed one sea-training period on the academy’s training ship. The juniors had in addition to the above spent two months aboard commercial vessels of various types as cadets, and completed an advanced navigation course. Seniors had completed an additional cruise on the training ship on which they stood at least several OICNW (Officer in Charge of a Navigational Watch) bridge watches, and had completed a course on ECDIS, as well as two bridge watchstanding simulation courses (BRM and BTM).
Although all participants in the study had limited seagoing experience, this was not seen as a disadvantage for the purpose at hand; namely development of an entirely new navigational device. Their opinions matter because they will be the ones most likely to use marine HUDs, when they are perfected for shipboard use. Furthermore, younger people are adept at using electronic devices and advanced technologies and less likely to become frustrated and negative when the systems don’t always work perfectly. Finally, because their overall navigational skills are not of the level of more seasoned mariners, they are likely to rely more on the HUD and therefore pay more attention to what it displays rather than ignore the HUD information and steer by eye or radar alone.
4.5 Survey Materials. Two HUD-specific surveys were administered during the course, one during Week 6 and the other in Week 11. The first was an initial impressions survey based on students viewing, but not interacting with, a HUD. Fourteen Likert-scale items were included with space for commentary addressing maritime operations with HUD. There were also 6 open-ended questions asking about the benefits, concerns, appropriate and inappropriate tasks and situations, appropriate and inappropriate vessel types, and features. The participants were provided a static image of a view out the
6

bridge window and asked to sketch their ideal HUD information presentation design (information items, format, and positioning). The goal of the first survey was to gather the participant’s expectations and opinions on the potential advantages, concerns, and envisioned concept of operations (CONOPS) of a HUD system before actually interacting with the prototype.
The second survey (Week 11) was administered after students had several opportunities to interact with multiple iterations of the HUD prototype and in varying scenarios. This survey also included fourteen Likert-scale items, with space for commentary. The goal of the second survey was to gather participants’ perception after having had some interaction with a prototype HUD system. This provided the opportunity to collect experiential feedback and allowed for comparisons of how participant’s perceptions changed with actual use.
5. TRANSAS FULL-MISSION SIMULATORS. Cal Maritime’s three full-mission simulators are quite new, having just been completed in early 2009. Bridges 1 and 2 are large 360o simulators contained inside 30-foot diameter cylindrical drums. Bridge 1 is configured to represent the bridges of large vessels and is equipped with state of the art multi-function displays utilizing the Transas Navi-Sailor 4000 ECDIS program. Bridge 2 is configured for tugboat operations and has Dynamic Positioning capability. Bridge 3 has a 225o view five plasma screen setup and like Bridge 1, is configured to represent larger vessels. The three operator stations are driven by the latest Transas simulator operating system NTPro 4000. The three simulators can be run separately or combined with three ownships in a single interactive scenario. Likewise, each operator station can be setup to control one or more of the simulators as required. Although each simulator has its own specialty in the choice of vessel to be represented, any of the three can be used to represent any type of vessel adequately. Throughout the duration of the e-Navigation course, all three simulators were employed each week with between three to four participants working in each simulator. Many experiments were run utilizing different simulation scenarios, each created to examine one or more aspects of the e-Navigation operating environment. The mockup HUD was always set up in Bridge 3. Participants were surveyed concerning their navigational experiences in Bridge 3 utilizing the HUD, as well as their experiences completing the same scenarios without HUD in Bridges 1 and 2. 6. HUD MOCKUP1. During the conduct of the course a HUD prototype was developed and continually refined and presented to participants within various scenario contexts. The prototype was developed on the Flex 3 Builder platform using the Sandy 3D plug-in for 3-dimensional drawing. Using a third-party serial-port-to-socket program, the Prototype reads an AIS data stream from an external device. The prototype read and decoded GPGLL, GPGGA, and GPRMC sentences for latitudinal and longitudinal coordinates of ownship. HEHDT sentences were decoded for ownship heading. Each sentence was checked for validity before accepting the data and none of the GP sentences took priority over one another (i.e. lat/long data read from any of the ownship sentences will immediately cause an update in ownship location.) Waypoint coordinates are entered manually in a dialog box in the Administrative Interface (See Figure 3) that runs 1 The HUD prototype was developed by Jim Heffner, Anacapa Sciences, Inc.
7

alongside the graphical display window. Within the graphical display window, waypoints are drawn as spheres with lines projected in 3D space between consecutive waypoints.
Initially the lat/long coordinate system was rendered as a 2D, evenly spaced grid. This created alignment problems as the simulator was running on the WGS 84 grid. In order to remedy this, the coordinate system was updated to account for the spherical nature of Earth, though it was still not fully integrated with WGS 84. This resulted in good, but not perfect alignment by the later sessions of the course. Efforts are currently being made to fully integrate the HUD projection with WGS 84 for the conduct of the second e-Navigation course. The components available for testing during the reporting period included: waypoints, trackline, heading, speed, and lat/long location. Properties of each of these features, such as size and color, could be manipulated through the Administrative Interface. Additional components will be implemented as feasible during the conduct of the second e-Navigation course.
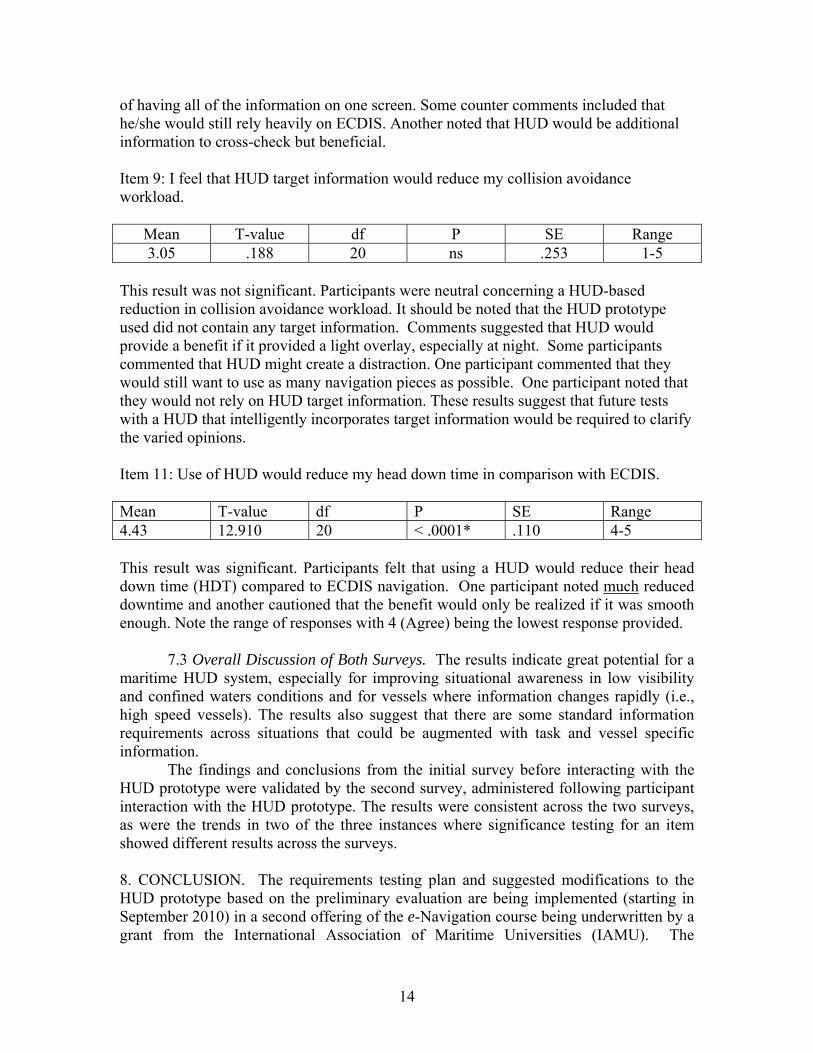
The prototype was run on a laptop within the Bridge Simulator Environment. The Laptop HUD image was presented via an Epson Model H270A LCD projector (see Figures 1-3), and adjusted to fit the size of the forward plasma screen of the Bridge 3 simulator at CMA. The projection was designed so that when aligned with the corners of the simulator screen, objects presented via the HUD prototype projection would align with the objects presented via the simulator projection. The instructor could use the Prototype Administration Interface (see Figure 3) to change the color and size of items, adjust the camera position to match the viewing angle on various vessels, and display or hide supplemental information (i.e., speed, heading, lat/long information). The instructor would program the simulator controls to set-up the environment and scenario planned for each laboratory session.
Figure 1. Set-up: AIS to Laptop-based Prototype to Projector to Simulator Presentation
8

Figure 2: HUD Trackline and Waypoints on Laptop and Projected onto Simulator Screen
Figure 3: HUD Administrative Interface 7. SURVEY RESULTS AND ANALYSIS.
7.1. Week 6 HUD Survey Results and Discussion. There were a total of fourteen survey items in which participants were asked their opinions of various aspects of a marine HUD. Each item was presented on a 1-5 Likert scale with 1-5 representing Strongly Disagree, Disagree, Neutral, Agree, and Strongly Agree respectively. The t-tests performed compared the group mean to the neutral value of 3 with a null hypothesis that participants’ opinions were neutral. The significance criterion was set at p < .0071 and any finding with a p ≤ .007 or less was considered significant2. A significant finding with a positive t-value would indicate significant agreement with an item and a significant finding with a negative t-value would indicate significant disagreement with an item. In the interest of brevity only five of the fourteen items from the Week 6 survey will be discussed here. The additional results and discussion are provided in Appendix A.
2 The overall significance criterion was set a p <.10, rather than the standard .05, to reduce Type 2 error potential but also represent an acceptable and still Type 1 Error conservative value for an exploratory study. The Bonferroni Correction was then applied based on the number of tests (14), resulting in the value listed above of p < .0071 (.10 divided by 14). Significant results are marked with a *.
9

Item 1: The HUD would be very useful in piloting situations. Mean T-value df P SE Range 4.25 7.713 23 < .0001* .162 3-5 This result was significant. Participants felt that the HUD would be very useful in piloting situations. Several participants commented that this would be especially so in restricted visibility situations. Comments also suggested additional usefulness if augmented with stationary long term objects (i.e., buoys, landmasses, bridges, lighthouses) or by highlighting the channel or Traffic Separation Scheme (TSS). Participants liked having their track laid out in front of them in their outside view. Cautionary comments included asking if pilots would be comfortable with the technology and noting that the system would require more refinement to achieve the advantages. Item 6: The HUD would be useful during restricted visibility in heavy traffic situations. Mean T-value df P SE Range 4.08 6.397 23 < .0001* .169 3-5 This result was significant. Participants felt that using a HUD would be useful during restricted visibility in heavy traffic situations. Some of the perceived benefits included HUD allowing for a quick understanding of what is going on. See general commentary below on what would be required for HUD to be useful for collision avoidance, along with collision avoidance concerns, as these apply as much or more so to restricted visibility situations. Item 8: I feel that using properly formatted HUD information would reduce my navigational workload.
Mean T-value df P SE Range 3.96 4.699 23 < .0001* .204 1-5
This result was significant. Participants felt that using a properly formatted HUD would reduce their navigational workload. The primary reduction in workload was seen to come through increased situational awareness (SA). Some participants saw HUD as a one stop shop for bridge information. Some counter comments included that there would be little workload reduction compared to ECDIS if they still had to enter the route data the same way, the need to still do the chart work on paper, and the need to still cross-check data. Item 9: I feel that HUD target information would reduce my collision avoidance workload.
Mean T-value df P SE Range 3.63 2.794 23 ns .224 1-5
10

This result was not significant. Participants were neutral concerning a HUD-based reduction in collision avoidance workload. It should be noted that the HUD prototype shown did not contain any target information. The comments clarified that HUD usefulness would depend on the integration of radar, AIS, or other means to plot target symbols relative to ownship position. Some participants also suggested incorporating Closest Point of Approach (CPA) and Time of Closest Point of Approach (TCPA) information. Potential value was seen for easy identification of targets of concern based on the projected trackline and projecting dangerous targets well in advance. Concerns included obscured targets or bad data increasing collisions and what happens when your vessel changes from planned course (i.e., for passing arrangements). Another participant questioned what would happen when targets were abeam or out of HUD view. This non-significant result and the comments taken together may suggest a tendency for some students not to respond based on the question (a HUD with target information) rather than the state of the prototype (no target information). Item 11: Use of HUD would reduce my head down time in comparison with ECDIS. Mean T-value df P SE Range 4.29 9.167 23 < .0001* .141 3-5 This result was significant. Participants felt that using a HUD would reduce their head down time (HDT) compared to ECDIS navigation. Participants saw reduced HDT as a primary HUD benefit.
7.1.1. General Comments and Discussion of Initial HUD Survey. Responses from the open-ended questions provided further clarity concerning the perceived utility of HUD for various tasks and situations. Participants commented that HUD would be especially good for tasks such as staying on track, determining the course to steer, determining speed to make, and range and bearing assessments (to waypoints). There were some comments that HUD would not be good for primary collision avoidance, with one participant explaining that the outside view might be too cluttered by the trackline in heavy traffic.
Consistent with the findings above, participants commented that HUD would be an asset for low visibility situations when displaying vessels and obstructions and for keeping on track. Specific low visibility comments included HUD’s ability to make the invisible visible and to allow for confident maneuvering in heavy traffic. HUD was also seen to apply best to confined waters contexts (i.e., inland waters and narrow channels and Traffic Separation Schemes or TSS). Some participants commented that HUD was not appropriate for Coastal, Offshore, and Docking operations, which are consistent with the negative and mixed findings reported above and in Appendix A.
High speed vessels and ferries were seen as high priority candidates for a HUD. Comments suggested this was due to rapidly changing information and no need to look down with a HUD. Several participants commented that HUD would be good for large ships due to navigational needs but others found HUD to be excessive for larger vessels (i.e., tankers, RO-ROs, containerships). Two participants commented that HUD would
11

be good for all ships. Additional comments suggested HUD would be good for any ships with set waypoints and routes, or that follow a trackline. There were mixed feelings about the utility of HUD for dredge or surveyor operations, which would depend on the HUD providing task-specific information for these operations. Comments against HUD for dredges argued that the needs and speeds do not justify HUD. One participant commented that HUD would not be good for a vessel without ECDIS.
Overall, participants saw potential for HUD to add value to the bridge environment. The primary benefits included increased situational awareness, reduced head down time, and the potential for reduced stress. The increase in SA would be realized from keeping the eyes out the window yet still seeing targets, tracklines, navigation aids, and danger areas, as well as knowing the course to steer to regain track and your relative position to these items. These benefits would allow mariners to stay ahead of the ship and make it easier to stay within the channel limits. The reduction in HDT was seen to come from HUD’s ability to connect the trackline with the reality outside the window and turn electronic navigation back into visual navigation, especially in low visibility. The reduction in stress was seen to come from increased navigation confidence, especially with an easy to see trackline. Overall HUD was seen consistently as most valuable for operations in confined waters and operations in low visibility. Participants also identified several concerns about HUD implementation. These included HUD information obscuring outside information (i.e., targets, buoys) or distracting the operator. Participants noted that the color and transparency would have to be perfect. Another related concern was the potential for clutter and information overload. Another concern noted was the potential for a sense of complacency or over reliance, especially in the cases of bad data (i.e., a mis-entered waypoint or buoy out of place) or overuse for other tasks such as collision avoidance. Several comments voiced concern about mariners becoming conditioned into poor techniques such as failing to maintain good scan patterns and look out other windows, or ignoring other inputs such as radar. Additional concerns included HUD being another system to cross-check, training issues, and the cost of integration. Overall, these findings suggest hypotheses and scenarios for further testing along with priority areas of focus. The findings suggest that the primary focus of future HUD research should be on testing the benefits in confined waters and for low visibility operations. Benefits should be compared between high-speed vessels and other larger vessels. The validation of benefits for a HUD providing task-specific information for operations such as dredging should also be tested. Empirical tests should be performed to compare performance (stress, workload, SA, utility) between mariners using various bridge configurations (e.g., combinations of HUD, ECDIS, radar, paper). Track following scenarios and measures are appropriate for inclusion. Scenarios should be developed to test the concerns listed above. Examples would be including hard-to-see targets (e.g., kayaks, small boats, debris) and variations in the locations of these objects in reference to the HUD presentation. Bad, or missing, data and related performance measures should also be integrated into test scenarios.
7.2. Week 11 HUD Survey. A second survey using the identical items was
administered in Week 11 of the course after students had the opportunity to interact with the HUD prototype. The same analysis methodology was used. In the interest of brevity
12

only five of the fourteen items from the Week 11 survey will be discussed here. The additional results and discussion are provided in Appendix A. Item 1: The HUD would be very useful in piloting situations. Mean T-value df P SE Range 3.857 4.076 20 < .007* .210 1-5 This result was significant. Participants felt that the HUD would be very useful in piloting situations. The responses were more mixed this time and there was some indication that after interacting with the HUD the participants were more biased to respond to the appearance and performance of the HUD prototype rather than the potential of a fully functioning and ideal HUD. Most of the comments were about specific features of the HUD presentation, such as the size of the trackline and the potential for distraction when larger tracklines were presented or some of the delays experienced in the performance of the prototype, or variations in the color of items. One participant noted that HUD would be very useful when the mate or master does his/her own piloting (e.g., ferries, dredges, etc.), especially on ships where the person at the con is also steering. Another participant noted that cross-track error input would provide better situational awareness and that presenting distance to the next waypoint would help with turns or wheel-over points. Item 6: The HUD would be useful during restricted visibility in heavy traffic situations. Mean T-value df P SE Range 3.76 3.074 20 < .007* .248 1-5 This result was significant. Participants felt that using a HUD would be useful during restricted visibility in heavy traffic situations. The comments provided a mixed review and cautions. This is likely representative of a trend for the participants that gave lower ratings to be more likely to explain their answers. One participant noted that target information would have to be provided. Several participants mentioned potential distraction, especially when there was a lot going on. One participant qualified their answer noting that the user would have to be able to select/deselect targets in close proximity. One participant noted that in heavy traffic, the HUD would make you feel like you had to follow your trackline. Item 8: I feel that using properly formatted HUD information would reduce my navigational workload.
Mean T-value df P SE Range 3.90 6.635 20 < .0001* .136 2-5
This result was significant. Participants felt that using a properly formatted HUD would reduce their navigational workload. One participant noted that HUD would reduce the amount of walking around required for the officer of the watch. Another noted the benefit
13
of having all of the information on one screen. Some counter comments included that he/she would still rely heavily on ECDIS. Another noted that HUD would be additional information to cross-check but beneficial. Item 9: I feel that HUD target information would reduce my collision avoidance workload.
Mean T-value df P SE Range 3.05 .188 20 ns .253 1-5
This result was not significant. Participants were neutral concerning a HUD-based reduction in collision avoidance workload. It should be noted that the HUD prototype used did not contain any target information. Comments suggested that HUD would provide a benefit if it provided a light overlay, especially at night. Some participants commented that HUD might create a distraction. One participant commented that they would still want to use as many navigation pieces as possible. One participant noted that they would not rely on HUD target information. These results suggest that future tests with a HUD that intelligently incorporates target information would be required to clarify the varied opinions. Item 11: Use of HUD would reduce my head down time in comparison with ECDIS. Mean T-value df P SE Range 4.43 12.910 20 < .0001* .110 4-5 This result was significant. Participants felt that using a HUD would reduce their head down time (HDT) compared to ECDIS navigation. One participant noted much reduced downtime and another cautioned that the benefit would only be realized if it was smooth enough. Note the range of responses with 4 (Agree) being the lowest response provided.
7.3 Overall Discussion of Both Surveys. The results indicate great potential for a maritime HUD system, especially for improving situational awareness in low visibility and confined waters conditions and for vessels where information changes rapidly (i.e., high speed vessels). The results also suggest that there are some standard information requirements across situations that could be augmented with task and vessel specific information.
The findings and conclusions from the initial survey before interacting with the HUD prototype were validated by the second survey, administered following participant interaction with the HUD prototype. The results were consistent across the two surveys, as were the trends in two of the three instances where significance testing for an item showed different results across the surveys. 8. CONCLUSION. The requirements testing plan and suggested modifications to the HUD prototype based on the preliminary evaluation are being implemented (starting in September 2010) in a second offering of the e-Navigation course being underwritten by a grant from the International Association of Maritime Universities (IAMU). The
14

researchers will prioritize new HUD features to include and evaluate based on perceived overall navigational value and the status of development of the HUD prototype. As the HUD mockup becomes a more refined, capable research tool, continued testing will produce and validate conclusions that: 1) define the operational requirements and concept of operations for a HUD system; 2) identify essential information, risks, and concerns; and 3) examine performance variations by conditions (environmental, vessel, crew) and tasks. The bulk of this groundwork will be completed by the end of 2010. The next step in marine HUD development is to identify a forward-thinking marine equipment manufacturer partner to help produce a working HUD prototype, capable of being tested aboard one or more of Cal Maritime’s small craft and eventually the training ship. An application for a continuation of the IAMU grant through 2011-2012 has already been submitted with this type of HUD development being one of its stated goals.
ACKNOWLEDGMENTS
The costs associated with the running the first e-Navigation course such as simulator time, simulator operator, and faculty release time were donated by the California State University. Funding for development of the HUD prototype application was provided by Anacapa Sciences, Inc.
REFERENCES
Fadden, S., Ververs, P.M., & Wickens, C.D. (1998). Costs and benefits of head-up display use: A meta-analytic approach. Proceedings of the Human Factors and Ergonomics Society 42nd Annual Meeting, pp. 16-20.
Fukuto, J., Hayama, I., Takanori, M., & Fukui, H. (2008). A field experiment on evaluation of an integrated navigational information display. The Journal of Japan Institute of Navigation,118, pp. 73-81. Gish, K.W., & Staplin, L. (1995). Human factors aspects of using head up displays in automobiles: A review of the literature. Report prepared for the National Highway Traffic Safety Administration’s Office of Crash Avoidance Research. (Report # DOT HS 808 320) Head-up Display. (n.d.). Retrieved July 12, 2009, from http://en.wikipedia.org/wiki/Head_up_display. Imazu, H. (2006). Course presentation: Ship collision and integrated information system. Advanced Topics for Marine Technology and Logistics 2006. Retrieved from http://www.soi.wide.ad.jp/class/20060026/slides/04/ Kirkley, S.E., & Walker, R. (2003). Location-intelligent marine information services and virtual aids to navigation (vAtoN): A phase 2 SBIR project investigating the creation of applications for the Intelligent Waterways System (IWS) using handheld computers and augmented reality interfaces. Technical Report prepared for the US Coast Guard Research and Development Center. (R & DC #654) Lin, S-K. V., Seibel, E.J., & Furness, T.A. (2003). Virtual retinal display as a wearable low vision aid. International Journal of Human-Computer Interaction, 15(2), pp. 245-263.
15

Newman, R.L. (1987). Improvement of Head-up display standards (Vol 1): Head- Up display design guide (Appendix). Report prepared for the Air Force Wright Aeronautical Laboratories Flight Dynamics Laboratory. (AFWAL-TR-87-3055) Porathe, T. (2006). 3-D nautical charts and safe navigation. Malardalen University Press
Dissertations, No. 27, pp. 266-274. Rockwell Collins, Inc. (2010). HUD basics [Fact sheet]. Retrieved from http://www.rockwellcollins.com/products/cs/at/avionics-systems/head-up-
displays/system-overview/hud-basics/index.html Technology Systems, Inc. (2010). ARVCOP: A complete navigation and mission support system for boats and land platforms. [Fact sheet]. Retrieved from http://www.arvcop.com/ Tsang, P.S., & Vidulich, M.A. (2003). Principles and practice of aviation psychology. Mahwah, NJ: Lawrence Erlbaum. Wilson, J.R., Hooey, B.L., Foyle, D.C., & Williams, J.L. (2002). Comparing pilot’s taxi performance, situation awareness and workload using command-guidance, situation-guidance, and hybrid head-up display symbologies. Proceedings of the Human Factors and Ergonomics Society 46th Annual Meeting, pp. 16-20. Yeh, M., Merlo, J.L., Wickens, C.D., & Brandenburg, D.L. (2003). Head-up versus head down: The costs of imprecision, unreliability, and visual clutter on cue effectiveness for display signaling. Human Factors, 45(3), pp. 390–407.
16

Appendix A: Additional Results and Discussion
Additional Week 6 Results and Discussion: Item 2: The HUD would be very useful in docking situations.
Mean T-value df P SE Range 2.79 -.926 23 ns .225 1-5
This result was not significant. Participants were neutral concerning a HUD advantage in docking situations with a trend towards not useful. A few students commented that a HUD could be useful if the information display changed to docking/conning information or possibly for approach but not actual docking. Other comments suggested poor utility because docking should be done visually, the bridge wing view being preferred, and the criticality of seeing the line handlers and others involved. Others suggested that for docking a sky view is better. Concerns included difficulties seeing distress signals and small hazards, and that with winds or major currents the system might just be annoying due to an inability to use a set course. Item 3: The HUD would be very useful in coasting situations.
Mean T-value df P SE Range 3.71 4.303 23 < .0001* .165 2-5
This result was significant. Participants felt that the HUD would be very useful in coasting situations. One participant cautioned that the usefulness would depend on the proximity to land and difficulty of the route. Another participant clarified that HUD would not be needed in coastal and offshore waters but it would still be nice to have speed and heading information when looking out the window. There was also clearly some confusion on the participants’ part as to what was meant by coasting. This should be considered a mixed result that requires further clarification. Item 4: The HUD would be very useful in the open ocean.
Mean T-value df P SE Range 2.29 -3.205 23 < .007* .221 1-5
This result was significant. Participants felt that the HUD would NOT be very useful in the open ocean. Several participants qualified their answers by saying that the information would be nice but not necessary due to fewer hazards, less precision required, their ability to rely on GPS and radar, and that HUD information could just be a distraction. One comment suggested that route data might be useful but the trackline was not. Another participant saw a potential detriment to night vision as a problem.
17

Item 5: Use of HUD would be useful during restricted visibility in open waters.
Mean T-value df P SE Range 3.71 2.991 23 < .007* .237 2-5
This result was significant. Participants felt that using a HUD would be useful during restricted visibility in open waters. The participants that disagreed often noted that they did not believe HUD was very useful for open waters (see reasons noted above in Item 4). The researchers suggest that those that agreed were largely responding to HUD’s usefulness in restricted visibility situations rather than the open water component. Item 7: Use of HUD would be useful during restricted visibility in pilotage waters.
Mean T-value df P SE Range 4.50 12.460 23 < .0001* .120 3-5
This result was significant. Participants felt that using a HUD would be useful during restricted visibility in pilotage waters. Some participants commented that the advantage would be there only if the HUD displayed buoys, lights, bridges, and landmasses. This is a clear indication of the combination of the value seen for HUD in confined waters, such as pilotage situations, with the value seen for low visibility operations in general. Item 10: I feel that using HUD information would reduce my stress level.
Mean T-value df P SE Range 4.0 8.307 23 < .0001* .120 3-5
This result was significant. Participants felt that using HUD information would reduce their stress level. One participant qualified their answer by noting that the HUD system would relieve stress only once the system was trusted. Item 12: Use of HUD would reduce my head down time in comparison with radar navigation.
Mean T-value df P SE Range 3.63 2.698 23 ns .232 1-5
This result was not significant. Participants were neutral concerning a head down time (HDT) benefit from HUD compared to radar navigation. The trend was in the positive direction. It should again be noted that the HUD prototype did not contain any target information or collision avoidance information. Several comments noted that there was a need to integrate radar and other target data to realize this benefit. Those that did not see a HDT reduction often commented that there is still a need to cross-check information and enter data unless the whole process changed.
18

Item 13 : Use of HUD would reduce my head down time in comparison with paper chart navigation.
Mean T-value df P SE Range 4.33 7.524 23 < .0001* .177 2-5
This result was significant. Participants felt that using a HUD would reduce their HDT compared to paper chart navigation. Participants saw reduced HDT as a primary HUD benefit. The only participant that responded with a 2 noted that one still has to do the chart work. Item 14: A HUD application would provide a valuable addition to the navigating bridge environment.
Mean T-value df P SE Range 4.54 12.840 23 < .0001* .120 3-5
This result was significant. Participants felt that a HUD application would provide a valuable addition to the navigating bridge environment. There were few comments on this item as most comments had already been addressed through the other items. Some of the limited comments included that the concept was futuristic but seemed to be the way the world was going. Others compared the concept to technologies from other domains (e.g., automobiles, aviation). One noted that it could put critical information all in one place. Additional Week 11 Results and Discussion: Item 2: The HUD would be very useful in docking situations.
Mean T-value df P SE Range 2.28 -3.423 20 < .007* .209 1-4
This result was significant. Participants felt that the HUD would NOT be very useful in docking situations. This is consistent with the non-significant negative trend observed in the initial survey. A few students commented that a HUD could be useful if the information display changed to docking/conning information (e.g., heading, traverse speed, distance to dock) or possibly for approach but not actual docking. One participant suggested that when docking in restricted visibility, HUD would be useful. Other comments suggested that the poor utility during docking was because there are too many variables, docking is more interactive, and that the bridge wing view is preferred. Item 3: The HUD would be very useful in coasting situations.
Mean T-value df P SE Range 3.90 4.663 20 < .007* .194 2-5
19

This result was significant. Participants felt that HUD would be very useful in coasting situations. Comments explaining the utility suggested that HUD would help to keep the cross-track error small and cross-check the autopilot. Participants who saw less utility made comments that HUD is unnecessary in open water situations. Item 4: The HUD would be very useful in the open ocean.
Mean T-value df P SE Range 3.09 .384 20 ns .248 1-5
This result was not significant. Participants were neutral concerning the utility of HUD in the open ocean. One participant noted a benefit to having the route laid out. Another participant stated that they would not need it. In the initial survey most participants thought that HUD would NOT provide a benefit in the open ocean. In this case the trend was slightly positive. Overall though, open ocean operations are not seen as the primary application for the basic HUD information provided by the prototype. Item 5: Use of HUD would be useful during restricted visibility in open waters.
Mean T-value df P SE Range 4.24 9.080 20 < .0001* .136 3-5
This result was significant. Participants felt that using a HUD would be useful during restricted visibility in open waters. The one comment suggested that a benefit would come from being able to see contacts. Those that agreed were possibly responding more to HUD’s usefulness in restricted visibility situations rather than the open water component. Item 7: Use of HUD would be useful during restricted visibility in pilotage waters.
Mean T-value df P SE Range 4.24 9.080 20 < .0001* .136 3-5
This result was significant. Participants felt that using a HUD would be useful during restricted visibility in pilotage waters. No comments were provided. This is a clear indication of the combination of the value seen for HUD in confined waters, such as pilotage situations, with the value seen for low visibility operations in general. Item 10: I feel that using HUD information would reduce my stress level.
Mean T-value df P SE Range 3.81 4.250 20 < .0001* .190 1-5
This result was significant. Participants felt that using HUD information would reduce their stress level. The comments again primarily came from those participants that provided lower ratings. One noted that it could also create more stress. Several
20

participants commented on their lack of familiarity with HUD impacting their judgment. These comments again suggest a tendency for some participants to respond to the prototype experience rather than the overall HUD concept. Item 12: Use of HUD would reduce my head down time in comparison with radar navigation.
Mean T-value df P SE Range 3.57 3.009 20 = .007* .189 2-5
This result was significant. Participants felt that using a HUD would reduce their HDT compared to radar navigation. This is consistent with the positive trend found in the initial survey. It should again be noted that the HUD prototype did not contain any target information or collision avoidance information. Participants noted that radar would still be important to use and necessary for ARPA information. This result brings into question whether the participants were responding to the concept of a HUD that included target information that would typically be provided by radar or just to the benefit of having HUD trackline, waypoint, speed and heading information available. In this instance participants’ responses probably represent the former. Further research will be required to better define the potential benefit of HUD-provided target information. Item 13: Use of HUD would reduce my head down time in comparison with paper chart navigation.
Mean T-value df P SE Range 4.52 9.316 20 < .0001* .164 2-5
This result was significant. Participants felt that using a HUD would reduce their HDT compared to paper chart navigation. The only participant who responded with a 2 stated that even with HUD, paper charts would still be needed. Item 14: A HUD application would provide a valuable addition to the navigating bridge environment.
Mean T-value df P SE Range 4.19 8.027 20 < .0001* .148 3-5
This result was significant. Participants felt that a HUD application would provide a valuable addition to the navigating bridge environment. One participant noted that HUD could re-orient the bridge team dynamic so that the person at the con could let the helmsman steer the track, rather than constantly giving helm orders and courses to steer. Two participants cautioned that it would have to be implemented correctly and proven in practice.
21

Appendix B: Analysis Notes
When interpreting results from preliminary studies such as this it is important to understand one’s purpose and perform the appropriate analyses and interpretations based on this purpose and all the information available. Therefore, the following explanatory notes are warranted.
The first note is that these surveys are seen as a preliminary step in an overall evaluation of the HUD concept for maritime operations. When conducting research involving statistical analyses, the first challenge is to select a significance criterion that keeps the appropriate balance between the chances of committing a Type 1 Error (a false positive or untrue finding of significance) and a Type II error (a false negative or failing to identify a truly significant finding). The academic world and the standard p value of .05 are heavily biased towards preventing Type 1 errors. The goal of the initial surveys was to identify preliminary conclusions, concepts, and questions (e.g., best and worst scenarios, features, etc.) that required further testing within the scope of the course and through additional evaluations (simulated and real-world). In these situations, where both preliminary evaluation and further testing are planned, greater priority should be given to preventing the elimination of significant items (committing a Type 2 errors) than is normal for the research field.
Although the researchers had firm hypotheses for what the results would indicate, this research was also exploratory and utilized multiple t-tests to evaluate the survey items. Therefore caution against the increased probability of committing a Type 1 error that comes with conducting multiple tests was needed. The approach that was adopted was to raise the overall significance criterion to p < .10, an acceptable and still conservative p level for an exploratory study, and then perform a correction based on the number of tests conducted (the Bonferroni Correction). With 14 items in each survey this resulted in a significance criterion of .0071. Therefore any item with a p value of .007 or less was considered significant.
The second note is that to truly understand the survey results it is often important to go beyond just the raw numbers and statistics and look at all the information available. This includes the comments made for each item, as well as the relevant overall comments provided, and observations made by the instructors. These comments often provided indicators of how participants understood the question and framed their response. An example would be response differences based on whether the participant answered in reference to the overall concept of an ideal HUD or to the current state of the prototype and available features. These explanations were provided as warranted in the discussion sections.
22