Embed Size (px)
Citation preview

Air Pollution: local and remote sources
Maria de Fatima Andrade
Atmospheric Sciences Department
FAPESP, NOV 28TH, 2016
Outline
- The Characteristics of Brazil Megacities- Geography- Air pollution sources- São Paulo Metropolitan Area- Evolution of Pollutants Concentration- Characteristics of Sources
- Main Pollutants: primary and secondary production- Ozone- Fine Particles
- Sources characterization- Modelling of transport – Chemical Transport Models
- Open questions

Population of Brazil 202.768.562
Populationdensity
Brazil - Geography
FAPESP, NOV 28TH, 2016

Recife
Belo Horizonte
Rio de JaneiroSão Paulo Curitiba
Porto Alegre
Metropolitan Region Population (Millions) Area (mil km2)
São Paulo 19.9 7.9
Rio de Janeiro 11.8 5.6
Belo Horizonte 5.0 0.9
Porto Alegre 9.8 4.1
Curitiba 3.2 15.4
Recife 3.8 2.8
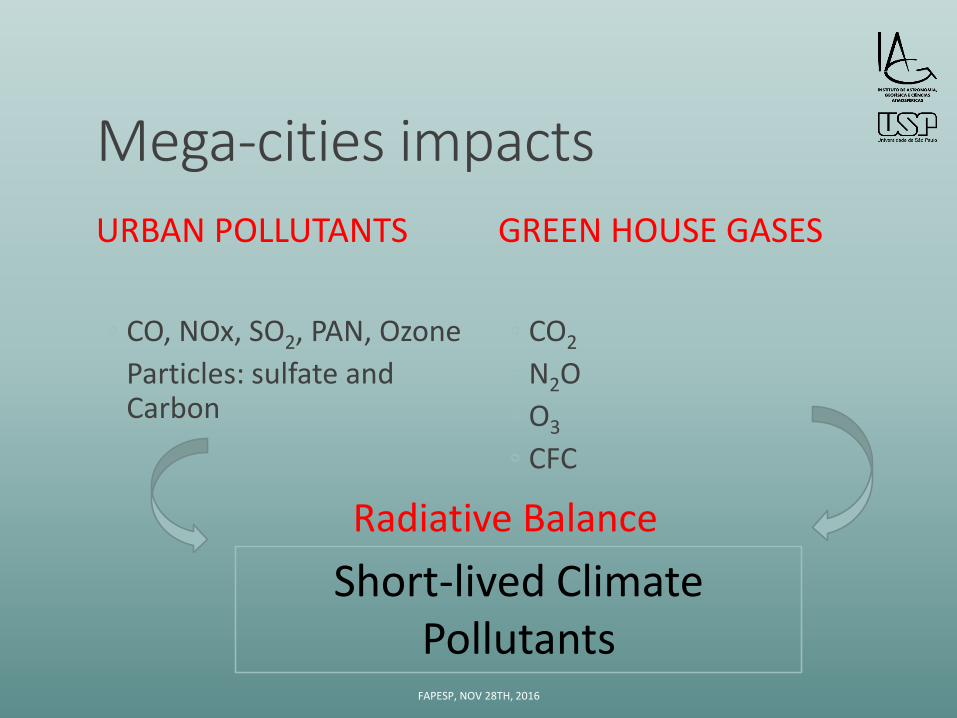
Mega-cities impacts
◦ CO, NOx, SO2, PAN, Ozone
◦ Particles: sulfate and Carbon
◦ CO2
◦ N2O
◦ O3
◦ CFC
FAPESP, NOV 28TH, 2016
Short-lived Climate Pollutants
URBAN POLLUTANTS GREEN HOUSE GASES
Radiative Balance

PM2.5
0 50 100 150
Rio de Janeiro
Osasco
São Paulo
Vitoria
Berlin
Birmingham
Stockholm
Sydney
Jakarta
Beijing
Tehran
Istanbul
Seoul
Hong Kong
Los Angeles
Buenos Aires
Annual Mean PM2.5 (μg m–3)
Megacities worldwide
Other cities
worldwide
Brazilian cities
WHO annual mean PM2.5 (10 μg m–³ )

0 50 100 150 200 250 300
Rio de Janeiro
Osasco
São Paulo
Vitoria
Amsterdam
Birmingham
San Francisco
Sydney
Mumbai
Beijing
Tehran
Seoul
Istanbul
Hong Kong
Los Angeles
Paris
Annual mean PM10 (μg m–3)
WHO annual mean PM10
(20 μg m–³ )
Megacities
worldwide
Other cities
worldwide
Brazilian
cities
PM10
FAPESP, NOV 28TH, 2016
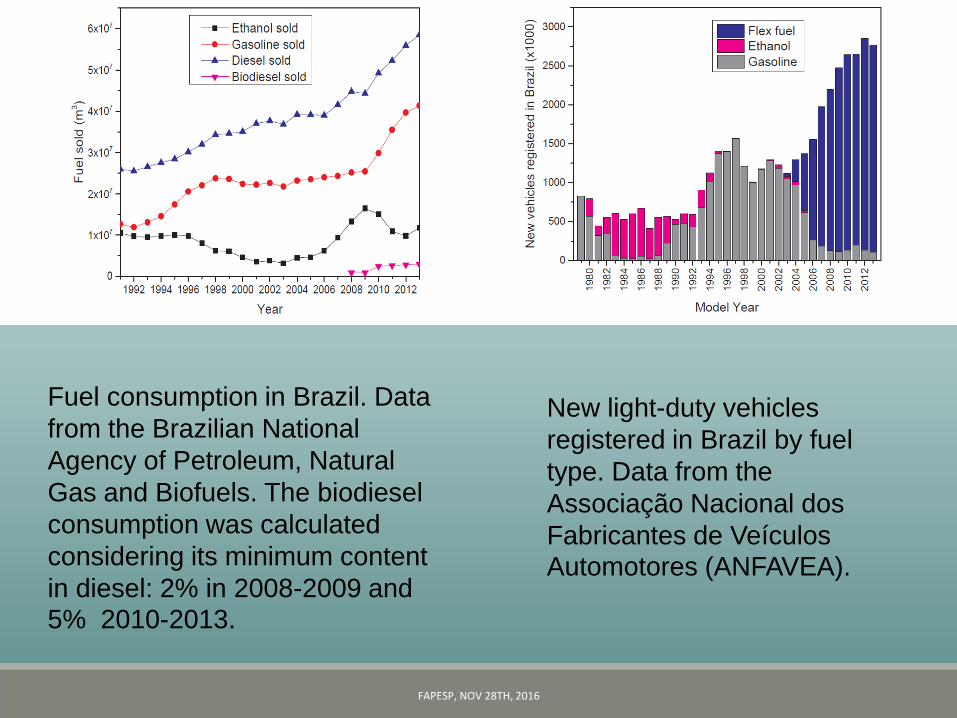
Fuel consumption in Brazil. Data
from the Brazilian National
Agency of Petroleum, Natural
Gas and Biofuels. The biodiesel
consumption was calculated
considering its minimum content
in diesel: 2% in 2008-2009 and 5% 2010-2013.
New light-duty vehicles
registered in Brazil by fuel
type. Data from the
Associação Nacional dos
Fabricantes de Veículos Automotores (ANFAVEA).

FAPESP, NOV 28TH, 2016
0
0,2
0,4
0,6
0,8
1
1,2
0
5
10
15
20
25
30
35
40
45
50
2006 2007 2008 2009 2010 2011 2012 2013 2014 2015
Emis
sio
n f
acto
r g/
km
μg
m–³
São Paulo Rio Belo Horizonte Emission Factor
Mean concentration of PM10 obtained at the air quality stations in São
Paulo, Rio de Janeiro and Belo Horizonte and the average emission
factor for light-duty fleet.


NUANCE - NARROWING THE UNCERTAINTIES ON AEROSOL AND CLIMATE CHANGE IN SAO PAULO
Maria de Fatima Andrade
Atmospheric Sciences Department
Instituto de Astronomia, Geofísica e Ciências Atmosféricas
Universidade de São Paulo
Processo número: 08/58104-8

NARROWING THE UNCERTAINTIES ON AEROSOL AND CLIMATE CHANGES IN SAO PAULO STATE NUANCE-SPS
Website: http://nuance-lapat.iag.usp.br/Coordenation: Maria de Fatima AndradeCO-PI: Paulo Saldiva, Eduardo Landulfo e Edmilson Dias de Freitas.
IAG: prof. Adalgiza Fornaro, prof. Fabio Gonçalves, prof. Edmilson Freitas, profa. Rita Yuri YnoueIQ: profa. Perola VasconcellosIPEN: prof. Eduardo LandulfoIGc: Profa. Marli BabinskiIF: prof. Americo KerrFMUSP: prof. Paulo SaldivaEACH-USP: profa. Regina Miranda e prof. Andrea CavichiooliUFABC: Claudia BoianMackenzie: prof. Jairo PedrottiUNESP: profa. Maria Lucia AntunesUTFPr: Prof. Jorge Martins, Profa. Leila MartinsCETESB: Maria Lucia Guardani, Jesuino Romano, Maria Helena Martins, Maria Cristina Oliveira.

The megacity of São Paulo was an example of integrated approach regarding evaluating of the impact of the climate change on its air quality. In this project, MASP was considered an “observatory of the climate”, with special attention to the variation of the meteorological characteristics due to the climate change.
The NUANCE project - Target

Metropolitan Area of São Paulo - MASP
Metropolitan Area of São Paulo
Area: 8051 km2
Urb: 1500 km2
Pop: 23 million people
Vehicles: > 6 million
Distance from the sea-shore: 70 km
Lat=-23.6o
Lon=- 46.7o
Vehicles: > 7 million
MASP= São Paulo city + 38
cities
•20 million inhabitants
•7,2 million vehicles
•2000 significative industrial
plants
•8000 km2
FAPESP, NOV 28TH, 2016

Important questions
Expansion of urban areas and population growth

Very dense urban area
Contrast between urban and suburban areas
Social Inequalities: airpollution, soil use and
transport sector.
FAPESP, NOV 28TH, 2016

FAPESP, NOV 28TH, 2016
- Mega-city with desorganized growth- Meteorological conditions: worst events in winter (dry season
with radiative inversions)
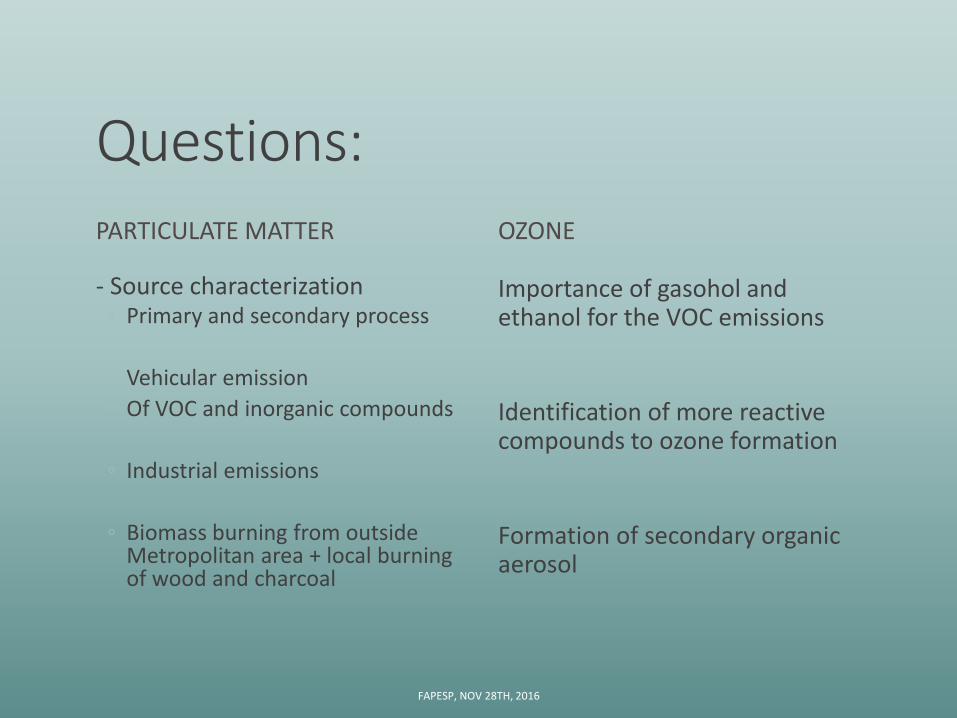
Questions:PARTICULATE MATTER
- Source characterization◦ Primary and secondary process
◦ Vehicular emission
◦ Of VOC and inorganic compounds
◦ Industrial emissions
◦ Biomass burning from outside Metropolitan area + local burning of wood and charcoal
OZONE
Importance of gasohol and ethanol for the VOC emissions
Identification of more reactive compounds to ozone formation
Formation of secondary organic aerosol
FAPESP, NOV 28TH, 2016

Characterization of the Problem
P. Kumar et al. (2016), Atmos. Environ.
FAPESP, NOV 28TH, 2016

MASP (Metropolitan Area of São Paulo )
Population:~ 20 million inhabitants.
Area: 8511 km2
Vehicle fleet: 7 million passenger and commercial vehicles
85% light-duty vehicles (LDVs)
55% of LDVs use gasohol (75% gasoline
+25% ethanol)
4% use hydrous ethanol (95% ethanol
+5% water)
38% are flex-fuel (any proportion of gasohol
or ethanol)
2% use diesel (diesel with 8% biofuel)
3% heavy-duty diesel vehicles (HDVs)
12% motorcycles
•Ethanol represents 55% of the burnedfuel.
•50% of the cars are older than 1997.

Temporal evolution of fuel burned (ethanol plus gasoline) and total
fleet in the State of São Paulo.
Vanessa Silveira Barreto Carvalho , Edmilson Dias Freitas , Leila Droprinchinski Martins , Jorge Alberto Martins , C...
Air quality status and trends over the Metropolitan Area of São Paulo, Brazil as a result of emission control policies
Environmental Science & Policy, Volume 47, 2015, 68 - 79http://dx.doi.org/10.1016/j.envsci.2014.11.001
FAPESP, NOV 28TH, 2016

Annual evolution of fuel consumption for ethanol and gasohol
and the number of vehicles running that burn gasohol, ethanol
and flex-fuel vehicles in MASP, from 2000 to 2013.

Characterizationof regulatedpollutants
FAPESP, NOV 28TH, 2016

Air quality Monitoring Stations from CETESBEnvironmental Agency from São Paulo State
49 automatic stations2 mobile stations39 manual sampling site
FAPESP, NOV 28TH, 2016

Air quality Monitoring Stations from CETESB –Metropolitan Area of Sao Paulo
FAPESP, NOV 28TH, 2016

monthlymean fuelsales for gasoline, ethanol anddiesel
and theconcentrationfor NOX , CO and O3
gasoline
ethanol
Diesel
NOx
CO
O3
Perez et al., 2015, JGR

FAPESP, NOV 28TH, 2016
Programs for Reduction of Emissions by Vehicular Fleet
PROCONVE: PROGRAM FOR CONTROLLING THE VEHICULAR EMISSIONS
Established in 1983 for light and heavy-duty vehicles
PROMOT: PROGRAM FOR CONTROLLING THE EMISSIONS BY MOTORCYCLES
Established in 2003 for regulation of motorcycles emission.

2013
Passangerscars
Diesel
FAPESP, NOV 28TH, 2016

Sources not accounted properly- Vehicles Evaporative emission (refuelling, running losses, etc)
- Domestic emissions
- Wood and charcoal burning for restaurants
- waste burning
- biomass burning from agricultural process
FAPESP, NOV 28TH, 2016

FAPESP, NOV 28TH, 2016
Sources notaccounted correctly: evaporative emissions

NMHCs average mixing ratios in São Paulo compared with
those in other megacities.
Paris and London data were obtained in urban background air quality stations (Evry (AIRPARIF, 2013) and
London Eltham site (DEFRA, 2013), respectively). Los Angeles data were attained from CalNEx study in
2010 (ref) (CalNex, 2010). Dominutti et al., 2016. Atmos. Environ.

FAPESP, NOV 28TH, 2016
May 19 – 22, 2016 – Active Data Fire, MODIS, 1 km -NASA
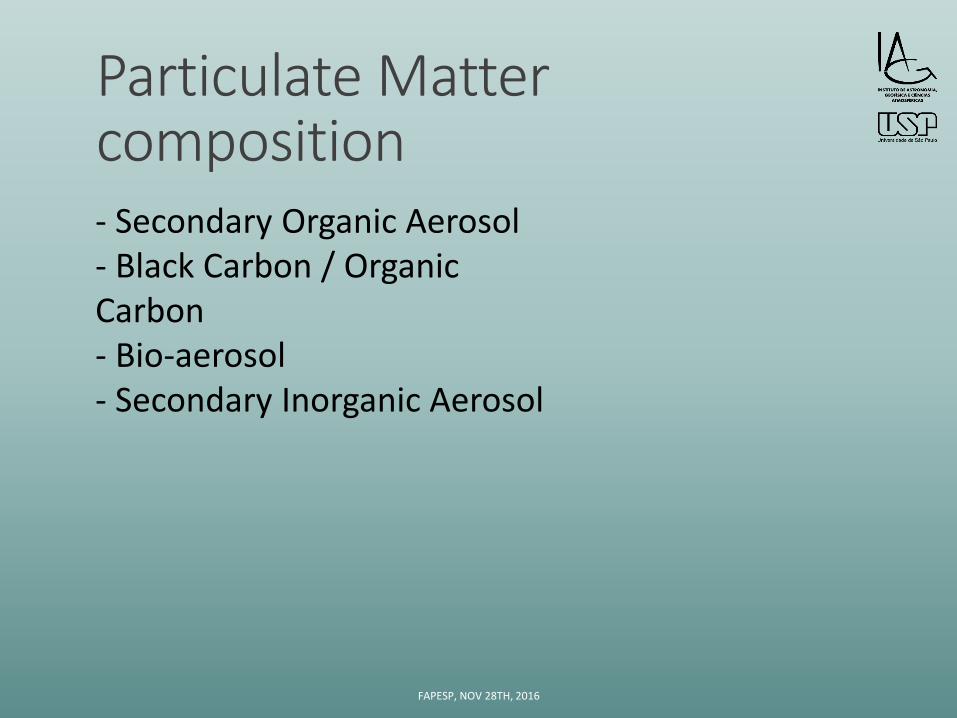
Particulate Matter composition
FAPESP, NOV 28TH, 2016
- Secondary Organic Aerosol- Black Carbon / OrganicCarbon- Bio-aerosol- Secondary Inorganic Aerosol

Historical Data S, V and Pb decrease
OC/PM2.5= 0.55EC/PM2.5= 0.20
FAPESP, NOV 28TH, 2016
1
10
100
1000
10000
1977 1981 1983 1986 1989 1994 1997 1998 1999 2003 2005 2008 2009 2012 2013
C o
nce
ntr
atio
n
MP2.5 S K V Fe Pb

CARBONACEOUS AEROSOL COMPOSITION IN PM2.5
• 90 % Vehicularsources
• 10% Biomass BurningEC
• Secondary Carbonfrom Vehicles
• Primary OrganicCarbon (BiomassBurning, Vehicular)
OC
Vehicular emissions of organic particulatematter in Sao Paulo, BrazilAuthor(s): B.S. Oyama et al.MS No.: acp-2015-774
FAPESP, NOV 28TH, 2016

SOURCE APPORTIONMENT: AMBIENT DATA
• Two sources for EC: vehicular and biomass burning
• OC: OCprim (vehicular + biomass burning) and OCsec (vehicular + other)

Mainly Analyzed Sporous. A: Pithomyces sp.; B: Venturia sp.; C: Torula sp.; D: Basidiósporo
colorido indeterminado; E: Spegazzinia sp.; F: Myxomycota; G: Gliomastix sp.; H: Ascósporo de 4
células com cor; I: Ganoderma sp.; J: Epicoccum sp.; K: Diatrypaceae Grande; L: Ascósporo de 2
células sem cor; M: Paraphaeosphaeria sp.; N: Basidiósporos hialino grande; O: P: Cladosporium
sp. sp.; Q: Ascósporo de 4 células sem cor R: Drechslera-like. S: Xylariaceae T: Periconia sp.
Pollen Spores in São Paulo
PM
10
–B
ioae
roso
ls
Mendes et al. 2016, submitted Environmental Pollution
FAPESP, NOV 28TH, 2016

Ascomicetos
Basidiomicetos
Basidiosporo
Ascosporo
Myxomicetos
Deuteromicetos
Mitosporos
Methodology:
HAINES et al., 2000; Imagens: VALERO, 213; GUIMARÃES, 2008; ONTARIO CROPIPM, 2009; ROCA, 2015

Average Maximum Minimum
Arabitol 0,11% 0,38% 0,04%
Mannitol 0,22% 0,72% 0,08%
Levoglucosan 2,01% 14,19% 0,54%
Galactosan 0,05% 0,39% 0,00%
Mannosan 0,19% 1,28% 0,06%
Threitol 0,07% 0,19% 0,02%
Methyl-Threitol 0,14% 0,51% 0,00%
Meyhyl-erythritol 0,43% 1,12% 0,00%
Total carbohydrate 3,66% 17,97% 1,02%
WSOC 25,16% 82,07% 0,00%
Average, maximum and minimum percentage of the contribution of
each sugar, all sugars and the WSOC for the PM10 mass
(Mendes et al, 2016)
PM10
FAPESP, NOV 28TH, 2016
FAPESP, NOV 28TH, 2016
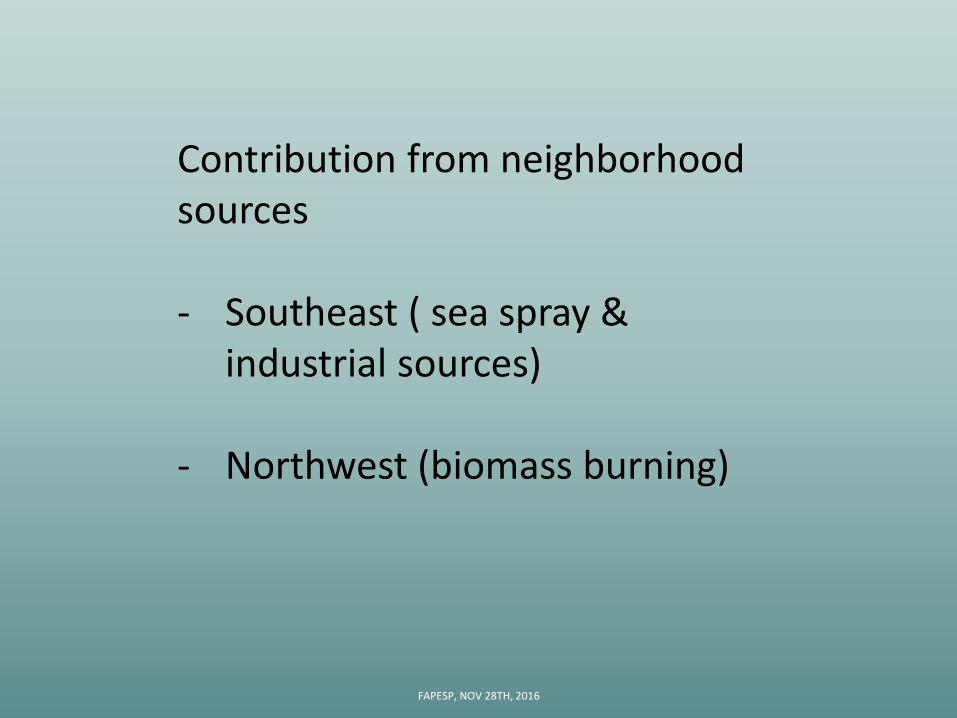
Contribution from neighborhood sources
- Southeast ( sea spray & industrial sources)
- Northwest (biomass burning)

Source Apportionment – Biomass Burning
Biomass
burning
plumes
2 4 6 8 10 12
0.1
1
10
Dp (
nm
)
X Title
0.0
3.0x10⁻¹
6.0x10⁻¹
9.0x10⁻¹
1.1x100
6M 6N 7M 7N 8M 8N 9M 12M 12N 13M 13N 14M
Days
BC
Oliveira et al., 2016, ACP
FAPESP, NOV 28TH, 2016
LIDAR IPEN

2 4 6 8 10 12
0.1
1
10
Dp
(n
m)
X Title
0.0
3.3x10⁻¹
6.6x10⁻¹
9.9x10⁻¹
1.2x100
6M 6N 7M 7N 8M 8N 9M 12M 12N 13M 13N 14M
Days
Cl
Source Apportionment – Sea salt
Oliveira et al., 2016, ACPFAPESP, NOV 28TH, 2016
LIDAR IPEN

Summary-Mass balance of fine particles showed theimportance of carbonaceous compounds
-- OC and EC mainly from vehicular emissions
-- Biomass burning from local sources x remote transport from Amazonian Region
-How to identify local biomass burning fromregional transport?
FAPESP, NOV 28TH, 2016
Modeling approachSPM-BRAMS & WRF-CHEM

FAPESP, NOV 28TH, 2016

Spatial distribution of emissions
Street data (www.openstreetmap.org)
FAPESP, NOV 28TH, 2016

Geographic information from Open Street Maps
RoadMain streetPrimary streetSecondary streetstreet
FAPESP, NOV 28TH, 2016

Density (km of street\grid) number of vehicles proportional to the density
Grid 9km x 9kmFAPESP, NOV 28TH, 2016

FAPESP, NOV 28TH, 2016www.lapat.iag.usp.br

FAPESP, NOV 28TH, 2016

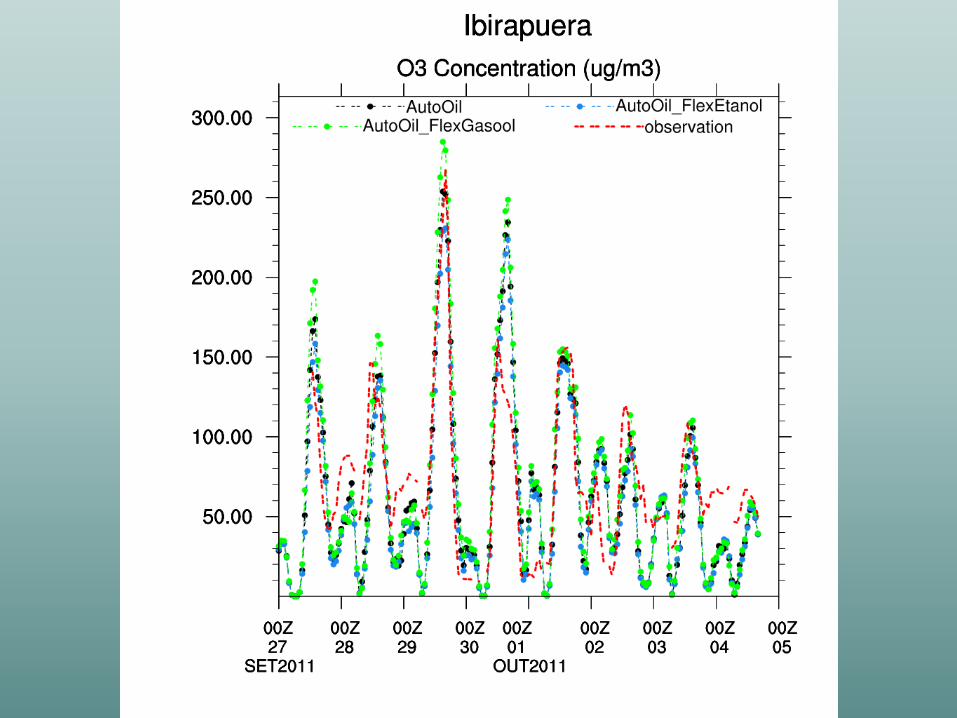
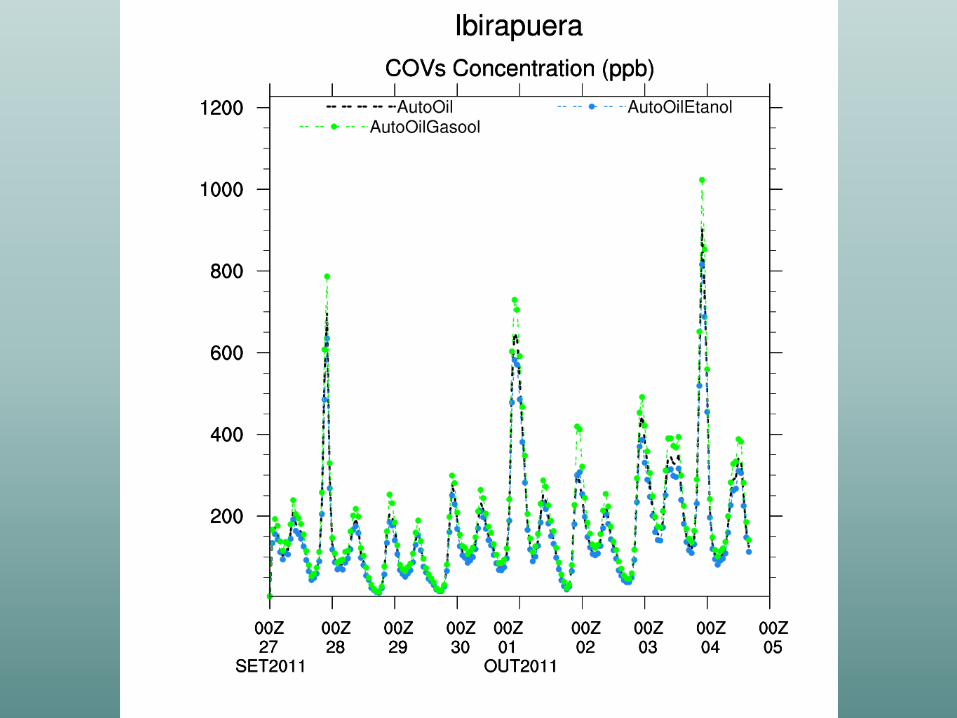
Impact of ethanol/gasohol on ozone formation
Scenarios
1- All the FLEX Fuel vehicles running with gasohol
2- All the Flex Fuel vehicles running with ethanol
FAPESP, NOV 28TH, 2016
FAPESP, NOV 28TH, 2016

FAPESP, NOV 28TH, 2016

SOME CONCLUSIONS
PM2.5
• OC 40-50% MASS
• SOA
• EC 25-30 % MASS
• FUEL (90%) AND BIOMASS
BURNING (10%)
• IONS + METALS 15% MASS
PM10
• SOIL DUST AND SEA SALT
(40%)
• ORGANIC MATERIAL (40%)
• COMBUSTION PROCESS

SOME CONCLUSIONS
CCN
• BIOMASS BURNING AND
SEA SALT AIR MASS WERE
IDENTIFIED BY A
COMBINATION OF LIDAR
ANALYSIS, HYSPLIT
TRAJECTORY AND SIZE
DISTRIBUTED CHEMICAL
COMPOSITION.
• IMPACT OF EVAPORATIVE
EMISSIONS (RUNNING LOSS,
REFUELLING AND HOT
SOAK)
OZONE

New targets- improve representation ofsurface- improve emissions factor- inclusion of GHG

Experimental SITES
CO2 and CH4 sites
Jaraguá
IAG
FAPESP, NOV 28TH, 2016

Acknowledgements
THANK YOUOBRIGADA
FAPESP, NOV 28TH, 2016