Embed Size (px)
Citation preview

1 Strictly private and confidential
March 31st, 2015

2 Strictly private and confidential
Disclaimer
This presentation is being shown to you solely for your information and may not be reproduced, distributed to any other person or published, in whole or in part, for any purpose. The information in this presentation could include forward-looking statements which are based on current expectations and projections about future events. These forward-looking statements are subject to risks, uncertainties and assumptions about the Company and its subsidiaries and investments. Including, among other things, the development of its business, trends in its operating industry, and future capital expenditures and acquisitions. In light of these risks, uncertainties and assumptions, the events in the forward-looking statements may not occur. No one undertakes to publicly update or revise any such forward-looking statements.

3 Strictly private and confidential
IVS at a glance § IVS Group S.A. is the market leader in the Italian vending machine
operators’ sector (~12.7% Italian market share in value; 9.5% in volumes), and the only player with a nationwide presence. Third largest vending player in Europe (and the only public listed vending company).
§ Owned by its active managers and founding shareholders, which control ca. 65% of the shares, while the rest is owned by the market (free float)
Leadership position in a highly fragmented European and
Italian market (>10,000 players)
Well-regarded management team with strong industry
experience Relatively stable sector and
high entry barriers
Diversified customer portfolio (contract
renewal rates in excess of 95%)
Proven success in the integration of > 100 bolt-on
acquisitions since 2007
Pricing power track record: 4% CAGR 2009-13 & Best in class
logistic and operations
IVS HISTORY AND KEY EVENTS § Founded by Mr. Cerea and Mr.
Gualdi (Bergamo Distributori)
§ Merger of 15 companies into IVS Group
§ Acquisition of Gruppo Cantel/ CafeBon
§ Acquisition of Vending System Italia (‘VSI’)
§ Acquisition of Coinservice
§ Listing on Borsa Italiana via combination with the SPAC Italy1 Investment SA (MIV segment)
1970
2011
2006
2007
2012
2009
2013 § € 200 million bond due 2020 § Listing on Italian stock market
main segment (MTA) § Incorporation of IVS Swiss S.A. § 9 acquisitions (Euro 18 million)
2014 § Tap of € 50 million bond 2020 § Completed 27 acquisitions for a
value of around € 50 million

4 Strictly private and confidential
IVS Group at a glance KEY HIGHLIGHTS A TOP THREE OPERATOR (BY
SALES) IN EUROPE GEOGRAFICAL FOOTPRINT IVS Group operations
KEY PRODUCTS LEADER IN THE ITALIAN VENDING MARKET
2014 SALES BY GEOGRAPHY AND LOCATION
70% 30% 152K
656m
18,1
77
2.168
1.600
Vending machines
Vends
Daily vends x machine
Branches
Employees
Vehicles
AVM OCS
Source: Factset
<€50m
€50m - €100m
€250m -
€100m
>€ 300m
More than 10,000 small operators in
Europe
‘Auto Mix’ ‘Auto Hot’
Office Coffee
Systems (OCS)
Automatic Vending Machines (AVM) 13%
8%
5%
4%
2% 2% 2%
COIN 4%
Italy 82%
France 8%
Spain 6%
Corporate
64%
Public 26%
Travel 10%
Note: (1) Associated companies.

5 Strictly private and confidential
IVS Operating Model in a snapshot Our Logistics, Maintenance investments and IT infrastructure underpins a highly efficient vending operation
Purchasing of goods Stocking Distribution & refilling
Selling/Customer management
VMs maintenance VMs set up and/or revamping
Purchasing of VMs
4 Countries
20 Geographical Areas/ Regions
77 Branches
~ 60,000 Client Sites ~15 million Final Customers
KPIs 2014 2013
Vends 656m 645m
Sales (from vends) €297m €286m
ASP €45.2c €44.3c

6 Strictly private and confidential
IVS’ Marketing & Logistic Skills (1/2)
FULL-SERVICE APPROACH, FOCUSED ON QUALITY AND INNOVATION The Group has a well-known reputation for quality, excellent service, customer care and continuous innovation, enabling the company to form strong and lasting relationships across a broad client spectrum.
IVS’ KEY SUCCESS FACTORS IN WINNING CONTRACTS
§ Strong reputation. § Ability to offer different full-service solutions to
meet the specific requirements. § Attractive goods and price propositions.
PAYMENTS
§ IVS’ POSs are ready to accept any credit cards’ technology, included Pay Pass and PayWawe;
§ It’s possible to buy with a Smartphone - with his NFC sim card combined with a credit card - in some of IVS’ Vending Machines

7 Strictly private and confidential
IVS’ Marketing & Logistic Skills (2/2) LOGISTICS: BEST-IN-CLASS OPERATIONAL QUALITY § Efficient network of 77 branches to run operations both effectively and
efficiently.
§ Efficient supply chain: centralized purchasing division responsible for pricing and commercial negotiation.
§ Cash collection integrated with refill operations.
§ State of the art control system (directions rooms for real-time monitoring operators, customers on a branch-by-branch basis, refill needs, technical problems etc.; centralized business data base system):
§ Real time control of public and/or unattended machines;
§ Optimization of the refilling process and maintenance, minimizing costs and lost sales due to empty machines;
§ Centralized call-centre integrated with business management procedures).
> 90% of the Technical Calls Received Are Resolved in
Within 8 Hours
TELEMETRY § IVS is the only italian player with telemetry technology,
§ Vends in real time
§ Potential breakdown
§ Precautionary maintenance

CONFIDENTIAL & PROPRIETARY
Acquisitions - Drivers of Synergies (1/2)
§ Higher vends per VM through: § Improved assortment § Reduced out-of-stock
§ Higher price per vend through: § Price increase following
newer / revamped VM § Better product mix
KEY DRIVERS
CASE STUDY: VSI ASP EVOLUTION AFTER ACQUISITION
42.0
40.139.7
38.5
34.8
37.2
38.4
40.9
34
35
36
37
38
39
40
41
42
43
J un 2009 D ec 2009 D ec 2010 D ec 2011
Deal: June 2009
€3.7 c.
€2.5 c.
€1.7 c.
€1.1 c.
IVS Italia
VSI
CAGR Jun ’09-Dec ‘11
3.6%
6.6%
CASE STUDY: VSI LFL VEND PER VM PER WORKING DAY EVOLUTION
100
104.5
115.2 118.2
97.098.698.0
82
86
90
94
98
102
106
110
114
118
122
2H 2009 1H 2010 2H 2010 1H 2011
Vends per VM per working day (2H ’09 = 100)
6.5 p.p.
16.6 p.p.
21.2 p.p. Deal: June 2009
VSI LfL
IVS Italia LfL
CAGR 2H’09 – 1H’11 8.6%
ACQUISITION IN VM BUSINESS IS DRIVEN BY 2 TYPES OF SYNERGIES:
01 Top line synergies
CONFIDENTIAL & PROPRIETARY
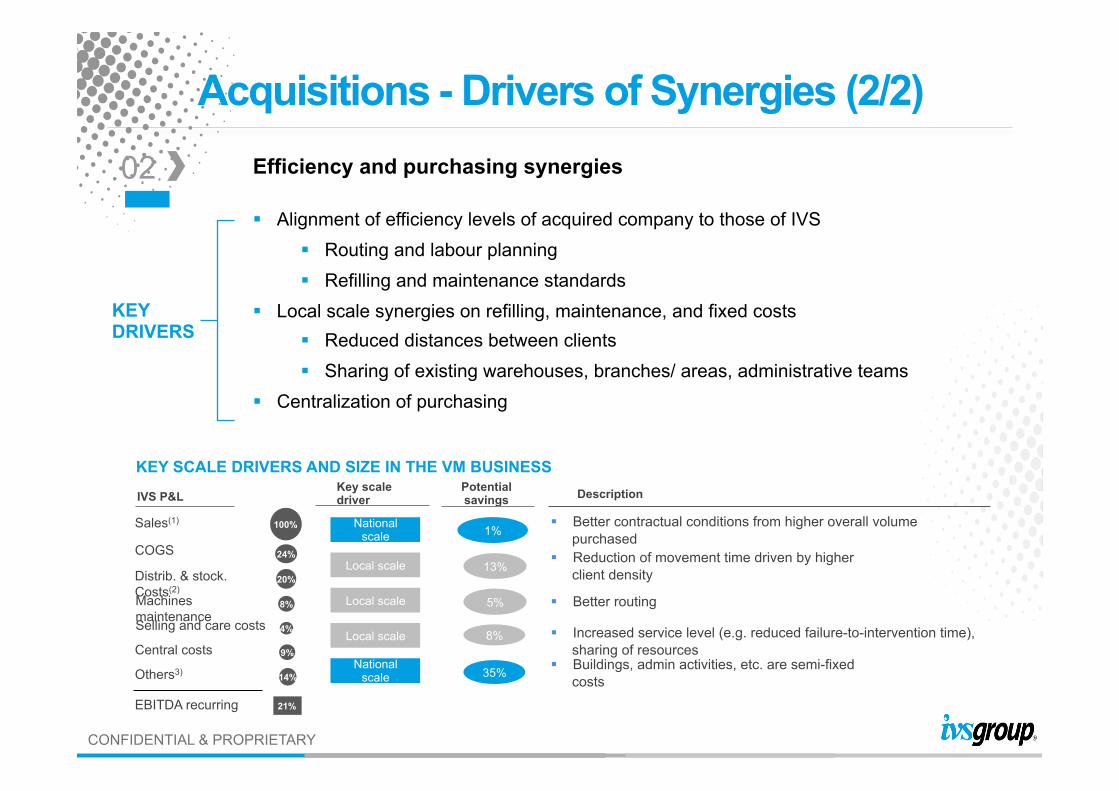
Acquisitions - Drivers of Synergies (2/2) Efficiency and purchasing synergies
§ Alignment of efficiency levels of acquired company to those of IVS § Routing and labour planning § Refilling and maintenance standards
§ Local scale synergies on refilling, maintenance, and fixed costs § Reduced distances between clients § Sharing of existing warehouses, branches/ areas, administrative teams
§ Centralization of purchasing
KEY DRIVERS
KEY SCALE DRIVERS AND SIZE IN THE VM BUSINESS Description
02
Sales(1)
COGS
Distrib. & stock. Costs(2) Machines maintenance Selling and care costs
Central costs
Others3)
EBITDA recurring
100%
24%
20%
8%
4%
9%
14%
21%
National scale
Local scale
Local scale
Local scale
National scale
1%
13%
5%
8%
35%
§ Better contractual conditions from higher overall volume purchased
§ Reduction of movement time driven by higher client density
§ Better routing
§ Increased service level (e.g. reduced failure-to-intervention time), sharing of resources
§ Buildings, admin activities, etc. are semi-fixed costs
IVS P&L Key scale driver
Potential savings

10 Strictly private and confidential
Acquisitions - Case Study in 2013 Mr. VENDING CASE STUDY § Mr. Vending was acquired in December 2012 by the IVS Group § Its main asset is represented by the concession with the Milan
underground, which IVS’s analysis considered not optimised § Given the experience of IVS with contracts in other
undergrounds (for instance Rome), IVS realised that the offer of Hot drinks in the Milan underground was not in line with other examples, potentially given the poor perceived quality
§ In June 2013, IVS decided to fully rebrand and modify the product offering related to hot beverages. This resulted in an increase of 2.5x in the sale and profitability of the installed machines
MR. VENDING – BEFORE AND AFTER IVS
Mr. Vending – Analysis on Hot Beverages
11 Strictly private and confidential
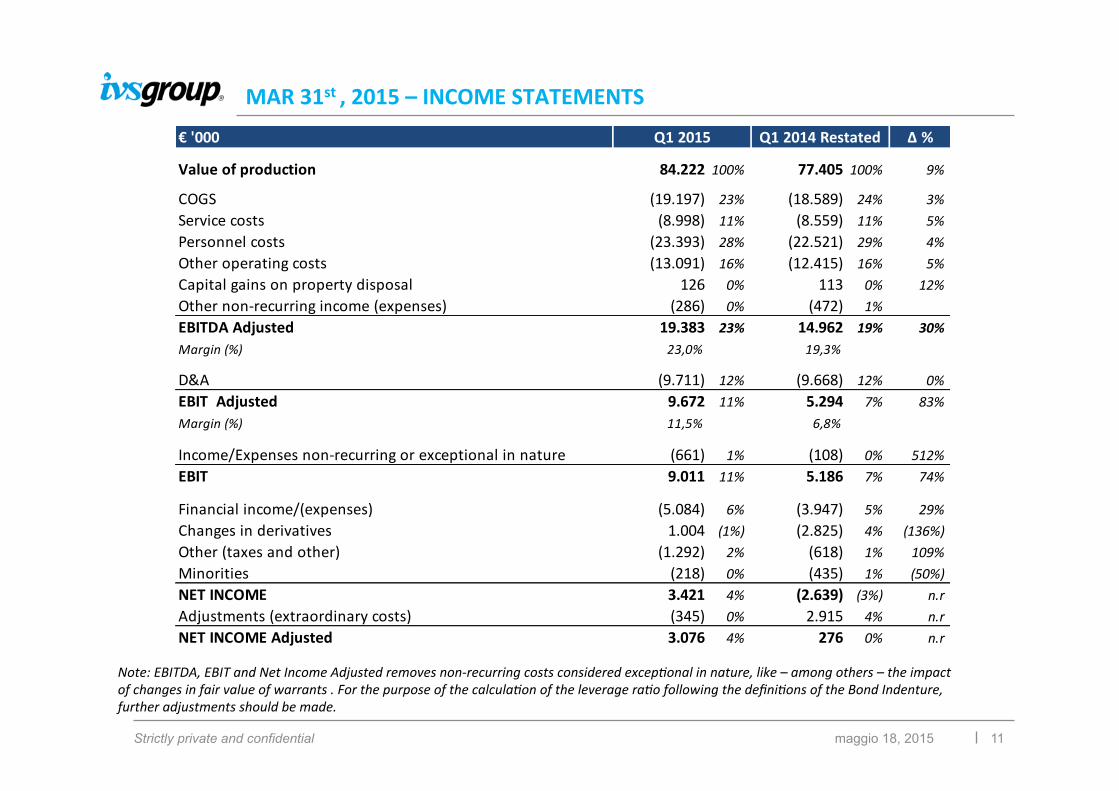
MAR 31st , 2015 – INCOME STATEMENTS
maggio 18, 2015
Note: EBITDA, EBIT and Net Income Adjusted removes non-‐recurring costs considered excep=onal in nature, like – among others – the impact of changes in fair value of warrants . For the purpose of the calcula=on of the leverage ra=o following the defini=ons of the Bond Indenture, further adjustments should be made.
€ '000 Δ %
Value of production 84.222 100% 77.405 100% 9%
COGS (19.197) 23% (18.589) 24% 3%Service costs (8.998) 11% (8.559) 11% 5%Personnel costs (23.393) 28% (22.521) 29% 4%Other operating costs (13.091) 16% (12.415) 16% 5%Capital gains on property disposal 126 0% 113 0% 12%Other non-‐recurring income (expenses) (286) 0% (472) 1%EBITDA Adjusted 19.383 23% 14.962 19% 30%Margin (%) 23,0% 19,3%
D&A (9.711) 12% (9.668) 12% 0%EBIT Adjusted 9.672 11% 5.294 7% 83%Margin (%) 11,5% 6,8%
Income/Expenses non-‐recurring or exceptional in nature (661) 1% (108) 0% 512%EBIT 9.011 11% 5.186 7% 74%
Financial income/(expenses) (5.084) 6% (3.947) 5% 29%Changes in derivatives 1.004 (1%) (2.825) 4% (136%)Other (taxes and other) (1.292) 2% (618) 1% 109%Minorities (218) 0% (435) 1% (50%)NET INCOME 3.421 4% (2.639) (3%) n.rAdjustments (extraordinary costs) (345) 0% 2.915 4% n.rNET INCOME Adjusted 3.076 4% 276 0% n.r
Q1 2015 Q1 2014 Restated

12 Strictly private and confidential
Mar 31st , 2015 – PRICE / VOLUME TRANDE
maggio 18, 2015
Note: Acquisi=ons of corporates or going-‐concerns excluded.
§ EBITDA Adj increased of EUR 4,421 (+30%). § sales increased from vending by 9.9% (decreased by 1.6%
excluding acquisiZons and disposals), increased the number of
vends by 8.8% (decreased by 2.8% excluding the last twelve
months acquisiZons and disposal effects, 2.5% for the only
Italian CGU) and increased the ASP by 0.45 EUR/cent
(corresponding to 1.0%) in comparison with the same period
last year.
§ Churn Rate is affected by the loss of client Emt, in Spain,
which registered about 0.5M of sales in 2014 and Ospedale di
Caserta, in Italy, which registered about 0.3M of sales in 2014.
Note that during the 2Q2015 two relevant clients have been
acquired (Ospedale S. Raffaele and Università di Salerno)
4Q 2012
1Q 2013
2Q 2013
3Q 2013
4Q 2013
1Q 2014
2Q 2014
3Q 2014
4Q 2014
1Q 2015
Churn Rate 1,28% 2,00% 2,07% 1,42% 1,55% 1,90% 1,53% 1,42% 1,23% 1,94%
AcquisiZon Rate 2,65% 2,53% 2,61% 1,72% 1,63% 2,13% 1,58% 1,33% 1,39% 1,59%
0,00%
0,50%
1,00%
1,50%
2,00%
2,50%
3,00%
71.0 0.9 -‐2.8 8.9
-‐0.8 78.0 € millions
13 Strictly private and confidential
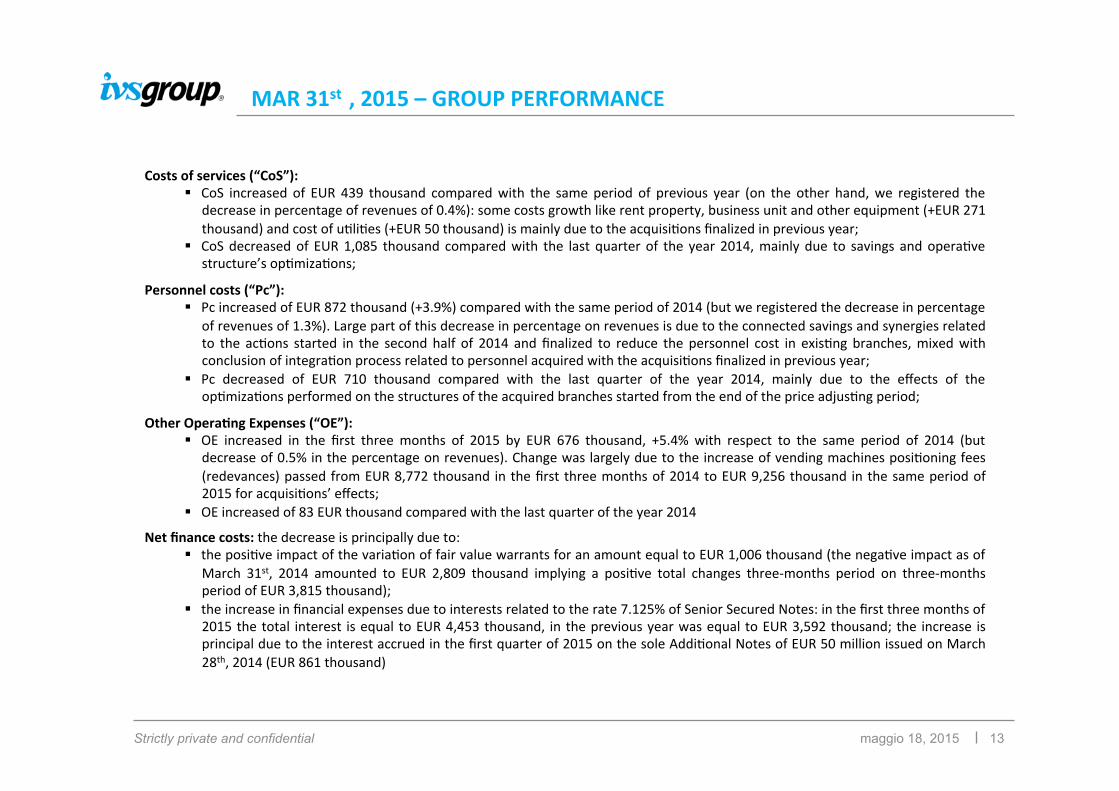
MAR 31st , 2015 – GROUP PERFORMANCE
maggio 18, 2015
Costs of services (“CoS”): § CoS increased of EUR 439 thousand compared with the same period of previous year (on the other hand, we registered the
decrease in percentage of revenues of 0.4%): some costs growth like rent property, business unit and other equipment (+EUR 271 thousand) and cost of uZliZes (+EUR 50 thousand) is mainly due to the acquisiZons finalized in previous year;
§ CoS decreased of EUR 1,085 thousand compared with the last quarter of the year 2014, mainly due to savings and operaZve structure’s opZmizaZons;
Personnel costs (“Pc”): § Pc increased of EUR 872 thousand (+3.9%) compared with the same period of 2014 (but we registered the decrease in percentage
of revenues of 1.3%). Large part of this decrease in percentage on revenues is due to the connected savings and synergies related to the acZons started in the second half of 2014 and finalized to reduce the personnel cost in exisZng branches, mixed with conclusion of integraZon process related to personnel acquired with the acquisiZons finalized in previous year;
§ Pc decreased of EUR 710 thousand compared with the last quarter of the year 2014, mainly due to the effects of the opZmizaZons performed on the structures of the acquired branches started from the end of the price adjusZng period;
Other OperaSng Expenses (“OE”): § OE increased in the first three months of 2015 by EUR 676 thousand, +5.4% with respect to the same period of 2014 (but
decrease of 0.5% in the percentage on revenues). Change was largely due to the increase of vending machines posiZoning fees (redevances) passed from EUR 8,772 thousand in the first three months of 2014 to EUR 9,256 thousand in the same period of 2015 for acquisiZons’ effects;
§ OE increased of 83 EUR thousand compared with the last quarter of the year 2014
Net finance costs: the decrease is principally due to: § the posiZve impact of the variaZon of fair value warrants for an amount equal to EUR 1,006 thousand (the negaZve impact as of
March 31st, 2014 amounted to EUR 2,809 thousand implying a posiZve total changes three-‐months period on three-‐months period of EUR 3,815 thousand);
§ the increase in financial expenses due to interests related to the rate 7.125% of Senior Secured Notes: in the first three months of 2015 the total interest is equal to EUR 4,453 thousand, in the previous year was equal to EUR 3,592 thousand; the increase is principal due to the interest accrued in the first quarter of 2015 on the sole AddiZonal Notes of EUR 50 million issued on March 28th, 2014 (EUR 861 thousand)
14 Strictly private and confidential
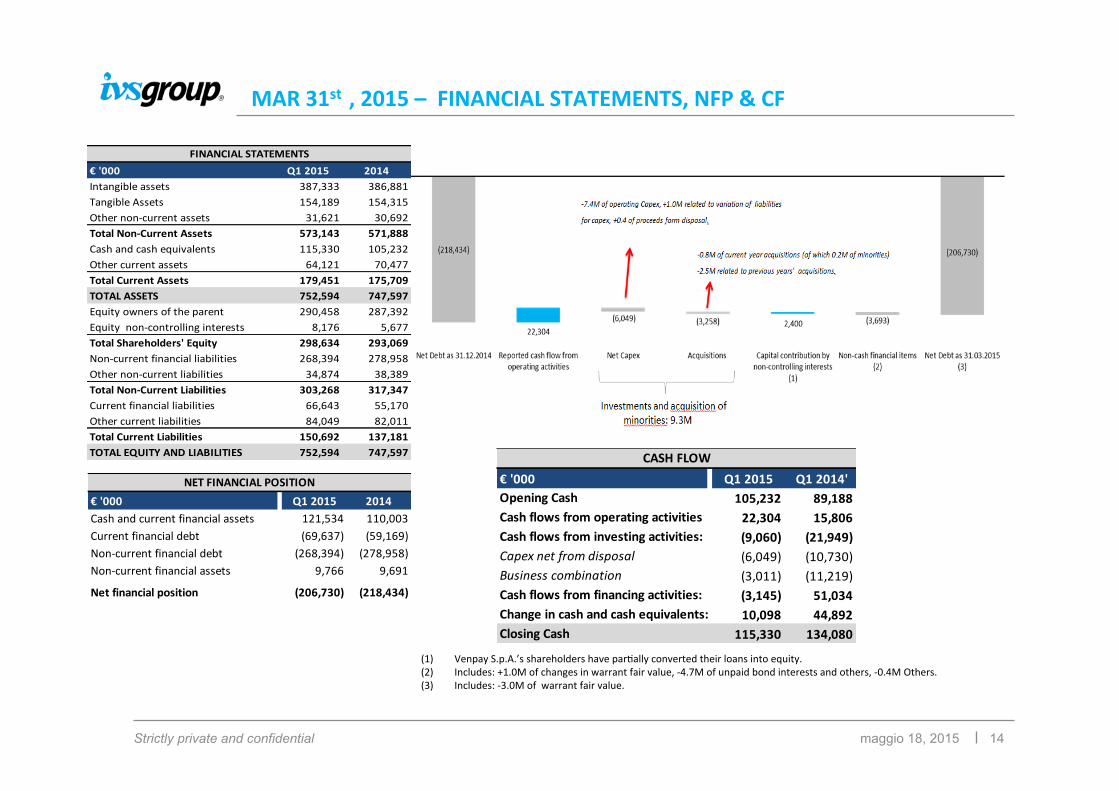
MAR 31st , 2015 – FINANCIAL STATEMENTS, NFP & CF
maggio 18, 2015
(1) Venpay S.p.A.’s shareholders have parZally converted their loans into equity. (2) Includes: +1.0M of changes in warrant fair value, -‐4.7M of unpaid bond interests and others, -‐0.4M Others. (3) Includes: -‐3.0M of warrant fair value.
€ '000 Q1 2015 Q1 2014'Opening Cash 105,232 89,188Cash flows from operating activities 22,304 15,806Cash flows from investing activities: (9,060) (21,949)Capex net from disposal (6,049) (10,730)Business combination (3,011) (11,219)Cash flows from financing activities: (3,145) 51,034Change in cash and cash equivalents: 10,098 44,892Closing Cash 115,330 134,080
CASH FLOW
€ '000 Q1 2015 2014Cash and current financial assets 121,534 110,003Current financial debt (69,637) (59,169)Non-‐current financial debt (268,394) (278,958)Non-‐current financial assets 9,766 9,691
Net financial position (206,730) (218,434)
NET FINANCIAL POSITION
€ '000 Q1 2015 2014Intangible assets 387,333 386,881Tangible Assets 154,189 154,315Other non-‐current assets 31,621 30,692Total Non-‐Current Assets 573,143 571,888Cash and cash equivalents 115,330 105,232Other current assets 64,121 70,477Total Current Assets 179,451 175,709TOTAL ASSETS 752,594 747,597Equity owners of the parent 290,458 287,392Equity non-‐controlling interests 8,176 5,677Total Shareholders' Equity 298,634 293,069Non-‐current financial liabilities 268,394 278,958Other non-‐current liabilities 34,874 38,389Total Non-‐Current Liabilities 303,268 317,347Current financial liabilities 66,643 55,170Other current liabilities 84,049 82,011Total Current Liabilities 150,692 137,181TOTAL EQUITY AND LIABILITIES 752,594 747,597
FINANCIAL STATEMENTS

15 Strictly private and confidential
MAR 31st , 2015 – MACROECONOMIC VIEW
maggio 18, 2015
Data Update as IVS view Comment Source
Hours worked 4Q 2014The number of hours worked in Italy during the 4th quarter of 2014 increased by 0.24%, if compared to the third quarter of 2014, and increased by 0.59%, if compared to the fourth quarter of 2013
ISTAT
People employed 1Q 2015The number of people employed in Italy in 1st quarter 2015 increased by 0,22% in comparison with 1st quarter 2014 and decreased about 0,22% on the previous quarter.
ISTAT
Employment rate 1Q 2015The average employment rate in 1st quarter 2015 in Italy was 55.66%, a value which is higher than 1st quarter 2015 (55.52%). It seems continued a slight upturn
ISTAT
Confidence index on firms 1Q 2015The value of the index in Mar. 2015 is higer than in Mar. 2014 (103.7 vs 101.2) and the trend in the quarter is growing
ISTAT
Prices 1Q 2015General prices trend is close to 0% (+0.1% from Mar. 2015 to Feb. 2015 and -‐0.1% since Mar. 2014). Prices of food didn't change (-‐0.1%) in the same yearly period as well as the prices of transport (-‐0.2%)
ISTAT
Climate 1Q 2015Avarage daily temperature in Q1 2015 were lower than in Q1 2014, while the precipitation trend shows a similarity to Q1 2014.
www.wunderground.com

16 Strictly private and confidential
MAR 31st, 2015 – VALUE OF PRODUCTION
maggio 18, 2015
New Contracts in 1Q 2015

17 Strictly private and confidential
KPIs
maggio 18, 2015
KPI 2012 2013 2014 Q1 2014 Q1 2015
Business days 238 238 238 61 61
Units sold (millions) 634 645 656 160 174
Sales per business day (€ thousands) 1,156 1,199 1,247 1,163 1,280
Average price (€ cents) 43.29 44.27 45.2 44.31 44.76
Cost of sales per unit sold (€ cents) (11.25) (11.28) (11.15) (11.09) (10.76)
Redevances per unit sold (€ cents) (4.38) (5.01) (5.43) (5.48) (5.32)
Gross profit per unit sold (€ cents) 32.04 32.99 34.05 33.22 34.00
% of Technical calls resolved within 8 hours 88% 90% 91% 91% 93%
N° Vending Machines (thousands) 144 148 153 149 152
of which OCS segment 43 50 49 52 47
EBITDA Adjusted (€000) 60,750 63,737 64,165 14,962 19,383
EBITDA Adjusted per business day (€000) 256 268 270 245 318

18 Strictly private and confidential
MAR 31st , 2015 – VENDING SECTOR
maggio 18, 2015
IT FR SP SW TOT IT FR SP SW TOT
Business days 61.0 61.8 59.0 61.0 60.9 61.0 62.0 59.0 61.0 61.0
Units sold (thousands) 146,916 13,460 13,619 175 174,170 136,245 14,181 9,562 161 160,149
Units sold per business day (thousands) 2,408 218 231 3 2,859 2,234 229 162 3 2,626
Sales (€ thousand) 65,992 6,260 5,591 114 77,958 60,614 6,543 3,711 98 70,966
Sales per business day (€ thousand) 1,082 101 95 2 1,280 994 106 63 2 1,163
Average price (€ cents) 44.92 46.51 41.05 65.10 44.76 44.49 46.14 38.80 60.85 44.31
Cost of sales per unit sold (€ cents) (10.22) (13.72) (13.66) (16.05) (10.76) (10.83) (12.96) (11.96) (18.23) (11.09)
Gross profit per unit sold (€ cents) 34.70 32.79 27.40 49.05 34.00 33.66 33.19 26.84 42.62 33.22Operating profit from continuing operations per unit sold (€ cents) 11.22 9.49 8.62 (0.05) 10.87 9.06 9.61 8.46 (24.66) 9.04
Δ% Business days -‐ (0.4%) -‐ -‐ (0.1%)
Δ% Units sold 7.8% (5.1%) 42.4% 9.0% 8.8%
Δ% Units sold per business day 7.8% (4.7%) 42.4% 9.0% 8.9%
Δ% Sales 8.9% (4.3%) 50.7% 16.6% 9.9%
Δ% Sales per business day 8.9% (3.9%) 50.7% 16.6% 10.0%
Δ% Average price 1.0% 0.8% 5.8% 7.0% 1.0%
Δ% Cost of sales per unit sold (5.7%) 5.9% 14.2% (11.9%) (3.0%)
Δ% Gross profit per unit sold 3.1% (1.2%) 2.1% 15.1% 2.3%
23.9% (1.3%) 1.9% (99.8%) 20.3%
Q1 2015 Q1 2014
Δ% Operating profit from continuing operations per unit sold
19 Strictly private and confidential
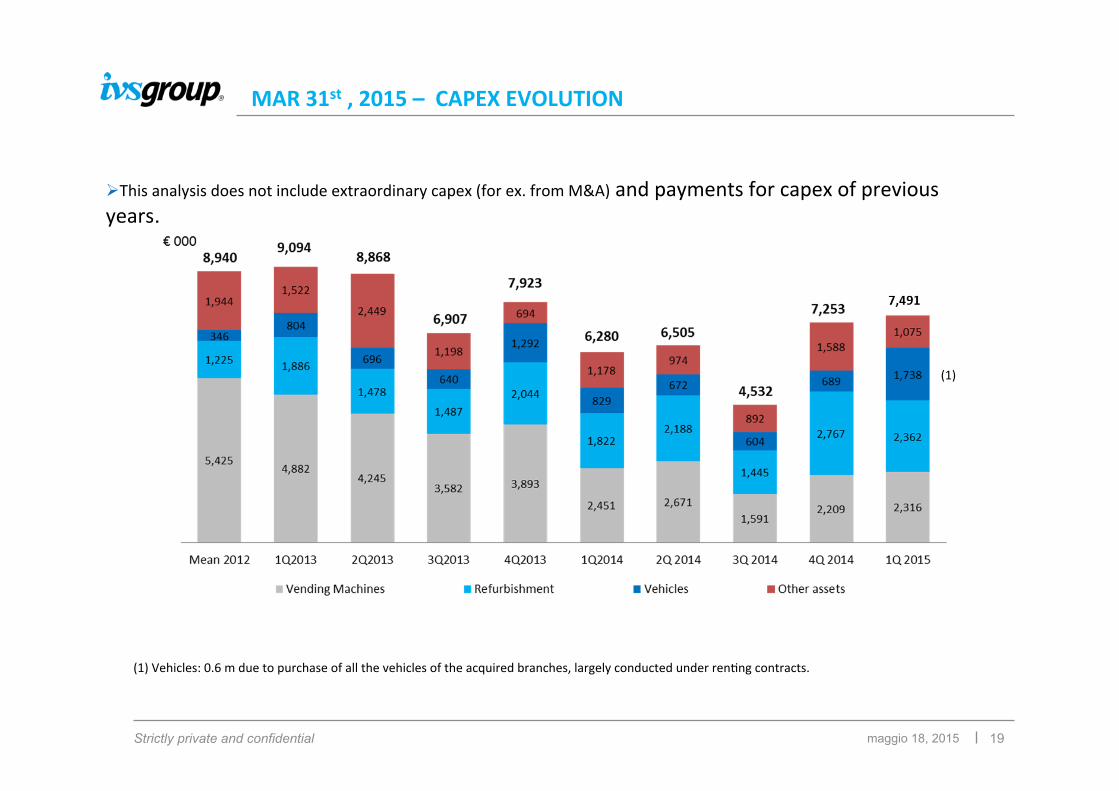
MAR 31st , 2015 – CAPEX EVOLUTION
maggio 18, 2015
Ø This analysis does not include extraordinary capex (for ex. from M&A) and payments for capex of previous years.
(1) Vehicles: 0.6 m due to purchase of all the vehicles of the acquired branches, largely conducted under renZng contracts.
(1)

20 Strictly private and confidential
MAR 31st , 2015 -‐ CLIMATE IMPACT
maggio 18, 2015
1 QUARTER-‐ Celsius degrees Milano Roma Bari1Q 2014 1Q 2015 Confronto 1Q 2014 1Q 2015 Confronto 1Q 2014 1Q 2015 Confronto
Highest daily temp.in the quarter 26 23 22 23 23 23
Average among highest daily temp. 11 11 16 13 16 13
Average among lowest daily temp. 1 -‐2 6 6 8 5
Number of days with av. temp. > 10 °C 11 5 49 36 71 22
Number of days with rainfalls 41 25 35 31 34 36
1 QUARTER-‐ Celsius degrees Paris Nice
1Q 2014 1Q 2015 Confronto 1Q 2014 1Q 2015 ConfrontoHighest daily temp.in the quarter 21 19 19 23
Average among highest daily temp. 12 9 14 14
Average among lowest daily temp. 4 2 8 7
1 QUARTER-‐ Celsius degrees Barcelona Madrid
1Q 2014 1Q 2015 Confronto 0 1Q 2014 1Q 2015 ConfrontoHighest daily temp.in the quarter 23 23 24 27
Average among highest daily temp. 16 15 14 14
Average among lowest daily temp. 8 6 4 1