Embed Size (px)
Citation preview

This PDF is a selection from an out-of-print volume from the National Bureauof Economic Research
Volume Title: Trade and Structural Change in Pacific Asia
Volume Author/Editor: Colin I. Bradford, Jr. and William H. Branson, editors
Volume Publisher: University of Chicago Press
Volume ISBN: 0-226-07025-5
Volume URL: http://www.nber.org/books/brad87-1
Publication Date: 1987
Chapter Title: Manufactured Exports and Industrialization: Trade Patternsand Trends of the Philippines
Chapter Author: Florian Alburo
Chapter URL: http://www.nber.org/chapters/c6933
Chapter pages in book: (p. 485 - 514)
16 Manufactured Exports and Industrialization: Trade Patterns and Trends of the Philippines Florian A. Alburo
16.1 Introduction
This paper examines (1) the recent Philippine experience in trade and industrial development, including changes and adjustments arising from economic disturbances, and (2) the prospects for future economic growth in terms of present discernible trends. First, I present contextual scenarios through which industrial development may be interpreted. The second section reviews the historical background of trade and industrialization. In the third section, industrial growth in the seventies will be further expounded upon, especially the role of manufactured exports in the process. A fourth section develops the notion of struc- tural change and its evidence. The prospects of the changes in the pattern of trade and industrialization, especially in terms of long-term sustainability, are considered in the fifth section.
Industrial growth may be stimulated in large part by the vigor of the internal markets, whose buoyancy in turn springs from productivity increases. Excess labor from agriculture, foreign exchange earnings from traditional export markets, and relatively low internal terms of trade allow the industrial sector to proceed unhampered in its devel- opment, acquiring economies and efficiencies in response to eventual international competition. Trade in this picture takes on a more passive
Florian A. Alburo is associate professor of economics, University of the Philippines, Diliman, Quezon City, Philippines.
This paper was written while visiting with the Overseas Development Council, Wash- ington, D.C., in 1982-83 as an Asian Visiting Scholar under a Henry A. Luce Foundation Fellowship. Revisions were made at the Institute of Southeast Asian Studies, Singapore, while on a research fellowship. Thanks are due to these institutions for support in the preparation and revision of this paper as well as to Professor Romeo M. Bautista for comments on an earlier draft.
485

486 Florian A. Alburo
role, feeding the industrial process, which in turn is determined by industry-agriculture interactions. During the early stages of this de- velopment scenario one outcome is the emergence of a system pro- tecting industrial formation. Later, sUacient markets must evolve within the economy to prop up industries and propel them toward greater economies.
In this context, trade is essentially supportive of the industrialization process and not adirect stimulant of it. Via productivity improvements in agriculture and export products (in part from technological breakthroughs) trade provides the exchange resources for pursuing industrial growth.
This scenario, crudely summarized here, is not of course unfamiliar to students of development. It is often associated with the doctrines espoused by Prebisch (1959) and Nurkse (1953).’
In contrast to this scenario is an industrial growth that is “outward- looking” or “export-led,” and is exemplified by experiences in a num- ber of developing countries but most prominently in East Asian coun- tries. In this context, trade is a determinant of the industrialization pro- cess. The growth and strength of industry are paced by the degree to which international trading of industrial products takes place in open systems. The country’s resource endowments dictate the directions of comparative advantage and thus industrial change itself. Resource al- location in industry and associated factor rewards respond to (in a small- country assumption) trade signals. Indeed, trade takes an active role.
Within the tradition of international trade theory, this scenario does not necessarily imply the delegation of developing countries to the status of primary producers and exporters. Dynamic comparative ad- vantages, the mobility of resources, and improvements in technology contribute to the development of an industrial base.
The extent to which developing countries take either route in their development processes is perhaps constrained by their initial resource endowments. Quite naturally small city-states are quicker to look to- ward external trade to fuel growth than large economies which have a bigger domestic base to exhaust.
There is no direct evidence that these scenarios are completely ad- equate for describing the basis for industrialization. Most of the as- sertions are in fact ad hoc rationalizations for a variety of policy ini- tiatives rather than descriptions arising out of a systematic, neat schema for industrial drive. Baldwin (1975, 67) indirectly alludes to how the “inward-looking” path influences policy in the Philippines.
16.2 Philippine Industrialization: A Historical Review
There is an array of studies on Philippine industrial development, most treating the subject with sufficient depth and rigor. A postwar

487 Trade Patterns and Trends of the Philippines
analysis of trade and industry was undertaken by Power and Sicat (1971). Industry analyses were performed by Sicat (1968) and William- son and Sicat (1968) that were mainly concerned with tracing sources of growth. Baldwin (1975) investigated industrial development within a framework of trade regimes characterized by control and liberali- zation of international transactions. The World Bank (1976, 1980) and the International Labor Office (1974) have addressed industrial per- spectives in a policy context. Bautista et al. (1979) have documented the process of industrial promotion policies in the Philippines.
All these studies contain data and analytical tracks that are exhaus- tive and sufficiently disaggregated to allow specific explanations of industrial growth and specific descriptions of policy implications. Al- though the studies are somewhat dated in the sense of the period cov- ered, it is noteworthy that an analytical series can be constructed with respect to industrialization in the postwar era. For example, the Power and Sicat volume explores the process during the sixties. Baldwin discusses the period up to 1971. Bautista et al. document the experi- ences of the midseventies.
16.2.1 Postwar Protection and Development
Philippine industrialization is usually described as a cumulative rec- ord of controls, protection, exchange overvaluation, and distorted do- mestic policies. In the immediate postwar period a combination of an early boom, institutional constraints, subsequent trade deficits, trade controls, and biased monetary and fiscal policies created the setting for a protective system conducive to consumer goods industries and finishing stages of production and biased against export industries. One outcome was a continuing drain on exchange resources and reserves and a penalty on export development.
Because of a limited domestic market, the need to arrive at more realistic exchange regimes, and the desire for correcting export biases, the country began to plan a gradual process of decontrol in the late fifties and implemented a four-phase program in April 1960. The fea- tures included (a) an increasing proportion of exports to be exchanged at market rates (beginning with one-quarter of export earnings of tra- ditional exports and ending with 100% in 1962), (b) free mobility of capital, and (c) a “free market” determination of exchange rates.
The gradual dismantling of controls such as import licenses, deposit margins, and import bans did not happen without tradeoff. With an industrial base fashioned by the trade protection of the fifties, it was expected that industries would demand support to continue their growth. Thus while decontrol was taking place and exchange rates approaching market signals (and thus benefiting exporters), the country’s tariff struc- ture retained the essential pattern of protection encouraged in the im-

488 Florian A. Alburo
mediate postwar era.2 Monetary policies were likewise geared to the promotion of new and necessary industries and did not differ signifi- cantly from those used during the control p e r i ~ d . ~ Despite the ap- pearance of removing exchange and physical controls to trade, decon- trol was thus more nominal than real. The protective structure remained the same even after complete decontrol in 1965.
The seventies is thought to be the time when a drift, if not a real shift, is visible in the industrial path of the phi lip pine^.^ Indeed, the hypothesis is advanced that during this period the country took its first steps away from an inward-looking drive to an outward-looking drive in terms of (a) the absolute values and shares of manufactured exports in aggregate trade, (b) the expansion of industries more consistent with the country’s resource endowments, (c) the absorption of more em- ployment in industry than ever before, and (6) the broad incidence of benefits through factors shares.
16.2.2 Some Causes and Consequences
Table 16.1 shows the average yearly growth rates of the Philippine GNP and selected sectors from 1946 to 1980, divided into quinquen- niums (except the first period), and from 1980 to 1982, on a more preliminary basis. By most accounts, the performance of the economy during the immediate postwar reconstruction was an aberration, a “catching up” of lost prewar capacity. What would be more useful to look at is the three-decade period 1950-80. While it is interesting to include consideration of the more recent years, it would seem that the prolonged recession in the West probably had its full effect after 1980 and would tend to distort the picture. Where data for 1981 and 1982 are available, they are included in the appropriate tables.
The controls of the fifties created an economic environment favorable to full-scale import substitution as consumer industries profited from liberal inflows of capital goods imports and the high domestic price of finished products engendered by the system. Thus the types of man- ufacturing industries began to proliferate in the fifties, from a concen- tration on food, beverages, and tobacco in 1948 to such industries as textiles, paper and paper products, chemical and chemical products, nonmetallic mineral products, and machinery. (See table 16.2 for the distribution of value added in manufacturing.)
The balance-of-payments problems that plagued the country toward the end of the sixties necessitated another round of adjustment, cul- minating in the floating of the exchange rate and currency depreciation of nearly 50% in 1970. Bautista (1980) has adequately analyzed the consequences of the floating exchange rates in terms of balance of payments and its major components, domestic economic activities and trade flows and direction^.^

Table 16.1 Average Annual Growth Rates of GNP and Net Domestic Product of Selected Sectors (in percentages at constant 1972 prices)
1946-50a 1950-55 1955-50 1960-65 1965-70 1970-75 1975-80b 1980-82b
Agriculture 12.4 7.0 2.9 4.8 3.5 3.8 5.4 3.6 Manufacturing 50.5 12.1 7.7 4.5 6.1 6.0 7.0 2.9 Services 16.9 9.0 5.0 4.5 4.8 4.8 5.3 3.0 GNP 19.9 1.7 4.9 5.6 4.8 6.5 6.2 3.2
Sources: Baldwin 1975, 3, for 1946-50; National Economic and Development Authority, 1983 Philippine Statistical Yearbook. aRates at 1955 prices. bGross value added except GNP.

490 Florian A. Alburo
Table 16.2
Industry 1948 1956 1960 1965 1970 1975 1980 1982
Distribution of Value Added by Industry (percentages)
Food, Beverages, Tobacco
Textiles Footwear,
wearing apparel
Wood and cork products
Furniture and fixtures
Paper, paper products
Publishing, printing
Leather, leather products
Rubber products
Chemicals, chern. products
Nonmetallic mineral prod.
Basic metals, metal products
Machinery Transport
equip. Misc.
manufactures Total
60.6
2.6 6.6
9.7
1.8
0.0
3.7
0.0
0.6
2.9
2.1
1.9
0.5 1 .0
5.7
100
43.8
3.7 5.1
5.0
1.3
1.7
3.1
0.2
0.9
9.9
4.7
4.7
2.1 2.2
11.2
I00
41.2
4.6 3.0
4.0
0.9
2.3
3.2
0.3
3.2
10.0
3.7
8.0
4.2 2.2
8.2
100
40.1
4.7 7.0
4.6
1.4
2.1
4.1
0.3
2.9
9.1
4.4
8.5
4.8 2.8
5.2
100
41.8
5.9 3.8
4.2
0.7
2.9
2.2
0.2
1.4
7.9
4.2
7.4
4.5 4.2
8.7
100
40.0
5.6 3.6
2.8
0.4
2.9
2.7
0.2
1.6
13.1
3.6
6.0
3.8 5.1
8.7
100
43.9
4.5 4.4
2.9
0.6
0.8
1.4
0.3
1.3
16.1
2.5
8.2
8.1 3.8
1.1
100
44.6
4.3 5.0
2.9
0.6
0.7
1.5
0.3
1.3
14.4
2.3
8.0
9.2 3.6
1.3
100
Sourccss: Bautista et al. 1979 for 1948-65; National Economic Development Authority, 1983 Philippine Statistical Yearbook.
Overall, there seems to be a convincing argument that industriali- zation in the Philippines was fashioned in the fifties and sixties to be inward looking, an import substitution strategy. The system of protec- tion and tariff structure created the pattern of manufacturing industries. There is further evidence that even, in 1974, the structure had perhaps remained the same (Tan 1979).
What this means in terms of results is widely known and appreciated. Industries are invariably capital using and labor saving. Capital-labor ratio indices increased over 20% in the sixties. The share of labor in manufacturing to total employment increased by only 4.4% over much of the same period (with the share virtually remaining constant at 12%).
491 Trade Patterns and Trends of the Philippines
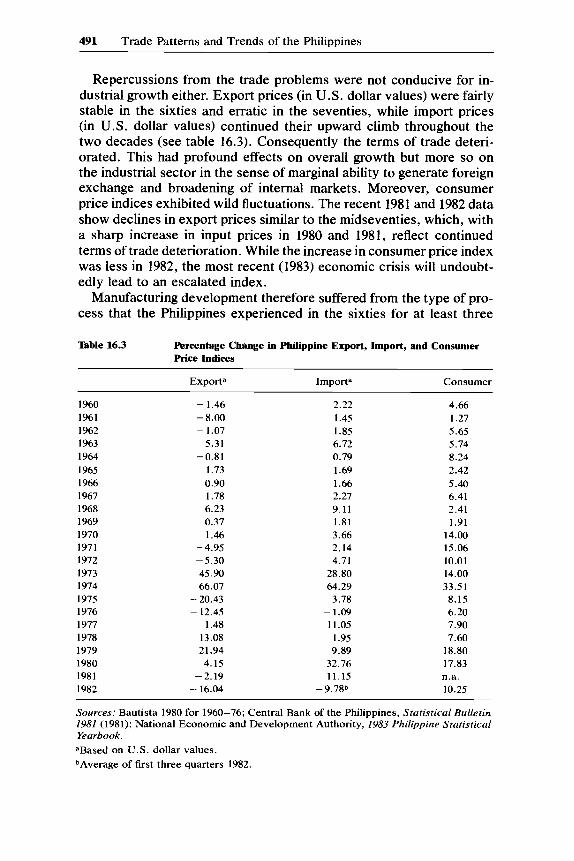
Repercussions from the trade problems were not conducive for in- dustrial growth either. Export prices (in U.S. dollar values) were fairly stable in the sixties and erratic in the seventies, while import prices (in U.S. dollar values) continued their upward climb throughout the two decades (see table 16.3). Consequently the terms of trade deteri- orated. This had profound effects on overall growth but more so on the industrial sector in the sense of marginal ability to generate foreign exchange and broadening of internal markets. Moreover, consumer price indices exhibited wild fluctuations. The recent 1981 and 1982 data show declines in export prices similar to the midseventies, which, with a sharp increase in input prices in 1980 and 1981, reflect continued terms of trade deterioration. While the increase in consumer price index was less in 1982, the most recent (1983) economic crisis will undoubt- edly lead to an escalated index.
Manufacturing development therefore suffered from the type of pro- cess that the Philippines experienced in the sixties for at least three
Table 16.3 Percentage Change in Philippine Export, Import, and Consumer Price Indices
Exporta Importa Consumer
1960 1961 1962 I963 1964 1965 1966 1967 1968 1969 1970 1971 1972 1973 1974 1975 1976 1977 1978 1979 1980 1981 1982
- 1.46 - 8.00 - 1.07
5.31 -0.81
1.73 0.90 1.78 6.23 0.37 1.46
- 4.95 -5.30 45.90 66.07
- 20.43 - 12.45
1.48 13.08 21.94 4.15
-2.19 - 16.04
2.22 1.45 1.85 6.72 0.79 1.69 1.66 2.27 9.11 1.81 3.66 2.14 4.71
28.80 64.29 3.78
- 1.09 11.05 1.95 9.89
32.76 11.15
- 9.78’
~
4.66 1.27 5.65 5.74 8.24 2.42 5.40 6.41 2.41 1.91
14.00 15.06 10.01 14.00 33.51 8.15 6.20 7.90 7.60
18.80 17.83 n.a. 10.25
Sources: Bautista 1980 for 1960-76; Central Bank of the Philippines, Statistical Bulletin 1981 (1981); National Economic and Development Authority, 1983 Philippine Statistical Yearbook. aBased on U.S. dollar values. bAverage of first three quarters 1982.

492 Florian A. Alburo
reasons. First, the manufacturing sector was insulated from interna- tional competitiveness by protection and could not profit from the exuberance of export prices on the one hand nor avoid the sting of rising import prices (which directly affected it via intensity of input use) on the other. Second, the transmission of import prices into the movements of the consumer prices meant real incomes were deterio- rating. In fact real wages of unskilled labor in industrial establishments in metropolitan Manila fell by 13.8% between 1959 and 1964 (though recovering by 13.2% between 1964 and 1970) and by 53.7% between 1970 and 1974. Finally, the broad-based potential of import substitution hinged on the spread of internal markets. On the basis of income dis- tribution, it appears that this potential was not realized in the sixties and early seventies.
16.2.3 From Inward- to Outward-Looking Industrialization
Table 16.4 presents the changing composition of Philippine exports in the two decades 1960-80. A striking change is noticeable between 1970 and 1980, when nontraditional manufactured exports increased in share from 8.3% to 36.4% of the total.6 The marked distributional change reflects a more outward-looking path of industrial development.
Even though traditional exports are still a dominant share, the fact that nontraditional manufactures imply processing would seem to augur well for industrial development. An examination of table 16.5, which breaks down nontraditional manufactured exports into specific com- modities, indicates that for many products the seventies (especially after 1975) was the time for breaking out into world markets. The trend remained strong in the face of serious disturbances occasioned by the oil shocks of 1973 and 1979, the recessions in the major trading partners, and the competition from other newly industrializing countries.
Whether or not the redirection is significant will in part be determined by the net effect of positive and negative influences. The former in- cludes active promotion policies that favor export growth, while the latter encompasses the constraints imposed by past developments.
Table 16.4 Philippine Exports (percentage share)
Sector 1960 1970 1980 ~~
Traditional primary 49.3 40.0 7.8 Traditional manufactured 48.4 49.8 47.2
Nontraditional manufactured 1.2 8.3 36.4 Reexports 1 . 1 0.8 0.6
Total 100.0 100.0 100.0
Source: National Census and Statistics Office, Foreign Trade Statistics, various years.
Nontraditional primary - 1 . 1 8.0

Table 16.5 Philippine Exports of Nontraditional Manufactures (in millions of U.S. dollars)
1970 1971 1972 1973 1974 1975 1976 1977 I978 1979 1980 1981 1982
Electrical & electronic
Garments Handicrafts Chemicals Food products & beverages Furniture & parts Footwear Machinery & trans. equip. Textile yarn, fabrics &
related prod. Builders’ woodwork &
other wood manuf. excl. plywood, veneer & lumber
manuf., particularly cement
Cordage, cable, ropes & twines
Other
Total exp. of nontrad.
equip. & components
Nonmetallic mineral
manuf.
Total exports
0.3
35.7 9.2 7.0 9.0 1.2 0.9 2.1 5.3
5.7
0.4
38.8 12.9 6.3
11.2 1.5 1.2 2.1 3.5
7.7
11.3
58.0 27.4 10.6 15.0 3.3 2.1 3.4
17.3
17.2
27.1
94.0 46.0 15.9 17.5 6.1 3.7 5.5 7.2
24.8
47.3
107.0 78.2 22.1 14.7 5.2 3.0 9.5 8.7
16.9
85.0
184.7 94.9 27.0 28.7 9.8 5.0
16.1 15.1
15.5
124.3
249.7 84.1 54.1 43.7 21.7 10.2 26.1 12.4
13.8
253.4
326.3 100.1 59.9 46.8 26.6 32.2 36.9 23.6
20.7
412.5
404.2 133.6 112.8 57.0 54.9 50.3 47.3 31.4
31.4
671.0
500.0 154.3 94.9
170.4 77.2 67.1 46.5 49.3
23.8
837.7
616.5 133.7 106.7 309.9 87.4 73.1 51.3 43.3
38.8
1,ooo.l
539.3 121.6 96.8
214.5 71.6 62.0 50.6 38.9
30.9
36.2 6.5 5.4 8.2 1.1 1.1 1.1 2.8
4.0
3.0 11.0 10.0 25.2 36.4 32.2 28.1 38.6 42.2 30.3 58.9 47.3 39.5
1.9 2.1
20.2
109.7
1,136
3.1 4.6
36.8
232.2 -
1,837 -
9.7
43.3
337.2 __
2,752 -
7.6
30.1
382.5 - 2,294 -
10.3
53.5
573.7 - 2,574 -
12.4
78.2
769.3 -
3,151 -
12.5 16.8 18.5 20.5 55.8
24.4
96.7 -
1,142 -
19.9
118.6 -
1,106 -
95.0
1,076.2
3,425
-
-
137.1
1,519.6 - 4,601
175.00
2,106.9
5,788
-
-
205.5
2,571.7
5,722
-
-
139.1
2,460.7
5,020
-
- Source: National Economic and Development Authority, 1983 Philippine Statistical Yearbook.

494 Florian A. Alburo
Some factors prevent a detailed technical assessment of the redirec- tion hypothesis. One is lack of recent transactions data for a compre- hensive input-output analysis. The 1974 input-output data would ob- viously be inadequate to capture any profound changes associated with structural adjustments after the 1974 oil crisis.’ Another is paucity of information on technical characteristics of firms in the manufactured exports industries. The classification of table 16.5 is fairly recent. Fi- nally, a number of policy changes (e.g., tariff reforms) reinforcing the outward-looking trend were implemented only recently. Nevertheless, the following sections attempt to pursue the argument.
16.3 Trade and Industrial Growth in the Seventies
Manufacturing increased its share of gross domestic product from 23.2% in 1970 to 25.3% in 1980. The increase in share of 2.1% is matched only by the 3.9% increase in the share of construction in GDP over the same period, whereas most of the other sectors show declining shares. But even more important was the increase in the share of manufactures in total exports between 1970 and 1980.
Manufacturing is often characterized as dualistic. Large factories- fairly productive, capital-intensive, and possessing up-to-date tech- nologies-coexist with small, household-type, unorganized production units. Each subsector provides critical components of the aggregate manufacturing picture. The World Bank (1980), for example, estimated that the small- and medium-sized firms employ almost 80% of labor but provide only 25% of value added. For a time, large-scale estab- lishments were relied upon to create additional output, and the unor- ganized sector was depended upon to absorb additional employment.
It seems, however, that a reverse pattern has emerged in the sev- enties. Large establishments (with more than twenty workers) em- ployed 24.5% of labor in manufacturing in 1971. The proportion in- creased to 32% in 1976, the latest year for which data are consistent. In terms of value added, the same group accounted for 94.5% in 1971 but only about 56% in 1976.
More interesting perhaps than these static figures are the rates of growth of employment and value added in the sector during the decade. They reveal changes that help explain the overall performance of man- ufacturing. Table 16.6 shows the rates of growth for both employment and value added for all of manufacturing, establishments with 20 or more workers, and those with less. The last has been calculated as a residual and must be viewed with the usual caution when dealing with indirect figures.
The annual average growth rate of manufacturing employment was 3.9% in 1968-76, falling to 3.1% during 1971-76 after peaking at 5.2%

495 Trade Patterns and Trends of the Philippines
Table 16.6 Manufacturing Value Added and Employment Annual Average Growth Rates (percentages)
Employment 1968-76 1968-71 1971-76
Total 3.9 5.2 3.1 Establishments with more than twenty workers 6.2 2.1 8.7 Establishments with less than twenty workers 3.0 6.3 1.0
Value added (current prices) Total n.a. n.a. 24.0
Establishments with less than twenty workers n.a. n.a. 17Sa Establishments with more than twenty workers n.a. n.a. 12.0
Sources: National Census and Statistics Office, Annual Survey of Establishments, various years; National Economic and Development Authority, 1983 Philippine Statistical Yearbook. Notes: Labor force data are based on October 1968, November 1971, and August 1976 surveys. n.a. = not available. a1971-74.
in 1968-71. When broken down into the two subsectors, it is clear that large establishments experienced a high employment growth rate com- pared with the unorganized sector (8.7% versus 1.0% in 1971-76). Because of the absolute weight of the latter sector, however, the average growth rate was in fact lower. In terms of value added, establishments with less than twenty workers had a slightly higher growth rate than large-scale firms.
Of course, these differences are not revealed when looking at the aggregate behavior of manufacturing in the seventies. The reduction in labor absorption between the late sixties and the middle seventies masks the vigor of employment growth among large establishments and the stagnation of the small firms.
This reversal in the pattern of employment and value added between the late sixties and the seventies implies a decline in labor productivity during the period at least for the organized factory level sector. The data come from surveys covering large establishments, i.e., employing twenty or more workers.
Between 1960 and 1970, value added per employee grew at an annual average rate of 3.4% in real terms.* From 1970 to 1976 the rate declined to 1.1% per year. There was a further decline by 1977 in absolute terms. One notes sharp declines especially in 1977 for all industries, but with particular severity in textiles, leather products, rubber, chemicals, non- metallic mineral manufacturers, basic metals, electrical machinery, and transport equipment.
Falling value added per worker is in part associated with a falling capital-worker ratio, and both may reflect a transitional change in tech- nology. The amount of new investment per worker fell between 1970

496 Florian A. Alburo
and 1977, mirroring the general reduction in capital in newly registered business organizations in 1970-80 and a sustained reduction in paid- in capital per organization-despite a threefold increase in the number of new organizations between the sixties (an increase of 4.6% per year) and the seventies (an increase of 14.1% per year).9 It is difficult to examine this more thoroughly because of data constraints.
Nevertheless, a number of factors suggest the fluid state of manu- facturing development in the seventies, a period of significant adjust- ments. First, the evidence seems to point to the growing importance of the formal sector in terms of employment generation and the growing importance (though less pronounced) of the informal, or household, sector in terms of value added. By all indications a diffusion process may have taken place toward medium-scale industries more consistent with relevant factor proportions. Second, the industrial structure has broadened, reflected in the changes in the distribution of value added during the decade. Indeed, combined with growth of the industries producing manufactured exports, industrial growth appears also to have deepened. Third, capital-labor ratios, both average and incremental, declined across the entire manufacturing sector. This is not surprising given the ability of the industrial structure to respond to differential factor pricing. What is worth noting is that during the decade, the floating of the peso, the flexible policies that did not liberally shelter industry, and the incentives promoting manufactured exports allowed a smoother industrial adjustment.
How much of the industrial growth and change in the seventies was triggered by manufactured exports or vice versa is hard to untangle. Where the growth of manufactured exports is exogenous, it obviously induced industrial responses that partly shaped the structure in the seventies. Where the macroeconomic and trade policies appropriately accommodated this growth they also partly shaped the structure. These policies, however, simply corrected the distortions of the earlier inward- looking decade. In short, trade has had a significant role in shaping the industrial patterns of the seventies.
16.4 Structural Change: Search for Evidence
A loose interpretation of structural change is followed here. More specifically, the notion is investigated in terms of output and input. On the output side, patterns of manufactured exports are analyzed relative to other sectors or to aggregate trade. On the input side, various tech- nical characteristics such as factor proportions, productivity, value added are considered as clues to understanding changes. Table 16.7 recasts table 16.5 in constant terms.1°
Although exports were beginning to pick up in the early seventies, it was not until after 1974 that more than one-half of the thirteen sectors

Table 16.7 Philippine Exports of Nontraditional Manufactures (in millions of U.S. dollars)
1970 1971 1972 1973 1974 1975 1976 1977 1978 1979 1980 1981 1982
Electrical & electronic
Garments Handicrafts Chemicals Food products & beverages Furniture & parts Footwear Machinery &trans. equip. Textile yam, fabrics &
related prod. Builders’ woodwork &
other wood manuf. excl. plywood, veneer & lumber
manuf., particularly cement
Cordage, cable, ropes & twines
Other
Total exp. of nontrad
equip. & components
Nonmetallic mineral
manuf.
Total exports
-
32.6 5.9 4.9 7.4 1.0 1.0 0.9 2.5
3.6
0.3
33.8 8.7 6.6 8.5 1.1 0.8 2.0 5.0
5.4
0.4
38.8 12.9 6.3
11.2 1.5 1.2 2.1 3.5
7.7
7.7
39.7 18.8 7.3
10.3 2.3 1.4 2.3
11.9
11.8
11.2
38.8 19.0 6.6 7.2 2.5 1.5 2.3 3.0
10.2
24.5
55.5 40.6 11.5 7.6 2.7 1.6 4.9 4.5
8.8
50.4
109.4 56.2 16.0 17.0 5.8 3.0 9.5 9.0
9.2
72.6
145.8 49.1 31.6 25.5 12.7 5.9
15.2 7.2
8.1
130.8
168.5 51.7 30.9 24.2 13.7 16.6 19.0 12.2
10.7
174.6 272.8
203.2 62.7 38.6 69.3 31.4 27.3 18.9 20.0
9.7
348.2
256.2 55.6 44.3
128.8 36.3 30.4 21.3 18.0
16.1
495.1
267.0 60.2 47.9
106.2 35.4 30.7 25.0 19.2
15.3
171.1 56.6 47.8 24.1 23.2 21.3 20.0 13.3
13.3
2.7 10.4 10.0 17.3 15.0 16.7 16.6 22.5 21.8 12.8 23.9 19.6 19.5
1.7
22.8
85.1
1,028.0 -
2.0
19.1
101.8 - 1,075.8 -
3.1
19.9
115.9
1,106.0
-
-
3.1
25.2
155.4 - 1,259.0 -
4.0
17.9
135.2 - 1,135.8 -
3.9
15.6
194.1
1,189.8
-
6.2
31.7
340.0 - 1,524.9 -
7.2
45.7
449.1 -
1,839.5 -
6.4
49.0
555.5
- 1,768.2
-
7.1
58.0
643.2 - 1,948.0 -
7.5
71.1
856.4
2,353.0
8.5
85.4
1,068.9
2,378.0
-
27.6
68.9
- 1,218.2
- 2,485.0
Source: National Economic and Development Authority, 1983 Philippine Statistical Yearbook.

498 Florian A. Alburo
covered in table 16.7 experienced peak growth rates. Moreover, fur- niture and footwear began to be exported at significantly greater rates. One can detect serious concentration on certain commodities from 1971 to 1980. In 1971 three product groups (garments, nonmetallic mineral manufactures, handicrafts) constituted half of the earnings, while in 1975 and 1980 half of export earnings were from only two groups (gar- ments and handicrafts in 1975 and electrical equipment and garments in 1980). Despite the strong emergence of electronic equipment exports in 1974 and 1975, it was in 1979 and 1980 that their dominance was felt. In 1980 electronic equipment and garments exports composed 20.2% of total exports.
The growing share of these exports in total trade in a sense relieves the burden placed on the country’s principal exports. Yet it can be seen that, even for the nontraditional manufactured exports, a similar excessive reliance is placed on only two or three commodity groups.
It has been estimated from the 1974 input-output tables that 14.2% of manufacturing output is exported, including traditional manufactures (World Bank 1980). Another way to measure the importance of man- ufactured exports is to examine the fraction of these exports to the total manufacturing value added and trace its pattern over time. The Central Bank of the Philippines regularly reports yearly exports of manufactured products classified chiefly by materials. By using this data source it is possible to trace manufactured exports over a longer time horizon than that in tables 16.5 and 16.7. In the aggregate these two sources are not directly comparable. In 1960 the proportion of these exports to the value added in the manufacturing sector of 1.5%, growing to 4.5% in 1965 and with a slight rise to 4.7% in 1970. By 1975 the proportion increased to 8.0% and by 1980 to about 13%. The cor- responding proportion of manufactures to total exports is 8.3% in 1970, 16.3% in 1975, and 36.4% in 1980 (49% in 1982). Thus the proportion of manufactures to total exports was growing faster than the proportion of manufacturing output being exported. These figures seem to suggest that changes in the structure of the manufacturing sector would be slower than changes in the structure of exports.
Table 16.8 illustrates the annual growth rates of exports for selected manufacturing sectors from 1960 to 1980. The annual growth rates are in general relatively high across most of these industries and over the twenty-year time period. This is not a surprising finding, however, given the fact that especially in the sixties manufactured exports were ab- solutely low. The low absolute base would therefore imply high growth rates. For example, in the early sixties footwear exports were less U.S. $100 thousand; exports of leather manufactures, paper and paper prod- ucts, and nonmetallic mineral manufactures were minimal. What is significant in the table is the growth rate for some of the industries

499 Trade Patterns and Trends of the Philippines
Table 16.8 Annual Growth Rates of Selected Manufactured Exports (percentagesp
Industry 1960-65 1965-70 1970-75 1975-80
Foodb 2.4 6.6 24.9 11.0 Textile yarn 7.6 2.3 32.3 27.7 Footwear 32.5 87.4 23.6 86.1 Clothing 58.9 - 9.8 236.8 53.3 Wood and cork 23.2 23.2 7.1 25.6 Furniture and fixtures 2.8 28.8 29.4 71.7 Paper and paper products 67.0c 90.9 16.4 - 1 . 1 Rubber products 53.9 19.2 33.3 -5.1 Chemicalsd - 0.4 21.6 32.3 80.7 Nonmetallic mineral manufactures 14.9e 89.6 57.6 12.2 Metal products 82.3' 41.3 26.9 40.9 Machinery, except electrical -2.7 88.2 30.5 38.2 Electrical machinery - 201 .5g 243.5 87.1 Transport equipment 74.1 30.7 86.3 68.7 Misc. manufactured goods Total manufactured articles 20.1 14.5 34.1 27.6
Source: Central Bank of the Philippines, Starisrical Bulletin (1978, 1980). aExport values in thousand U.S. dollars. bIncludes meat, dairy products, and food processing.
dIncludes crude chemicals, chemical products, and pharmaceuticals. e 1960 - 64. '1962-65. g 1967- 70.
196 1 -65.
producing nontraditional manufactured exports. Export growth accel- erated in the seventies for such products as furniture, chemicals, elec- trical machinery, and transport equipment.
Structural change may also be examined using an approach taken by Lary (1968). Here industrial exports are classified according to factor proportions content and then traced in terms of changes over time. Products have either high or low capital intensities and high or low skill intensities as measures of labor content."
Table 16.9 lists industries according to a four-way classification. This classification of the Philippine industrial exports is intuitively appeal- ing-garments, furniture, and footwear products, for example, require low capital and low labor skills, whereas the electronics industry, while of low capital intensity, needs highly skilled labor. Nonmetallic mineral products use high capital inputs but not highly skilled labor when com- pared with chemicals.1Z
The record of nontraditional manufactured exports for the seventies reveals that about 7 1% have been products requiring low capital and

500 Florian A. Alburo
Table 16.9 Classleation of Manufactured Exports by Factor Intensity
Low Skill Intensity High Skill Intensity
Low Capital Intensity
Garments Handicrafts Furniture Footwear Textile yam Builders’ woodwork Cordage
Electrical machinery and transport equipment
High Capital Intensity
Nonmetallic mineral manufactures Chemicals Food products
Source: Lary 1968.
Table 16.10 Value and Distribution of Nontraditional Manufactured Exports (in millions of 1972 U.S. dollars and percentages)
Factor Content 1971 1975 1980 1982
Low capital-low skill 56.8 117.6 361.8 455.4 (67.4) (74.3) (80.6) (78.1)
Low capital-high skill 2.0 4.9 18.9 25.0 (2.4) (3.1) (3.7) (4.3)
High capital-low skill 18.9 24.3 93.2 54.9 (22.4) (15.3) (18.2) (9.4)
High capital-high skill 6.6 11.5 38.6 47.9 (7.8) (7.3) (7.5) (8.2)
Source: Tables 16.7 and 16.9. Note: Figures do not include nontraditional manufactured exports classified under Other in previous tables.
low skill, 3% requiring low capital but high skill content, 18% requiring high capital and low skill, and the rest requiring high capital and high skill. Note, however, that exports of electrical products in the seventies are not necessarily comparable to similar exports in the sixties in terms of skill content. (The figures in table 16.10 exclude the value of exports of electrical equipment and electronic components .)
Changes in the factor intensity of exports occurred during the sev- enties (see table 16.10). At the start of the decade products with low capital and labor intensities composed more than two-thirds of new exports, with the other significant share composed of those with high capital but low skill intensities. During the decade the share of low- capital exports increased from 69.8% to 84.3% (dropping slight!y in

501 Trade Patterns and Trends of the Philippines
1982). The share of products requiring high capital content decreased at the end of the decade (with the high-capital, low-skill products sharply decreasing and about a constant share maintained by high-capital, high- skill products). The data suggest that there has been a trend toward exporting goods from less capital-intensive and more labor-intensive (both skilled and unskilled) industries. Low-capital- and high-skill- intensive exports had the highest growth rates (especially between 1971 and 1975).
In summary, a search for structural changes associated with the recent growth of manufactured exports leads to several specific con- clusions. First, data are available only for a relatively short period, and thus it is too early to determine whether the manufacturing sector has undergone a permanent adjustment (to new equilibria) in terms of out- put mix, factor proportions, productivity, and technology. The adjust- ments are too recent to allow a rigorous causal analysis of the surge of manufactured exports. On the other hand, the evidence explored here tends to suggest that the manufacturing sector experienced some structural change, though not highly visible, over the period of high growth of manufactured exports. It is perhaps necessary to measure the changes more precisely than has been done here.
Although the growth in the value of nontraditional manufactured exports during the decade is quite phenomenal, it is also true that is has been mostly concentrated among two or three product groups. Thus the influence on the manufacturing sector as a whole is probably shallow and not as widespread as it would be with a broader growth pattern.
Third, the movement of manufactured exports has been consistent with an outward-looking industrial path. For one, while the types of exports have a wide range of factor content, it is apparent that most are from industries with low capital intensities. For another, the growth rates of the various exports appear to indicate a trend toward less capital-intensive exports and more labor-intensive ones. And then, even in the manufacturing sector as a whole, this change is perceptible only beginning with the midseventies.
Finally, these are aspects of change emanating from the supply side. Demand factors, intraindustry and interindustry relations, and even institutional arrangements equally affect structure. Any assessment therefore of the prospects for sustained growth or continued structural change must take account of these larger perspectives.
16.5 Prospects
An appropriate assessment of prospects will have to consider such important factors as product diversification and market penetration,

502 Florian A. Alburo
competition from other developing countries, and trade barriers as well as the factors reviewed in the previous section (factor responsiveness, efficiency, and capacity).
The share of developing-country imports in the apparent consump- tion of manufactured goods in industrial countries was barely 1% at the end of the sixties. In 1980 the share was 3.4%. What is more, the growth rate of the shares was 7.2% per year, ranging from 1.4% going into Belgium to 11% into Australia. Even more interesting than this implied dynamism is the fact that the growth in the shares of imports from industrial countries was 3.6% per year (Hughes and Krueger 1982).
Hughes and Krueger (1982) have argued that despite increases in the protective measures employed by the industrialized countries during the seventies, the developing countries performed respectably. The fall in the penetration rate in the latter half of the seventies reflects the deepening recession more than the effect of protection. This penetra- tion success came about in part from product diversification and off- shore production, aided by the apparent ineffectiveness of growing protectionism.
What is relevant to Philippine prospects are (a) the volume of the industrialized countries’ imports in comparison with the degree of Phil- ippine trade intensity, (b) the direction of diversification, (c) the rela- tive experiences of other (especially the Association of South East Asian Nations [ASEAN]) developing-country manufactured exports, and (4 the scale of expected protection in these markets.
Traditional exports declined in importance between 1970 and 1980. In addition, trade with the United States and Japan (which imported 81.1% of Philippine exports) significantly declined (to 53.7%). Com- mensurately, trade with the European Community, Australia and New Zealand, and the rest of Asia accelerated, taking up most of the slack left by the United States and Japan. In sum, aside from the continued strength of trade with traditional sources, the Philippines gained firmer ground in those countries with high growth in the shares of manufac- tured imports from developing countries.
With the exception of basic metals, nonmetallic mineral products, and paper, the ASEAN group of countries had the highest growth rates of manufactured exports to industrial countries (see Table 16.11). One must, of course, single out Singapore as primarily the source of such rates, with some help from Malaysia in a number of industries. Yet the Philippines does fare equally well in a number of the high-import-growth industries, e.g., floor coverings, tapestries, footwear.
What does this mean in terms of the prospects for exports of non- traditional manufactures? Much depends on the strength of the eco- nomic recovery in the industrial countries and the degree of protec-
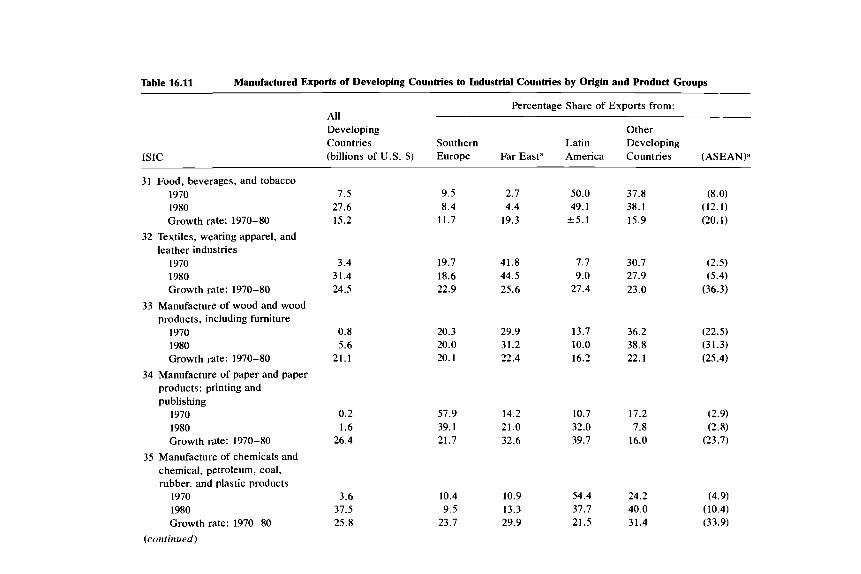
Table 16.11 Manufactured Exports of Developing Countries to Industrial Countries by Origin and Product Groups
ISIC
Percentage Share of Exports from: All Developing Other Countries Southern Latin Developing (billions of U.S. $) Europe Far East" America Countries (ASEANp
31 Food, beverages, and tobacco 1970 1980 Growth rate: 1970-80
32 Textiles, wearing apparel, and leather industries
1970 1980 Growth rate: 1970-80
33 Manufacture of wood and wood products, including furniture
1970 1980 Growth rate: 1970-80
34 Manufacture of paper and paper products: printing and publishing
1970 1980 Growth rdte: 1970-80
35 Manufacture of chemicals and chemical, petroleum, coal, rubber, and plastic products
1970 1980 Growth rate: 1970-80
(continued)
7.5 27.6 15.2
3.4 31.4 24.5
0.8 5.6
21.1
0.2 1.6
26.4
3.6 37.5 25.8
9.5 8.4
11.7
19.7 18.6 22.9
20.3 20.0 20.1
2.7 4.4
19.3
41.8 44.5 25.6
29.9 31.2 22.4
57.9 14.2 39.1 21.0 21.7 32.6
10.4 10.9 9.5 13.3
23.7 29.9
50.0 37.8 49.1 38.1
2 5 . 1 15.9
7.7 30.7 9.0 27.9
27.4 23.0
13.7 36.2 10.0 38.8 16.2 22.1
10.7 17.2 32.0 7.8 39.7 16.0
54.4 24.2 37.7 40.0 21.5 31.4
(8.0) (12.1) (20.1)
(2.5) (5.4)
(36.3)
(22.5) (31.3) (25.4)
(2.9) (2.8)
(23.7)
(4.9) (10.4) (33.9)

Table 16.11 (continued)
ISIC
Percentage Share of Exports from: All Developing Other Countries Southern Latin Developing (billions of U.S. $) Europe Far Easta America Countries (ASEAN)"
36 Manufacture of nonmetallic mineral products, except products of petroleum and coal
1970 1980 Growth rate: 1970-80
1970 1980 Growth rate: 1970-80
products, machinery, and equipment
1970 1980 Growth rate: 1970-80
39 Miscellaneous manufacturing
37 Basic metal industries
38 Manufacture of fabricated metal
industries 1970 1980 Growth rate: 1970-80
1970 1980 Growth rate: 1970-80
3 All manufactured products
0.1 1.4
27.9
4.0 15.1 14.7
I .6 28.5 32.8
0.5 3.1
22.8
21.7 151.9 21.8
50.2 39.4 23.8
7.3 16.2 22.7
25.8 22.9 28.9
4.5 4.7
21.6
13.1 15.2 22.1
17.0 36.4 40.2
0.7 8.2
41.5
35.5 43.7 34.6
85.2 79.7 22.1
1.5.5 25.7 27.9
27.5 5.3 13.5 10.6 20.2 48.0
30.9 61.1 32.9 42.7 15.4 10.7
16.5 22.2 14.9 18.5 31.0 37.2
3.3 6.9 4.5 11.1
25.2 28.5
35.3 36.1 27.1 32.0 18.9 20.5
(1 .O) (2.3)
(41.7)
(7.4)
(22.0) (13.2)
(4.1) (16.8) (48.5)
(8.1) (5.6)
(32.2)
(6.6) (11.7) (28.7)
~~~~~
Source: Hughes and Krueger 1982, 26. "The category Far East includes Korea, Taiwan, Hong Kong, and Singapore, and the category (ASEAN) includes Indonesia, Malaysia, Philippines, Thailand, and Singapore. Singapore is thus included in both groups. The other ASEAN countries are also included in Other Developing Countries. The ASEAN group is duplicative.

505 Trade Patterns and Trends of the Philippines
tionism imposed. It may be true that the protective measures undertaken so far have not had a perceptible effect on export performance. Yet the time of approaching limits on exports may not be far away, espe- cially with a drag in growth and reluctance to open up markets. On the other hand, there is a danger that simultaneous export expansion may drive penetration ratios to some limit prompting the erection of strong barriers (Cline 1982).
Also, while it may be expected that more restraints will be asked of countries for which penetration ratios are already high, it is likely that opportunities for increasing the shares of the Philippines will material- ize. Thus while the overall import limits are low, the distribution oc- casioned by selective protectionism will allow expansion of Philippine nontraditional exports. l3
In terms of the supply potential of the manufacturing sector, the previous section examined a number of parameters associated with changes in manufacturing output in general and manufactured exports in particular. In the final analysis the ultimate and critical question with respect to the supply side is whether the scale and composition of incremental output are consistent with the country’s factor endow- ments. It is not so much whether manufactures are absorbed in do- mestic or international markets as whether policies create perverse movements one way or the other.
The partial and aggregate evidence seems to support the hypothesis that (a) the recent surge of nontraditional manufactured exports is along the lines of the country’s comparative advantage, (b) the changes in product composition during the seventies favor the relatively greater use of the country’s abundant resources, (c) factor proportions used in the manufacturing sector have declined in capital intensities, and (4 emerging policies and programs have recognized past distortions and consequently either compensated for them or explicitly favored labor-using incentives.
These trends and developments must be verified by firmer data than those presented here. In particular, input-output analysis is necessary to measure protection of industries, factor proportions, export inten- sity, and other behavior in order to substantiate the notion of sustained structural change and adjustment. l 4
On balance, however, the prospects for active participation in the growing international trade of industrial products appear encouraging. In the first place, opportunities for increasing market penetration in developed countries are available to the Philippines, given its relatively low share among developing nations. With continued diversification of trading partners (especially those countries where penetration growth rates have been high), the opportunities are even greater. In the second place, even in the face of rising protectionism the likely effect on the

506 Florian A. Alburo
country’s exports will probably be less than on those that have gained substantial shares of markets. And with the preferences for bilateral trade negotiations, there would seem to be greater scope for marginal access.15 In the third place, economic growth has been consistent with indigenous resource proportions. If development spreads faster in con- sonance with the recent past, the medium-term outlook will conform to directions mapped out by policy changes instituted as reactions to previous industrial growth. Finally, while the changes (and prospects) have not been without difficult problems, such as excessive product concentration and declines in value added, productivity, and new cap- ital investments in manufacturing, these problems may be minimized with appropriate policies (outlined below) so as to sustain further eco- nomic progress.
The record and prospects can be captured in a rough way by looking at the role of Philippine manufactured exports vis-a-vis the rest of the developing countries. Table 16.12 shows the shares of the Philippines in the sixty-four leading commodity exports of developing countries at the three-digit SITC level for which the country’s share exceeds 0.05%. In more than half of the products in the table the country’s share was
Table 16.12 Share of the Philippines in Leading Commodity Exports of Developing Countries (percentages)
SITC 1970 1975 1980
5 12 Organic chemicals 63 1 Veneers, plywood 653 Textiles 657 Floor covering 674 Iron and steel plates 719 Machinery, nonelectrical 729 Electrical machinery 732 Motor vehicles 831 Travel goods 841 Clothing 851 Footwear 864 Watches and clocks 893 Plastic 894 Toys 899 Other manufactures 931 Special transactions
a
15.81 a
a
a
0.02 a
a
a
0.04 a
a
0.07 0.94 0.37
a
6.29
1 .05b.c
0.69
a
a
a
0.75 a
a
0.77 11.18 18.12
3.90 8.93 0.57
3.01 -
1.10 1.05 0.67 2.02 2.0Sb 1.02 0.87 1.05 6.72b
22.43
Source: UNCTAD, Handbook of International Trade and Development Statistics (New York: United Nations), various issues. Note: SITC 0-4 not included. aValue less than 0.05%. bValue higher than Singapore’s share. c1978.

507 Trade Patterns and Trends of the Philippines
insignificant. SITC 631 really belongs to the traditional exports in the sense that it is not included in table 16.5. Clearly these shares (which account for 76% of exports of nontraditional manufactures) are small in comparison to other countries, particularly Singapore, Korea, Hong Kong, and Taiwan. There is substantial scope for further, if not ac- celerated gains.
The dangers that may thwart these prospects must, however, be recognized and anticipated, and those that are policy sensitive must be countered by effective policies. The realization of the expectations for manufactured exports necessitates a resilient and flexible approach within the scope of domestic policies. However,such an approach has not been exhibited in the recent past.
Resiliency is reflected in the country's ability to look toward both the domestic market and the external market. What constrains this ability is the growth of incomes and more critically the income distri- bution associated with manufactured export growth. On this score the country has consistently fared poorly. Section 16.2.2 noted the declines in real incomes of industrial workers throughout the sixties and the seventies. Figure 16.1 traces the movements of real wages of skilled and unskilled industrial workers during the decade of rising manufac- tured exports. A secular deterioration is obvious for both types of workers.16 In terms of income distribution, there is no apparent broad improvement in shares between 1965 and 1975 (the latest year for which data are available). In short, the necessary conditions for potential
1972 =
1 20
100
80
Skilled ~ 11 I I I I I ,
1969 70 71 72 73 74 75 76 77 78 79 80"
"JANUARY - SEPTEMBER
Fig. 16.1 Index of real wages of labor. 1972 = 100.

508 Florian A. Alburo
market redirection appear to be lacking. Not only do these circum- stances go against the traditional Heckscher-Ohlin expectations, l7 but there is a tendency to extol low labor prices as a virtue when competing for comparative advantage (World Bank 1980, 26).The route of com- petitiveness via improved productivity rather than wage deterioration is often neglected.’*
The message that this lack of resiliency imparts is evident: if failure to export manufactures slowed industrial development during the im- port substitution era of the sixties (because of the limited demand of the domestic market), it is likely that failure to expand and widen domestic markets will likewise weaken industrial resurgence in the eighties (should world trade in manufactures fail to actively recover).
Lack of flexibility is demonstrated in the implied manner of supply responses to trade in manufactures. Notice in table 16.12 that the sector in which the Philippines has a large share of developing-country exports is SITC 93 1, “special transactions not classified according to kind.” This is also the category with the highest growth, increasing in share 91-fold between 1970 and 1980. Whereas in 1970 this type of transaction was only 0.05% of all exports, in 1980 this had reached 14%.
These transactions are defined as those exports of products manu- factured from imported materials on a consignment basis. In the Phil- ippines, most belong to electrical and electronic equipment and gar- ments. The former includes semiconductor devices, diodes, and finished electrical and electronic machinery, while the latter includes gloves and mittens, handkerchiefs, women’s and men’s wear, children’s and in- fants’ wear, and embroideries. Some 38.5% of the 1980 manufactured exports were in these categories.
It is probably necessary to adjust the export contribution of nontra- ditional manufactures to determine net values rather than gross figures. This is not pursued here. However, assuming that most of SITC 931 transactions belong to electrical and electronics exports, aggregate im- port values for SITC 931 are likewise large. Consequently, the net exports (or value added) of these items are low-less than 1% of exports in 1980 and even negative in some years. A finer analysis is necessary but the implications are quite evident. For this reason the calculations made in table 16.10 would have been heavily biased had the exports of electrical and electronic equipment and components been included.
The nature of this behavior while disturbing may simply be a product of policies (e.g., the creation of free trade zones).I9 What is unfortunate is perhaps its implications for a more widespread industrial growth and deeper manufactured exports development. First, the smaller linkage engendered by special transactions generates fewer, if any, interindus- try relations. Production on consignment means labor is the only ef- fective link between the production process and the rest of industry.

509 Trade Patterns and Trends of the Philippines
Second, there is an inherent bias against domestic input suppliers in terms of increased value added. Indeed, exports under this category contribute less to value added than other products.*O Finally, although one may argue that markets are assured under these arrangements, they do not adequately test Philippine marketing capacities through exposure of production decisions to more external and global factors. These do not spell greater flexibility in market penetration or wide- spread manufacturing development.
The message that this lack of flexibility imparts is similarly evident: if simple packaging was considered a weakness of import substitution, the pattern of export growth behind these special transactions is no more than packaging either. One may of course argue that the labor intensiveness of the latter (and its ability to absorb surplus labor) makes a difference. But the broader question is, first, whether this alternative is an optimal one and, second, whether within the system changes can be made to improve interactions with the rest of the economy.
The Philippines seems to be the only country with the given scale of export (in terms of shares with respect to total country trade and to developing-country exports) in SITC 93 1. Both Brazil and Singapore experienced rising export shares in this category in the late sixties to midseventies, but it has since declined in importance. Indeed, it may be instructive to draw comparisons with other countries' experiences with these transactions; such a comparison may throw light on the process of export-led development at least to the extent of achieving some consistency of definition among countries.
These weaknesses serve to qualify the prospects for expansion of manufactured exports spelled out earlier, not invalidate them. More- over, they appear to be amenable to policy changes. In fact the broad structural adjustment reforms currently being adopted address certain aspects of these weaknesses directly. For instance, tariff reform will allow domestic input suppliers an equal footing with imported inputs. Modernization in certain industries will raise productivities and in- crease comparative advantage. Dismantling of domestic distortions (e.g., interest rate structure) will strengthen manufacturing development and encourage greater savings as well as capital formation. A concomitant drive to enlarge domestic market potentials requires a broad-based agricultural growth, which, combined with serious attempts to improve factor rewards and income equities, can create a more resilient outward- looking industrialization.
Aside from these kinds of measures fostering the prospects shaped by recent trends, one assumes the ability of the country to cushion the transition process.*' The Philippines has increasingly relied on external debt to provide much of this cushion, evident in its increase from $2 billion in 1970 to $17 billion in 1980 and more than $25 billion in 1983.22

510 Florian A. Alburo
While there may be questions about the effective use of debts in the country, it is important to remember that this cushion prevents drastic cuts in imports (in critical components of manufactures), sustains de- velopment infrastructure, and facilitates structural adjustments.
In view of declining sources for this cushion, it becomes even more imperative to aim for a more selective and judicious use of external resources. In the final analysis, global recovery and the thrust of export expansion are interdependent. In the same vein, the expansion of man- ufactured exports and industrial restructuring and development are interdependent.
The beginnings of industrial change are evident from the parameters explored in this paper. These changes have obviously been helped along by a more conscious outward-looking policy even amidst a continuing protectionist situation. In other words, the policy thrust of the seventies has occured on top of the vestiges of an import substitution era, rather than in lieu of it. The Philippines, as pointed out, must depart fully from its past regime.
The external exuberance of the growth of manufactured exports also helped industrial restructuring. The redirection of supply responses to correct their structural defects, evident from the experience of the seventies, will likewise lead to more manufacturing growth. Internal policy activism and external resurgence are mutually reinforcive of the interaction between trade and industrial growth.
Notes
1. There is a temptation, in this context, to narrowly view the seminal Lewis and Ranis and Fei models of development along these lines. This is partly because of the static nature of the analysis as well as the secondary importance given to manufactured exports. See also Lewis 1980 and Ranis and Fei 1964.
2. See Baldwin 1975, 39, passim, for more details on the evolution of the tariff system in the Philippines.
3. Rather than relying on moral suasion, the kinds of policies used were particularly those with proven effectiveness in influencing financial flows, such as deposit margins, selective and differential discount rates, and reserve ratios. 4. The World Bank (1980, 1) identifies a number of major points in this shift. 5. Bautista (1980) makes a strong case for the currency realignments of 1971
having had an influence on the trading system between the Philippines and the United States and Japan. In the postrealignment period, however, one can surmise that cross-currency adjustments would have less impact than real factors (Bautista 1980).
6. The best way of defining nontraditional manufactures is to define the composition of traditional manufactures and then say that those which do not belong to the latter are nontraditional. Traditional manufactures are associated

511 Trade Patterns and Trends of the Philippines
with the intermediate processing of traditional exports, viz., sugar, wood prod- ucts (excluding furniture), coconut and food products, and mineral products (excluding nickel).
7. There is a 1978 1-0 table, but it is not based on a new transactions matrix but is in fact collapsed from the larger matrix (from a 128-sector to a 68-sector) and adjusted proportionally for prices.
8. Calculations of census value added divided by total employees were made from National Census and Statistics Office, Annual Survey of Establishments, from 1956 to 1977, adjusted for prices.
9. This is based on the number of newly registered business organizations (corporations plus partnerships plus single proprietorships) and the total initial paid-in capital (converted in real terms through the GNP deflator).
10. The appropriate weight to use for the adjusted figures of Table 7 should be a price index series for manufactured exports. However, since there is no readily available set of indices for the Philippines, the export price index has been used.
11. See Tuong and Yeats 1980 for an analysis that argues for this classification scheme as a basis for measuring comparative advantage. World-wide, a test is found in UNCTAD 1982.
12. Capital intensity is measured in terms of fixed capital assets per worker, while labor intensity is measured by wages per worker.
13. However, this may not be as easy as it seems. For a detailed analysis of trade barriers and penetration into the EC by the ASEAN countries, see Lang- hammer 1981.
14. Bautista (1982) has calculated protection rates in Philippine manufac- turing resulting from the ongoing tariff reform program and concludes that the postreform protective structure would be the same. A serious qualification here is that structural parameters are assumed to remain the same between 1974 and 1985 (Alburo 1982).
15. This is not necessarily a beggar-thy-neighbor notion (in contrast to com- bating protectionism through regional solidarity) but simply a recognition of nonglobal approaches to trade negotiations (e.g., the Multi-Fiber Arrangement).
16. The index of real wages apples only to laborers in industrial establish- ments in metropolitan Manila and does not include government-decreed allow- ances (cost of living, thirteenth-month pay, food supplement, among others). For this reason the government discounts the trend as capturing actual returns. On the other hand, the metropolitan Manila rates are presumably on the high side because of great compliance with labor laws.
17. The prediction of the model that labor-using exports lead to an absolute and relative rise of labor’s share is of course static. The dynamic results depend on the relative growth rates of capital and labor as well as trade itself.
18.This is a practical statement not a technical assertion. Under competitive conditions the value of the marginal product of labor determines the wage rate.
19. The export processing zones in 1980 accounted for a small portion of the 931 transactions (3.4% of electronics and 24% of garments). The major source is through another export-incentive scheme, the bonded warehouse, wherein imported inputs on consignment are stored in designated customs warehouses where processing takes place for eventual export.
20. For example, handicraft exports (SITC 899) enhance value added as well as generate more interindustry transactions.
21. For example, Krueger (1981) argues that the role played by multilateral and aid agencies in this process is much smaller than what seems required to push the transformation.

512 Florian A. Alburo
22. External debt growth rates have been rising faster after 1975, when the growth of exports increased (compared with the annual average rate for 1970- 75) and import growth fell.
References
Alburo, Florian A. 1982. Discussion of “The recent tariff reform and effective protection of manufacturing industries” by Romeo M. Bautista. Paper pre- sented at 4th Annual Scientific Meeting of the National Academy of Science and Technology, July.
Baldwin, Robert E. 1975. Foreign trade regimes and economic development: The Philippines. New York: National Bureau of Economic Research.
Bautista, Romeo M. 1980. Structural change in the Philippines. In Economic interaction in the Pacific Basin ed. Lawrence B. Krause, and Sueo Sekiguchi. Washington, D.C.: Brookings Institution.
. 1982. The recent tariff reform and effective protection of manufacturing industries. University of the Philippines School of Economics Discussion Paper 8213.
Bautista, Romeo M., John H. Power, et al. 1979. Industrial promotion policies in the Philippines. Manila: Philippine Institute for Development Studies.
Cline, William R. 1982. Can the East Asian model of development be gener- alized? World Development, February, 81 -90.
Hughes, Helen, and Krueger, Anne 0. 1982. Effects of protection in developed countries on developing countries’ exports of manufactures. Paper presented at the NBER Conference on the Structure and Evolution of Recent U.S. Trade Policy, 3-4 December.
International Labor Office. 1974. Sharing in development: A programme of employment, equity and growth for the Philippines. Geneva.
Krueger, Anne 0. 1981. Loans to assist the transition to outward looking policies. World Economy, September.
Langhammer, Rolf. 1981. ASEAN manufactured exports in the EEC markets. Paper presented at the ASEAN Economic Research Unit Conference on ASEAN-EEC Economic Relations, Singapore, 6-8 August.
Lary, Hal. 1968. Imports of manufactures from less developed countries. New York: National Bureau of Economic Research.
Lewis, W. Arthur. 1980. The slowing down of the engine of growth. American Economic Review 70, no. 4.
Nurkse, Ragnar. 1953. Problems of capital formation in underdeveloped coun- tries. New York: Oxford University Press.
Power, John H., and Gerardo P. Sicat. 1971. The Philippines: Industrialization and trade policies. London: Oxford University Press.
Prebisch, Raul. 1959. Commercial policy in the underdeveloped countries. American Economic Review, May.
Ranis, Gustav, and John C. H. Fei. 1964. Development of the labor surplus economic: Theory and policy. Homewood, 111.: Irwin.
Sicat, Gerardo P. 1968. Industrial production functions in the Philippines. Uni- versity of the Philippines IEDR Discussion Paper 68-18.
Tan, Norma A. 1979. The structure of protection and resource flows in the Philippines. In Bautista et al. 1979.

513 Trade Patterns and Trends of the Philippines
Tuong, Ho Dac, and Alexander Yeats. 1980. On factor proportions as a guide to the future composition of developing country exports. Journal of Devel- opment Economics, September.
UNCTAD (United National Conference on Trade and Development). 1982. Trade and development report, 1982. New York: UN.
Williamson, Jeffrey G., and Gerard0 P. Sicat. 1968. Technical change and resource allocation in Philippines manufacturing, 1957 - 1965. University of the Philippines IEDR Discussion Paper 68-21.
World Bank, 1976. The Philippines: Prospects and priorities for development. Washington, D.C.: World Bank.
. 1980. The Philippines: Industrial development strategy and policies. Washington, D.C.: World Bank.

This Page Intentionally Left Blank