Embed Size (px)
Citation preview

1
EXPORT-IMPORT BANK OF INDIA
OCCASIONAL PAPER NO. 164
INDIA’s HI-TEcH EXPORTs:POTENTIAl MARKETs AND KEy POlIcy
INTERvENTIONs
© Export-Import Bank of IndiaFebruary, 2014
EXIM Bank’s Occasional Paper Series is an attempt to disseminate the findings of research studies carried out in the Bank. The results of research studies can interest exporters, policy makers, industrialists, export promotion agencies as well as researchers. However, views expressed do not necessarily reflect those of the Bank. While reasonable care has been taken to ensure authenticity of information and data, EXIM Bank accepts no responsibility for authenticity, accuracy or completeness of such items.

2

3
cONTENTs
Page No.
List of Tables 5
List of Exhibits 7
List of Annexures 9
Executive Summary 11
1. Introduction 22
2. Global Hi-Tech: Trade Analysis 29
3. Hi-Tech Trade Analysis: India Perspective 38
4. Product & Market Indentification of Hi-Tech Manufacturing 49
5. Strategies for Increasing Technology Based Exports 74
PROJEcT TEAM: REsEARcH & ANAlysIs GROUP S. PrahalathanChief General Manager Ashish KumarAsst. General Manager Rahul MazumdarChief Manager

4

5
Table No. Title Page No.
1. Share of MVA in GDP in Select Developing Countries 252. Hi-Tech Exports (% of Manufactured Exports) 26 for Select Countries3. Top 5 items of Key Categories of Hi-Tech Exports from World 304. Major Hi-Tech Items Traded in the World 315. Major Hi-Tech Export Items Showing Dynamism In Terms Of CAGR 336 Major Exporters of Hi-Tech Products in World 347. Key Importers of Hi-Tech Products in the World 368. Top 5 items of Key Categories of Hi-Tech Exports from India 399. Key Hi-Tech Export Items from India 4110. Key Export Destinations of Hi-Tech Products from India 4211. Top 5 items of Key Categories of Hi-Tech Imports by India 4412. Key Hi-Tech Import Items by India 4613. Key Source Countries for India’s Hi-Tech Imports 4714. Product Growth Matrix Description 5115. Product Champions under SITC 5 digit category 5416. The Top Global Importers under ‘Product Champion’ Category 58 and their Major Suppliers17. India’s Top Exports under ‘Product Champion’ Category, 61 Key Destinations and Competitor18. Underachievers under SITC 5 digit categor 6219. Growth in Declining Markets under SITC 5 digit category 6420. ‘Losers in Declining Markets’ under SITC 5 digit category 71
lIsT OF TABlEs

6

7
lIsT OF EXHIBITs
Exhibit No. Titles Page No.
1. Technology Trade: Globally and in India 27
2. Share of Hi-Tech Exports Sectorwise from World 30
3. Changing Share of Major Hi-Tech Exports (SITC 4 digit level) 32
4. Top Ten Hi-Tech Exporters: Inter-Temporal Comparison of Shares 35
5. Top Ten Hi-Tech Importers: Inter-Temporal Comparison of Shares 37
6. Changing Share of Hi-Tech Exports from India: Sectorwise 39
7. Changing Share of Hi-Tech Exports from India: Product-wise 41
8. Changing Share of Hi-Tech Exports from India: Country-wise 43
9. Changing Share of Hi-Tech Imports by India: Sectorwise 44
10. Changing Share of Hi-Tech Imports by India: Product-wise 46
11. Changing Share of Key Source Countries in Hi-Tech Imports by 48 by India
12. India’s Hi-Tech Product Growth Matrix: 2011 52
13. Strategies for Enhancing Hi-Tech Manufacturing and Exports 76

8

9
Annexure No. Title Page No.
1. Top 5 Hi-Tech Products Being Exported By Top 10 Exporters 88
2. Major Hi-Tech Products Being Imported By Top Importers 91
3. Key Hi-Tech Products Being Exported by India to Key Export 95 Destinations (US$ mn)
4. Key Hi-Tech Products Being Imported By India from Its 98 Major Sources (US$ mn)
lIsT OF ANNEXUREs

10

11
EXEcUTIvE sUMMARy
INTRODUcTION
Manufacturing remains one of the most important areas for the country to focus on, especially those kinds that entail high technology intensiveness. Technology oriented manufacturing has the ability to not only provide impetus to enhance revenue generation (through exports) but also has the potential to have a multiplier effect on job creation. The hi-tech manufacturing strategy will ramp up the industrial base that is key to our economic growth, and make the country self sufficient in critical technology oriented manufacturing products. The spin off benefits would be skilled jobs, enhanced exports coupled with less reliance on imports, resulting in a sustainable trade balance.
Th is s tudy has d i f fe rent ia ted manufacturing, based on technological intensiveness – high, medium and low technology manufacturing. The focus of the study include analyse the trends in international trade of hi-tech manufactured products, make an attempt to identify a product –market
segmentation for dynamic hi-tech products, and suggest strategies for realising the growth of hi-tech manufacturing, with special thrust on promoting their exports while at the same time providing avenues for import substitution. Exports have been the key to economic growth in most countries. With India’s appetite for technology goods and the focus increasingly shifting to newer markets, there is immense potential for our country to build competitive advantage in hi-tech manufacturing, such that we are able to cater both to domestic and foreign demands.
Economic theory commonly associates accumulation of R&D with the economic growth of a country. Various national governments continue to revise their policies in a bid to stay competitive and relevant, and thus, it becomes an imperative for a country like India to shift from traditional export items, which are largely low in technology intensiveness, to medium and high technology intensive exports. In a globally competitive space, countries dependent significantly on exports

12
of select primary products which are largely not technology oriented, face constraints in the long run in their development process.
The initial chapter highlights the key reasons for India to focus on technology oriented exports. The overarching concern is that the contribution of India’s manufacturing sector to the country’s GDP has remained stagnant, peaking at about 16 per cent of GDP, and later declined to 15.1 per cent. India’s share in global manufacturing is also at only 1.8 per cent. India needs a renaissance in manufacturing with a massive dose of new investments in the sector, which can spur country’s growth. Secondly, the average value addition of technology in products currently manufactured by Indian industry is around 8 per cent, very low compared to even that of other emerging developing nations. Indian manufacturing is rather shallow, with more focus on assembling and sales rather than design and development. Thirdly, India ranks globally at 52nd position in 2010, and stands below many of the developing and emerging countries like Thailand, South Korea, China, Indonesia, Mexico, Singapore, and Bangladesh in terms of manufacturing value added. Fourthly, it is observed that India’s share of hi-tech exports as a percentage of manufactured exports, though has improved during the period
1991 - 2001, by over 200 basis points, it has remained largely stagnant in the last 10 years period. When compared with world average, India lags far behind. This attests well to the fact that there is a tremendous investment opportunity in hi-tech product manufacturing in the country. Fifthly, the manufacturing sector in India has been a laggard for decades now, and one could argue insignificant R&D orientation in Indian manufacturing as one of the major reasons. Technology oriented manufacturing is the only way forward for Indian manufacturing to come out of the slumber and take a leap jump towards achieving a greater level of economic and export growth.
GlOBAl HI-TEcH TRADE : ANAlysIs
Second chapter details the international trade of tech exports, analysing the trends in trade by countries and products. The global exports of hi-tech sector are largely dominated by electronics and pharmaceuticals, which together constitute 80 per cent of world hi-tech exports. On the other hand, medium-tech exports are dominated by capital goods and automobiles, and low-tech exports are dominated by metal products and textiles. While developed countries continue to rule the roost in exports of technology oriented products, some developing countries have also managed to take

13
a slice of the pie. China, in particular, has emerged as a key hi-tech exporter in the world with a share of 20 per cent in world hi-tech exports in 2011.
HI-TEcH TRADE ANAlysIs: INDIA PERsPEcTIvE
The third chapter analyse the trends in India’s international trade of hi-tech products. Hi-tech exports from India have been witnessing a significant CAGR of 26.7 per cent during the period 2007-2011, with exports having touched US$ 20.9 bn as compared to US$ 8.1 bn in 2007. Notwithstanding this, the country’s potential in technology oriented manufacturing exports is yet to witness its full potential. Pharmaceuticals and electronic goods sectors predominate exports of hi-tech products from India, with the share of electronics in hi-tech exports almost doubling during the period 2007 and 2011. While key export destinations of hi-tech items remain largely the developed countries, there is a need to diversify into developing markets which have shown dynamism in import demand. The basket of India’s hi-tech imports is similar to the country’s hi-tech export basket, but for the absence of many pharmaceutical products, unlike in hi-tech exports, where they contributed significantly. India’s hi-tech imports from the world in 2011 touched US$ 33.6 bn, increasing from US$ 23.9 bn in 2007, thereby
registering a CAGR of 8.8 per cent. A rapid change in technology and India’s increasing appetite to buy such hi-tech products has increased the import demand for hi-tech items like semi-conductors. Consequently, the share of these products in India’s imports of hi-tech items has witnessed a significant rise.
PRODUcT & MARKET IDENTI-FIcATION OF HI-TEcH MANUFAcTURING
The fourth chapter undertakes analysis of identifying hi-tech products that have potential for exports from India. While India needs to further strengthen its share in the major import markets, there are countries where India is already exporting but at relatively lower levels. These markets are the latent growth drivers for India’s hi-technology exports and need to be suitably targeted. The chapter also has sought to identify products where domestic capacity expansion could yield significant results including higher exports.
sTRATEGIEs FOR INcREAsING TEcHNOlOGy BAsED EXPORTs
The final chapter makes an attempt to provide a roadmap which could potentially enable the country to enter the league of top hi-tech exporting nations. This gains significance

14
considering that India’s development story, post liberalization, has been one driven by the services sector, with the manufacturing sector playing only a second fiddle, mirrored in its stagnating contribution to the country’s economic output. That this may not be a sustainable developmental model has been taken cognizance of by the government, which has now set a target of 25 per cent contribution by the manufacturing sector to India’s GDP by 2022. Focus on hi-tech manufacturing products, especially in terms of their international competitiveness, needs to be an integral component of achieving this target. Achieving this goal requires coordinated advances in science, technology, innovation, and diffusion of the same. This strategy requires investments in multiple drivers, technology, education, capital formation, and industry infrastructure.
cAPAcITy ENHANcEMENT
Analysis in the previous chapter revealed 41 hi-tech products which were classified as ‘Product Champions’ and 6 as ‘Underachievers’. In order to give a special thrust to hi-tech exports, the prime objective would be to create avenues which result in enhancing exports of products identified under these categories, and thereby reduce the country’s mounting trade deficit. The cumulative value of India’s
exports of products under the Product Champions category amounted to US$ 2.0 bn (9.5 per cent of total hi-tech exports from India in 2011) while cumulative net trade deficit for the same set of products aggregated to US$ 2.8 bn in 2011. The top 5 products with the highest trade deficit included digital computers (SITC 7522); other control etc instrument (SITC 87465); microtome; parts of instruments for physical or chemical analysis (SITC 87449); and parts, checking instrument (SITC 87426); and chromatographs etc. instrument (SITC 87442). These 5 items together contributed to a trade deficit of US$ 2.3 bn out of the total trade deficit of US$ 2.8 bn of the identified 41 product champions. Given that the total exports of these 5 products from India aggregated to US$ 168 mn in 2011, it is apparent that India does have manufacturing capabilities of these hi-tech products. Anecdotal evidence would suggest that creating capacities for manufacturing these products could help push India into the big league for export of hi-tech products having maximum potential.
In the ‘Underachievers’ category, 6 hi-tech export products have been identified. The cumulative value of India’s exports of products under this category amounted to US$ 842 million in 2011, while the world import market for these 6 products stood at US$ 139.8 bn during the same period. Though for

15
these products, the world market has grown significantly faster than the average for all products (in the world) put together during the 2007-2011 period, India seems to be losing out market share to competing countries in these dynamic products. Further, for 5 products in this category, India’s imports were higher than exports resulting in a cumulative trade deficit of US$ 1.4 bn. While manufacturing capabilities exists in India, the fact that the country is importing significant amounts and that these imports have increased during the 2007-2011 period is indicative of shortage of manufacturing capacities.
The Government could consider building up capacity in these identified products under Product Champions and Underachievers by creating an enabling environment that promotes investments, especially foreign investments, in these product lines, and businesses and industry may focus on these products to enhance their revenues both by catering to domestic and overseas markets.
sectoral Focus: Hi-Tech Products
Electronics
India also needs to focus on specific sectors like electronics and capital goods. The share of hi-tech exports
in the electronics sector has increased from 16.8 per cent in 2007 to 30.1 per cent in 2011, with total exports amounting to US$ 6.3 bn in 2011. At the same time imports of hi-tech electronic items by India have increased from 66.4 per cent in 2007 to 69.9 per cent in 2011. It may however be noted that India’s share in exports of hi-tech electronics to world have witnessed an increase from 0.1 per cent to 0.4 per cent during analysed period. Given the increasing propensity of India’s exports of hi-tech electronics, and the significant import appetite globally, impetus on increasing production of electronics becomes a win-win situation, both to satiate domestic demand as also to earn foreign exchange through exports. While the Government of India already has in place a number of fiscal incentives which envisages enhancing production of electronics, it could also learn from the examples of the successful development of this industry in other countries. For example, Taiwan fashioned a system that offered incentives to firms that succeeded in raising their productivity or their export levels, and penalise firms that did not achieve such goals by withdrawing the tax credits and other financial incentives. In this way, Taiwan’s leadership maintained a tight focus on policy goals and on

16
performance toward those goals rather than allowing incentive programs to become mere rent-seeking systems. Institutions in Taiwan were fashioned to encourage performance-oriented behaviour. Institutional learning took place, from country to country and within countries, as the institutions created adapted to new circumstances and acquired new experiences. For every step in the industry-building process, Taiwan’s firms developed strategies to complement the strategies being pursued by established firms overseas. India could follow a similar approach of inculcating the successful experiences from abroad while creating a niche for itself in the electronics industry.
Capital Goods
The capital goods sector which has a multiplier effect and has a bearing on the growth of the user industries, as it provides critical inputs, is a strategic one. The sector primarily comprises machinery, nuclear reactors, boilers, electrical, electronic equipments, etc. Although exports of capital goods from India increased from US$ 8.7 billion in 2007 to US$ 14.9 billion in 2011, its share in world exports remains marginal at 0.6 per cent as in 2011. Imports, on the other hand, were at staggering US$ 44.5
billion as in 2011, with the country accounting for a share of 2 per cent of world capital goods imports. Given the huge demand domestically, there is an urgent need to capitalise upon the domestic market and encourage import substitution. Hi-tech oriented capital goods are a huge opportunity for India to focus upon, not just for the domestic market but also to tap the overseas markets. This would entail acquisition of technology know-how, especially from overseas firms through knowledge sharing, joint ventures, acquisitions, and investments, both inward as well as outward.
Policy Incentives to Encourage Private sector Investments and FDI in Hi-Tech Manufacturing
One of the major reasons cited for low volume of hi-tech goods production is low greenfield FDI inflows and limited focus on R&D by Indian companies. Indian investment in R&D is largely government driven. On the other hand, countries such as Japan and South Korea are looking out for alternative investment destinations, instead of China, because of geopolitical reasons. Since hi-tech manufacturing is also high value added, they are not constrained by logistics and wage rates as compared to low-tech or mid-tech

17
goods. Hence, there has to be a pull factor to attract investments into this sector. This could be attained through fiscal and financial incentives.
A Special Subvented Financing Package
Countries like Brazil have been providing special financing package under its investment support programme, viz. PSI Programme (Programa BNDES de Sustenção do Investimento) which subsidizes the interest rate of loans from the state development bank, BNDES, to purchase capital goods and support export and technological innovation. The Government of India / RBI could also consider setting up a similar credit facility exclusively for investments in hi-tech industries, so as to level the playing field and augment the country’s export competitiveness for such products. Such mechanism, if considered for implementation, should provide low cost funds cheaper than the cost of ECB financing, as also the ECA financing and pave the way for India to either move into hi-tech products which are currently not being manufactured or enhance its competitiveness in such products where it is competing with other global players. The BNDES model could be studied in detail and adapted in the Indian context so as to draw out the
modalities of this proposal including the purpose, scope and coverage.
Tax Incentives for Investments in Hi-Tech Products
For the hi-tech sector to prosper, tax incentives for investments in hi-tech products is crucial. Fiscal reliefs raise the net present value of prospective research projects by reducing the cost of R&D. Fiscal measures allow markets – rather than governments – to determine the allocation of R&D investments across sectors, firms and projects. China presents an interesting case of fiscal incentives to attract investments in hi-tech sectors. Under its Enterprise Income Tax (EIT) Law that took effect in 2008, enterprises qualifying for the High-New Technology Enterprises (HNTE) Status regime are entitled to a preferential EIT rate of 15 per cent, rather than being subject to the normal rate of 25 per cent. The Chinese government provides a list of eight state encouraged industries that are considered in awarding HNTE status which benefits out of this program. India also provides certain fiscal incentives for R&D expenses which is mostly sector neutral. This includes a 100% deduction for R&D expenses (other than land) that satisfy a set of basic criteria and a super deduction of up to 200 per cent of qualifying R&D

18
expenses and research activities (150 per cent super deduction in the case of China). However, with a focus on promoting hi-tech manufacturing and exports, India could as well take a cue from the Chinese HNTE system and adopt suitable policy incentives. A key mechanism of this policy incentive would be preferential corporate income tax treatment for units manufacturing hi-tech products and meeting certain pre-defined criteria as in the case of the Chinese HNTE.
The Government of India announced a package of incentives in July 2012 for one of the hi-tech sectors, viz. the Electronic System Design and Manufacturing (ESDM) sector within Electronics Manufacturing Clusters (EMC), under the Modified Special Incentive Package Scheme (M-SIPS). This scheme provides for a 25 per cent subsidy on capital investments in new ventures and a 50 per cent grant for common facilities for units located in an area (viz. EMC), in addition to reimbursement of central taxes and duties. The benefits of M-SIPS are available for a period of 10 years after the initial investment. The Government could consider extending such special incentives for investments across all pre-notified hi-tech manufactured products which would catalyse investments (both domestic and FDI) in hi-tech manufacturing. The enabling provisions as highlighted above would
help promote greenfield FDI inflows into hi-tech manufacturing sector, facilitating technology transfer and capacity development in domestic manufacturing. There would also be spin-off benefits of such package of incentives as outlined above, viz. creation of ancillary segments supplying to the large high technology manufacturing units, as was the case in the auto-component sector where larger mother units created a ready demand for development of OEM auto ancillary suppliers. While in the short term, there could be a marginal fiscal impact on the government, but over a longer term horizon, this could potentially benefit if the units are profitable through job creation, investments and eventually revenues (through both direct and indirect taxes).
cluster Development Approach
Financial Assistance to set up World Class Hi-Tech Clusters
Industrial clusters have been proven to have several advantages in promoting the growth of a particular sector or industry. The National Manufacturing Policy has proposed the creation of massive National Investment and Manufacturing Zones (NIMZ) which are being conceived as industrial greenfield townships to promote world-class manufacturing activities.

19
A critical advantage the NIMZs can deliver is the clustering of small and large manufacturers (essentially customers and suppliers among themselves). While the setting up of NIMZ would be a longer-term option, the Government, in the near-term, could consider broadening the scope of the Electronics Manufacturing Clusters to include select identified hi-tech products thereby driving innovation and developing an entrepreneurial ecosystem. Under the EMC scheme, which supports setting up of both greenfield and brownfield clusters, financial assistance in the form of grant-in-aid would be provided to a Special Purpose Vehicle (SPV) promoted by private companies, industry associations, financial institutions, R&D institutions, State or Local governments or their agencies and units within the EMC. For Greenfield EMCs, the assistance would be up to 50 per cent of the project cost (subject to a ceiling of ` 50 crore for every 100 acres of land) while for brownfield EMCs, assistance would be up to 75 per cent of the project cost (subject to a ceiling of ̀ 50 crore). There is a need to expand the scope of the EMC scheme, in toto, to all hi-tech manufacturing clusters. This would help flow of both domestic and global investments for the development of world-class infrastructure specifically targeted towards attracting investments in the hi-tech sector.
Mitigating Financial Bottlenecks: Include Lending to Hi-Tech Clusters as part of Priority Sector
Over the years, the Indian financial system has played a crucial role in terms of directed resource mobilization in favour of sectors of strategic importance to the country, borne out by various policies, chief among them being Priority Sector Lending. At present, domestic commercial banks are required to achieve a priority sector target of 40 per cent of Adjusted Net Bank Credit* (ANBC), and the foreign banks are required to achieve 32 per cent of ANBC**. Within the overall priority sector lending target, sub-targets are set for domestic commercial banks to lend a minimum of 18 per cent to agriculture, and 10 per cent to weaker sections. Though Micro and Small Enterprises (MSE) sector is also included under the priority sector for domestic commercial banks, there is no sub-target set. Given the Government’s strong focus on hi-tech manufacturing, one of the policy options could be to include lending to notified hi-tech clusters and the units operating therein as a part of the overall priority sector lending. Depending upon the thrust of the Government to make India a key manufacturing hub of hi-tech products, RBI could also consider putting sub-targets for lending to hi-tech industries clusters at 10 per cent of ANBC.
*Foreign banks with 20 and above branches **Foreign banks with less than 20 branches

20
Institutional linkages quintessential for Technology Clusters
Empirical studies across geographies have established the fact that technical universities are an integral component for building a successful cluster. In India, this causal relationship has been rather non-existent with hardly any concrete intervention of institutes or technical universities in clusters. As against this, in USA, if Stanford University and University of California at Berkeley are disconnected from the Silicon Valley, this region would fast deteriorate as a technology cluster. That would be unlikely in the case of say Indian Institute of Science, Bangalore or Indian Institute of Technology from New Delhi, if removed or shifted from the respective cities – the technology companies present in the nearby clusters would still continue to perform without any significant adverse impact. While the Government does not need to intervene directly, it can surely facilitate an enabling environment for strong industry-academia linkages, wherein institutions are motivated and encouraged to share common platforms with clusters for knowledge sharing and research. It may be worthwhile to mention here that for reinvigorating its manufacturing sector, USA has allocated US$ 500 million to six universities to initiate the Advanced Manufacturing Partnership program between industry and institutions. The
partnership includes 11 manufacturing companies including Ford Motor Co., Caterpillar Inc., Procter & Gamble Co., and Northrop Grumman Corp., and Dow Chemical Co., among others.
Other Measures
Leverage Public Procurement for Localization and Technology Transfer
India represents one of the fastest growing markets in the world. Local demand provides a unique opportunity for hi-tech manufacturers to scale up, especially considering the country’s ever increasing trade deficit in this segment. The government needs to ensure an environment that promotes investments in local manufacturing and enables the domestic players to compete on a level playing field. Examples of countries such as China and Korea, where this has been the basis for creating global giants, could be suitably adapted in the Indian context.
Adapting and Replicating Successful Development Models of Hi-Tech Manufacturing
India also needs to adapt and replicate successful development models of hi-tech manufacturing. Analysis of hi- tech zones like Chengdu (China) and Colorado (USA) reveals that these regions, despite being land-

21
locked (away from ports by about 800 kms) have been able to develop successful hi-tech manufacturing industries. These have, over the years, increased their exports significantly, provided additional employment and generated higher tax revenues than neighbouring regions that have not adopted a hi-tech manufacturing strategy. These two examples indicate that hi-tech manufacturing is region-neutral and does not require large land area. Suitable geographies may be identified in various states to develop hi-tech zones. A conscious attempt is required to be made to attract foreign and domestic investment in these sectors by offering special incentives as is being offered by other countries, some of which have been highlighted in the subsequent sections.
Creating Institutes of Strategic Importance
India could consider building institutes of st rategic importance which are focussed on developing and implementing innovative ideas related to hi-tech products. These institutes could help ensure technological competence, while allowing India to
leapfrog its global competitors in the medium to long term. The National Innovation Council could perhaps take a lead in this initiative. USA, for example, while being aware of the power of manufacturing, has invested in the development of National Manufactur-ing Innovation Institutes. One such institute that is already up and running is the National Additive Manufacturing Innovation Institute (NAMII) in Youngstown, Ohio. NAMII is a public-private partnership initiative with member organizations from industry, academia, government, and workforce development resources, all collaborating with a singular, shared vision. NAMII’s goal is to transition additive manufacturing technology to the mainstream U.S. manufacturing sector, and create an adaptive workforce capable of not only meeting industry needs but also increasing domestic manufacturing competitiveness. India too needs to establish institutes of such magnitude which can help the country to create niche hi-tech products that could potentially earn greater levels of foreign exchange through exports.

22
1. INTRODUcTION
Competitiveness is critical for sustainable industrial development, and the element of competitiveness is arrived at through technological interventions in manufacturing. Technology oriented manufacturing not only induces higher returns but also strengthens other forms of industries while creating capabilities to deepen manufacturing. Technological depth also ensures self-reliance in strategically important sectors and ensures a healthy trade balance. The technological structure of production invariably entails a shift of the production structure from relatively simple to higher order activities and complex technologies. Moreover, technologically oriented manufacturing offers other benefits or externalities namely: they tend to grow more rapidly in terms of the variety in production and trade; they have greater scope in economies, exists learning potential and beneficial spillovers; and all these together help in making countries more responsive to new technological demands. This chapter highlights the key reasons for India to focus and concentrate on technology oriented exports. The reasons on hindsight as explained include: the deteriorating share of manufacturing in the country’s GDP, the critical nature of technology intervention that is essential in manufactured exports, stagnant Manufacturing Value Added (MVA) for a period of almost two decades, laggards in share in technology oriented manufactured exports when compared with other emerging peers, and the importance of R&D orientation in manufacturing. Given the impetus by the Government to accelerate and increase the share of manufacturing in India’s exports in a decade, this study attempts to highlight some directions to attain the same.
E c o n o m i c t h e o r y c o m m o n l y associates a positive relationship between investments in research and development and economic growth of a country. As governments continue to revise their policies in a bid to
gain competitive edge, it becomes imperative for a country like India to move up the technological value chain to realise higher returns while at the same time maintaining its competitiveness in traditional export

23
items. In a globally competitive space, countries dependent significantly on exports of select primary products which have low technology orientation, face constraints in the long run development process. Uncertainty arising from price variability, consequent fluctuating export earnings, and difficulties in achieving economic diversification can prove to be detrimental for such countries which are still in the process of development and have relatively low incomes. This study makes an attempt to apprise of the significant potential that technology-laden exports have, and India’s potential therein.
There have been various definitions of technology products. World Bank defines high technology exports as “... those that are products with high R&D intensity, such as in aerospace, computers, pharmaceuticals, scientific instruments, and electrical machinery”; Eurostat defines it “... as being involved in, or making use of highly advanced technological development or devices, mainly the use of electronics (especially computers); while UNIDO actually classified them under SITC 3-digits, wherein 17 products have been identified across industries.
While the demand and the production of high-end technology oriented products have gained significance,
it becomes important to convey the benefits of such an endeavour, which will enhance the productivity of the sector in India.
lagging share of Manufacturing in India’s GDP
In the las t two decades, the Indian economy has witnessed a transformational change to emerge as one of the fastest growing economies in the world. Economic reforms unveiled in 1991 have brought about a structural shift enabling the private sector to assume a much larger role in the economy. GDP growth has largely been enabled by growth of the services sector. The overarching concern is that the contribution of India’s manufacturing sector to the country’s GDP has remained stagnant at about 16 per cent of GDP, and later declined to 15.1 per cent. India’s share in global manufacturing is also at only 1.8 per cent. It may be noted that the share of manufacturing in India’s GDP currently has been at the lowest level in the past 10 years. This is in stark contrast to the experience of other Asian nations, who were at similar stages of economic development, particularly China, where manufacturing constitutes 34 per cent of national GDP and 13.7 per cent of world manufacturing - up from 2.9 per cent in 1991.

24
1National Manufacturing Competitiveness Council
Ind ia needs a renaissance in manufacturing with a massive dose of new investments in the sector, which can spur country’s growth. Manufactur ing sector has the propensity to act as a panacea, to many of India’s long standing challenges, namely, unemployment, trade deficit, etc. A modern manufacturing sector is essential for the development of our scientific and technological base, for the growth of our knowledge economy, and for our national security. The realization of the need to substantially increase the share of manufacturing in India’s GDP, from the current levels of around 14 per cent to 25 per cent by 2022, to address the problem of unemployment and under-employment in the country, has as its natural corollary, the strategy to ‘Boost India’s Manufacturing Exports’ during the XII Five Year Plan.
Importance of technology content in manufacturing output and exports
Exports have been the key to economic growth in most countries. With India’s potential technology strengths and with the focus shifting to export of newer products and to newer markets in the Foreign Trade Policy (2009-14) announced by the Government of India, there is an excellent opportunity for
India to evolve competitive advantage through technology-led exports. The average value addition of technology in products currently manufactured by Indian industry is around 8 per cent, very low compared to even other emerging developing nations1. Indian manufacturing is rather shallow, with more focus on assembling and sales rather than design and development. Despite having one of world’s largest and fastest growing markets, the country captures only a very limited part of the product value chain, thus limiting its potential to undertake assemblies/sub-assemblies in India. Industry’s investment in R&D is the main indicator to measure industrial innovation. In the developed economies, the share of industry’s investment in R&D is around 3/4th of the Gross Expenditure in R&D (GERD) whereas in India the picture is diametrically opposite. India’s overall GERD is low (compared to innovation driven economies) at around 1 per cent of GDP, and the situation becomes alarming when large portion of GERD is Government driven (3/4th of GERD is from the Government sector).
This has, among others, resulted in low levels of manufacturing value added (MVA) in the country, a situation that has remained virtually the same over the past two decades. Table-1 clearly

25
2 Value added is the net output of a sector after adding up all outputs and subtracting intermediate inputs. It is calculated without making deductions for depreciation of fabricated assets or depletion and degradation of natural resources
depicts India’s mediocre position globally in the list of countries ranked in terms of manufacturing value added (as a percentage of GDP)2. India ranked 52nd globally in 2010, and stands below many of the developing and emerging countries like Thailand, South Korea, China, Indonesia, Mexico, Singapore, and Bangladesh.
share of Hi-Tech Exports in Manufactured Exports of India
India’s hi-tech exports as a percentage of manufactured exports has remained largely stagnant during the last ten years. When compared with world average, India lags far behind. A comparison with select developing and emerging economies in the world (Table 2) shows that India was
ranked 8th just above South Africa and Kenya. Countries like Malaysia, China, South Korea, Mexico, and Israel, exhibits a double digit share of hi-tech exports in their total manufactured exports (43.4 per cent, 25.8 per cent, 25.7 per cent, 16.5 per cent and 14 per cent, respectively). Further, the divergence is even more stark in terms of absolute values of hi-tech exports – China’s exports is 25 times that of India (US$ 517.4 bn vs. US$ 20.9 bn), South Korea is 6 times (US$ 129.4 bn) and Malaysia 3 times (US$ 64.2 bn).
sUM UP
The manufacturing sector in India has remained on the fringes for long,and one could argue insignificant R & D
Thai
land
sout
h K
orea
chi
na
Indo
nesi
a
Mal
aysi
a
sing
apor
e
Phili
ppin
es
Mex
ico
Ban
glad
esh
Bra
zil
Indi
a
sout
h A
fric
a
Ken
ya
1991 28.2 27.4 32.5 21.4 25.6 26.1 25.3 20.6 13.4 25.3 15.2 22.9 12.0
2010 35.6 30.3 32.5 24.8 24.6 21.6 21.4 17.3 17.9 16.2 14.9 14.7 11.3
Table 1: share of MvA in GDP in select Developing countries*
* MVA is calculated as a percentage OF GDPSource: World Bank Indicators, 2013

26
cO
UN
TRy
NA
ME
1991
2001
2002
2003
2004
2005
2006
2007
2008
2009
2010
2011
WO
RlD
18.7
22.9
22.2
21.1
20.9
20.7
20.8
17.5
16.6
18.3
17.5
17.6
DEv
ElO
PIN
G E
cO
NO
MIE
sM
alay
sia
38.2
58.1
58.2
58.9
55.7
54.6
53.8
52.3
39.9
46.6
44.5
43.4
Chi
nana
21.0
23.7
27.4
30.1
30.8
30.5
26.7
25.6
27.5
27.5
25.8
Sing
apor
e40
.560
.960
.656
.556
.956
.958
.145
.249
.448
.149
.945
.2M
exic
o8.
722
.121
.421
.421
.319
.619
.017
.215
.718
.216
.916
.5Is
rael
11.3
18.6
15.5
16.8
16.9
14.0
14.5
7.5
11.1
17.6
14.7
14.0
Indo
nesi
a1.
914
.216
.714
.816
.416
.513
.511
.010
.912
.99.
88.
3R
ussi
ana
14.0
19.2
19.0
12.9
8.4
7.8
6.9
6.5
9.2
9.3
8.0
Indi
a4.
77.
06.
25.
96.
05.
86.
16.
46.
89.
17.
26.
9So
uth
Afric
ana
6.5
5.2
4.8
5.5
6.7
6.5
5.6
5.1
5.4
4.3
5.1
Keny
a3.
04.
910
.63.
63.
22.
93.
25.
54.
25.
35.
7na
DEv
ElO
PED
Ec
ON
OM
IEs
Sout
h Ko
rea
19.3
29.8
31.5
32.3
32.9
32.5
32.1
30.5
27.6
28.7
29.5
25.7
Uni
ted
King
dom
24.7
34.1
31.7
26.3
24.5
28.3
33.9
18.9
18.5
21.8
21.0
21.3
Uni
ted
Stat
es32
.432
.631
.830
.830
.329
.930
.127
.225
.921
.519
.918
.1Ja
pan
24.2
26.6
24.8
24.4
24.1
23.0
22.1
18.4
17.3
18.8
18.0
17.5
Ger
man
y13
.118
.317
.516
.917
.817
.417
.114
.013
.315
.315
.315
.0
Tabl
e 2:
Hi-T
ech
Expo
rts
(% o
f Man
ufac
ture
d Ex
port
s) fo
r sel
ect c
ount
ries
Sour
ce: D
ata
deriv
ed fr
om W
orld
Indi
cato
rs D
evel
opem
ent,
Wor
ld B
ank;
Exi
m B
ank
Res
earc
h
27
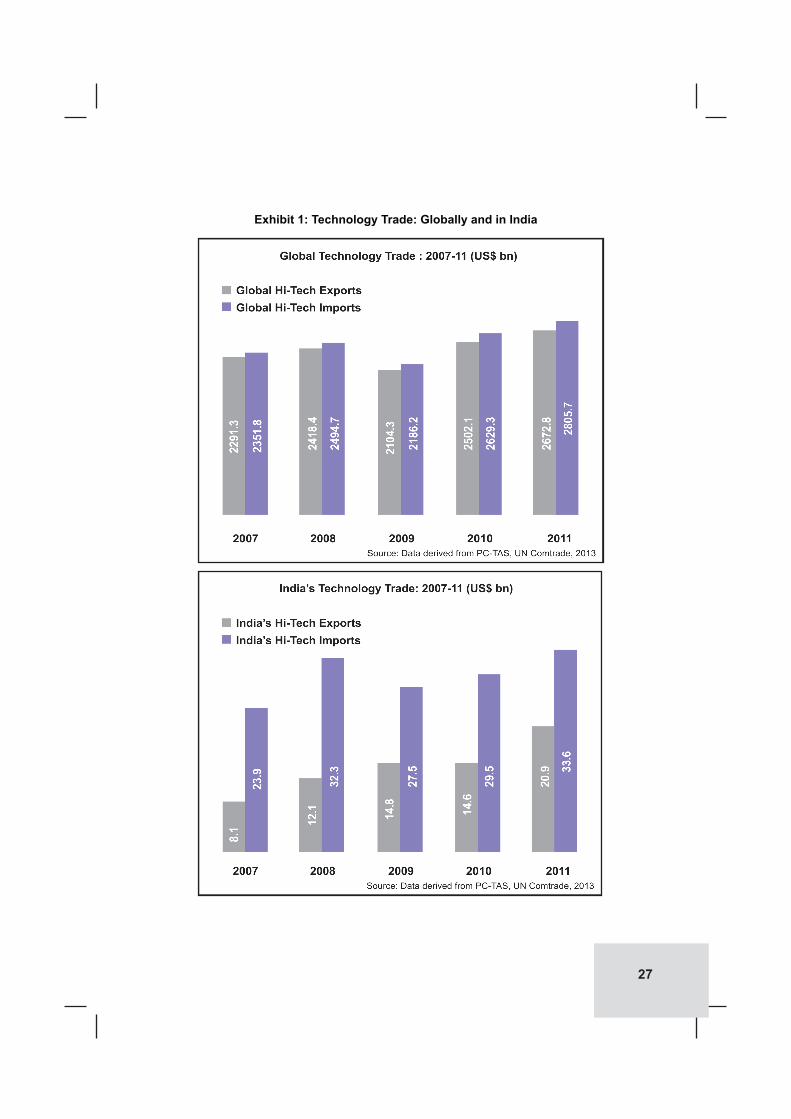
Exhibit 1: Technology Trade: Globally and in India
28
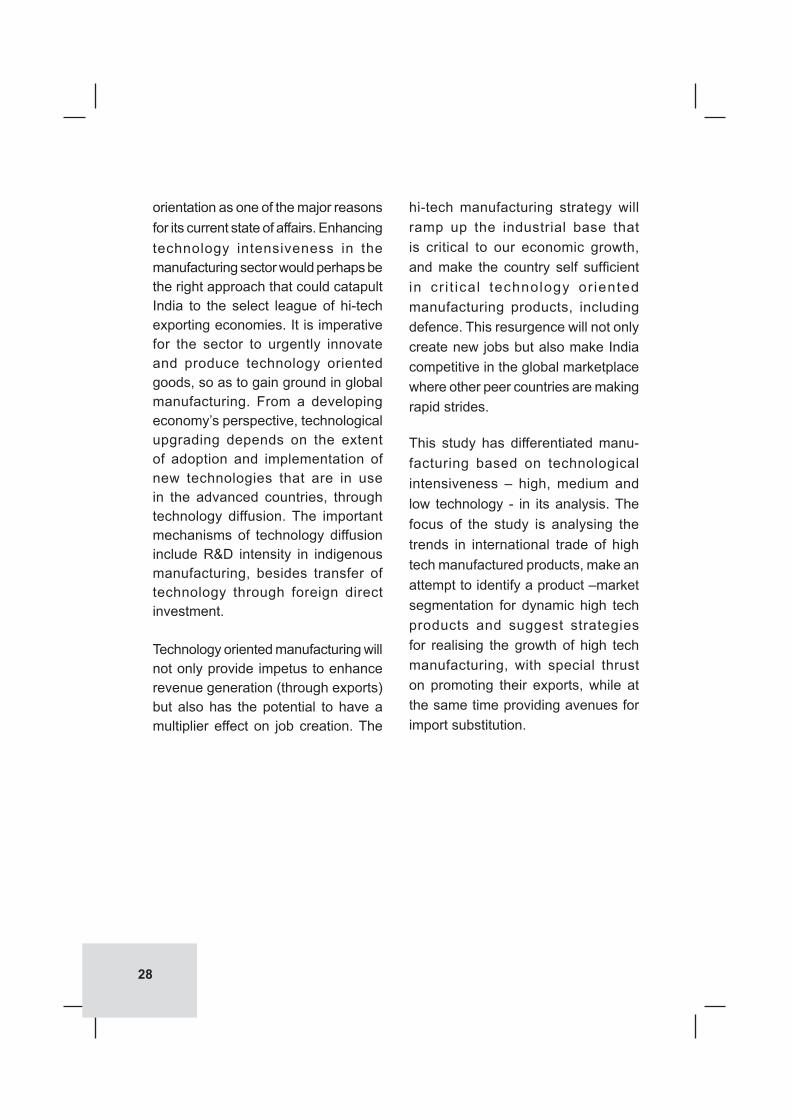
orientation as one of the major reasons for its current state of affairs. Enhancing technology intensiveness in the manufacturing sector would perhaps be the right approach that could catapult India to the select league of hi-tech exporting economies. It is imperative for the sector to urgently innovate and produce technology oriented goods, so as to gain ground in global manufacturing. From a developing economy’s perspective, technological upgrading depends on the extent of adoption and implementation of new technologies that are in use in the advanced countries, through technology diffusion. The important mechanisms of technology diffusion include R&D intensity in indigenous manufacturing, besides transfer of technology through foreign direct investment.
Technology oriented manufacturing will not only provide impetus to enhance revenue generation (through exports) but also has the potential to have a multiplier effect on job creation. The
hi-tech manufacturing strategy will ramp up the industrial base that is critical to our economic growth, and make the country self sufficient in cr i t ical technology or iented manufacturing products, including defence. This resurgence will not only create new jobs but also make India competitive in the global marketplace where other peer countries are making rapid strides.
This study has differentiated manu-facturing based on technological intensiveness – high, medium and low technology - in its analysis. The focus of the study is analysing the trends in international trade of high tech manufactured products, make an attempt to identify a product –market segmentation for dynamic high tech products and suggest strategies for realising the growth of high tech manufacturing, with special thrust on promoting their exports, while at the same time providing avenues for import substitution.

29
2. GlOBAl HI-TEcH TRADE: ANAlysIs
Globally, technology exports have witnessed an increase across the categories, high, medium, and low. The global hi-tech export sector is largely dominated by electronics and pharmaceuticals, which together constitute 80 per cent of hi-tech exports. On the other hand, medium-tech exports are dominated by capital goods and automobiles, and low-tech exports are dominated by metal products and textiles. While developed countries continue to rule the roost in exports of technology oriented products, some developing countries have also managed to take a slice of the pie. China, in particular, has emerged as a key technology exporter in the world with a share of 20 per cent in world hi-tech exports. China’s share, especially in global hi-tech exports, has shot up significantly since 2007. This chapter details the international trade of hi-tech exports analysing the trade trends by countries and products.
HI-TEcH EXPORTs
Hi-tech exports were valued at US$ 2672.8 bn in 2011, growing from a level of US$ 2291.3 bn in 2007, recording a CAGR (compounded annual growth rate) of 3.9 per cent, during the period 2007-2011. Within hi-tech exports, while electronic products continued to remain the largest sector, its share declined from 62.9 per cent in 2007 to 61.7 per cent in 2011. On the other hand, exports of hi-tech pharmaceutical products witnessed an increase in share from 16.0 per cent to 18.3 per cent during the same period.
A similar increase was witnessed in the case of electrical equipment sector with its share increasing from 7.8 per cent to 8.6 per cent.
Analysis at SITC 4-digit level reveals that electronic microcircuit (SITC 7764) was the predominant hi-tech item traded in the world, accounting for a significant share of 15.0 per cent of total global hi-tech exports in the year 2011. Other major hi-tech items traded include: telecommunication equipment and parts (SITC 7649); TV, radio transmitters etc (SITC 7643); digital computers (SITC 7522); and parts

30
Table 3: Top 5 items of Key categories of Hi-tech Exports from World
Exhibit 2: share of Hi-Tech Exports sectorwise from World
ElEcTRONIcs(2011: 61.7 per cent share)
PHARMAcEUTIcAls(2011: 18.3 per cent share)
sITc code
Product Name
share2007
share2011
sITc code
Product Name
share2007
share2011
7764 Electronic microcircuits 15.6 15.1 5429 Glycosides; glands etc. 2.3 3.6
7649
Parts And Accessories Suitable For Use Solely Or Principally With The Apparatus Of Telecommunications And Sound Recording And Reproducing Equipment
7.0 6.6 5416 Medicaments, hormones etc 1.1 1.2
7643 TV, radio transmitters etc 5.9 6.1 5422 Medicaments, antibiotics 0.7 0.8
7522 Digital computers 4.6 5.8 5421
Medicaments containing antibiotics or derivatives thereof
0.6 0.7
7599
Parts And Accessories For Use Solely Or Principally With Office Machines (except Photo- Or Thermo-copy) And Automatic Data Processing Machines
6.6 4.9 5419
Pharmaceutical goods, other than medicaments
0.5 0.6
Source: Data derived from PC-TAS, UN Comtrade, 2013, EXIM Bank Research
Source: Data derived from PC TAS, UN Comtrade; Exim Bank Research Source: Data derived from PC TAS, UN Comtrade; Exim Bank Research

31
3All residual items which are categorised as not elsewhere classified have been excluded for the purpose of the analysis
and accessories of data processing etc. machinery (SITC 7599). Among the top 10 export items, glycosides, glands etc (SITC 5416); diodes, transistors etc (SITC 7763); digital computers (SITC 7522); and liquid crystal devices, lasers (SITC 8719); registered significant growth during the period 2007-2011 (Table 4).3
Electronic microcircuits continued to dominate the hi-tech export market during the period 2007-2011 with its share in world hi-tech trade hovering in the 14 per cent to 15 per cent range. While most of the major products have more or less remained the same, one particular item that merits a mention is glycosides, glands, etc (SITC 5416),
Table 4: Major Hi-Tech Items Traded in the World
sITc PRODUcT NAMEvAlUE (Us$ BN) cAGR
(%)
2007 2008 2009 2010 2011 2007-11
7764 Electronic microcircuits 357.3 332.4 305.1 391.5 402.3 3.0
7649 Parts, telecommunication equipment 161.5 175.0 141.4 165.5 176.6 2.3
7643 TV, radio transmitters etc 136.0 136.3 121.5 135.6 162.9 4.6
7522 Digital computers 106.5 115.2 106.9 138.9 154.7 9.8
7599
Parts And Accessories For Use Solely Or Principally With Office Machines (except Photo- Or Thermo-copy) And Automatic Data Processing Machines
151.2 151.4 120.4 141.1 131.0 -3.5
7763 Diodes, transistors etc. 62.6 78.6 67.5 112.4 113.2 16.0
8719 Liquid crystal devices; lasers 67.5 77.0 68.2 92.4 96.9 9.5
5416 Glycosides; glands etc. 52.3 63.3 76.9 85.2 95.5 16.3
7924
Airplanes And Other Aircraft, Mechanically Propelled (other Than Helicopters), Of An Unladen Weight Exceeding 15,000 Kg
97.0 99.3 60.3 70.6 79.2 -5.0
7712 Other electric power machine, part 53.3 59.8 49.9 67.5 74.0 8.6
TOTAl HI-TEcH EXPORTs 2291.3 2418.4 2104.3 2502.1 2672.8 3.9
Source: Data derived from PC-TAS, UN Comtrade, 2013, EXIM Bank Research

32
whose share in world hi-tech trade increased from 2.3 per cent in 2007 to 3.6 per cent in 2011.
An analysis of hi-tech products with export value of more than US$ 10 bn in 2011 reveals that most of these products can be either categorised as electronic products, or medicinal and pharmaceutical products. These two segments accounted for 80 per cent of world hi-tech exports in 2011. Medicinal and pharmaceutical products was also among the segments which exhibited dynamic growth during the
period 2007-2011, with items like glycosides (SITC 5416), hormones (SITC 5415) and antibiotics, not put up as medicaments (SITC 5413) being among the top 5 items (excluding residual items, i.e. not elsewhere classified) in terms of growth. Out of the top 10 products in terms of CAGR, 5 products also figure in the list of top 10 items in terms of absolute export values in 2011 (Table 5).
China remained the largest exporter of hi-tech products in the world, with exports aggregating to US$ 517.4 bn in 2011, registering a CAGR of 10.8
Exhibit 3: changing share of Major Hi-Tech Exports (sITc 4 Digit level)
Source: Data derived from PC TAS, UN Comtrade; Exim Bank Research Source: Data derived from PC TAS, UN Comtrade; Exim Bank Research

33
sITc PRODUcT NAMEvAlUE (Us$ BN) cAGR
(%)
2007 2008 2009 2010 2011 2007-11
5416 Glycosides; glands etc. 52.3 63.3 76.9 85.2 95.5 16.3
7763 Diodes, transistors etc. 62.6 78.6 67.5 112.4 113.2 16.0
5415 Hormones, etc. 8.8 8.2 9.0 10.4 13.1 10.6
7522 Digital computers 106.5 115.2 106.9 138.9 154.7 9.8
5413 Antibiotics, not put up as medicaments 11.2 12.4 12.6 12.5 16.2 9.7
8719
Liquid Crystal Devices,; Lasers (other Than Laser Diodes); Other Optical Appliances And Instruments
67.5 77.0 68.2 92.4 96.9 9.5
8744 Instruments, analysis etc 25.5 28.5 27.5 31.2 36.3 9.2
7712Electric Power Machinery; Parts Of Electric Power Machinery
53.3 59.8 49.9 67.5 74.0 8.6
5419 Pharmaceutical Goods, Other Than Medicaments 14.0 16.7 16.4 18.3 19.4 8.5
5421 Medicaments, antibiotics 15.5 17.6 18.8 20.2 21.4 8.4
Total Hi-Tech Exports 2291.3 2418.4 2104.3 2502.1 2672.8 3.9
Table 5: Major Hi-Tech Export Items showing Dynamism In Terms Of cAGR
Source: Data derived from PC-TAS, UN Comtrade, 2013, EXIM Bank Research
per cent during the period 2007-2011. The top 20 exporters also comprise many other emerging countries like Malaysia, Mexico, and Russia (Table 6). It may also be noted that while hi-tech exports from China is increasing at a rapid pace, exports from countries like USA, Japan and UK – the traditional hi-tech exporters – have been showing weak and declining growth rates. USA, in fact, witnessed a negative CAGR of 5.0 per cent during the period
2007-2011. However, one country that merits a mention here is Switzerland, whose exports of hi-tech products recorded a significant CAGR of 11 per cent, the highest among the top 20 hi-tech exporters, with exports touching US$ 73.9 bn in 2011.
Comparison of shares of hi-tech exporters in the world, country wise, for the years 2007 and 2011 shows that there has been a slight increase

34
vAlUEs (Us$ BN) cAGR (%)
2007 2008 2009 2010 2011 2007-11
China 342.7 383.1 344.6 458.5 517.4 10.8
Germany 203.0 220.2 192.0 211.1 235.9 3.8
USA 286.2 289.6 201.7 226.7 233.1 -5.0
Hong Kong 134.4 142.8 132.8 168.7 186.3 8.5
Singapore 115.4 127.5 103.8 135.5 135.4 4.1
South Korea 113.5 113.7 104.1 131.6 129.4 3.3
France 100.8 114.9 102.3 118.4 124.9 5.5
Japan 110.8 112.2 90.6 112.6 115.2 1.0
Taiwan 89.4 89.9 75.0 106.1 114.9 6.5
Netherlands 82.0 70.9 64.1 72.8 80.7 -0.4
Switzerland 48.5 58.8 57.8 62.9 73.9 11.1
United Kingdom 69.1 69.8 63.1 67.3 71.8 1.0
Malaysia 68.6 48.0 55.8 64.4 64.2 -1.6
Belgium 60.9 66.0 64.4 64.4 64.0 1.3
Italy 40.8 43.5 38.1 41.8 47.7 4.0
Mexico 36.2 39.5 35.8 45.4 47.5 7.0
Ireland 42.8 44.7 43.1 41.2 46.7 2.2
Thailand 33.2 32.8 29.8 35.9 34.9 1.3
Canada 39.8 37.2 33.2 33.0 34.8 -3.3
Sweden 25.6 26.9 23.2 26.2 28.2 2.4
Total Hi-Tech Exports 2291.3 2418.4 2104.3 2502.1 2672.8 3.9
Table 6: Major Exporters of Hi-Tech Products in World
Source: Data derived from PC-TAS, UN Comtrade, 2013, EXIM Bank Research
EXPORTING cOUNTRy

35
in the cumulative share of the top 10 exporters - from 68.9 per cent in 2007 to 70.1 per cent in 2011. While China continued its dominance in hi-tech exports, its share also witnessed a significant increase, from 15.0 per cent in 2007 to 19.4 per cent in 2011. On the other hand, USA which had a share of 12.5 per cent in 2007 witnessed a considerable decline in the share of global hi-tech exports, to 8.7 per cent in 2011 (Exhibit 4). Amongst the developed countries, France and Switzerland exhibited an increase in share in world exports of hi-tech products between the two analysed periods.
China with a share of 19.3 per cent in global hi-tech exports has been exporting largely electronic products. (See Annexure-1). The key export destination for Chinese hi-tech products remains Hong Kong, USA, Japan, Netherlands, Korea, and
Germany (in that order). India was the 9th largest export destination for China. USA and Germany, apart from exporting electronic and computer items, also exported pharmaceutical products.
It is also interesting to note that for most major Asian exporters, the hi-tech base is fairly narrow with the top hi-tech export item accounting for at least one-fifth, and top 5 items together accounting for at least half of the country’s total hi-tech exports in 2011. Unlike this, hi-tech export base of western countries like Germany, USA, and France (to a lesser extent), and the Netherlands is reasonably broad-based.
Another interesting point that emerges is for all the top 10 hi-tech exporters, electronic microcircuits (SITC 7764) remains a key item; this item accounts for nearly half of the hi-tech exports of Singapore and Taiwan.
Exhibit 4: Top Ten Hi-Tech Exporters: Inter-Temporal comparison of shares
Source: Data derived from PC TAS, UN Comtrade; Exim Bank Research Source: Data derived from PC TAS, UN Comtrade; Exim Bank Research

36
HI-TEcHNOlOGy IMPORTs
As in the case of exports, China was also the top importer of hi-tech products with imports aggregating to US$ 419.9 billion in 2011 (Table 7). In fact the top
IMPORTERvAlUEs (Us$ BN) cAGR
(%)
2007 2008 2009 2010 2011 2007-11
China 305.7 320.1 292.9 381.2 419.9 8.3
USA 323.0 327.2 298.4 350.5 381.3 4.2
Hong Kong 146.1 151.4 143.8 185.3 203.5 8.6
Germany 166.4 177.8 159.2 184.0 198.0 4.4
Japan 93.3 97.2 84.7 105.0 115.8 5.5
France 86.3 92.2 87.2 103.1 110.7 6.4
Singapore 88.2 100.0 79.0 98.0 99.5 3.1
United Kingdom 81.0 77.0 66.0 75.3 80.7 -0.1
South Korea 60.7 63.8 53.8 67.4 73.3 4.8
Netherlands 74.3 67.0 58.2 67.4 73.0 -0.5
Mexico 51.8 61.2 53.4 67.2 70.9 8.2
Italy 51.1 54.8 50.3 63.9 65.8 6.5
Canada 51.9 53.7 48.0 54.9 60.2 3.7
Taiwan 55.2 51.6 41.8 57.2 59.5 1.9
Belgium 59.7 63.6 59.9 58.8 56.6 -1.3
Malaysia 55.1 42.6 41.7 55.0 56.4 0.6
Russia 26.7 33.6 25.3 34.4 40.2 10.8
Spain 45.1 53.2 39.9 39.2 38.7 -3.7
Switzerland 31.0 33.0 30.4 33.6 38.6 5.6
Australia 26.2 28.9 24.2 29.0 35.2 7.7
TOTAL HI-TECH IMPORTS 2351.8 2494.7 2186.2 2629.3 2805.7 4.5
five exporters of hi-tech products were also the top five importers, although not in the same order. China’s import appetite has visibly moved up with its share having increased from 13 per cent in 2007 to 15 per cent in 2011.
Table 7: Key Importers of Hi-Tech Products in the World
Source: Data derived from PC-TAS, UN Comtrade, 2013, EXIM Bank Research

37
While Germany, USA and Japan have almost maintained the same shares in 2007 and 2011, import share of Hong Kong has witnessed a marginal increase from 6.2 per cent to 7.3 per cent. The key importing countries across the globe have also imported largely electronic products (See Annexure 2). Major hi-tech import items that are common to more than 5 major importers included: digital computers (SITC 7522); parts and accessories of data processing etc. machines (SITC 7599); and TV, radio transmitters etc. (SITC 7643). Another notable feature
Exhibit 5: Top Ten Hi-Tech Importers: Inter-Temporal comparison of shares
is that for all the Asian importers of hi-tech products, among the top ten global importers of hi-tech products, electronic micro circuits (SITC 7764) was the largest import item. Further, this product accounted for a predominant share of total hi-tech imports for all these countries – for Singapore and China, this share was as high as 47.7 per cent and 40.6 per cent, respectively, in 2011. As against this, the import basket of hi-tech products of the western markets was fairly diverse with no single product category accounting for more than 13 per cent share of its total hi-tech imports.
Source: Data derived from PC TAS, UN Comtrade; Exim Bank Research Source: Data derived from PC TAS, UN Comtrade; Exim Bank Research

38
3. HI-TEcH TRADE ANAlysIs: INDIA PERsPEcTIvE
Hi-tech exports from India have increased by two and half times in value terms, registering a CAGR of 25.7 per cent during the period 2007 and 2011. Notwithstanding this, the country’s potential in technology oriented manufacturing exports is yet to witness its full potential. Pharmaceuticals and electronic goods sectors predominate exports of hi-tech products from India, with the share of electronics in hi-tech exports almost doubling between the period 2007 and 2011. While key export destinations of hi-tech items remain largely the developed countries, there is a need to diversify into developing markets which have shown dynamism in import demand.
HI-TEcH EXPORTs
Hi-tech exports from India has witnessed a s igni f icant CAGR (compounded annual growth rate) of 26.8 per cent during the period 2007-2011, with exports having touched US$ 20.9 bn as compared to US$ 8.1 bn in 2007. In absolute terms, hi-tech exports have increased by more than 2.5 times, during the period 2007 and 2011. While pharmaceutical sector was the leading export item under the hi-tech category in India, its share declined between the period 2007 and 2011, from 55.3 per cent to 45.5
per cent. As against this, electronic goods have emerged as major hi-tech export items increasing their share from 16.8 per cent in 2007 to 30.1 per cent in 2011 (Exhibit 6). Share of electrical products in overall hi-tech exports have, however, subsided from 18 per cent to 9.9 per cent during the analyzed period.
The top 10 products of export4 in the hi-tech category constituted 44.0 per cent of India’s total hi-tech exports during 2011. Among these, most were pharmaceutical products – medicaments containing antibiotics
4Does not include products under the residual category of ‘n.e.s’

39
Table 8: Top 5 items of Key categories of Hi-tech Exports from India
PHARMAcEUTIcAls (2011) ElEcTRONIcs (2011)sITc code
Product Name
share2007
share2011
sITc code
Product Name
share2007
share2011
5421 Medicaments, antibiotics 10.9 6.4 7643 TV, radio transmitters
etc 1.6 15.7
5413Antibiotics, not put up as medicaments of group 542
6.3 4.2 7649Parts, telecommunication, equipment
3.2 5.3
5416 Glycosides; glands etc. 2.5 2.1 7763 Diodes, transistors etc. 3.0 1.7
5422 Medicaments, hormones etc 3.3 1.7 7599
Parts, data processing etc. machinery
2.1 1.4
5414 Vegetable. alkaloids, except group 542 0.7 0.8 7641 Line telephone etc.
equipment 0.9 1.0
Source: Data derived from PC-TAS, UN Comtrade, 2013, EXIM Bank Research
Exhibit 6: changing share of Hi-Tech Exports from India: sectorwise
Source: Data derived from PC TAS, UN Comtrade; Exim Bank Research Source: Data derived from PC TAS, UN Comtrade; Exim Bank Research

40
or derivatives thereof (SITC 5421); antibiotics, not put up as medicaments of group 542 (SITC 5413)5; and glycosides; glands etc (SITC 5416)6. Together these items accounted for 12.7 per cent of total hi-tech exports from India. Another category of products that finds frequent mention in the list is electronic products like TV, radio transmitters etc (SITC 7643); parts, telecommunication equipment (SITC 7649); and diodes, transistors etc. (SITC 77637). These items together constituted 22.7 per cent of the hi-tech product exports from India (Table 8).
In terms of CAGR of the top 10 hi-tech products exported from India (Table 9), TV, radio transmitters etc (SITC 7643) exhibited a triple digit growth of 122.9 per cent during 2007 and 2011, with exports having increased from US$ 0.1 bn to US$ 3.3 bn during the analyzed period. Another item in the electronic sector
which has shown dynamic growth in exports is parts of telecommunication equipment (SITC 7649), registering a CAGR of 38.4 per cent, to touch US$ 1.1 bn in 2011.
There has been a slight decline in the share of the top 10 hi-tech exports in the country’s total hi-tech exports (Exhibit 7) - from 45.1 per cent in 2007 to 43.7 per cent in 2011. It is observed that most products witnessed a marginal decline in share amongst key hi-tech export products in 2011 as compared to 2007. Notable increase in share has been in the case of parts of telecommunication equipment (SITC 7649), where share has increased from 3.2 per cent in 2007 to 5.3 per cent in 2011.
As regards markets (Table 10), USA remained the largest export destination for India’s hi-tech products in 2011. Exports of hi-tech products
55413 Includes: Penicillins and their derivatives with a penicillanic acid structure; Streptomy-cins and their derivatives; Tetracyclines and their derivatives; salts thereof65416 Includes: Glycosides, natural or reproduced by synthesis, and their salts, ethers, esters and other derivatives; Glands and other organs for organotherapeutic uses, dried, whether or not powdered; extracts of glands or other organs or of their secretions for organotherapeutic uses; heparin and its salts; other human or animal substances prepared for therapeutic or prophylactic uses; Antisera and other blood fractions; vaccines; Human blood; animal blood prepared for therapeutic, prophylactic or diagnostic uses; toxins, cultures of micro-organisms (excluding yeasts) and similar products77763 Includes: Diodes, transistors and similar semiconductor devices; photosensitive semiconductor devices (including photovoltaic cells, whether or not assembled in modules or made up into panels); light-emitting diodes

41
Table 9: Key Hi-Tech Export Items from India
sITc Product Namevalue (Us$ mn) cAGR
(%)2007 2008 2009 2010 2011 2007-11
7643 TV, radio transmitters etc 133 199 3485 1514 3285 122.9%
5421 Medicaments, antibiotics 884 1260 838 1050 1328 10.7%
7649 Parts, telecommunication equipment 259 220 338 292 1113 44.0%
5413 Antibiotics, not put up as medicaments of group 542 513 599 638 691 883 14.5%
7712Other electric power machinery; parts of the electric power machinery of group 77
448 584 454 507 671 10.6%
5416 Glycosides; glands etc 199 129 330 218 436 21.7%
7711 Transformers, electrical 259 421 422 376 403 11.7%
7763 Diodes, transistors etc. 244 561 462 615 360 10.2%
5422
Medicaments containing hormones or other products of subgroup 5415 but not containing antibiotics
267 361 350 260 358 7.6%
7599 Parts, data process etc. machines 168 233 245 233 295 15.1%
Total Hi-Tech Exports 8098 12068 14858 14652 20904 26.8%
Source: Data derived from PC-TAS, EXIM Bank Research
Exhibit 7: changing share of Hi-Tech Exports from India: Product-wise
Source: Data derived from PC TAS, UN Comtrade; Exim Bank Research Source: Data derived from PC TAS, UN Comtrade; Exim Bank Research

42
to USA recorded a CAGR of 19.5 per cent, with value of exports touching US$ 3.7 bn in 2011. UAE emerged as the second largest destination for India’s hi-tech exports in 2011, at the back of strong demand, with exports to the country registering a significant CAGR of 45.8 per cent. Other major countries to which India is exporting hi-tech products are largely European nations (UK, Netherlands,
Germany and France). Nigeria also figured among the list of top 10 hi-tech export destinations for India in 2011, exhibiting the second highest growth rate (after UAE) in terms of CAGR (37.5 per cent).
Comparison of share of major hi-tech export markets for India between the years 2007 and 2011 (Exhibit 8) shows that there has not been much change
Table 10: Key Export Destinations of Hi-Tech Products from India
countryvalue (Us$ mn) cAGR
(2007-11)2007 2008 2009 2010 2011
USA 1807 2238 2415 3361 3681 19.5%
UAE 223 402 611 470 1007 45.8%
UK 333 387 460 623 865 27.0%
Netherlands 260 398 361 421 850 34.5%
Russia 330 446 346 391 828 25.9%
Germany 400 703 697 688 764 17.6%
Singapore 307 599 656 600 759 25.4%
Nigeria 175 250 516 368 626 37.5%
France 176 308 316 405 503 30.0%
South Africa 137 249 366 377 498 38.1%
Total Hi-Tech Exports 8098 12068 14858 14652 20904 26.8%
Source: Data derived from PC-TAS, UN Comtrade, 2013; EXIM Bank Research

43
as far as the set of top countries are concerned, but the shares of these countries have witnessed a perceptible change. USA continues to be the primary market for India’s hi-tech products, though its share in total hi-tech exports from India declined from 22.4 per cent in 2007 to 17.6 per cent in 2011. Some of the new entrants include South Africa, with a share of 2.4 per cent in 2011, which has replaced Brazil, as key export destination for India’s hi-tech products, amongst the top 10 distinations
Further, of the key hi-tech products that are being exported from India to USA and UK, a significant portion is constituted by pharmaceutical products (See Annexure 3). On the other hand, TV, radio transmitters (SITC 7643) is the top item of hi-tech exports to most countries including
Exhibit 8: changing share of Hi-Tech Exports from India: country-wise
UAE, Russia, Germany, Nigeria, France and South Africa.
HI-TEcH IMPORTs
India’s hi-tech imports from the world in 2011 touched US$ 33.6 bn, increasing from US$ 23.9 bn in 2007, thereby registering a CAGR of 8.8 per cent. Imports of hi-tech products were predominated by electronic items with the sector’s share in India’s imports of hi-tech items increasing from 66.4 per cent in 2007 (Exhibit 9) to 69.9 per cent in 2011. The other major sector of hi-tech imports was electrical goods sector whose share also witnessed an increase from 8.8 per cent to 11.0 per cent during the analysed period.
The basket of India’s hi-tech imports is similar to the country’s hi-tech export basket, but for the absence of many pharmaceutical products in the
Source: Data derived from PC TAS, UN Comtrade; Exim Bank Research Source: Data derived from PC TAS, UN Comtrade; Exim Bank Research

44
Exhibit 9: changing share of Hi-Tech Imports by India: sectorwise
Table 11: Top 5 items of Key categories of Hi-Tech Imports by India
ElEcTRONIcs (2011) ElEcTRIcAls (2011)
sITc code
Product Name
share2007
share2011
sITc code
Product Name
share2007
share2011
7643 TV, radio trans-mitters etc 16.7 17.5 7712
Static converters, Ballasts for discharge lamps/tubes
2.7 3.7
7649Parts, telecom-municationequipment
6.5 11.5 7642 Microphone loudspeak-ers amplifiers 0.6 1.3
7764 Electronicmicrocircuits 2.7 6.4 7163 Electric motors, genra-
tors.AC 0.7 0.8
7599 Parts, data proc. etc. machine 5.5 5.3 7711 Transformers, electrical 0.6 0.7
7763 Diodes,transistors etc. 1.6 5.3 8743 Gas, liquid measuring
control instrument 0.6 0.6
Source: Data derived from PC TAS, UN Comtrade; Exim Bank Research Source: Data derived from PC TAS, UN Comtrade; Exim Bank Research

45
country’s import basket, unlike in hi-tech exports, where they contributed significantly. The major hi-tech import items in 2011 (Table 12) included TV, radio transmitters etc (SITC 7643); parts, telecommunication equipments (SITC 7649); electronic microcircuits (SITC 7764), parts, data processing machines (SITC 7599), diodes, transistors etc. (SITC 7763)8; digital computers (SITC 7522); electrical power machinery, parts (SITC 7712)9; and antibiotics, not put up as medicaments of group 542 (SITC 5413)10. Most of these products also figure among the top hi-tech exports from India, reflecting domestic production capabilities of India.
The demand for these products in the domestic market is significantly higher than the supply, thereby creating the need to import. Products like electronic microcircuits (SITC 7764)11 and diodes, transistors etc. (SITC 7763) have shown tremendous import
87763 Includes: Thermionic, cold cathode or photo-cathode valves and tubes (e.g., vacuum or vapour or gas-filled valves and tubes, mercury arc rectifying valves and tubes, cathode-ray tubes, television camera tubes); diodes, transistors and similar semiconductor devices; photosensitive semiconductor devices; light-emitting diodes; mounted piezoelectric crystals; electronic integrated circuits and microassemblies; parts thereof97712 Includes: Static converters (e.g., rectifiers); Ballasts for discharge lamps or tubes; Other inductors; Parts of the electric power machinery of group 77110 5413 Includes: Penicillins and their derivatives with a penicillanic acid structure; Streptomycins and their derivatives; Tetracyclines and their derivatives; salts thereof11 7764 Includes: Digital monolithic integrated units; Non-digital monolithic integrated units; Hybrid integrated circuits; Other electronic integrated circuits and microassemblies
growth recording CAGRs of 35.1 per cent and 45.6 per cent, respectively. Consequently, the share of these products in India’s imports of hi-tech items has witnessed a significant rise.
With increasing domestic demand and limited domestic capacity to manufacture indigenously, India has the potential to attract investments, including FDI in the electronic microcircuit (SITC 7764) sector and diodes, transistors etc. (SITC 7763). Parts, telecommunication equipments (SITC 7649) also witnessed a significant import growth during the period 2007-2011, at CAGR of 25.4 per cent (Table 12).
India’s imports of hi-tech products have primarily been from China, whose share in the country’s hi-tech imports increased from 31.6 per cent in 2007 to 39.8 per cent in 2011 (Exhibit 11). While USA managed to remain

46
Table 12: Key Hi-Tech Import Items by India
sITc Product Name value (Us$ mn) cAGR
2007 2008 2009 2010 2011 2007-11
7643 TV, radio transmitters, etc 4006 4144 3416 5430 5888 10.1%
7649 Parts, telecommunication equipments 1560 1327 3602 3846 3857 25.4%
7764 Electronic microcircuits 649 171 1469 1223 2159 35.1%
7599 Parts, data process etc, machinery 1317 1362 1325 1374 1796 8.1%
7763 Diodes, transistors etc. 393 680 741 643 1765 45.6%
7522 Digital computers 957 906 706 1127 1593 13.6%
7712Other electric power machinery; parts of the electric power machinery
654 773 883 860 1236 17.2%
5413 Antibiotics, not put up as medicaments of group 542 735 754 709 910 900 5.2%
7527 Storage units, data processors 729 774 640 753 856 4.1%
8742 Drawing, measuring instrument 546 702 533 663 787 9.6%
Total Hi-Tech Imports 23950 32291 27538 29554 33599 8.8%
Source: Data derived from PC-TAS (SITC), EXIM Bank Research
Exhibit 10: changing share of Hi-Tech Imports by India: Product-wise
Source: Data derived from PC TAS, UN Comtrade; Exim Bank Research Source: Data derived from PC TAS, UN Comtrade; Exim Bank Research

47
the second largest source for hi-tech imports in 2011, its share fell down significantly from 17.3 per cent in 2007 to 8.4 per cent in 2011. The other major source country whose share in India’s hi-tech imports increased was South Korea – from 3.3 per cent to 5.2 per cent during this period.
In terms of absolute figures, India’s imports from China increased from US$ 7.6 bn in 2007 to US$ 13.4 bn in 2011, registering a CAGR of 15.4 per cent (Table 13). Imports from South Korea
during the same period increased from US$ 0.7 bn to US$ 1.7 bn, recording a high CAGR of 22.3 per cent. Among the western countries other than USA, India imported hi-tech products mainly from Germany, France, and Switzerland.
Electronic goods remain the major hi-tech items imported by India from China with all the top 4 items (accounting for 57.8 per cent of total hi-tech imports from China) belonging to this sector (See Annexure 4).
Table 13: Key source countries for India’s Hi-Tech Imports (Us$ mn)
source 2007 2008 2009 2010 2011 cAGR 2007-11)
China 7557 7432 8962 11629 13379 15.4%
USA 4131 9300 3050 3247 2822 -9.1%
Germany 1257 1788 2630 1612 2163 14.5%
South Korea 785 1166 1169 1644 1755 22.3%
Singapore 1720 1398 1556 1431 1601 -1.8%
Malaysia 1024 789 712 842 1357 7.3%
Japan 747 757 960 902 1236 13.4%
Taiwan 304 430 488 576 975 33.8%
France 745 3654 2086 1469 809 2.1%
Switzerland 415 513 543 631 688 13.5%
Total Hi-Tech Imports 23950 32291 27538 29554 33599 8.8%
Source: Data derived from PC-TAS (SITC), EXIM Bank Research

48
Exhibit 11: changing share of Key source countries in Hi-Tech Imports by India
Imports of parts, telecommunication equipment (SITC 7649) from China increased significantly with its share increasing from 2.4 per cent to 6.3 per cent. TV, radio transmitters (SITC 7643) and parts, telecommunication equipment (STC 7649) figured among the top hi-tech items imported from most of the import source countries.
It is interesting to note that TV, radio transmitters was also the major hi-tech exports items for India, as also the item that figured the maximum times among India’s top hi-tech export destinations, although most of those destinations were different from the import sources as mentioned in Annexure 4.
Source: Data derived from PC TAS, UN Comtrade; Exim Bank Research Source: Data derived from PC TAS, UN Comtrade; Exim Bank Research

49
4. PRODUcT & MARKET IDENTIFIcATION OF HI-TEcH MANUFAcTURING
This chapter undertakes a granular analysis of identifying hi-tech products that have potential for exports from India by narrowing the SITC classification to SITC-5 digits. An attempt has been made to map the global demand for such products with India’s exports with a view to outlining a market specific approach for exporters. Also analyzed are India’s current export markets and the key competitors which India faces in these markets. While India needs to further consolidate its share in the major markets, there are countries which have witnessed dynamic import growths where India already has a presence but at peripheral levels. These markets are the potential growth drivers for India’s hi-tech exports and need to be suitably targeted. India’s capacity to serve abroad gets further strengthened given the shift and renewed focus on the manufacturing activity in the country. With domestic firms’ gradually developing capability in serving the overseas end-user industries, there is a need to diversify into these hi-tech product lines with a view to tap the global markets.
PRODUcT IDENTIFIcATION
Objective:
To identify and categorize the hi-tech products where India could focus on, to realize potentially higher values, especially when considering that the country already possesses manufacturing capabilities for these products.
The idea is to construct a product
market matrix for hi-tech products in demand along with the key demand centers (importers), and the key exporters to these regions (India’s competitors).
Methodology:
The 3-digit SITC (17 products)
hi-tech products have been disaggregated at a granular level into 5-digit SITC12 (219 products).
12Out of 199 products in 5 digits, 6 products have been analyzed at 4 digits since they cannot be further disaggregated. These are SITC: 7521, 7522, 7523, 7526, 7527, 7529
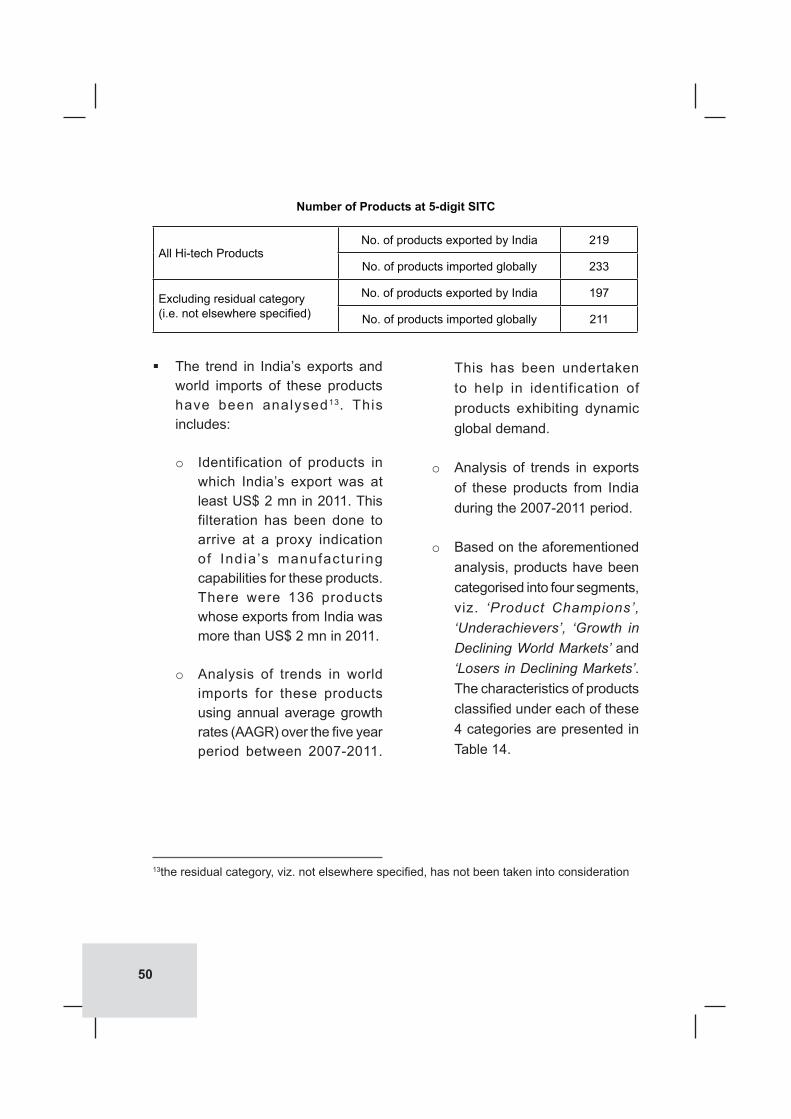
50
The trend in India’s exports and world imports of these products have been analysed13. This includes:
Identification of products in o which India’s export was at least US$ 2 mn in 2011. This filteration has been done to arrive at a proxy indication of India’s manufactur ing capabilities for these products. There were 136 products whose exports from India was more than US$ 2 mn in 2011.
Analysis of trends in world o imports for these products using annual average growth rates (AAGR) over the five year period between 2007-2011.
All Hi-tech ProductsNo. of products exported by India 219
No. of products imported globally 233
Excluding residual category(i.e. not elsewhere specified)
No. of products exported by India 197
No. of products imported globally 211
Number of Products at 5-digit sITc
13the residual category, viz. not elsewhere specified, has not been taken into consideration
This has been undertaken to help in identification of products exhibiting dynamic global demand.
Analysis of trends in exports o
of these products from India during the 2007-2011 period.
Based on the aforementioned o
analysis, products have been categorised into four segments, viz. ‘Product Champions’, ‘Underachievers’, ‘Growth in Declining World Markets’ and ‘Losers in Declining Markets’. The characteristics of products classified under each of these 4 categories are presented in Table 14.

51
14Products having description “nes” has not been considered for categorization
cATEGORy INDIA’s EXPORTs WORlD IMPORTs
PRODUcT cHAMPIONs(have maximum potential)
AAGR of India’s exports of these products is > AAGR of world imports of these products (i.e. share of India in these products in the world market has increased over the period)
AAGR of World imports of these products is > AAGR of World’s total imports (i.e. share of these products in overall world imports has increased over the period)
UNDERAcHIEvERs(need to recover lost ground from competing suppliers and increase exports)
AAGR of India’s exports of these products is < AAGRs of world imports of these products(i.e. share of India in these products in the world market has declined over the period)
AAGR of World imports of these products is > AAGR of World’s total imports (i.e. share of these products in overall world imports has increased over the period)
GROWTH IN DEclINING WORlD MARKET
AAGR of India’s exports of these products is > AAGR of world imports of these products(i.e. India’s market share in these products has increased over the period)
AAGR of World imports of these products is < AAGR of World’s total imports (i.e. share of these products in overall world imports has declined over the period)
lOsERs IN DEclINING WORlD MARKET
AAGR of India’s exports of these products is < AAGR of world imports of these products(i.e. India’s market share in these products has declined over the period)
AAGR of World imports of these products is < AAGR of World’s total imports (i.e. share of these products in overall world imports has declined over the period)
Table 14: Product Growth Matrix Description
INFERENcEs:
Following the methodology as outlined in Table 14, a total of 197 products have been shortlisted for categorisation of which 11914 products have been identified (Exhibit 12).
Of these, 41 hi-tech products have
been identified under the category ‘Product Champions’. The world market for these 41 products in
2011 amounted to US$ 415.1 bn while India’s exports aggregated to US$ 2.0 bn.
6 products have been categorised as ‘Underachievers’ implying India has lost out shares in these dynamic products to other competing countries. The world market for these 6 products aggregated to US$ 139.8 bn in 2011 with India’s exports amounting to US$ 842 mn.

52
There are 56 products which have registered ‘Growth in Declining World Markets’. The total world market for these products in 2011 amounted to US$ 777.3 bn with India’s exports aggregating to US$ 9.1 bn.
Finally, the last quadrant includes 16 declining products in which India has lost out market shares. World market for these products amounted to US$ 212.9 bn in 2011 with India’s exports aggregating to US$ 671 mn.
‘Product champions’
41 hi-tech products have been identified as Product Champions.
The constitution of the 41 products identified as Product Champions is illustrated in Table 15. The cumulative value of India’s exports of products under this category amounted to US$ 2.0 bn in 2011. These products have gained share in global import basket during the 2007-2011 period by increasing at a pace higher than total world imports, which averaged 7.4 per cent during this period.
The aggregate value of the top 5 hi-tech export products from India under Product Champions category amounted to US$ 1.3 bn. However, from a global perspective, imports of top 5 items under Product Champions category amounted to US$ 287.3 bn with India’s share in them totalling
Exhibit 12: India’s Hi-Tech Product Growth Matrix: 2011

53
6.1 per cent. The total share of these identified products in world imports in 2011 stood at 69.2 per cent.
Out of 41 identified product champions, there are 5 products where India’s AAGR in exports have increased by triple digits. The combined exports of these increased from just US$ 13 mn in 2007 to US$ 144 mn in 2011. These products include - helicopters, ultra low weight less than equal to 2000 kg (SITC 79211); aircraft launchers etc. parts (SITC 79283); other engines and motors (SITC 71893); vitamin A, etc. unmixed (SITC 54112); and medicaments containing insulin, not put up in measured doses or in forms or packing for retail sale (SITC 54221).
India’s net trade deficit in these 41 products amounted to US$ 2.8 bn in 2011. The top 5 products with the highest trade deficit and where the import-export ratio was also significantly high include digital computers (SITC 7522); other control etc instrument (SITC 87465); microtome; parts of instruments for physical or chemical analysis (SITC 87449); and parts, checking instrument (SITC 87426); and Chromatographs etc. instrument (SITC 87442). These 5 items together contributed to a trade deficit of US$ 2.3 bn out of the total trade deficit of US$ 2.8 bn, of the identified 41 product champions. Given that
the total exports of these 5 products from India aggregated to US$ 168 mn in 2011, it is apparent that India does have manufacturing capabilities of these hi-tech products. Anecdotal evidence would suggest that creating capacities for manufacturing these products could help push India into the big league for export of hi-tech products having maximum potential.
Given the focus needs to be primarily on hi-tech products which figure under the ‘Product Champions’ category, a further analysis of this categorization has been undertaken to identify India’s competitors in the major markets for such products. Within this category, the products considered are based on two approaches – one set includes the top Product Champions in terms of world market in 2011; the second set includes the top Product Champions (exhibiting more than US$ 100 mn exports) in terms of India’s exports in 2011. These have been presented in Tables 16 and 17.
The top 5 products in terms of world import market under the Product Champions (Table 16) category include digital computers (SITC 7522); antisera, etc. vaccines (SITC 54163); other regulating or controlling instruments and apparatus (SITC 87465); electric motors AC (SITC 87465); antibiotics, not put up as medicaments of group 542 (SITC
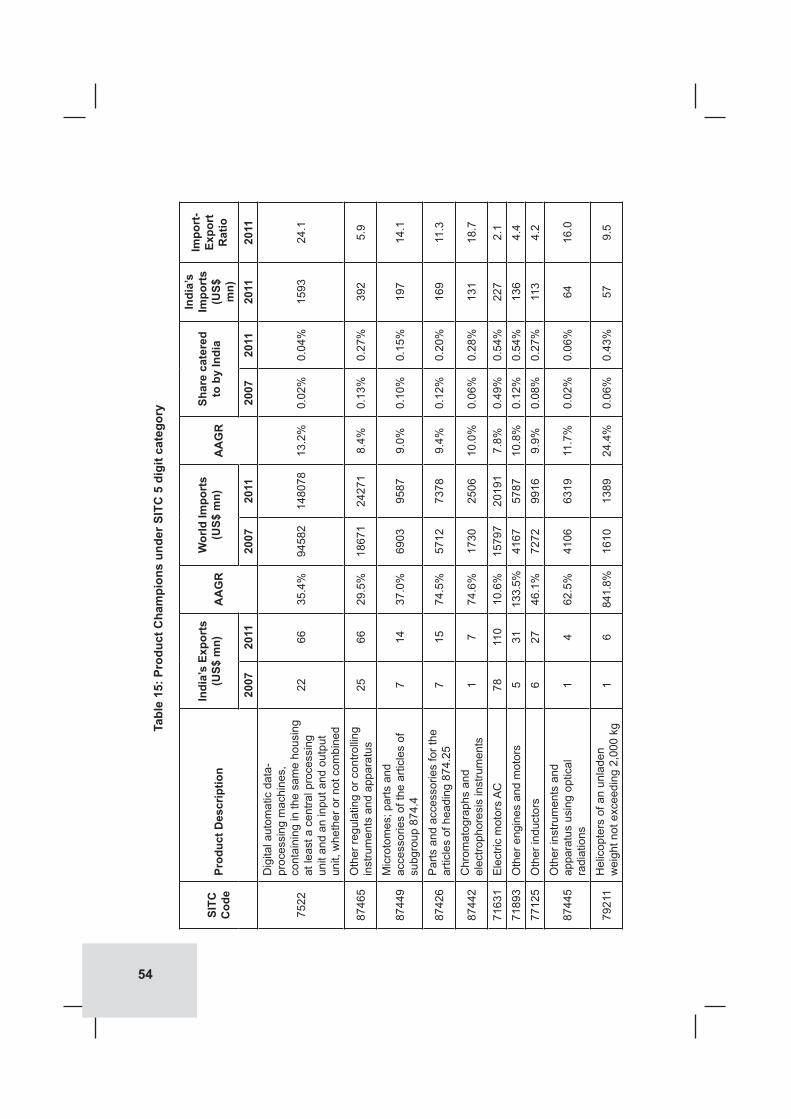
54
sITc
c
ode
Prod
uct D
escr
iptio
nIn
dia’
s Ex
port
s (U
s$ m
n)A
AG
RW
orld
Impo
rts
(Us$
mn)
AA
GR
shar
e ca
tere
d to
by
Indi
a
Indi
a’s
Impo
rts
(Us$
m
n)
Impo
rt-
Expo
rt
Rat
io
2007
2011
2007
2011
2007
2011
2011
2011
7522
Dig
ital a
utom
atic
dat
a-pr
oces
sing
mac
hine
s,
cont
aini
ng in
the
sam
e ho
usin
g at
leas
t a c
entra
l pro
cess
ing
unit
and
an in
put a
nd o
utpu
t un
it, w
heth
er o
r not
com
bine
d
2266
35.4
%94
582
1480
7813
.2%
0.02
%0.
04%
1593
24.1
8746
5O
ther
regu
latin
g or
con
trollin
g in
stru
men
ts a
nd a
ppar
atus
2566
29.5
%18
671
2427
18.
4%0.
13%
0.27
%39
25.
9
8744
9M
icro
tom
es; p
arts
and
ac
cess
orie
s of
the
artic
les
of
subg
roup
874
.47
1437
.0%
6903
9587
9.0%
0.10
%0.
15%
197
14.1
8742
6Pa
rts a
nd a
cces
sorie
s fo
r the
ar
ticle
s of
hea
ding
874
.25
715
74.5
%57
1273
789.
4%0.
12%
0.20
%16
911
.3
8744
2C
hrom
atog
raph
s an
d el
ectro
phor
esis
inst
rum
ents
17
74.6
%17
3025
0610
.0%
0.06
%0.
28%
131
18.7
7163
1El
ectri
c m
otor
s AC
7811
010
.6%
1579
720
191
7.8%
0.49
%0.
54%
227
2.1
7189
3O
ther
eng
ines
and
mot
ors
531
133.
5%41
6757
8710
.8%
0.12
%0.
54%
136
4.4
7712
5O
ther
indu
ctor
s6
2746
.1%
7272
9916
9.9%
0.08
%0.
27%
113
4.2
8744
5O
ther
inst
rum
ents
and
ap
para
tus
usin
g op
tical
ra
diat
ions
1
462
.5%
4106
6319
11.7
%0.
02%
0.06
%64
16.0
7921
1H
elic
opte
rs o
f an
unla
den
wei
ght n
ot e
xcee
ding
2,0
00 k
g1
684
1.8%
1610
1389
24.4
%0.
06%
0.43
%57
9.5
Tabl
e 15
: Pro
duct
cha
mpi
ons
unde
r sIT
c 5
dig
it ca
tego
ry

55
5415
9O
th.h
orm
one.
etc.
ex.g
r542
815
17.9
%33
0148
7013
.0%
0.24
%0.
31%
604.
0
8744
1G
as o
r sm
oke
anal
ysis
ap
para
tus
36
47.9
%24
1933
079.
0%0.
12%
0.18
%51
8.5
7768
8Pa
rts, d
iode
s et
c. c
ryst
al9
1020
.1%
5635
9909
16.9
%0.
16%
0.10
%54
5.4
8747
7O
ther
inst
rum
ents
and
ap
para
tus,
spe
cial
ly d
esig
ned
for t
elec
om2
1076
.1%
3348
5054
14.0
%0.
06%
0.20
%51
5.1
7763
5Th
yris
tors
, dia
cs a
nd tr
iacs
(e
xclu
ding
pho
tose
nsiti
ve
devi
ces)
12
66.7
%11
7915
207.
4%0.
08%
0.13
%43
21.5
5415
1In
sulin
and
its
salts
29
97.5
%83
111
8513
.6%
0.24
%0.
76%
485.
387
131
Non
-opt
ical
mic
rosc
opes
12
37.5
%88
413
6713
.9%
0.11
%0.
15%
3316
.5
8743
5In
stru
men
ts a
nd a
ppar
atus
fo
r mea
surin
g or
che
ckin
g th
e pr
essu
re o
f liq
uids
or g
ases
.10
1715
.2%
4721
5976
7.7%
0.21
%0.
28%
442.
6
8745
5H
ydro
met
ers,
bar
omet
ers
etc
46
13.8
%24
9132
697.
6%0.
16%
0.18
%32
5.3
5413
3Te
tracy
clin
es &
thei
r der
ivat
ives
; sa
lts th
ereo
f1
237
.5%
438
662
11.6
%0.
23%
0.30
%28
14.0
5416
3An
tiser
a an
d ot
her b
lood
fra
ctio
ns; v
acci
nes
152
375
69.4
%47
375
8059
714
.2%
0.32
%0.
47%
394
1.1
5414
1Al
kalo
ids
of o
pium
and
thei
r de
rivat
ives
; sal
ts th
ereo
f7
1384
.5%
351
589
14.0
%1.
99%
2.21
%32
2.5
8747
3C
atho
de-ra
y os
cillo
scop
es a
nd
cath
ode-
ray
osci
llogr
aphs
12
25.0
%63
286
211
.8%
0.16
%0.
23%
199.
5
sITc
c
ode
Prod
uct D
escr
iptio
nIn
dia’
s Ex
port
s (U
s$ m
n)A
AG
RW
orld
Impo
rts
(Us$
mn)
AA
GR
shar
e ca
tere
d to
by
Indi
a
Indi
a’s
Impo
rts
(Us$
m
n)
Impo
rt-
Expo
rt
Rat
io
2007
2011
2007
2011
2007
2011
2011
2011

56
sITc
c
ode
Prod
uct D
escr
iptio
nIn
dia’
s Ex
port
s (U
s$ m
n)A
AG
RW
orld
Impo
rts
(Us$
mn)
AA
GR
shar
e ca
tere
d to
by
Indi
a
Indi
a’s
Impo
rts
(Us$
m
n)
Impo
rt-
Expo
rt
Rat
io
2007
2011
2007
2011
2007
2011
2011
2011
5422
3M
edic
amen
ts c
onta
inin
g in
sulin
, pu
t up
in m
easu
red
dose
s or
in
form
s or
pac
king
s fo
r ret
ail s
ale
4086
25.0
%58
4988
7211
.0%
0.68
%0.
97%
981.
1
8745
6Pa
rts, h
ydro
met
ers,
etc
.2
316
.7%
681
1024
12.2
%0.
29%
0.29
%13
4.3
7189
1Li
near
-act
ing
hydr
aulic
pow
er
engi
nes
and
mot
ors
(cyl
inde
rs)
35
52.1
%30
0144
8213
.8%
0.10
%0.
11%
132.
6
5411
2Vi
tam
ins
A &
thei
r der
ivat
ives
, un
mix
ed2
412
6.8%
412
546
8.4%
0.49
%0.
73%
102.
5
7181
9Pa
rts, i
nclu
ding
regu
lato
rs, o
f hy
drau
lic tu
rbin
es a
nd w
ater
-w
heel
s4
3484
.1%
695
1164
14.6
%0.
58%
2.92
%36
1.1
5416
4
Hum
an b
lood
; ani
mal
blo
od
prep
ared
for t
hera
peut
ic,
prop
hyla
ctic
or d
iagn
ostic
us
es; t
oxin
s, c
ultu
res
of m
icro
-or
gani
sms
(exc
ludi
ng y
east
s)
and
sim
ilar p
rodu
cts
930
39.8
%33
9589
8428
.7%
0.27
%0.
33%
301.
0
7181
1H
ydra
ulic
turb
ines
and
wat
er-
whe
els
24
24.2
%37
743
69.
9%0.
53%
0.92
%4
1.0
5422
4
Med
icam
ents
con
tain
ing
insu
lin,
not p
ut u
p in
mea
sure
d do
ses
or in
form
s or
pac
king
s fo
r ret
ail
sale
15
66.7
%39
6868
5515
.5%
0.03
%0.
07%
20.
4
7929
1Pr
opel
lers
& ro
tors
& p
arts
th
ereo
f2
660
.4%
853
1092
8.8%
0.23
%0.
55%
20.
3

57
sITc
c
ode
Prod
uct D
escr
iptio
nIn
dia’
s Ex
port
s (U
s$ m
n)A
AG
RW
orld
Impo
rts
(Us$
mn)
AA
GR
shar
e ca
tere
d to
by
Indi
a
Indi
a’s
Impo
rts
(Us$
m
n)
Impo
rt-
Expo
rt
Rat
io
2007
2011
2007
2011
2007
2011
2011
2011
5411
7
Inte
rmix
ture
s of
pro
vita
min
s &
vita
min
s (in
clud
ing
natu
ral
conc
entra
tes)
, whe
ther
/not
in
any
solv
ent
214
75.8
%52
775
49.
7%0.
38%
1.86
%4
0.3
5414
2Al
kalo
ids
of c
inch
ona
and
thei
r de
rivat
ives
; sal
ts th
ereo
f9
1848
.6%
3677
22.8
%25
.00%
23.3
8%8
0.4
8919
1Pa
rts &
acc
esso
ries
of re
volv
ers
214
84.2
%93
168
18.9
%2.
15%
8.33
%0
0.0
5414
7N
icot
ine
and
its s
alts
1154
57.8
%84
476
144
.6%
1.30
%7.
10%
120.
254
199
Oth
er p
harm
aceu
tical
goo
ds38
8121
.1%
6012
8640
9.7%
0.63
%0.
94%
360.
4
7928
3
Airc
raft
laun
chin
g ge
ar; d
eck-
arre
stor
or s
imila
r gea
r; gr
ound
fly
ing
train
ers;
par
ts o
f the
fo
rego
ing
198
592.
5%10
0411
958.
6%0.
10%
8.20
%36
0.4
5411
6O
ther
vita
min
s an
d th
eir
deriv
ativ
es, u
nmix
ed36
8026
.4%
944
1225
7.8%
3.81
%6.
53%
130.
2
5413
9O
ther
ant
ibio
tics
228
673
31.9
%90
0314
202
12.5
%2.
53%
4.74
%58
90.
9
5422
1M
edic
amen
ts c
onta
inin
g in
sulin
, no
t put
up
in m
easu
red
dose
s/in
fo
rms/
pack
ings
for r
etai
l sal
e.4
511
6.7%
7268
8.7%
5.56
%7.
35%
TO
TAl
PRO
DU
cT
cH
AM
PIO
Ns
750
2029
27
1921
4151
34
4875
2
.4
Sour
ce: D
ata
deriv
ed fr
om P
C-T
AS, U
N C
omtra
de; E
XIM
Ban
k R
esea
rch

58
Tabl
e 16
: The
Top
Glo
bal I
mpo
rter
s un
der ‘
Prod
uct c
ham
pion
’ cat
egor
y an
d th
eir M
ajor
sup
plie
rs
sITc
Prod
uct
Impo
rter
sva
lue
(Us$
mn)
Maj
or s
uppl
ier c
ount
ries
with
Who
m In
dia
com
pete
s fo
r M
arke
t sha
re20
0720
11
7522
D
igita
l Com
pute
rs
USA
2823
945
786
Chi
na, M
exic
o, T
aiw
an, S
outh
Kor
ea, J
apan
, Mal
aysi
a
Ger
man
y95
1697
88C
hina
, Cze
ch R
ep, I
rela
nd, U
SA, J
apan
, Net
herla
nds
Net
herla
nds
4159
8637
Chi
na, G
erm
any,
Bel
gium
, Ire
land
, Sin
gapo
re, M
alay
sia
Japa
n41
0584
51C
hina
, Sou
th K
orea
, USA
, Tai
wan
, Ind
ones
ia, G
erm
any
Uni
ted
King
dom
5678
6289
Chi
na, N
ethe
rland
s, G
erm
any,
USA
, Jap
an, S
inga
pore
WO
RlD
9458
214
8078
5416
3
Antis
era,
etc
., va
c-ci
nes
Ger
man
y94
2816
567
USA
, Net
herla
nds,
Sw
itzer
land
, Bel
gium
, Ire
land
, Aus
tria
USA
4912
6537
Switz
erla
nd, B
elgi
um, D
enm
ark,
Ger
man
y, C
anad
a, It
aly
Belg
ium
2637
6292
Sing
apor
e, Ir
elan
d, F
ranc
e, U
SA, S
witz
erla
nd, G
erm
any
Uni
ted
King
dom
2777
5405
USA
, Net
herla
nds,
Ger
man
y, B
elgi
um, S
witz
erla
nd, I
rela
nd
Switz
erla
nd36
0252
80U
SA, G
erm
any,
Ital
y, B
elgi
um, J
apan
, Net
herla
nds
WO
RlD
4737
580
597
8746
5
Oth
er re
gula
ting
or
cont
rollin
g in
stru
-m
ents
and
app
arat
us
Chi
na17
4123
66Ja
pan,
Ger
man
y, U
SA, S
outh
Kor
ea, F
ranc
e, F
inla
nd
USA
2985
2553
Mex
ico,
Ger
man
y, J
apan
, Can
ada,
UK,
Chi
na
Ger
man
y17
8818
02H
unga
ry, F
ranc
e, U
SA, U
K, S
pain
, Phi
lippi
nes
Fran
ce
803
972
Ger
man
y, H
unga
ry, U
SA, P
olan
d, S
pain
, UK
Can
ada
1119
982
USA
, Mex
ico,
Jap
an, G
erm
any,
Chi
na, S
wed
en
WO
RlD
1867
124
271

59
7163
1El
ectri
c m
otor
s AC
USA
2946
3173
Mex
ico,
Chi
na, B
razi
l, G
erm
any,
Jap
an, T
aiw
an
Ger
man
y15
6717
83Fr
ance
, Ita
ly, C
zech
Rep
ublic
, Chi
na, F
inla
nd, A
ustri
a
Chi
na96
912
34G
erm
any,
Jap
an, U
SA, C
anad
a, U
K
Italy
1008
1113
Ger
man
y, C
hina
, Cze
ch R
epub
lic, F
ranc
e, P
olan
d, H
unga
ry
Fran
ce48
956
6G
erm
any,
Ital
y, C
hina
, Tun
isia
, Hun
gary
, Fin
land
WO
RLD
1579
720
191
5413
9An
tibio
tics,
not
put
up
as m
edic
amen
ts o
f gr
oup
542
Pana
ma
1033
7Si
ngap
ore,
USA
, Cos
ta R
ica
Italy
1721
1489
Switz
erla
nd, I
rela
nd, B
elgi
um, N
ethe
rland
s, C
hina
, UK
Ger
man
y83
573
8Sw
itzer
land
, Chi
na, F
ranc
e, It
aly,
Aus
tria
USA
715
936
Switz
erla
nd, C
hina
, Ita
ly, D
enm
ark,
Cro
atia
Fran
ce29
331
6U
SA, C
hina
, Ire
land
, Jap
an, I
taly,
Net
herla
nds
WO
RlD
9003
1420
2
7712
5 O
ther
indu
ctor
s
Chi
na17
3018
71Ja
pan,
Tai
wan
, Phi
lippi
nes,
Sou
th K
orea
, Vie
tnam
Hon
g Ko
ng88
396
9C
hina
, Jap
an, P
hilip
pine
s, U
SA, V
ietn
am, S
inga
pore
Ger
man
y52
056
2C
hina
, Cze
ch R
epub
lic, J
apan
, Pol
and,
Tun
isia
, Hun
gary
USA
458
446
Chi
na, M
exic
o, J
apan
, Can
ada,
Ger
man
y, M
alay
sia
Japa
n39
241
1C
hina
, Phi
lippi
nes,
Vie
tnam
, Tha
iland
, Mal
aysi
a, U
SAW
OR
lD72
7299
16
sITc
Prod
uct
Impo
rter
sva
lue
(Us$
mn)
Maj
or s
uppl
ier c
ount
ries
with
Who
m In
dia
com
pete
s fo
r M
arke
t sha
re20
0720
11
Sour
ce: D
ata
deriv
ed fr
om P
C-T
AS, U
N C
omtra
de; E
XIM
Ban
k R
esea
rch

60
54139); and other inductors (SITC 77125). Together, the world import market for these products amounted to US$ 297 bn in 2011. The major importers of these products in 2011 included USA, China, and Germany. China, Germany, USA, Switzerland and Japan were the major supplying countries. Other major exporters for these products included 3 Asian countries, viz. Malaysia, Singapore, South Korea and Taiwan.
In terms of India’s top exports under the Product Champion category, the products include, antibiotics, not put up as medicaments (SITC 54139); antisera, etc., vaccines (SITC 54163); and electric motors, AC (SITC 71631). Cumulative exports of these products in 2011 aggregated to US$ 1.16 bn out of the total exports of US$ 2.0 bn under this category. The major markets for India for these products include both developed and developing countries, although India’s competitors in its major markets are largely developed countries, with only China being a notable exception (apart from Malaysia and Mexico in a select few countries). In some of the key markets India has made significant inroads – like UK, Turkey, and China for Antibiotics, not put up as medicaments (SITC 54139), and Tanzania, and Kenya, for Antisera, etc., vaccines (SITC 54163) (Table 17).
‘Underachievers’
In the Underachievers category, 6 hi-tech export products have been identified (Table 18). The cumulative value of India’s exports of products under this category declined from US$ 916 mn in 2007 to US$ 842 mn in 2011. On the other hand, the world import market for these 6 products has nearly doubled from US$ 73.1 bn to US$ 139.8 bn during the same period. For these 6 products, the world market has grown significantly faster than the average (AAGR) for all products during the 2007-2011 periods. Though there has been a significant increase in India’s exports across the 6 identified products [except parts and accessories for the machines and appliances of heading 874.53 (SITC 87454) and other generating sets (SITC 71652) which exhibited declines], but it failed to match the pace of growth of world import demand for these products. Further, for 5 products in this category, India’s imports were higher than exports implying that the country has a trade deficit in these identified products. While manufacturing capabilities exist in India, the fact that the country is importing and that these imports have increased during the 2007-2011 period is indicative of shortage of manufacturing capacities within the domestic shores.

61
Tabl
e 17
: Ind
ia’s
Top
Exp
orts
und
er ‘P
rodu
ct c
ham
pion
’ cat
egor
y, K
ey D
estin
atio
ns a
nd c
ompe
titor
s
Sour
ce: D
ata
deriv
ed fr
om P
C-T
AS, U
N C
omtra
de; E
XIM
Ban
k R
esea
rch
sITc
PRO
DU
cT
NA
ME
EXPO
RT
DEs
TIN
ATIO
N
(Us$
mn)
IMPO
RT
FRO
M
WO
RlD
(Us$
mn)
IND
IA’s
sH
AR
EIN
IMPO
RTs
MA
JOR
EXP
OR
TER
s TO
IND
IA’s
KEy
M
AR
KET
s / I
ND
IA’s
cO
MPE
TITO
Rs
IN T
HE
MA
RK
ETs
5413
9An
tibio
tics,
Not
Put
U
p As
Med
icam
ents
WO
RlD
670
1411
14.
7C
hina
6243
714
.2Ire
land
, Jap
an, I
ndia
, Ita
ly, S
witz
erla
ndTu
rkey
4718
126
.0In
dia,
Chi
na, I
taly,
Sou
th K
orea
, Spa
in, D
enm
ark
USA
4791
25.
2Sw
itzer
land
, Chi
na, I
taly,
Indi
a, D
enm
ark
Italy
3016
581.
8Sw
itzer
land
, Ire
land
, Bel
gium
, Net
herla
nds,
C
hina
UK
2917
816
.3U
SA, I
ndia
, Net
herla
nds,
Chi
na, G
erm
any
5416
3An
tiser
a, e
tc.,
vacc
ines
WO
RlD
364
8048
50.
5N
iger
ia34
NA
NA
Chi
na, G
erm
any,
Phi
lippi
nes,
S. K
orea
, Tai
wan
Con
go17
NA
NA
Chi
na, G
erm
any,
Spa
in, N
ethe
rland
s, T
aiw
anTa
nzan
ia16
30.9
51.8
Chi
na, M
alay
sia,
Tai
wan
, Jap
an, U
SAKe
nya
1534
44.1
Chi
na, G
erm
any,
Tai
wan
, Bel
gium
, Aus
tria
Philip
pine
s14
123
13.8
Chi
na, S
inga
pore
, Jap
an, M
alay
sia,
Tai
wan
WO
RlD
110
2019
10.
01U
SA35
3549
0.01
Mex
ico,
Chi
na, B
razi
l, G
erm
any,
Jap
anSa
udi
Arab
ia22
148
0.15
Ger
man
y, C
hina
, USA
, Ind
ia, M
exic
o, U
K
Bahr
ain
717
0.41
Spai
n, S
outh
Kor
ea, C
hina
, Mex
ico,
Ger
man
yG
erm
any
519
84--
Fran
ce, I
taly,
Cze
ch R
ep.,
Chi
na, F
inla
nd
Elec
tric
mot
ors
AC71
631

62
Tabl
e 18
: ‘U
nder
achi
ever
s’ u
nder
sIT
c 5
dig
it ca
tego
ry
sITc
c
ode
Prod
uct D
escr
iptio
n
Indi
a’s
Expo
rts
(Us$
m
n)A
AG
RW
orld
Impo
rts
(Us$
mn)
AA
GR
shar
e ca
tere
d to
by
Indi
a
Indi
a’s
Impo
rts
(Us$
m
n)
Impo
rt-
Expo
rt
Rat
io
2007
2011
2007
2011
2007
2011
2011
2011
7712
1St
atic
con
verte
rs33
843
710
.3%
3607
351
017
10.6
%0.
9%0.
9%80
51.
8
5416
1
Gly
cosi
des,
nat
ural
or
repr
oduc
ed b
y sy
nthe
sis,
and
th
eir s
alts
, eth
ers
and
othe
r de
rivat
ives
1011
17.3
%43
182
018
.7%
2.3%
1.3%
312.
8
7763
7Ph
otos
ensi
tive
devi
ces
213
328
30.3
%26
021
7329
535
.3%
0.8%
0.4%
1333
4.1
8747
1In
stru
men
ts a
nd a
ppar
atus
for
mea
surin
g or
det
ectin
g io
nizi
ng
radi
atio
ns7
84.
8%73
010
5610
.4%
1.0%
0.8%
81.
0
8745
4Pa
rts a
nd a
cces
sorie
s fo
r the
m
achi
nes
and
appl
ianc
es o
f he
adin
g 87
4.53
53
-7.1
%34
644
68.
0%1.
4%0.
7%9
3.0
7165
2O
ther
gen
erat
ing
sets
343
55-1
8.8%
9476
1321
79.
8%3.
6%0.
4%92
1.7
TO
TAl
UN
DER
Ac
HIE
vER
s91
684
2
7307
713
9851
22
78 2
.7
Sour
ce: D
ata
deriv
ed fr
om P
C-T
AS, U
N C
omtra
de; E
XIM
Ban
k R
esea
rch

63
‘Growth in Declining World Market’
56 hi-tech export products have been identified under the category ‘Growth in Declining World Market’ (Table 19). These are products for which import demand has not kept up pace with the world average import demand, although India’s exports have registered growth higher than the growth in world demand. The ironical part is that India’s hi-tech exports (with value of at least US$ 2 million in 2011) during the 2007-2011 period under this category has nearly quadrupled – from US$ 2.6 bn in 2007 to US$ 9.1 bn in 2011. This is an area of concern as it is reflective of the country targeting a wrong set of hi-tech exports, i.e. products whose demand has been going downwards. In fact, the top 5 exported products from India in this category constitute nearly one-third of India’s overall hi-tech exports. These products include, transmission apparatus incorporating reception apparatus (SITC 76432); other parts of aeroplanes or helicopters (SITC 79295); medicaments containing other antibiotics, put up in measured doses
or in forms or packings for retail sale (SITC 54219); Medicaments containing penicillins or derivatives thereof, with a penicillanic acid structure,or streptomycins or their derivatives, put up in measured doses or in forms or packings for retail sale (SITC 54213); and liquid dielectric transformers (SITC 77111).
‘losers in Declining World Market’
16 hi-tech export products have been identified as ‘Losers in Declining World Market’ (Table 20). The export prospects for these products tend to be bleak – world imports of these hi-tech products have increased at a below-average rate, or actually declined, and the market share of India has also remained stagnant. While the overall exports of India under this category decreased marginally, world imports of these identified products witnessed a marginal increase in demand. India needs to diversify its production away from manufacturing these products and focus on other hi-technology segments, especially items under the Product Champions and Underachievers category.

64
sITc
c
ode
Prod
uct D
escr
iptio
nIn
dia’
s Ex
port
s (U
s$ m
n)A
AG
RW
orld
Impo
rts
(Us$
mn)
AA
GR
shar
e ca
tere
d to
by
Indi
a
Indi
a’s
Impo
rts
(Us$
m
n)
Impo
rt-Ex
port
R
atio
2007
2011
2007
2011
2007
2011
2011
2011
8911
1
Tank
s an
d ot
her a
rmou
red
fight
ing
vehi
cles
, mot
oriz
ed, w
heth
er o
r not
fit
ted
with
wea
pons
, an
d pa
rts o
f su
ch v
ehic
les
148
1947
.1%
2046
2174
2.9%
0.0%
2.2%
00.
0
8719
3O
ther
opt
ical
dev
ices
, ap
plia
nces
an
d in
stru
men
ts1
455
0.2%
6195
165
697
3.5%
0.0%
0.0%
272
68.0
7643
2Tr
ansm
issi
on a
ppar
atus
inco
rpor
at-
ing
rece
ptio
n ap
para
tus
115
3277
496.
6%14
1311
1802
687.
1%0.
1%1.
8%58
751.
8
8747
9Pa
rts a
nd a
cces
sorie
s fo
r the
inst
ru-
men
ts a
nd a
ppar
atus
of s
ubgr
oup
874.
75
2014
4.0%
4926
5497
5.9%
0.1%
0.4%
582.
9
7526
Inpu
t or
outp
ut u
nits
for
auto
mat
ic
data
-pro
cess
ing
mac
hine
s, w
heth
er
or n
ot p
rese
nted
with
the
rest
of a
sy
stem
and
whe
ther
or
not
con-
tain
ing
stor
age
units
in t
he s
ame
hous
ing
1218
125.
9%41
227
3142
1-5
.1%
0.0%
0.1%
729
40.5
5414
3C
affe
ine
and
its s
alts
331
131.
9%18
522
95.
5%1.
6%13
.5%
20.
176
411
Tele
phon
e se
ts17
203
100.
8%11
142
8008
-7.0
%0.
2%2.
5%99
0.5
7523
Dig
ital p
roce
ssin
g un
its,
whe
ther
or
not
pre
sent
ed w
ith th
e re
st o
f a
syst
em, w
hich
may
con
tain
in th
e sa
me
hous
ing
one
or tw
o of
the
fol-
low
ing
type
s of
uni
t: st
orag
e un
its,
inpu
t uni
ts, o
utpu
t uni
ts
1310
710
2.5%
5564
562
081
3.6%
0.0%
0.2%
683
6.4
Tabl
e 19
: ‘G
row
th in
Dec
linin
g M
arke
ts’ u
nder
sIT
c 5
dig
it ca
tego
ry

65
7741
1El
ectro
card
iogr
aphs
39
99.2
%62
168
93.
3%0.
5%1.
3%3
0.3
8811
1Ph
otog
raph
ic (o
ther
than
cin
emat
o-gr
aphi
c) c
amer
as1
475
.0%
1648
690
-18.
4%0.
1%0.
6%24
6.0
7929
5O
ther
par
ts o
f aer
opla
nes
or h
eli-
copt
ers
289
1838
92.4
%49
364
5298
32.
0%0.
6%3.
5%88
00.
5
8744
3Sp
ectro
met
ers,
spec
troph
otom
eter
s an
d sp
ectro
grap
hs u
sing
opt
ical
ra-
diat
ions
(UV,
vis
ible
, IR
)1
587
.9%
2831
3242
4.3%
0.0%
0.2%
115
23.0
7599
5
Parts
and
acc
esso
ries
(oth
er th
an
cove
rs,
carr
ying
cas
es a
nd t
he
like)
sui
tabl
e fo
r us
e so
lely
or
prin
cipa
lly w
ith t
he m
achi
nes
of
subg
roup
751
.2
46
77.3
%22
8419
00-3
.5%
0.2%
0.3%
71.
2
5415
3Ad
rena
l cor
tical
hor
mon
es a
nd th
eir
deriv
ativ
es5
4277
.1%
3520
3995
3.9%
0.1%
1.1%
641.
5
7763
1D
iode
s, o
ther
tha
n ph
otos
ensi
tive
or li
ght-e
mitt
ing
diod
es1
570
.8%
9834
1129
05.
2%0.
0%0.
0%15
731
.4
7712
3B
alla
sts
for
disc
harg
e la
mps
or
tube
s9
4568
.9%
3661
3878
3.9%
0.2%
1.2%
360.
8
5421
1
Med
icam
ents
con
tain
ing
peni
cil-
lins
or d
eriv
ativ
es t
here
of,
with
a
peni
cilla
nic
acid
stru
ctur
e,or
stre
p-to
myc
ins
or th
eir d
eriv
ativ
es, n
ot p
ut
up in
mea
sure
d do
ses
or in
form
s or
pac
king
s fo
r ret
ail s
ale
1643
40.3
%16
3417
2-2
4.2%
1.0%
25.0
%3
0.1
sITc
c
ode
Prod
uct D
escr
iptio
nIn
dia’
s Ex
port
s (U
s$ m
n)A
AG
RW
orld
Impo
rts
(Us$
mn)
AA
GR
shar
e ca
tere
d to
by
Indi
a
Indi
a’s
Impo
rts
(Us$
m
n)
Impo
rt-Ex
port
R
atio
2007
2011
2007
2011
2007
2011
2011
2011

66
sITc
c
ode
Prod
uct D
escr
iptio
nIn
dia’
s Ex
port
s (U
s$ m
n)A
AG
RW
orld
Impo
rts
(Us$
mn)
AA
GR
shar
e ca
tere
d to
by
Indi
a
Indi
a’s
Impo
rts
(Us$
m
n)
Impo
rt-Ex
port
R
atio
2007
2011
2007
2011
2007
2011
2011
2011
8811
5Pa
rts a
nd a
cces
sorie
s fo
r ph
oto-
grap
hic
flash
light
app
arat
us2
961
.3%
353
358
0.9%
0.6%
2.5%
50.
6
8741
3
Sur
veyi
ng (
incl
udin
g ph
otog
ram
-m
etric
al s
urve
ying
), hy
drog
raph
ic,
ocea
nogr
aphi
c, h
ydro
logi
cal,
me-
teor
olog
ical
or
geop
hysi
cal i
nstru
-m
ents
and
app
lianc
es (
excl
udin
g co
mpa
sses
); ra
ngefi
nder
s
2039
63.2
%53
0859
273.
7%0.
4%0.
7%83
2.1
8747
8O
ther
inst
rum
ents
and
app
arat
us
for m
easu
ring
or c
heck
ing
elec
trica
l qu
antit
ies
410
63.0
%88
4782
553.
7%0.
0%0.
1%83
8.3
7768
9Pa
rts o
f th
e ar
ticle
s of
sub
grou
p 77
6.4
513
49.6
%36
391
2462
6-6
.2%
0.0%
0.1%
725.
5
8746
3Pr
essu
re re
gula
tors
and
con
trolle
rs
(man
osta
ts)
12
60.4
%78
787
15.
2%0.
1%0.
2%10
5.0
7599
3
Parts
and
acc
esso
ries
(oth
er th
an
cove
rs,
carr
ying
cas
es a
nd t
he
like)
sui
tabl
e fo
r us
e so
lely
or
prin
cipa
lly w
ith t
he m
achi
nes
of
subg
roup
751
.9
3112
154
.1%
2926
3027
1.9%
1.1%
4.0%
690.
6
5414
5 T
heop
hylli
ne a
nd a
min
ophy
lline
(th
eoph
yllin
e-et
hyle
nedi
amin
e) a
nd
thei
r der
ivat
ives
; sal
ts th
ereo
f1
350
.0%
8584
-0.1
%1.
2%3.
6%13
4.3
7165
1
Elec
tric
gene
ratin
g se
ts w
ith c
om-
pres
sion
-igni
tion
inte
rnal
com
bus-
tion
pist
on e
ngin
es (d
iese
l or s
emi-
dies
el e
ngin
es)
5313
053
.0%
1019
312
282
7.1%
0.5%
1.1%
890.
7
7768
1Pi
ezoe
lect
ric c
ryst
als,
mou
nted
416
49.4
%61
3372
785.
3%0.
1%0.
2%72
4.5
7642
1M
icro
phon
es a
nd s
tand
s th
eref
or2
550
.0%
1793
2138
5.9%
0.1%
0.2%
153.
0

67
sITc
c
ode
Prod
uct D
escr
iptio
nIn
dia’
s Ex
port
s (U
s$ m
n)A
AG
RW
orld
Impo
rts
(Us$
mn)
AA
GR
shar
e ca
tere
d to
by
Indi
a
Indi
a’s
Impo
rts
(Us$
m
n)
Impo
rt-Ex
port
R
atio
2007
2011
2007
2011
2007
2011
2011
2011
7648
3R
adar
app
arat
us, r
adio
nav
igat
iona
l ai
d ap
para
tus
and
radi
o re
mot
e co
ntro
l app
arat
us3
945
.7%
1626
217
253
1.9%
0.0%
0.1%
404.
4
7711
9O
ther
ele
ctric
al tr
ansf
orm
ers
2366
44.1
%91
9810
052
3.4%
0.3%
0.7%
137
2.1
8714
9P
arts
And
Acc
esso
ries
Of
Com
-po
und
Opt
ical
Mic
rosc
opes
.1
237
.5%
696
656
-0.2
%0.
1%0.
3%7
3.5
8746
1Th
erm
osta
ts2
741
.7%
3048
3482
4.3%
0.1%
0.2%
213.
0
7642
3 L
ouds
peak
ers,
not
mou
nted
in th
eir
encl
osur
es10
2234
.9%
4572
4907
2.7%
0.2%
0.4%
189
8.6
7762
9Pa
rts o
f th
e tu
bes
and
valv
es o
f su
bgro
ups
776.
1 an
d 77
6.2
32
8.3%
856
372
-18.
1%0.
4%0.
5%33
16.5
8743
7O
ther
inst
rum
ents
and
app
arat
us
for m
easu
ring
liqui
ds o
r gas
es7
1930
.1%
2244
2467
3.7%
0.3%
0.8%
291.
5
8743
9Pa
rts a
nd a
cces
sorie
s fo
r th
e ar
-tic
les
of s
ubgr
oup
874.
39
2733
.2%
3370
4170
7.2%
0.3%
0.6%
511.
9
7642
6El
ectri
c so
und
ampl
ifier
set
s3
421
.2%
1112
879
-4.7
%0.
3%0.
5%11
2.8
7761
1Te
levi
sion
pic
ture
tub
es,
cath
ode-
ray
(incl
udin
g vi
deo
mon
itor
cath
-od
e-ra
y tu
bes)
, col
our
72
1.2%
2723
755
-23.
9%0.
3%0.
3%19
296
.0
5429
2
Med
icam
ents
con
tain
ing
vita
min
s or
ot
her
prod
ucts
of s
ubgr
oup
541.
1,
put
up i
n m
easu
red
dose
s or
in
form
s or
pac
king
s fo
r ret
ail s
ale
150
274
26.9
%36
3038
752.
6%4.
1%7.
1%9
0.0

68
sITc
c
ode
Prod
uct D
escr
iptio
nIn
dia’
s Ex
port
s (U
s$ m
n)A
AG
RW
orld
Impo
rts
(Us$
mn)
AA
GR
shar
e ca
tere
d to
by
Indi
a
Indi
a’s
Impo
rts
(Us$
m
n)
Impo
rt-Ex
port
R
atio
2007
2011
2007
2011
2007
2011
2011
2011
5414
4Ep
hedr
ines
and
thei
r sal
ts22
2912
.0%
182
86-1
1.8%
33.7
%1
0.0
7163
2G
ener
ator
s, a
ltern
atin
g cu
rrent
2559
27.9
%42
4449
415.
7%0.
6%1.
2%39
0.7
5421
3
Med
icam
ents
con
tain
ing
peni
cil-
lins
or d
eriv
ativ
es t
here
of,
with
a
peni
cilla
nic
acid
stru
ctur
e, o
r stre
p-to
myc
ins
or t
heir
deriv
ativ
es,
put
up in
mea
sure
d do
ses
or in
form
s or
pac
king
s fo
r ret
ail s
ale
206
376
19.4
%33
4832
00-1
.0%
6.2%
11.8
%16
80.
4
8742
2
Dra
fting
tab
les
and
mac
hine
s,
whe
ther
or n
ot a
utom
atic
, and
oth
er
draw
ing,
mar
king
-out
or m
athe
mat
i-ca
l cal
cula
ting
inst
rum
ents
23
18.8
%35
933
70.
1%0.
6%0.
9%3
1.0
7649
2
Parts
and
acc
esso
ries
suita
ble
for
use
sole
ly o
r pr
inci
pally
with
the
ap
para
tus
and
equi
pmen
t of
sub
-gr
oup
764.
2
1120
17.8
%26
4324
20-0
.5%
0.4%
0.8%
291.
5
5422
2
Med
icam
ents
con
tain
ing
othe
r ho
rmon
es o
r oth
er p
rodu
cts
of s
ub-
grou
p 54
1.5,
not
put
up
in m
easu
red
dose
s or
in f
orm
s or
pac
king
s fo
r re
tail
sale
188
196
7.2%
898
373
-9.9
%52
.5%
80.
0
8743
1In
stru
men
ts a
nd a
ppar
atus
for
m
easu
ring
or c
heck
ing
the
flow
or
leve
l of l
iqui
ds19
3822
.9%
3621
4626
7.4%
0.5%
0.8%
731.
9
8741
4Pa
rts a
nd a
cces
sorie
s fo
r th
e ar
-tic
les
of h
eadi
ng 8
74.1
315
2618
.5%
2625
2768
3.2%
0.6%
0.9%
351.
3

69
sITc
c
ode
Prod
uct D
escr
iptio
nIn
dia’
s Ex
port
s (U
s$ m
n)A
AG
RW
orld
Impo
rts
(Us$
mn)
AA
GR
shar
e ca
tere
d to
by
Indi
a
Indi
a’s
Impo
rts
(Us$
m
n)
Impo
rt-Ex
port
R
atio
2007
2011
2007
2011
2007
2011
2011
2011
7741
2
Oth
er e
lect
rodi
agno
stic
app
arat
us
(incl
udin
g ap
para
tus
for
func
tiona
l ex
plor
ator
y ex
amin
atio
n or
for
ch
ecki
ng p
hysi
olog
ical
par
am-
eter
s)
6512
922
.0%
1373
117
583
6.7%
0.5%
0.7%
311
2.4
5422
9
Med
icam
ents
con
tain
ing
othe
r ho
rmon
es o
r ot
her
prod
ucts
of
subg
roup
541
.5, p
ut u
p in
mea
sure
d do
ses
or in
for
ms
or p
acki
ngs
for
reta
il sa
le
3467
19.3
%15
493
1913
45.
6%0.
2%0.
4%46
0.7
5421
9M
edic
amen
ts c
onta
inin
g ot
her a
nti-
biot
ics,
put
up
in m
easu
red
dose
s or
in
form
s or
pac
king
s fo
r ret
ail s
ale
570
872
18.0
%12
669
1508
44.
5%4.
5%5.
8%20
0.0
7742
1
App
arat
us b
ased
on
the
use
of
X-ra
ys, w
heth
er o
r not
for m
edic
al,
surg
ical
, den
tal o
r ve
terin
ary
uses
(in
clud
ing
radi
ogra
phy
or r
adio
-th
erap
y ap
para
tus)
6498
18.9
%94
3611
510
5.7%
0.7%
0.9%
201
2.1
7599
7
Parts
and
acc
esso
ries
(oth
er th
an
cove
rs, c
arry
ing
case
s an
d th
e lik
e)
suita
ble
for u
se s
olel
y or
prin
cipa
lly
with
the
mac
hine
s of
sub
grou
ps
752
123
160
7.4%
1515
3112
1699
-4.4
%0.
1%0.
1%16
9810
.6
7712
9Pa
rts o
f the
ele
ctric
pow
er m
achi
n-er
y of
gro
up 7
7195
163
16.8
%88
2810
589
5.9%
1.1%
1.5%
283
1.7

70
5421
2
Med
icam
ents
con
tain
ing
othe
r an
tibio
tics,
not
put
up
in m
easu
red
dose
s or
in f
orm
s or
pac
king
s fo
r re
tail
sale
9236
-0.4
%12
1379
2-7
.2%
7.6%
4.5%
10.
0
7711
1Li
quid
die
lect
ric tr
ansf
orm
ers
236
337
11.9
%53
9964
876.
1%4.
4%5.
2%93
0.3
5411
3Vi
tam
ins
B an
d th
eir
deriv
ativ
es,
unm
ixed
99
0.3%
1330
1076
-3.9
%0.
7%0.
8%40
4.4
8746
9Pa
rts a
nd a
cces
sorie
s fo
r aut
omat
ic
regu
latin
g or
con
trollin
g in
stru
men
ts
and
appa
ratu
s21
299.
9%54
4066
767.
3%0.
4%0.
4%12
64.
3
TO
TAl
GR
OW
TH IN
DEc
lIN
ING
M
AR
KET
s26
3491
34
7573
4777
7309
13
412
1.5
sITc
c
ode
Prod
uct D
escr
iptio
nIn
dia’
s Ex
port
s (U
s$ m
n)A
AG
RW
orld
Impo
rts
(Us$
mn)
AA
GR
shar
e ca
tere
d to
by
Indi
a
Indi
a’s
Impo
rts
(Us$
m
n)
Impo
rt-Ex
port
R
atio
2007
2011
2007
2011
2007
2011
2011
2011
Sour
ce: D
ata
deriv
ed fr
om P
C-T
AS, U
N C
omtra
de; E
XIM
Ban
k R
esea
rch

71
Tabl
e 20
: ‘lo
sers
in D
eclin
ing
Mar
kets
’ und
er s
ITc
5 d
igit
cate
gory
sITc
c
ode
Prod
uct D
escr
iptio
n
Indi
a’s
Expo
rts
(Us$
mn)
AA
GR
Wor
ld Im
port
s (U
s$ m
n)A
AG
R
shar
e ca
-te
red
to b
y In
dia
Indi
a’s
Impo
rts
(Us$
mn)
Im-
port
-Ex
port
R
atio
2007
2011
20
0720
11
2007
2011
2011
2011
7742
9
Oth
er a
ppar
atus
bas
ed o
n th
e us
e of
alp
ha, b
eta
or
gam
ma
radi
atio
ns, w
heth
er
or n
ot fo
r med
ical
, sur
gica
l, de
ntal
or v
eter
inar
y us
es
5136
5.2%
5700
7019
5.6%
0.9%
0.5%
131
3.6
8745
3
Mac
hine
s an
d ap
plia
nces
fo
r tes
ting
the
hard
ness
, st
reng
th, c
ompr
essi
bilit
y,
elas
ticity
or o
ther
mec
hani
-ca
l pro
perti
es o
f mat
eria
ls
(e.g
., m
etal
s, w
ood,
text
iles,
pa
per,
plas
tics)
1416
4.7%
1456
1722
5.9%
1.0%
0.9%
885.
5
8745
2
Inst
rum
ents
, app
arat
us o
r m
odel
s, d
esig
ned
for d
em-
onst
ratio
nal p
urpo
ses
(e.g
., fo
r edu
catio
n or
exh
ibiti
on),
unsu
itabl
e fo
r oth
er u
ses
2327
5.8%
1860
2374
7.1%
1.2%
1.1%
271.
0
7527
Stor
age
units
, whe
ther
or
not p
rese
nted
with
the
rest
of
a s
yste
m10
410
61.
1%72
851
8308
93.
9%0.
1%0.
1%85
68.
1

72
7643
1Tr
ansm
issi
on a
ppar
atus
188
-7.0
%49
2139
74-4
.1%
0.4%
0.2%
131.
6
7649
3
Parts
and
acc
esso
ries
suita
ble
for u
se s
olel
y or
pr
inci
pally
with
the
appa
ra-
tus
and
equi
pmen
t of g
roup
s 76
1 an
d 76
2 an
d su
bgro
ups
764.
3 an
d 76
4.8
193
146
-2.0
%76
066
7622
11.
4%0.
3%0.
2%10
217.
0
5423
2
Med
icam
ents
con
tain
ing
alka
loid
s or
der
ivat
ives
th
ereo
f but
not
con
tain
ing
horm
ones
, oth
er p
rodu
cts
of
subg
roup
541
.5, o
r ant
ibio
t-ic
s - .
put u
p in
mea
sure
d do
ses
or in
form
s or
pac
k-in
gs fo
r ret
ail s
ale
4042
1.4%
4673
5769
5.8%
0.9%
0.7%
20.
0
7642
5Au
dio-
frequ
ency
ele
ctric
am
plifi
ers
1816
-1.9
%24
1925
692.
9%0.
7%0.
6%19
1.2
7763
3
Tran
sist
ors
(exc
ludi
ng p
ho-
tose
nsiti
ve tr
ansi
stor
s) w
ith
a di
ssip
atio
n ra
te o
f one
wat
t or
mor
e
44
2.1%
1173
814
099
7.2%
0.0%
0.0%
192
48.0
8747
5
Oth
er in
stru
men
ts a
nd a
p-pa
ratu
s, fo
r mea
surin
g or
ch
ecki
ng v
olta
ge, c
urre
nt,
resi
stan
ce o
r pow
er, w
ithou
t a
reco
rdin
g de
vice
1612
-2.7
%20
8421
512.
8%0.
8%0.
6%63
5.3
sITc
c
ode
Prod
uct D
escr
iptio
n
Indi
a’s
Expo
rts
(Us$
mn)
AA
GR
Wor
ld Im
port
s (U
s$ m
n)A
AG
R
shar
e ca
-te
red
to b
y In
dia
Indi
a’s
Impo
rts
(Us$
mn)
Im-
port
-Ex
port
R
atio
2007
2011
20
0720
11
2007
2011
2011
2011

73
5413
1Pe
nici
llins
and
thei
r der
iva-
tives
with
a p
enic
illani
c ac
id
stru
ctur
e; s
alts
ther
eof
283
206
-7.6
%20
8319
14-1
.8%
13.6
%10
.8%
273
1.3
8741
1D
irect
ion-
findi
ng c
ompa
ss-
es; o
ther
nav
igat
iona
l ins
tru-
men
ts a
nd a
pplia
nces
63
-4.2
%48
8653
182.
3%0.
1%0.
1%14
4.7
7763
9O
ther
sem
icon
duct
or d
e-vi
ces
2220
-0.2
%28
9832
556.
6%0.
8%0.
6%19
1.0
7599
1
Parts
and
acc
esso
ries
(oth
er
than
cov
ers,
car
ryin
g ca
ses
and
the
like)
sui
tabl
e fo
r us
e so
lely
or p
rinci
pally
with
th
e m
achi
nes
of s
ubgr
oups
75
1.1
93
-12.
5%93
784
0-1
.1%
1.0%
0.4%
41.
3
7742
3X-
ray
tube
s47
24-1
1.0%
1380
1577
3.5%
3.4%
1.5%
200.
8
7742
2
Appa
ratu
s ba
sed
on th
e us
e of
alp
ha, b
eta
or g
amm
a ra
diat
ions
, whe
ther
or n
ot
for m
edic
al, s
urgi
cal,
dent
al
or v
eter
inar
y us
es (i
nclu
ding
ra
diog
raph
y or
radi
othe
rapy
ap
para
tus)
162
-34.
3%78
010
057.
1%2.
1%0.
2%37
18.5
TO
TAl
lOsE
Rs
IN
DEc
lIN
ING
MA
RK
ET86
467
1
1967
3221
2896
27
79
4.1
Sour
ce: D
ata
deriv
ed fr
om P
C-T
AS, U
N C
omtra
de d
atab
ase;
EXI
M B
ank
Res
earc
h
sITc
c
ode
Prod
uct D
escr
iptio
n
Indi
a’s
Expo
rts
(Us$
mn)
AA
GR
Wor
ld Im
port
s (U
s$ m
n)A
AG
R
shar
e ca
-te
red
to b
y In
dia
Indi
a’s
Impo
rts
(Us$
mn)
Im-
port
-Ex
port
R
atio
2007
2011
20
0720
11
2007
2011
2011
2011

74
5. sTRATEGIEs FOR INcREAsING TEcHNOlOGy BAsED EXPORTs
This chapter articulates few strategies in order to enhance India’s export of hi-tech products. Capability and capacity to produce technology oriented items will enhance India’s manufacturing prowess in the international arena and facilitate earning of foreign exchange. Suggested strategies include enhancing capacities in select product lines for which global demand is vibrant. This could be done through both fiscal and financial incentives while at the same time creating an economic environment that attracts investments, particularly FDI, in such hi-tech product lines.
India’s development story, post liberalization, has been one driven by the services sector, with the manufacturing sector playing only a second fiddle, mirrored in its stagnating contribution to the country’s economic output. That this may not be a sustainable developmental model has been taken cognizance of by the government, which has now set a target of 25 per cent contribution by the manufacturing sector to India’s GDP by 2022. Focus on hi-tech manufacturing products, especially in terms of their international competitiveness, needs to be an integral component of achieving this target. An important facet of most hi-tech products is that significant part of these are traded globally as finished goods (i.e. trade
intensity – meaning export as a ratio of gross output – for these are very high), unlike other sectors where international trade is predominantly in intermediate goods (i.e. trade intensity is low). While sectors like automotive and pharmaceuticals are relatively well developed in India from a competitiveness viewpoint, the need therefore, is to also focus on other hi-tech sectors like electronics and technology oriented capital goods, so as to enhance growth in value added exports.
Technology oriented manufacturing not only induces higher returns but also strengthens other forms of industries while creating capabilities to deepen manufacturing. Depth in manufacturing

75
and the technology embedded therein is extremely important for a country to sustain its competitive advantage in a global economy. It is not only important from the point of view of greater value addition, but is also required to attract new industries, while simultaneously maintaining competitive advantage of existing industries. Technological depth also ensures self-reliance in strategically important sectors and ensures a healthy trade balance. Thus, economic growth policy must place more emphasis on increasing multifactor productivity, which is the driver of value-added production. Achieving this goal requires coordinated advances in science, technology, innovation, and diffusion of the same. This strategy requires investments in multiple drivers, technology, education, capital formation, and industry infrastructure.
cAPAcITy ENHANcEMENT
Analysis in the previous chapter revealed 41 hi-tech products which were classified as ‘Product Champions’ and 6 as ‘Underachievers’. In order to give a special thrust to hi-tech exports, the prime objective would be to create avenues which result in enhancing exports of products identified under these categories, and thereby reduce the country’s mounting trade deficit. The cumulative value of India’s
exports of products under the Product Champions category amounted to US$ 2.0 bn (9.5 per cent of total hi-tech exports from India in 2011) while cumulative net trade deficit for the same set of products aggregated to US$ 2.8 bn in 2011. The top 5 products with the highest trade deficit included digital computers (SITC 7522); other control etc instrument (SITC 87465); microtome; parts of instruments for physical or chemical analysis (SITC 87449); and parts, checking instrument (SITC 87426); and chromatographs etc. instrument (SITC 87442). These 5 items together contributed to a trade deficit of US$ 2.3 bn out of the total trade deficit of US$ 2.8 bn of the identified 41 product champions. Given that the total exports of these 5 products from India aggregated to US$ 168 mn in 2011, it is apparent that India does have manufacturing capabilities of these hi-tech products. Anecdotal evidence would suggest that creating capacities for manufacturing these products could help push India into the big league for export of hi-tech products having maximum potential.
In the ‘Underachievers’ category, 6 hi-tech export products have been identified. The cumulative value of India’s exports of products under this category amounted to US$ 842 million in 2011, while the world import market for these 6 products stood at US$ 139.8 bn during the same period. Though for

76
Exhibit 13: strategies for Enhancing Hi-Tech Manufacturing and Exports
Source: EXIM Bank Research

77
these products, the world market has grown significantly faster than the average for all products (in the world) put together during the 2007-2011 period, India seems to be losing out market share to competing countries in these dynamic products. Further, for 5 products in this category, India’s imports were higher than exports resulting in a cumulative trade deficit of US$ 1.4 bn. While manufacturing capabilities exist in India, the fact that the country is importing significant volume and that these imports have increased during the 2007-2011 period is indicative of shortage of manufacturing capacities.
The Government could consider building up capacity in these identified products under Product Champions and Underachievers by creating an enabling environment that promotes investments, especially foreign investments, in these product lines, and businesses and industry may focus on these products to enhance their revenues both by catering to domestic and overseas markets.
sEcTORAl FOcUs: HI-TEcH PRODUcTs
Electronics
The share of hi-tech exports in the electronics sector has increased from 18 per cent in 2007 to 30.1 per cent in
2011, with total exports amounting to US$ 6.3 bn in 2011. At the same time imports of hi-tech electronic items by India have increased from 66.4 per cent in 2007 to 69.9 per cent in 2011. It may however be noted that India’s share in exports of hi-tech electronics to world have witnessed an increase from 0.1 per cent to 0.4 per cent during the analysed period. Given the increasing propensity of India’s exports of hi-tech electronics, and the significant import appetite globally, impetus on increasing production of electronics becomes a win-win situation, both to satiate domestic demand and earn foreign exchange through exports.
While the Government of India already has in place a number of fiscal incentives which envisages enhancing production of electronics, it could also learn from the examples of the successful development of this industry in other countries.
For example, Taiwan fashioned a system that offered incentives to firms that succeeded in raising their productivity or their export levels, and penalised firms that did not achieve such goals by withdrawing the tax credits and other financial incentives. In this way, Taiwan’s leadership maintained a tight focus on policy goals and on performance towards those goals rather than allowing
78
incentive programs to become mere rent-seeking systems. Institutions in Taiwan were fashioned to encourage performance-oriented behaviour. Institutional learning took place, from country to country and within countries, as the institutions created adapted to new circumstances and acquired new experiences.
The key lesson of Taiwan’s success in electronics lies in the way Taiwanese firms managed to integrate themselves into existing value chains, whether as OEM contractors in the early consumer electronics sector, or again as OEM contractors in the IT sector, or as assembly and test houses for integrated circuit (IC) products, and then as wafer foundries offering contract fabrication services to established IC firms. For every step in the industry-building process, Taiwan’s firms developed measures to complement the strategies being pursued by established firms overseas.
India could perhaps follow a similar pattern of inculcating the successful experiences from abroad while creating a niche for itself in the electronics industry.
Capital Goods
Capital Goods are considered as a strategic sector and development of
domestic capabilities is essential from a national self-reliance and security perspective. Capital goods sector has a multiplier effect and has bearing on the growth of the user industries, as it provides critical inputs, i.e., machinery and equipments to the remaining sectors covered under the manufacturing activity.
The sector primarily comprises machinery, nuclear reactors, boilers, electrical, electronic equipments, etc. Although exports of capital goods from India increased from US$ 8.7 bn in 2007 to US$ 14.9 bn in 2011, its share in world exports remained marginal at 0.6 per cent as in 2011. Imports, on the other hand, were at staggering US$ 44.5 bn in 2011, with the country accounting for a share of 2 per cent in world capital goods imports.
Given the huge demand, there is an urgent need to capitalise upon the domestic market and encourage import substitution. Hi-technology oriented capital goods are a huge opportunity for India to focus upon, not just for the domestic market but also to tap the overseas markets. This would entail acquisition of technology know-how, especially from overseas firms through knowledge sharing, joint ventures, acquisitions, and investments, both inward as well as outward.

79
POlIcy INcENTIvEs TO ENcOURAGE PRIvATE sEcTOR INvEsTMENTs AND FDI IN HI-TEcH MANUFAcTURING
One of the major reasons cited for low volume of hi-tech goods production is low greenfield FDI inflows, and l imited focus on R&D by Indian companies. Indian investment in R&D is largely government driven. Indian firms need to be encouraged to invest in R&D which will make them technologically strong while at the same time incentivise their entry into technologically advanced product lines. Corporate sector investment in R&D is less than 1 percent of turnover in India as compared to about 5% in several developed countries. India is ranked at 64th position in global innovation index, with countries like South Korea (ranked 21), Malaysia (32), China (34), South Africa (54) and Thailand (57) being placed well above in global rankings.
Proactive policies are required that incentivise industry efforts to invest in innovation and develop hi-tech products. One important way to achieve this is through financial and fiscal incentives.
Countries such as Japan and South Korea are looking out for alternative investment destinations, instead of China, because of geopolitical
reasons. Since hi-tech manufacturing is also high value added, they are not constrained by logistics and wage rates as compared to low-tech or mid-tech goods. Hence, there has to be a pull factor to attract investments into this sector. Government of India has announced Delhi-Mumbai Industrial Corridor to develop industrialization in the identified corridor. These two factors could be leveraged to encourage investments in these sectors through fiscal and financial incentives. Three such policy mechanisms are outlined below:-
A Special Subvented Financing Package
Countries like Brazil have been providing special financing package under its investment support programme, viz. PSI Programme (Programa BNDES de Sustenção do Investimento) which subsidizes the interest rate of loans from the state development bank, BNDES, to purchase capital goods and support export and technological innovation.
The PSI Program, which began in 2009, has a credit authorization of R$277 bn (approx. US$ 120 bn), of which R$149 bn (approx. US$ 65 bn) had been disbursed as of August 31, 2012. In April 2012, the BNDES PSI Program was extended for another year, up to December

80
2013, with reduced fees, increased loan maturities and maximum levels of borrower contributions as part of the new measures announced by the Brazilian Government to encourage investments and to protect the national industry. An important aspect was the creation of a PSI sub-program – PSI Transforming Projects – aimed at supporting the technological sophistication of the Brazilian industrial sector. The BNDES PSI Transforming Projects would provide lending at significantly low rates of 5% p.a. (about 350 bps lower than the prevailing benchmark Selic rate – equivalent to Indian Repo rate) and with loan terms up to 144 months, to finance investments that create technological and production capacity in knowledge and engineering-intensive sectors. The focus is on the production of goods that are not yet manufactured in Brazil and that may lead to production linkages and gains in productivity and quality.
The Government of India / RBI could also consider setting up a similar credit facility exclusively for investments in hi-tech industries, so as to level the playing field and augment the country’s export competitiveness for such products. Such mechanism, if considered for implementation should provide low cost funds cheaper than the cost of ECB financing, as also
the ECA financing and pave the way for India to either move into hi-tech products which are currently not being manufactured, or enhance their competitiveness in such products where it is competing with other global players. The BNDES model could be studied in detail and adapted in the Indian context so as to draw out the modalities of this proposal including the purpose, scope and coverage.
Tax Incentives for Investments in Hi-Technology Products
By reducing the cost of R&D, fiscal reliefs raise the net present value of prospective research projects. Fiscal measures allow markets – rather than governments – to determine the allocation of R&D investments across sectors, firms and projects.
China presents an interesting case of provider of fiscal incentives to attract investments in hi-tech sectors. Under its Enterprise Income Tax (EIT) Law that took effect in 2008, enterprises qualifying for the High-New Technology Enterprises (HNTE) Status regime are entitled to a preferential EIT rate of 15 per cent, rather than being subject to the normal rate of 25 per cent. The Chinese government provides a list of eight state encouraged industries that are considered in awarding HNTE

81
status, viz. Electronic Information Technology; Biological and New Medical Technology; Aviation and Space Technology; New Materials Technology; New Energy and Energy Conservation Technology; High Technology Service Industry; Resources and Environmental Technology; and Transformation of Traditional Industries through High New Technology. HNTE status needs to be applied for and renewed every 3 years. The criteria and procedures that govern qualification for (and maintenance of) HNTE status are detailed and objective some of which include the following:
At least 30 per cent of the −employees must be technical personnel holding college diplomas or higher degrees. Further, R&D personnel who are included in this highly educated technical personnel base must represent more than 10 per cent of the total workforce.
The ratio of qualifying R&D −expenditure to sales revenues for the three most recent financial years must reach a specified percentage of the total revenues (3 per cent to 6 per cent depending on the amount of revenues of the enterprise).
The ratio of qualifying R&D −expenditure actually carried out in China must be at least 60 per cent of the total qualifying R&D cost for the past three financial years, or for the actual years of operation, if fewer.
Income generated from high-new −tech products and services must be more than 60%of the total revenue of the enterprise.
The reduced rate of 15 per cent also applies to qualified Technology Advanced Service Enterprises in designated cities with over 50 per cent revenue derived from providing qualified technology advanced services outsourced by foreign entities. Qualified activities include development of new technology, new products, and new production techniques. Qualifying expenditures include staff costs, direct costs, supplies, depreciation and amortization, design costs, equipment installation costs, intangible asset amortization, and contracted R&D costs.
India also provides certain fiscal incentives for R&D expenses which is mostly sector neutral. This includes a 100% deduction for R&D expenses (other than land) that satisfy a set of basic criteria, and a super deduction of up to 200 per cent of qualifying R&D

82
expenses and research activities (150 per cent super deduction in the case of China). However, with a focus on promoting hi-tech manufacturing and exports, India could as well take a cue from the Chinese HNTE system and adopt suitable policy incentives. A key mechanism of this policy incentive would be preferential corporate income tax treatment for units manufacturing hi-tech products and meeting certain pre-defined criteria as in the case of the Chinese HNTE.
Financial Support on Capital Expenditure for Investments in Hi-Tech Manufacturing
The Government of India announced a package of incentives in July 2012 for one of the hi-tech sectors, viz. the Electronic System Design and Manufacturing (ESDM) sector within Electronics Manufacturing Clusters (EMC), under the Modified Special Incentive Package Scheme (M-SIPS). The object ive was to increase investments in this sector, while at the same time offset the key infrastructure bottlenecks, high transaction costs and inadequate base of supply chain (components and accessories). This scheme provides for a 25 per cent subsidy on capital investments in new ventures and a 50 per cent grant for
common facilities for units located in an area (viz. EMC), in addition to reimbursement of central taxes and duties. The benefits of M-SIPS are available for a period of 10 years after the initial investment. The Government could consider extending such special incentives for investments across all notified hi-tech manufactured products which would catalyse investments (both domestic and FDI) in hi-tech manufacturing.
The enabling provisions as highlighted above would help promote greenfield FDI inflows into hi-tech manufacturing sector, facilitating technology transfer and capacity development in domestic manufacturing. There would also be spin-off benefits of such package of incentives as outlined above, viz. creation of ancillary segments supplying to the large hi-tech manufacturing units, as was the case in the auto-component sector where larger mother units created a ready demand for development of OEM auto ancillary supplier. While in the short term, there could be a marginal fiscal impact on the government, but over a longer term horizon, this could potentially benefit if the units are profitable through job creation, investments and eventually revenues (through both direct and indirect taxes).

83
clUsTER DEvElOPMENT APPROAcH
Industrial clusters have been proven to be having several advantages in promoting the growth of a particular sector or industry. It is recognized that enterprises can achieve high levels of competitiveness if they work in a cluster environment ensuring complementarities, common facilities, collective activities including collective sourcing and marketing. Since quite a few firms in the hi-tech sector are SMEs, they would also benefit from working in a cluster. For instance, in the capital goods segment, currently there are only a limited number of Common Facility Centres, which can offer heavy and high precision machining services to users on a chargeable basis and are equipped with advanced testing equipments. As a result, a lot of players have to invest independently in testing and machining facilities, raising overall manufacturing costs. Clusters can be useful in such situations by increasing supply chain responsiveness because of manufacturing consolidation near the suppliers. The development and upgrading of clusters is an important agenda for governments, companies, and other stakeholders. In order for India to build a robust technology orientated manufacturing sector, concerted efforts have to be made by the policy makers for nurturing clusters
that can build around the strengths of the eco-system in the cluster.
Financial Assistance to set up World Class Hi-Tech Clusters
The National Manufacturing Policy has proposed the creat ion of massive National Investment and Manufacturing Zones (NIMZ) which are being conceived as industrial greenfield townships to promote world-class manufacturing activities. A critical advantage the NIMZs can deliver is the clustering of small and large manufacturers (essentially customers and suppliers among themselves). Operating in close proximity, these companies will be able to leverage synergies as individual component manufacturers and can come together to build high value goods. NIMZs have the potential to foster a collaborative working model across different players along the value chain. Such an approach helps reduce costs, lead times, achieve economies of scale, exchange technology and gain expertise. In the development of such NIMZ, the Government could prioritise those zones which have been notified for hi-tech manufacturing.
Whi le the set t ing up of NIMZ would be a longer-term option, the Government, in the near-term, could consider broadening the scope of the

84
Electronics Manufacturing Clusters to include select identified hi-tech products thereby driving innovation and developing an entrepreneurial ecosystem. Under the EMC scheme, which supports setting up of both greenfield and brownfield clusters, financial assistance in the form of grants would be provided to a Special Purpose Vehicle (SPV) promoted by private companies, industry associations, financial institutions, R&D institutions, State or Local governments or their agencies and units within the EMC. For Greenfield EMCs, the assistance would be up to 50 per cent of the project cost (subject to a ceiling of ` 50 crore for every 100 acres of land) while for brownfield EMCs, assistance would be up to 75 per cent of the project cost (subject to a ceiling of ` 50 crore). There is a need to expand the scope of the EMC scheme, in toto, to all hi-tech manufacturing clusters. This would help flow of both domestic and global investments for the development of world-class infrastructure specifically targeted towards attracting investments in the hi-tech sector.
Mitigating Financial Bottlenecks: Include Lending to Hi-Tech Clusters as part of Priority Sector
Over the years, the Indian financial system has played a crucial role in terms of directed resource mobilization
in favour of sectors of strategic importance to the country, borne out by various policies, chief among them being Priority Sector Lending. At present, domestic commercial banks are required to achieve a priority sector target of 40 per cent of Adjusted Net Bank Credit15 (ANBC), and the foreign banks are required to achieve 32 per cent of ANBC16. Within the overall priority sector lending target, sub-targets are set for domestic commercial banks to lend a minimum of 18 per cent to agriculture, and 10 per cent to weaker sections. Though Micro and Small Enterprises (MSE) sector is also included under the priority sector for domestic commercial banks there is no sub-target set. Given the Government’s strong focus on hi-tech manufacturing, one of the policy options could be to include lending to notified hi-tech clusters and the units operating therein as a part of the overall priority sector lending. Depending upon the thrust of the Government to make India a key manufacturing hub of hi-tech products, RBI could also consider putting sub-targets for lending to hi-tech industries clusters at 10 per cent of ANBC.
Institutional linkages quintessential for Technology Clusters
Empirical studies across geographies have established the fact that technical universities are an integral component
15 Foreign banks with 20 and above branches 16 Foreign banks with less than 20 branches

85
for building a successful cluster. In India, this causal relationship has been rather non-existent with hardly any concrete intervention of institutes or technical universities in clusters. As against this, in USA, if Stanford University and University of California at Berkeley are disconnected from the Silicon Valley, this region would fast deteriorate as a technology cluster. That would be unlikely in the case of say Indian Institute of Science, Bangalore or Indian Institute of Technology, New Delhi, if removed or shifted from the respective cities – the technology companies present in the nearby clusters would still continue to perform without any significant adverse impact. While the Government does not need to intervene directly, it can surely facilitate policies to create an enabling environment for strong industry-academia linkages wherein institutions are motivated and encouraged to share common platforms with clusters for knowledge sharing and research. It is pertinent to mention here that one of the main features of the EMC scheme for EMSD sector is that the SPV should consider including an academic/research institution to be part of the SPV. While it is commendable that the Government has taken cognizance of the significance of academic-industry linkages, it is not mandatory for the SPV to include an academic/research institution. This could be made compulsory as an adjunct while widening the scope of EMC to cover all
hi-tech manufacturing clusters. It may be worthwhile to mention here that for reinvigorating its manufacturing sector, USA has allocated US$ 500 million to six universities to initiate the Advanced Manufacturing Partnership program between industry and institutions. The partnership includes 11 manufacturing companies including Ford Motor Co., Caterpillar Inc., Procter & Gamble Co., and Northrop Grumman Corp., and Dow Chemical Co., among others.
OTHER MEAsUREs
Leverage Public Procurement for Localization and Technology Transfer
India represents one of the fastest growing markets in the world. Local demand provides a unique opportunity for hi-technology manufacturers to scale up, especially considering the country’s ever increasing trade deficit in this segment. The government needs to ensure an environment that promotes investments in local manufacturing and enables the domestic players to compete on a level playing field. Various measures taken for creating global giants in countries such as China and South Korea could be considered for implementaiton by suitably adapting them to the Indian context.
China has been extremely successful in building a world class manufacturing

86
sector. Chinese value addition in manufacturing has shown a dramatic rise in the last decade, and is now approaching that of USA. Acquisition of technology and building self sufficiency in capital goods has played a major role in this rise. This has been accomplished through proactive policies, prominent amongst them being a strong procurement policy favouring goods produced within the country. China’s public procurement policies clearly lay down a preference for domestic goods with extensive controls over purchase of imported products (requiring several approvals and special procedures). The Chinese government’s procurement law spells out that the government shall procure goods, construction and services goods from outside only in the event that “the goods, construction or services needed are not available within the territory of the People’s Republic of China, or though available, cannot be acquired on reasonable commercial terms”, or “where the items to be procured are for use abroad”. There is also a clearly stated preference for domestic innovation. Such policies have led to localisation of several hi-tech and capital goods products. Foreign players eager to capture the Chinese market setup production facilities in China to locally manufacture the goods. At the same time manufacturers are also encouraged to think of ways in
which they can acquire technology. India should also learn from such experiences and wherever feasible, public procurement should have preference for local manufacturers producing hi-tech products.
P r o m o t i o n o f I n t e l l i g e n t Manufacturing
Significant engineering skills, with the combination of hardware, software and system integration skills are required in the evolution stage of advanced technology products. This niche area is called intelligent manufacturing. These are usually hi-tech products which provide high value addition but low volumes in highly quality conscious capital goods sector. India has a competitive advantage in this sector where a large proportion of value addition is through software and system integration. According to a Strategy Paper on ‘Doubling Exports in Next Three Years (2011-12 to 2013-14)’, prepared by the Ministry of Commerce, Government of India, establishing joint ventures with Chinese companies, which have manufacturing strengths and substantial market share in third world countries, would help in increasing hi-tech exports in the short term to developing countries in Africa and the Middle East.

87
Adapting and Replicating Successful Development Models of Hi-Tech Manufacturing
Analysis of hi-tech zones like Chengdu (China) and Colorado (USA) reveals that these regions, despite being land-locked (away from ports by about 800 kms) have been able to develop successful hi-tech manufacturing industries. These have, over the years, increased their exports significantly, provided additional employment and generated higher tax revenues than neighbouring regions that have not adopted a hi-tech manufacturing strategy. These two examples indicate that hi-tech manufacturing is region-neutral and does not require large land area. Suitable geographies may be identified in various states to develop high tech zones. A conscious attempt is required to be made to attract foreign and domestic investment in these sectors by offering special incentives as is being offered by other countries, some of which have been highlighted earlier.
Creating Institutes of Strategic Importance
India could consider building institutes of st rategic importance which are focussed on developing and
implementing innovative ideas related to hi-tech products. These institutes could help ensure technological competence, while allowing India to leapfrog its global competitors in the medium to long term. The National Innovation Council could perhaps take a lead in this initiative. USA, for example, while being aware of the power of manufacturing, has invested in the development of National Manufacturing Innovation Institutes. One such institute that is already up and running is the National Additive Manufacturing Innovation Institute (NAMII) in Youngstown, Ohio. NAMII is a public-private partnership initiative with member organizations from industry, academia and government all collaborating for a singular, shared vision. NAMII’s goal is to transition additive manufacturing technology to the mainstream U.S. manufacturing sector and create an adaptive workforce capable of not only meeting industry needs but also increasing domestic manufacturing competitiveness. India too needs to establish institutes of such magnitude which can help the country create niche hi-tech products that could potentially earn greater levels of foreign exchange through exports.

88
Ann
exue
r 1: T
op 5
Hi-T
ech
Prod
ucts
Bei
ng E
xpor
ted
By
Top
10 E
xpor
ters
EXPO
RTE
RsI
TcPR
OD
Uc
T N
AM
EvA
lUEs
(Us$
bn)
2007
2008
2009
2010
2011
CH
INA
7522
Dig
ital C
ompu
ters
66.7
75.0
73.5
100.
711
0.0
7643
TV, r
adio
tran
smitt
ers
etc.
36.1
38.9
39.8
47.1
63.3
7649
Parts
And
Acc
esso
ries
Suita
ble
For U
se S
olel
y O
r Prin
cipa
lly W
ith T
he A
ppar
atus
Of
Tele
com
mun
icat
ions
And
Sou
nd R
ecor
ding
And
Rep
rodu
cing
Equ
ipm
ent
36.8
41.7
35.4
47.1
54.5
7763
Dio
des,
tran
sist
ors
etc.
8.8
15.7
14.3
30.2
33.6
7764
Elec
troni
c m
icro
circ
uits
24.2
25.1
24.0
30.0
33.4
cH
INA
Tota
l34
2.7
383.
134
4.6
458.
551
7.4
GER
MAN
Y79
24Ai
rpla
nes
And
Oth
er A
ircra
ft, M
echa
nica
lly P
rope
lled
(oth
er T
han
Hel
icop
ters
), O
f An
Unl
aden
Wei
ght E
xcee
ding
15,
000
Kg18
.520
.022
.022
.126
.9
5416
Gly
cosi
des;
gla
nds
etc.
8.8
11.7
12.6
15.8
17.6
7764
Elec
troni
c m
icro
circ
uits
13.8
13.1
8.6
10.4
10.8
7763
Dio
des,
tran
sist
ors
etc.
5.4
8.1
5.8
9.8
9.4
7712
Oth
er e
lect
ric p
ower
mac
hine
, par
t5.
46.
75.
47.
88.
9
GER
MA
Ny
Tota
l20
3.0
220.
219
2.0
211.
123
5.9
USA
7764
Elec
troni
c m
icro
circ
uits
39.7
39.7
29.2
36.3
34.6
7599
Parts
And
Acc
esso
ries
For U
se S
olel
y O
r Prin
cipa
lly W
ith O
ffice
Mac
hine
s (e
xcep
t Ph
oto-
Or T
herm
o-co
py) A
nd A
utom
atic
Dat
a Pr
oces
sing
Mac
hine
s, E
tc15
.715
.112
.814
.114
.9
5416
Gly
cosi
des;
gla
nds
etc.
9.7
12.1
14.3
14.1
11.3
7649
Parts
And
Acc
esso
ries
Suita
ble
For U
se S
olel
y O
r Prin
cipa
lly W
ith T
he A
ppar
atus
Of
Tele
com
mun
icat
ions
And
Sou
nd R
ecor
ding
And
Rep
rodu
cing
Equ
ipm
ent
10.9
10.9
9.4
9.2
9.2
7643
TV, r
adio
tran
smitt
ers
etc
6.3
6.9
6.2
7.5
8.9
UsA
Tot
al28
6.2
289.
620
1.7
226.
723
3.1
HO
NG
KO
NG
7764
Elec
troni
c m
icro
circ
uits
39.5
43.2
44.7
53.7
58.1
7649
Parts
And
Acc
esso
ries
Suita
ble
For U
se S
olel
y O
r Prin
cipa
lly W
ith T
he A
ppar
atus
Of
Tele
com
mun
icat
ions
And
Sou
nd R
ecor
ding
And
Rep
rodu
cing
Equ
ipm
ent
29.3
31.1
27.2
33.7
37.1

89
7599
Parts
And
Acc
esso
ries
For U
se S
olel
y O
r Prin
cipa
lly W
ith O
ffice
Mac
hine
s (e
xcep
t Ph
oto-
Or T
herm
o-co
py) A
nd A
utom
atic
Dat
a Pr
oces
sing
Mac
hine
s, E
tc19
.519
.216
.221
.122
.6
7643
TV, r
adio
tran
smitt
ers
etc
3.8
4.9
5.2
6.9
10.5
7527
Stor
age
Uni
ts, W
heth
er O
r Not
Pre
sent
ed W
ith T
he R
est O
f The
Sys
tem
For
Dat
a Pr
oces
sing
4.
05.
25.
17.
39.
4
HO
NG
KO
NG
Tot
al13
4.4
142.
813
2.8
168.
718
6.3
SIN
GAP
OR
E77
64El
ectro
nic
mic
roci
rcui
ts56
.256
.950
.769
.370
.5
7599
Parts
And
Acc
esso
ries
For U
se S
olel
y O
r Prin
cipa
lly W
ith O
ffice
Mac
hine
s (e
xcep
t Ph
oto-
Or T
herm
o-co
py) A
nd A
utom
atic
Dat
a Pr
oces
sing
Mac
hine
s, E
tc1.
914
.88.
911
.310
.5
7768
Piez
oele
ctric
Cry
stal
s, M
ount
ed, A
nd P
arts
, Of T
herm
ioni
c, C
old
Cat
hode
Or P
hoto
-ca
thod
e Va
lves
And
Tub
es, D
iode
s, T
rans
isto
rs, E
tc.
9.9
11.1
7.3
11.6
7.9
7763
Dio
des,
tran
sist
ors
etc.
3.9
4.5
3.7
5.4
4.9
7643
TV, r
adio
tran
smitt
ers
etc
7.5
5.3
3.3
3.5
4.7
sIN
GA
POR
E To
tal
115.
412
7.5
103.
813
5.5
135.
4
KOR
EA R
EP.
7764
Elec
troni
c m
icro
circ
uits
30.1
25.6
24.2
37.7
39.5
8719
Liqu
id c
ryst
al d
evic
es la
sers
19.6
23.1
23.4
30.1
27.7
7649
Parts
And
Acc
esso
ries
Suita
ble
For U
se S
olel
y O
r Prin
cipa
lly W
ith T
he A
ppar
atus
Of
Tele
com
mun
icat
ions
And
Sou
nd R
ecor
ding
And
Rep
rodu
cing
Equ
ipm
ent
16.0
17.6
16.1
17.6
18.0
7643
TV, r
adio
tran
smitt
ers
etc
18.7
22.1
18.1
15.3
15.1
7599
Parts
And
Acc
esso
ries
For U
se S
olel
y O
r Prin
cipa
lly W
ith O
ffice
Mac
hine
s (e
xcep
t Ph
oto-
Or T
herm
o-co
py) A
nd A
utom
atic
Dat
a Pr
oces
sing
Mac
hine
s, E
tc8.
66.
25.
18.
05.
1
KO
REA
REP
. Tot
al11
3.5
113.
710
4.1
131.
612
9.4
FRAN
CE
7924
Airp
lane
s An
d O
ther
Airc
raft,
Mec
hani
cally
Pro
pelle
d (o
ther
Tha
n H
elic
opte
rs),
Of A
n U
nlad
en W
eigh
t Exc
eedi
ng 1
5,00
0 Kg
20.7
25.1
24.0
35.8
38.8
7764
Elec
troni
c m
icro
circ
uits
6.6
6.3
4.8
7.2
8.4
5416
Gly
cosi
des;
gla
nds
etc.
3.0
3.3
4.3
5.3
5.2
5422
Med
icam
ents
, hor
mon
es e
tc3.
04.
14.
24.
33.
7
5251
Rad
io-a
ctiv
e ch
emic
als
2.8
4.5
3.2
3.2
2.8
EXPO
RTE
RsI
TcPR
OD
Uc
T N
AM
EvA
lUEs
(Us$
bn)

90
Sour
ce: D
ata
deriv
ed fr
om P
C-T
AS, U
N C
omtra
de, 2
013,
EXI
M B
ank
Res
earc
h
FRA
Nc
E To
tal
100.
811
4.9
102.
311
8.4
124.
9
JAPA
N77
64El
ectro
nic
mic
roci
rcui
ts30
.128
.824
.431
.329
.2
7763
Dio
des,
tran
sist
ors
etc.
8.7
9.3
7.2
10.1
10.1
8719
Liqu
id c
ryst
al d
evic
es la
sers
3.1
3.8
3.9
6.6
8.6
7649
Parts
And
Acc
esso
ries
Suita
ble
For U
se S
olel
y O
r Prin
cipa
lly W
ith T
he A
ppar
atus
Of
Tele
com
mun
icat
ions
And
Sou
nd R
ecor
ding
And
Rep
rodu
cing
Equ
ipm
ent
14.7
14.6
9.7
9.6
7.9
8746
Auto
mat
ic c
ontro
l ins
trum
ent
3.6
3.8
3.2
4.8
5.3
JAPA
N T
otal
110.
811
2.2
90.6
112.
611
5.2
TAIW
AN77
64El
ectro
nic
mic
roci
rcui
ts41
.640
.137
.049
.755
.1
8719
Liqu
id c
ryst
al d
evic
es la
sers
15.9
17.3
12.0
17.9
17.2
7643
TV, r
adio
tran
smitt
ers
etc
3.6
4.7
4.0
7.7
10.7
7763
Dio
des,
tran
sist
ors
etc.
4.9
6.5
5.9
10.1
9.7
7599
Parts
And
Acc
esso
ries
For U
se S
olel
y O
r Prin
cipa
lly W
ith O
ffice
Mac
hine
s (e
xcep
t Ph
oto-
Or T
herm
o-co
py) A
nd A
utom
atic
Dat
a Pr
oces
sing
Mac
hine
s, E
tc9.
47.
66.
07.
76.
1
TAIW
AN
Tot
al89
.489
.975
.010
6.1
114.
9
NET
HER
LAN
DS
7599
Parts
And
Acc
esso
ries
For U
se S
olel
y O
r Prin
cipa
lly W
ith O
ffice
Mac
hine
s (e
xcep
t Ph
oto-
Or T
herm
o-co
py) A
nd A
utom
atic
Dat
a Pr
oces
sing
Mac
hine
s, E
tc10
.89.
68.
08.
610
.3
7522
Dig
ital c
ompu
ters
2.9
2.7
3.8
6.8
7.0
7527
Stor
age
Uni
ts, W
heth
er O
r Not
Pre
sent
ed W
ith T
he R
est O
f The
Sys
tem
For
Dat
a Pr
oces
sing
5.
44.
74.
04.
14.
2
7649
Parts
And
Acc
esso
ries
Suita
ble
For U
se S
olel
y O
r Prin
cipa
lly W
ith T
he A
ppar
atus
Of
Tele
com
mun
icat
ions
And
Sou
nd R
ecor
ding
And
Rep
rodu
cing
Equ
ipm
ent
3.2
4.0
3.3
3.4
3.6
7764
Elec
troni
c m
icro
circ
uits
7.5
4.7
3.5
3.9
3.5
NET
HER
lAN
Ds
Tota
l82
.070
.964
.172
.880
.7
HI T
EcH
WO
RlD
EXP
OR
Ts22
91.3
2418
.421
04.3
2502
.126
72.8
EXPO
RTE
RsI
TcPR
OD
Uc
T N
AM
EvA
lUEs
(Us$
bn)

91
IMPO
RTE
RsI
Tc
PRO
DU
cT
NA
ME
vAlU
E (U
s$ b
n)
2007
2008
2009
2010
2011
cH
INA
7764
Elec
tron
ic m
icro
circ
uits
127.
912
9.5
120.
215
7.3
170.
6
8719
Liqu
id C
ryst
al D
evic
es; L
aser
s (o
ther
Tha
n La
ser D
iode
s)
Oth
er O
ptic
al A
pplia
nces
And
Inst
rum
ents
45.3
48.5
38.3
51.5
53.1
7649
Parts
And
Acc
esso
ries
Suita
ble
For U
se S
olel
y O
r Prin
cipa
lly
With
The
App
arat
us O
f Tel
ecom
mun
icat
ions
And
Sou
nd
Rec
ordi
ng A
nd R
epro
duci
ng E
quip
men
t24
.725
.022
.726
.734
.1
7527
Stor
age
Uni
ts, W
heth
er O
r Not
Pre
sent
ed W
ith T
he R
est O
f Th
e Sy
stem
For
Dat
a Pr
oces
sing
14
.917
.316
.720
.822
.4
7599
Parts
And
Acc
esso
ries
For U
se S
olel
y O
r Prin
cipa
lly W
ith
Offi
ce M
achi
nes
(exc
ept P
hoto
- Or T
herm
o-co
py) A
nd
Auto
mat
ic D
ata
Proc
essi
ng M
achi
nes,
Etc
17.5
15.6
13.7
19.3
17.5
cH
INA
Tota
l
30
5.7
320.
129
2.9
381.
241
9.9
USA
7643
Tran
smis
sion
App
arat
us F
or R
adio
tele
phon
y, T
eleg
raph
y,
Broa
dcas
ting
Or T
elev
isio
n, W
heth
er O
r Not
Incl
udin
g R
ecep
tion,
Sou
nd R
ecor
ding
, Etc
. App
arat
us30
.835
.137
.141
.246
.7
7522
Dig
ital c
ompu
ters
28.2
29.3
28.4
36.3
45.8
7764
Elec
troni
c m
icro
circ
uits
21.2
19.8
16.5
21.8
27.5
7523
Dig
ital P
roce
ssin
g U
nits
Whe
ther
Or N
ot P
rese
nted
With
The
R
est O
f The
Sys
tem
Whi
ch M
ay C
onta
in S
tora
ge U
nits
, Inp
ut
Uni
ts O
r Out
put U
nits
11.3
10.1
11.5
17.9
18.7
7599
Parts
And
Acc
esso
ries
For U
se S
olel
y O
r Prin
cipa
lly W
ith
Offi
ce M
achi
nes
(exc
ept P
hoto
- Or T
herm
o-co
py) A
nd
Auto
mat
ic D
ata
Proc
essi
ng M
achi
nes,
Etc
22.7
19.3
19.0
23.4
16.7
UsA
Tot
al
32
3.0
327.
229
8.4
350.
538
1.3
HO
NG
KO
NG
7764
Elec
troni
c m
icro
circ
uits
51.1
51.8
53.4
68.0
70.4
7649
Parts
And
Acc
esso
ries
Suita
ble
For U
se S
olel
y O
r Prin
cipa
lly
With
The
App
arat
us O
f Tel
ecom
mun
icat
ions
And
Sou
nd
Rec
ordi
ng A
nd R
epro
duci
ng E
quip
men
t 22
.524
.822
.329
.031
.2
Ann
exur
e 2:
Maj
or H
i-Tec
h Pr
oduc
ts B
eing
Impo
rted
By
Top
Impo
rter
s

92
7599
Parts
And
Acc
esso
ries
For U
se S
olel
y O
r Prin
cipa
lly W
ith
Offi
ce M
achi
nes
(exc
ept P
hoto
- Or T
herm
o-co
py) A
nd
Auto
mat
ic D
ata
Proc
essi
ng M
achi
nes,
Etc
18.6
17.7
16.2
20.5
20.3
7643
Tran
smis
sion
App
arat
us F
or R
adio
tele
phon
y, T
eleg
raph
y,
Broa
dcas
ting
Or T
elev
isio
n, W
heth
er O
r Not
Incl
udin
g R
ecep
tion,
Sou
nd R
ecor
ding
, Etc
. App
arat
us9.
58.
88.
910
.916
.6
7527
Stor
age
Uni
ts, W
heth
er O
r Not
Pre
sent
ed W
ith T
he R
est O
f Th
e Sy
stem
For
Dat
a Pr
oces
sing
5.
67.
16.
98.
410
.0
HO
NG
KO
NG
Tot
al
14
6.1
151.
414
3.8
185.
320
3.5
GER
MAN
Y54
16G
lyco
side
s; g
land
s et
c.9.
911
.712
.414
.417
.5
7763
Dio
des,
Tra
nsis
tors
And
Sim
ilar S
emic
ondu
ctor
Dev
ices
; Ph
otos
ensi
tive
Sem
icon
duct
or D
evic
es; L
ight
Em
ittin
g D
iode
s6.
610
.110
.717
.815
.6
7924
Airp
lane
s An
d O
ther
Airc
raft,
Mec
hani
cally
Pro
pelle
d (o
ther
Th
an H
elic
opte
rs),
Of A
n U
nlad
en W
eigh
t Exc
eedi
ng 1
5,00
0 Kg
9.5
12.3
13.9
15.8
15.6
7764
Elec
troni
c m
icro
circ
uits
14.8
13.4
8.9
12.6
13.1
7522
Dig
ital c
ompu
ters
9.5
10.2
7.5
10.4
9.8
GER
MA
Ny
Tota
l
16
6.4
177.
815
9.2
184.
019
8.0
JAPA
N77
64El
ectro
nic
mic
roci
rcui
ts21
.320
.616
.220
.317
.9
7643
Tran
smis
sion
App
arat
us F
or R
adio
tele
phon
y, T
eleg
raph
y,
Broa
dcas
ting
Or T
elev
isio
n, W
heth
er O
r Not
Incl
udin
g R
ecep
tion,
Sou
nd R
ecor
ding
, Etc
. App
arat
us1.
72.
23.
15.
19.
2
7522
Dig
ital c
ompu
ters
4.1
5.0
4.5
6.3
8.5
7649
Parts
And
Acc
esso
ries
Suita
ble
For U
se S
olel
y O
r Prin
cipa
lly
With
The
App
arat
us O
f Tel
ecom
mun
icat
ions
And
Sou
nd
Rec
ordi
ng A
nd R
epro
duci
ng E
quip
men
t 8.
99.
97.
89.
08.
4
5416
Gly
cosi
des;
gla
nds
etc.
1.4
2.0
2.7
3.8
5.0
JAPA
N T
otal
93.3
97.2
84.7
105.
011
5.8
IMPO
RTE
RsI
Tc
PRO
DU
cT
NA
ME
vAlU
E (U
s$ b
n)
2007
2008
2009
2010
2011

93
FRAN
CE
7924
Airp
lane
s An
d O
ther
Airc
raft,
Mec
hani
cally
Pro
pelle
d (o
ther
Th
an H
elic
opte
rs),
Of A
n U
nlad
en W
eigh
t Exc
eedi
ng 1
5,00
0 Kg
2.9
2.0
3.2
11.2
13.4
7643
Tran
smis
sion
App
arat
us F
or R
adio
tele
phon
y, T
eleg
raph
y,
Broa
dcas
ting
Or T
elev
isio
n, W
heth
er O
r Not
Incl
udin
g R
ecep
tion,
Sou
nd R
ecor
ding
, Etc
. App
arat
us4.
34.
95.
05.
85.
9
7764
Elec
troni
c m
icro
circ
uits
5.2
4.8
3.5
5.6
5.4
5416
Gly
cosi
des;
gla
nds
etc.
1.9
2.5
3.8
4.6
5.4
7522
Dig
ital c
ompu
ters
3.9
4.3
3.2
3.8
4.8
FRA
Nc
E To
tal
86.3
92.2
87.2
103.
111
0.7
SIN
GAP
OR
E77
64El
ectro
nic
mic
roci
rcui
ts44
.742
.935
.649
.547
.3
7599
Parts
And
Acc
esso
ries
For U
se S
olel
y O
r Prin
cipa
lly W
ith
Offi
ce M
achi
nes
(exc
ept P
hoto
- Or T
herm
o-co
py) A
nd
Auto
mat
ic D
ata
Proc
essi
ng M
achi
nes,
Etc
1.4
11.9
6.9
7.8
6.8
7643
Tran
smis
sion
App
arat
us F
or R
adio
tele
phon
y, T
eleg
raph
y,
Broa
dcas
ting
Or T
elev
isio
n, W
heth
er O
r Not
Incl
udin
g R
ecep
tion,
Sou
nd R
ecor
ding
, Etc
. App
arat
us6.
95.
73.
94.
86.
5
7768
Pie
zoel
ectri
c C
ryst
als,
Mou
nted
, And
Par
ts, O
f The
rmio
nic,
C
old
Cat
hode
Or P
hoto
cath
ode
Valv
es A
nd T
ubes
, Dio
des,
Tr
ansi
stor
s, E
tc.
3.2
5.4
3.5
4.2
4.6
7763
Dio
des,
Tra
nsis
tors
And
Sim
ilar S
emic
ondu
ctor
Dev
ices
; Ph
otos
ensi
tive
Sem
icon
duct
or D
evic
es; L
ight
Em
ittin
g D
iode
s3.
83.
82.
73.
93.
8
sIN
GA
POR
E To
tal
88.2
100.
079
.098
.099
.5
UK
7643
Tran
smis
sion
App
arat
us F
or R
adio
tele
phon
y, T
eleg
raph
y,
Broa
dcas
ting
Or T
elev
isio
n, W
heth
er O
r Not
Incl
udin
g R
ecep
tion,
Sou
nd R
ecor
ding
, Etc
. App
arat
us6.
76.
56.
78.
69.
6
7522
Dig
ital c
ompu
ters
5.7
6.0
5.0
6.1
6.3
5416
Gly
cosi
des;
gla
nds
etc.
3.1
3.3
3.9
4.5
5.7
IMPO
RTE
RsI
Tc
PRO
DU
cT
NA
ME
vAlU
E (U
s$ b
n)
2007
2008
2009
2010
2011

94
Sour
ce: D
ata
deriv
ed fr
om P
C-T
AS, U
N C
omtra
de, 2
013,
EXI
M B
ank
Res
earc
h
7599
Parts
And
Acc
esso
ries
For U
se S
olel
y O
r Prin
cipa
lly W
ith
Offi
ce M
achi
nes
(exc
ept P
hoto
- Or T
herm
o-co
py) A
nd
Auto
mat
ic D
ata
Proc
essi
ng M
achi
nes,
Etc
7.6
6.3
4.2
4.0
3.3
7523
Dig
ital P
roce
ssng
Uni
ts W
heth
er O
r Not
Pre
sent
ed W
ith T
he
Res
t Of T
he S
yste
m W
hich
May
Con
tain
Sto
rage
Uni
ts, I
nput
U
nits
Or O
utpu
t Uni
ts4.
53.
93.
23.
43.
2
UK
Tot
al
81
.077
.066
.075
.380
.7
SOU
TH K
OR
EA77
64El
ectro
nic
mic
roci
rcui
ts25
.325
.921
.623
.825
.4
7763
Dio
des,
Tra
nsis
tors
And
Sim
ilar S
emic
ondu
ctor
Dev
ices
; Ph
otos
ensi
tive
Sem
icon
duct
or D
evic
es; L
ight
Em
ittin
g D
iode
s2.
53.
33.
14.
24.
3
7649
Parts
And
Acc
esso
ries
Suita
ble
For U
se S
olel
y O
r Prin
cipa
lly
With
The
App
arat
us O
f Tel
ecom
mun
icat
ions
And
Sou
nd
Rec
ordi
ng A
nd R
epro
duci
ng E
quip
men
t 3.
24.
23.
53.
64.
0
8719
Liqu
id C
ryst
al D
evic
es; L
aser
s (o
ther
Tha
n La
ser D
iode
s)
Oth
er O
ptic
al A
pplia
nces
And
Inst
rum
ents
1.5
1.9
1.7
2.9
3.2
7924
Airp
lane
s An
d O
ther
Airc
raft,
Mec
hani
cally
Pro
pelle
d (o
ther
Th
an H
elic
opte
rs),
Of A
n U
nlad
en W
eigh
t Exc
eedi
ng 1
5,00
0 Kg
1.8
1.1
0.6
1.7
2.8
sOU
TH K
OR
EA T
otal
60.7
63.8
53.8
67.4
73.3
NET
HER
LAN
DS
7599
Parts
And
Acc
esso
ries
For U
se S
olel
y O
r Prin
cipa
lly W
ith
Offi
ce M
achi
nes
(exc
ept P
hoto
- Or T
herm
o-co
py) A
nd
Auto
mat
ic D
ata
Proc
essi
ng M
achi
nes,
Etc
9.9
10.2
8.1
8.9
9.3
7522
Dig
ital c
ompu
ters
4.2
3.8
3.7
8.4
8.6
7527
Stor
age
Uni
ts, W
heth
er O
r Not
Pre
sent
ed W
ith T
he R
est O
f Th
e Sy
stem
For
Dat
a Pr
oces
sing
4.
44.
94.
04.
24.
0
7649
Parts
, tel
ecom
mun
icat
ion
equi
pmen
t3.
63.
63.
13.
53.
7
7763
Dio
des,
Tra
nsis
tors
And
Sim
ilar S
emic
ondu
ctor
Dev
ices
; Ph
otos
ensi
tive
Sem
icon
duct
or D
evic
es; L
ight
Em
ittin
g D
iode
s0.
80.
91.
32.
72.
9
NET
HER
lAN
Ds
Tota
l
74
.367
.058
.267
.473
.0
TOTA
l H
I-TEc
H IM
POR
Ts23
51.8
2494
.721
86.2
2629
.328
05.7
IMPO
RTE
RsI
Tc
PRO
DU
cT
NA
ME
vAlU
E (U
s$ b
n)
2007
2008
2009
2010
2011

95
Expo
rt
Des
tinat
ion
sITc
cod
eTo
p 5
prod
ucts
bei
ng E
xpor
ted
from
Indi
a20
0720
0820
0920
1020
11
USA
5421
Med
icam
ents
, ant
ibio
tics
299
245
219
220
361
7712
Oth
er e
lect
ric p
ower
mac
hine
ry;
parts
of t
he e
lect
ric p
ower
mac
hine
ry o
f gro
up 7
7116
919
313
513
217
5
7649
Parts
, tel
ecom
mun
icat
ion
equi
pmen
t83
3849
5410
9
5422
M
edic
amen
ts, h
orm
ones
etc
6110
511
679
80
7599
Pa
rts ,d
ata
proc
. etc
.mch
4366
7050
72
UsA
Tot
al
18
0722
3824
1533
6136
81
UAE
7643
TV, r
adio
tran
smitt
ers
etc
3036
320
207
540
7649
Parts
, tel
ecom
mun
icat
ion
equi
pmen
t35
4246
2011
3
7523
Dig
ital p
roce
ssin
g un
its, w
heth
er o
r not
pre
sent
ed w
ith th
e re
st o
f a
syst
em, w
hich
may
con
tain
in th
e sa
me
hous
ing
one
or t
wo
of th
e fo
llow
ing
type
s of
uni
t: st
orag
e un
its, i
nput
uni
ts, o
utpu
t uni
ts0
00
1992
7641
Line
tele
phon
e et
c. e
quip
men
t6
1420
2936
7712
Oth
er e
lect
ric p
ower
mac
hine
ry;
parts
of t
he e
lect
ric p
ower
mac
hine
ry o
f gro
up 7
7115
2821
1722
UA
E To
tal
223
402
611
470
1007
UK
5421
Med
icam
ents
, ant
ibio
tics
2220
3526
36
7643
TV, r
adio
tran
smitt
ers
etc
31
421
35
5413
Antib
iotic
s, n
ot p
ut u
p as
med
icam
ents
of g
roup
542
42
615
31
7711
Tran
sfor
mer
s, e
lect
rical
2015
1218
16
7163
Elec
tric
mot
ors,
gen
rato
rs.A
C1
13
913
UK
Tot
al
33
338
746
062
386
5
NET
HER
LAN
DS
7649
Parts
, tel
ecom
mun
icat
ion
equi
pmen
t9
2240
4139
4
7712
Oth
er e
lect
ric p
ower
mac
hine
ry;
parts
of t
he e
lect
ric p
ower
mac
hine
ry o
f gro
up 7
7110
113
076
8385
Ann
exur
e 3:
Key
Hi-T
ech
Prod
ucts
Bei
ng E
xpor
ted
by In
dia
to K
ey E
xpor
t Des
tinat
ions
(Us$
mn)

96
7763
Dio
des,
tran
sist
ors
etc.
38
1581
85
7527
Stor
age
units
, dat
a pr
oc.
3044
6145
27
5421
Med
icam
ents
, ant
ibio
tics
1214
1527
24
Net
herla
nds
Tota
l
26
039
836
142
185
0
Rus
sia
7643
TV, r
adio
tran
smitt
ers
etc
11
1548
159
5421
Med
icam
ents
, ant
ibio
tics
3663
4039
120
5422
Med
icam
ents
, hor
mon
es e
tc28
2216
2537
Rus
sia
Tota
l
33
044
634
639
182
8
Ger
man
y76
43TV
, rad
io tr
ansm
itter
s et
c3
44
1897
7649
Parts
, tel
ecom
mun
icat
ion
equi
pmen
t24
3425
1444
7763
Dio
des,
tran
sist
ors
etc.
7519
724
416
739
7712
Oth
er e
lect
ric p
ower
mac
hine
ry;
parts
of t
he e
lect
ric p
ower
mac
hine
ry o
f gro
up 7
7113
2211
2631
5421
Med
icam
ents
, ant
ibio
tics
2615
613
29
Ger
man
y To
tal
400
703
697
688
764
Sing
apor
e89
11Ar
mou
red
fight
ing
vehi
cles
and
arm
s of
war
10
320
048
7599
Parts
, dat
a pr
oces
sing
etc
.mac
hine
ry31
3743
5845
7742
X-ra
y ap
para
tus
etc.
par
t32
4837
9944
7643
TV, r
adio
tran
smitt
ers
etc
1835
206
3535
7712
Oth
er e
lect
ric p
ower
mac
hine
ry;
parts
of t
he e
lect
ric p
ower
mac
hine
ry o
f gro
up 7
7128
3529
3734
sing
apor
e To
tal
307
599
656
600
759
Nig
eria
7643
TV, r
adio
tran
smitt
ers
etc
01
265
9824
4
7711
Tran
sfor
mer
s, e
lect
rical
1120
4651
66
5421
Med
icam
ents
, ant
ibio
tics
3944
2945
41
5416
Gly
cosi
des;
gla
nds
etc.
66
2110
34
Expo
rt
Des
tinat
ion
sITc
cod
eTo
p 5
prod
ucts
bei
ng E
xpor
ted
from
Indi
a20
0720
0820
0920
1020
11

97
Sour
ce: D
ata
deriv
ed fr
om P
C-T
AS, U
N C
omtra
de, 2
013;
EXI
M B
ank
Res
earc
h
5413
Antib
iotic
s, n
ot p
ut u
p as
med
icam
ents
of g
roup
542
821
1014
17
Nig
eria
Tot
al
17
525
051
636
862
6
Fran
ce76
43TV
, rad
io tr
ansm
itter
s et
c6
48
1755
7712
Oth
er e
lect
ric p
ower
mac
hine
ry;
parts
of t
he e
lect
ric p
ower
mac
hine
ry o
f gro
up 7
711
35
2834
5421
Med
icam
ents
, ant
ibio
tics
816
2324
34
7924
Airc
raft
etc.
ULW
>15
000k
g0
00
016
7599
Parts
, dat
a pr
oces
sing
etc
.mac
hine
ry1
23
110
Fran
ce T
otal
176
308
316
405
503
Sout
h Af
rica
7643
TV, r
adio
tran
smitt
ers
etc
12
148
8211
2
5421
Med
icam
ents
, ant
ibio
tics
2552
3954
75
5419
Phar
m. g
oods
, exc
. Med
icam
ents
11
110
11
5422
Med
icam
ents
, hor
mon
es e
tc7
68
810
7763
Dio
des,
tran
sist
ors
etc.
00
07
10
Sout
h Af
rica
Tota
l
13
724
936
637
749
8
Chi
na76
49Pa
rts, t
elec
omm
unic
atio
n eq
uipm
ent
94
6232
132
5413
Antib
iotic
s, e
xcep
t 29
4031
4362
7599
Parts
, dat
a pr
oc. e
tc.m
ch7
1521
1850
7742
X-ra
y ap
para
tus
etc.
par
t17
2217
2940
7712
Oth
er e
lect
ric p
ower
mac
hine
ry;
parts
of t
he e
lect
ric p
ower
mac
hine
ry o
f gro
up 7
718
1212
1925
Chi
na T
otal
158
174
314
297
483
Tota
l Hi-T
ech
Expo
rts80
9812
068
1485
814
652
2090
4
Expo
rt
Des
tinat
ion
sITc
cod
eTo
p 5
prod
ucts
bei
ng E
xpor
ted
from
Indi
a20
0720
0820
0920
1020
11

98
Ann
exur
e 4:
Key
Hi-T
ech
Prod
ucts
Bei
ng Im
port
ed B
y In
dia
from
Its
Maj
or s
ourc
es (U
s$ m
n)
Impo
rt s
ourc
esI
Tcc
ode
Top
5 pr
oduc
ts b
eing
Impo
rted
by
Indi
a20
0720
0820
0920
1020
11
CH
INA
7643
TV, r
adio
tran
smitt
ers,
etc
2634
2678
2526
4136
3645
7649
Parts
, tel
ecom
mun
icat
ion
equi
pmen
t57
146
816
3016
5621
04
7522
Dig
ital c
ompu
ters
441
539
566
955
1159
7599
Parts
, dat
a pr
oces
s et
c, m
achi
nery
478
517
524
536
822
5413
Antib
iotic
s, n
ot p
ut u
p as
med
icam
ents
of g
roup
542
566
562
525
713
650
cH
INA
Tota
l75
5774
3289
6211
629
1337
9
USA
7649
Parts
, tel
ecom
mun
icat
ion
equi
pmen
t13
011
015
616
318
6
8744
Inst
rum
ents
, ana
lysi
s et
c13
715
514
817
817
4
7643
TV, r
adio
tran
smitt
ers
etc
4925
1125
165
7923
Airc
raft,
ULW
200
1-15
000k
g80
6458
654
376
162
7763
Dio
des,
tran
sist
ors
etc.
3429
4761
144
UsA
Tot
al41
3193
0030
5032
4728
22
GER
MAN
Y77
12O
ther
ele
ctric
pow
er m
achi
nery
; par
ts o
f the
ele
ctric
pow
er
mac
hine
ry o
f gro
up 7
7167
114
182
104
188
8742
Dra
win
g, m
easu
ring
inst
rum
ent
110
139
117
117
147
7643
TV, r
adio
tran
smitt
ers
etc
125
39
131
7649
Parts
, tel
ecom
mun
icat
ion
equi
pmen
t53
3260
5811
4
7764
Elec
troni
c m
icro
circ
uits
143
1725
111
GER
MA
Ny
Tota
l12
5717
8826
3016
1221
63
KOR
EA R
EP.
7643
TV, r
adio
tran
smitt
ers
etc
240
563
391
405
451
7649
Parts
, tel
ecom
mun
icat
ion
equi
pmen
t11
211
323
744
932
8

99
7764
Elec
troni
c m
icro
circ
uits
8030
149
198
298
8746
Auto
mat
ic c
ontro
l ins
trum
ent
5694
8287
83
8719
LCD
, las
ers
etc.
03
4079
56
KO
REA
REP
. Tot
al78
511
6611
6916
4417
55
SIN
GAP
OR
E77
64El
ectro
nic
mic
roci
rcui
ts16
644
308
215
373
7523
Dig
ital p
roce
ssin
g un
its, w
heth
er o
r not
pre
sent
ed w
ith th
e re
st
of a
sys
tem
, whi
ch m
ay c
onta
in in
the
sam
e ho
usin
g on
e or
two
of th
e fo
llow
ing
type
s of
uni
t: st
orag
e un
its, i
nput
uni
ts, o
utpu
t un
its
181
163
163
205
187
7522
Dig
ital c
ompu
ters
220
114
6085
89
7599
Parts
, dat
a pr
oces
s et
c, m
achi
nery
183
171
122
144
86
7649
Parts
, tel
ecom
mun
icat
ion
equi
pmen
t62
4818
212
480
sIN
GA
POR
E To
tal
1720
1398
1556
1431
1601
MAL
AYSI
A75
99Pa
rts, d
ata
proc
ess
etc,
mac
hine
ry26
932
227
730
341
1
7763
Dio
des,
tran
sist
ors
etc.
910
1140
199
7764
Elec
troni
c m
icro
circ
uits
347
4250
91
7649
Parts
, tel
ecom
mun
icat
ion
equi
pmen
t27
2486
104
89
7761
TV p
ictu
re tu
bes,
CR
T, e
tc35
5472
106
65
MA
lAys
IA T
otal
1024
789
712
842
1357
JAPA
N77
63D
iode
s, tr
ansi
stor
s et
c.39
6660
5715
6
8742
Dra
win
g, m
easu
ring
inst
rum
ent
5180
6291
121
7764
Elec
troni
c m
icro
circ
uits
4911
155
101
96
8744
Inst
rum
ents
, ana
lysi
s et
c48
5863
7280
7643
TV, r
adio
tran
smitt
ers
etc
9611
372
971
Impo
rt s
ourc
esI
Tcc
ode
Top
5 pr
oduc
ts b
eing
Impo
rted
by
Indi
a20
0720
0820
0920
1020
11

100
Sour
ce: D
ata
deriv
ed fr
om P
C-T
AS (S
ITC
), EX
IM B
ank
Res
earc
h
JAPA
N T
otal
747
757
960
902
1236
TAIW
AN
7764
Elec
troni
c m
icro
circ
uits
438
6711
428
0
7763
Dio
des,
tran
sist
ors
etc.
4613
912
769
218
7643
TV, r
adio
tran
smitt
ers
etc
2870
2557
151
7649
Parts
, tel
ecom
mun
icat
ion
equi
pmen
t30
5386
134
86
7599
Parts
, dat
a pr
oces
s et
c, m
achi
nery
5336
5355
61
TAIW
AN
Tot
al30
443
048
857
697
5
FRAN
CE
7924
Airc
rftet
c.U
LW>1
5000
kg20
80
100
122
90
7921
Hel
icop
ters
272
212
164
7923
Airc
raft,
ULW
200
1-15
000k
g0
2866
1421
694
48
FRA
Nc
E To
tal
745
3654
2086
1469
809
Tota
l Hi-T
ech
Impo
rts
2395
032
291
2753
829
554
3359
9
Impo
rt s
ourc
esI
Tcc
ode
Top
5 pr
oduc
ts b
eing
Impo
rted
by
Indi
a20
0720
0820
0920
1020
11

101
98. Export Potential of Indian Medicinal Plants and Products99. Select Southern African Countries: A Study of India’s Trade and Investment
Potential100. BIMST-EC Initiative: A Study of India’s Trade and Investment Potential
with Select Asian Countries101. Some Aspects of Productivity Growth and Trade in Indian Industry102. Intra-Industry Trade In India’s Manufacturing Sector103. Export Potential of Indian Plantation Sector: Prospects and Challenges104. Fresh Fruits, Vegetables and Dairy Products: India’s Potential For Exports
to Other Asian Countries105. Biotechnology: Emerging Opportunities for India106. ASEAN Countries: A Study of India’s Trade and Investment Potential107. Essays on Globalisation and Wages in Developing Countries108. Select West African Countries: A Study of India’s Trade and Investment
Potential109. Indian Leather Industry: Perspective and Export Potential110. GCC Countries: A Study of India’s Trade and Export Potential111. Indian Petroleum Products Industry : Opportunities and Challenges112. Floriculture : A Sector Study113. Japanese & U.S. Foreign Direct Investments in Indian Manufacturing :
An Analysis114. Maghreb Region: A Study of India’s Trade and Investment Potential115. Strengthening R & D Capabilities in India116. CIS Region: A Study of India’s Trade and Investment Potential117. Indian Chemical Industry: A Sector Study118. Trade and Environment: A Theoretical and Empirical Analysis119. Indian Pharmaceutical Industry : Surging Globally120. Regional Trade Agreements: Gateway to Global Trade121. Knowledge Process Outsourcing: Emerging Opportunities for India122. Indian Mineral Sector and its Export Potential123. SAARC: An Emerging Trade Bloc124. Indian Capital Goods Industry - A Sector Study125. Financial Liberalization and Its Distributional Consequences126. ECOWAS: A Study of India’s Trade and Investment Potential127. Indian Textile and Clothing Industry in Global Context: Salient Features
and Issues128. Fair Trade : Fair Way of Enhancing Export Value129. Indian Automotive Industry: At The Crossroads130. CARICOM : A Gateway to the America131. IBSA : Enhancing Economic Cooperation Across Continents132. MSMEs and Globalisation: Analysis of Institutional Support System in
India and In Select Countries
REcENT OccAsIONAl PAPERsOP. No. Title

102
133. International Trade, Finance and Money: Essays in Uneven Development
134. Sikkim: Export Potential and Prospects135. Mizoram: Export Potential and Prospects136. Floriculture: A Sector Study137. Biotechnology Industry in India: Opportunities for Growth138. Indian Gems and Jewellery: A Sector Study139. SADC: A Study of India’s Trade and Investment Potential140. Innovation, Imitation and North South Trade: Economic Theory and
Policy141. COMESA (Common Market for Eastern and Southern Africa): A Study of India’s Trade and Investment Potential142. Indian Shipping Industry: A Catalyst for Growth143. New Renewable Energy in India: Harnessing the Potential144. Caribbean Community (CARICOM): A Study of India’s Trade and Investment Potential 145. West African Region: A Study of India’s Trade and Investment Potential 146. India’s Trade and Investment Relations with LDCs (Least Developed Countries): Harnessing Synergies147. Indian Electronic Industry : Perspectives and Strategies 148. Export Potential of Indian Plantation Sector: Prospects and Challenges149 MERCOSUR : A Study of India’s Trade and Investment Potential150. Openness and Growth of the Indian Economy: An Empirical Analysis151. The Commonwealth: Promoting a Shared Vision on Trade and
Investment152. Southern African Development Community (SADC): A Study of India’s Trade and Investment Potential153. Strategic Development of MSMEs: Comparison of Policy Framework
and Institutional Support Systems in India and Select Countries154. Indian Chemical Industry : Exploring Global Demand155. Technological Interventions In Indian Agriculture for Enhancement of Crop Productivity156. Exports of Services and Offshore Outsourcing: An Empirical Investigation
in the Indian Context157. Indian Ocean Rim Association for Regional Co-operation (IOR-ARC): A Study of India’s Trade and Investment Potential158. West Africa: A Study of India’s Trade and Investment Potential159. The Effects of Financial Openness: An Assessment of the Indian
Experience160. Comparison of Labour Laws: Select Countries161. India’s Trade and Investment Relations with Cambodia, Lao PDR, Myanmar, Vietnam (CLMV): Enhancing Economic Cooperation162. Indian Horticulture-Imperatives to Enhance Trade from India163. India’s Trade and Investment Relations with Gulf Cooperation Council
(GCC): Strengthening Economic Ties

103
EXIM BANK’s MAJOR PROGRAMMEsBank’s Major Programmes

104
AhmedabadSakar II, 1st Floor, Next to Ellisbridge Shopping Centre, Ellisbridge P. O., Ahmedabad 380 006.Phone : (91 79) 26576852/26576843Fax : (91 79) 26577696E-mail : [email protected]
BangaloreRamanashree Arcade, 4th Floor, 18, M. G. Road, Bangalore 560 001.Phone : (91 80) 25585755/25589101-04Fax : (91 80) 25589107E-mail : [email protected]
ChandigarhPHD House, 1st Floor, Sector 31-A, Dakshin Marg,Chandigarh 160 031Phone : (91 172) 2641910/12/39/49Fax : (91 172) 2641915E-mail : [email protected]
ChennaiOverseas Towers, 4th and 5th Floor, 756-L,Anna Salai, Chennai 600 002.Phone : (91 44) 28522830/31Fax : (91 44) 28522832E-mail : [email protected]
GuwahatiNEDFI House, 4th FloorGS Road, Dispur, Guwahati 781 006 Phone : (91 361) 2237607/609Fax : (91 361) 2237701E-mail : [email protected]
HyderabadGolden Edifice, 2nd Floor, 6-3-639/640, Raj Bhavan Road,Khairatabad Circle, Hyderabad 500 004.Phone : (91 40) 23307816-21Fax : (91 40) 23317843E-mail : [email protected]
KolkataVanijya Bhawan, 4th Floor, (International Trade Facilitation Centre),1/1 Wood Street, Kolkata 700 016.Phone : (91 33) 22833419/20Fax : (91 33) 22891727E-mail : [email protected]
MumbaiMaker Chambers IV, 8th Floor, 222, Nariman Point, Mumbai 400 021.Phone : (91 22) 22823320 / 92 / 94Fax : (91 22) 22022132E-mail : [email protected]
New DelhiStatesman House, Ground Floor,148, Barakhamba Road, New Delhi 110 001.Phone : (91 11) 23474800Fax : (91 11) 23322758/23321719E-mail : [email protected]
Pune44, Shankarseth Road, Pune 411 037.Phone : (91 20) 26403000Fax : (91 20) 26458846E-mail : [email protected]
EXPORT-IMPORT BANK OF INDIAHEAD OFFICE
Centre One Building, Floor 21, World Trade Centre Complex, Cuffe Parade, Mumbai 400 005.Phone : (91 22) 22172600 Fax : (91 22) 22182572 E-mail : [email protected]
Website : www.eximbankindia.in
LONDON BRANCH5th Floor, 35, King Street, London - EC2V 8BB, United Kingdom.
Phone: (44) 20 77969040 Fax: (44) 20 76000936 E-mail: [email protected]
INDIAN OFFICES OVERSEAS OFFICES
Addis Ababa
Bole Kifle Ketema, Kebele - 19, (03/05)
House No. 015-B, Addis Ababa, Ethiopia.
Phone : (251 116) 630079
Fax : (251 116) 610170
E-mail : [email protected]
Dakar
Floor 1, 7 Rue Félix Faure, B.P. 50666, Dakar, Senegal
Phone : (221 33) 8232849
Fax : (221 33) 8232853
E-mail : [email protected]
Dubai
Level 5, Tenancy 1B, Gate Precinct Building No. 3,
Dubai International Financial Centre,
PO Box No. 506541, Dubai, UAE.
Phone : (971 4) 3637462
Fax : (971 4) 3637461
E-mail : [email protected]
Johannesburg
2nd Floor, Sandton City Twin Towers East, Sandhurst Ext. 3,
Sandton 2196, Johannesburg, South Africa.
Phone : (27 11) 3265103/13
Fax : (27 11) 7844511
E-mail : [email protected]
Singapore
20, Collyer Quay, #10-02, Singapore 049319.
Phone : (65) 65326464
Fax : (65) 65352131
E-mail : [email protected]
Washington D.C.
1750 Pennsylvania Avenue NW, Suite 1202,
Washington D.C. 20006, United States of America.
Phone : (1 202) 223 3238
Fax : (1 202) 785 8487
E-mail : [email protected]
Yangon
House No. 54/A, Ground Floor, Boyarnyunt Street,
Dagon Township, Yangon, Myanmar
Phone : (95) 1389520
Email : [email protected]