Embed Size (px)
Citation preview
Managing nutrition in high density apple and sweet cherry Denise Neilsen and Gerry NeilsenAgriculture and Agri-Food Canada, Pacific Agri-Food Research Centre, Summerland, British Columbia, Canada
USHA ConventionProvo, UT, Jan 23rd ,2008
Nutrient management in apple and cherry
compared with high density apple production little information is available for sweet cherry
principles similar and can be applied to both
Nutrition and water management are linked
water isa solvent for nutrients in the soil and planta transporting agent for nutrients to the root and within the plantirrigation management is the key to nutrient placement and retention in root zone
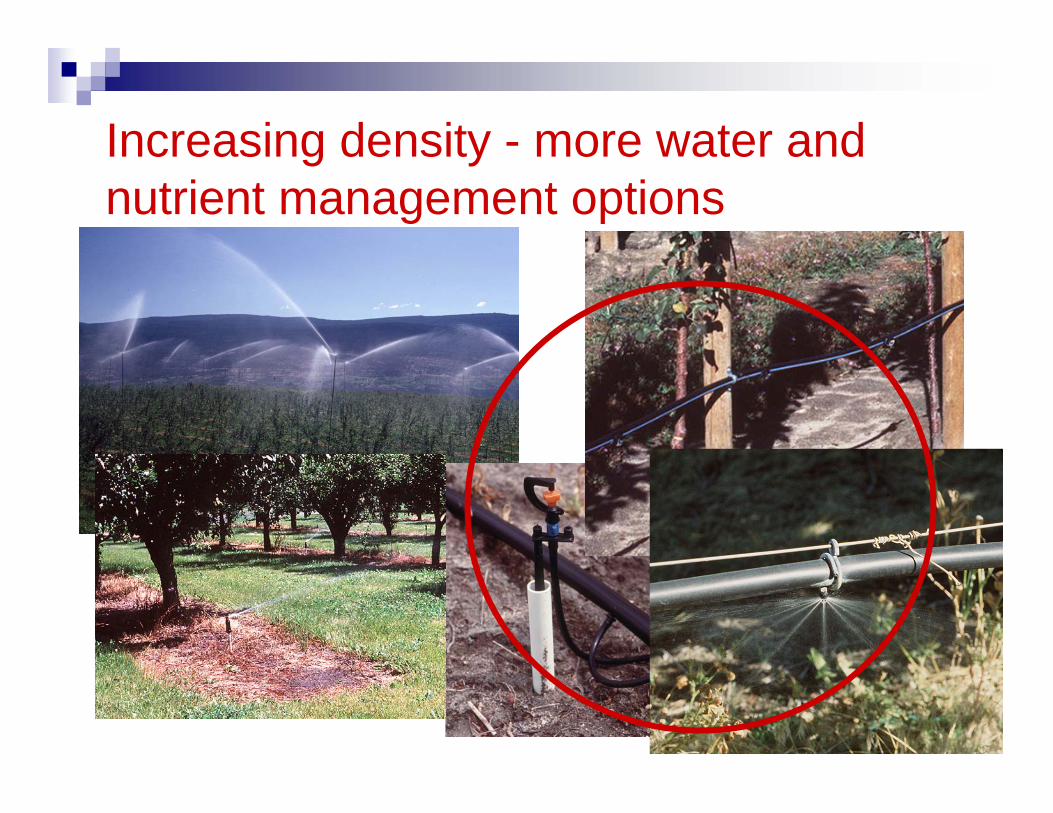
Increasing density - more water and nutrient management options
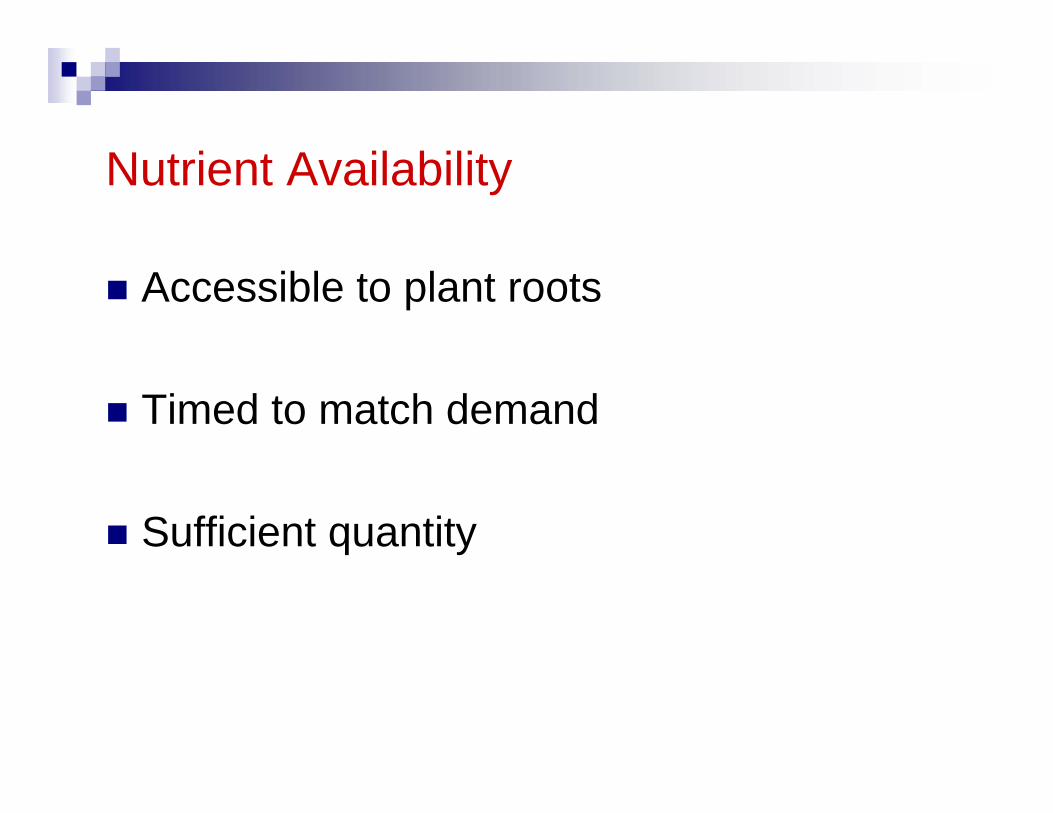
Nutrient Availability
Accessible to plant roots
Timed to match demand
Sufficient quantity
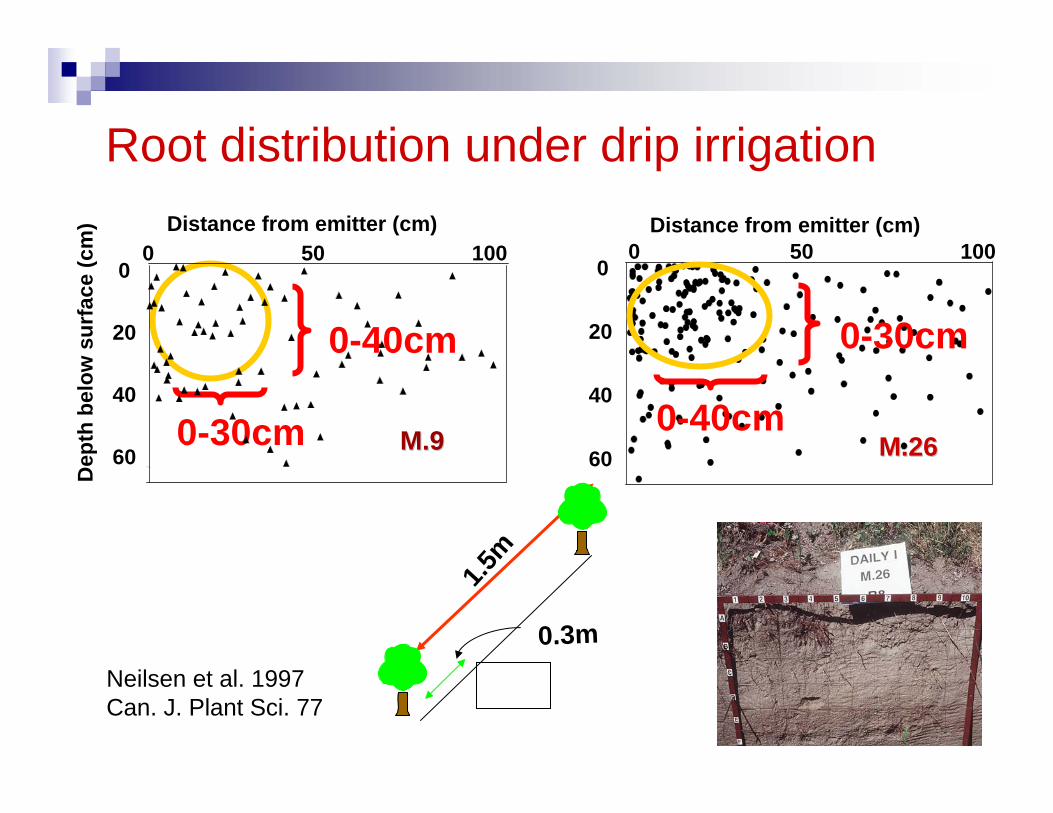
Root distribution under drip irrigation
Neilsen et al. 1997 Can. J. Plant Sci. 77
1.5m
0.3m
0-40cm
0-30cm
0
20
40
60
Dep
th b
elow
sur
face
(cm
)
0 50 100
M.9M.9
Distance from emitter (cm) Distance from emitter (cm)
0
20
40
60 M.26M.26
0 50 100
0-30cm
0-40cm

Nutrients can be targeted to where
roots grow
drip irrigation
micro-jet
0
45
15 45 75
90
0cm
emitter
Where roots grow
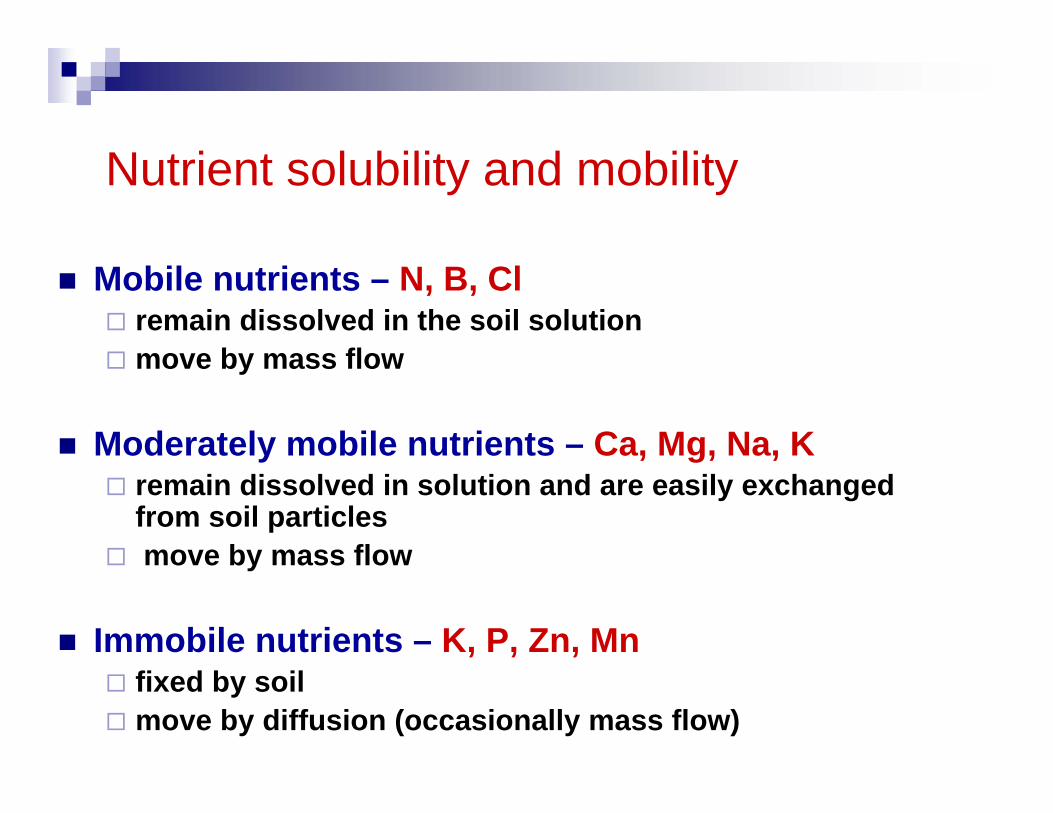
Nutrient solubility and mobility
Mobile nutrients – N, B, Clremain dissolved in the soil solutionmove by mass flow
Moderately mobile nutrients – Ca, Mg, Na, Kremain dissolved in solution and are easily exchanged from soil particlesmove by mass flow
Immobile nutrients – K, P, Zn, Mnfixed by soil move by diffusion (occasionally mass flow)

Mobile nutrients – N, B
Nitrogenvery mobile
allows flexibility in application
but difficult to control
Mobile nutrients

Nitr
ate-
N (p
pm)
140 160 180 200 220 240Day of the year
020406080
100BroadcastIrrigated weeklywith sprinkler
Day of the year110 130 150 170 190 210 2300
4080
120160200 (N1)
(N3)N
itrat
e-N
(ppm
)Fertigated daily
with drip
Control of soil N supply beneath drip emitter with fertigation
Neilsen et al. 1998 JASHS 123

N is stored in leaves
RootRoot-- suppliedsupplied
SummerSummer
FallFall
N is withdrawn from leaves and stored in roots
and woody tissue
Foliar spraysFoliar sprays
Remobilised Remobilised from storage from storage within the tree within the tree
Sources of N for growth Sources of N for growth in the springin the spring
RootRoot-- suppliedsuppliedafter bloomafter bloom
Timed to meet demand

Contribution of stored N to vegetative growth
Grassi et al., 2002 Plant, Cell, Env. 25
12-27SweetCherry
Tagliavini et al., 1998 Tree Phys. 18
38-46Peach
Neilsen et al., 1997, 2001. Tree Phys. 17, 21
18-92Apple
Frak et al., 2002. Plant Phys. 130
88-92Walnut
Reference%Species
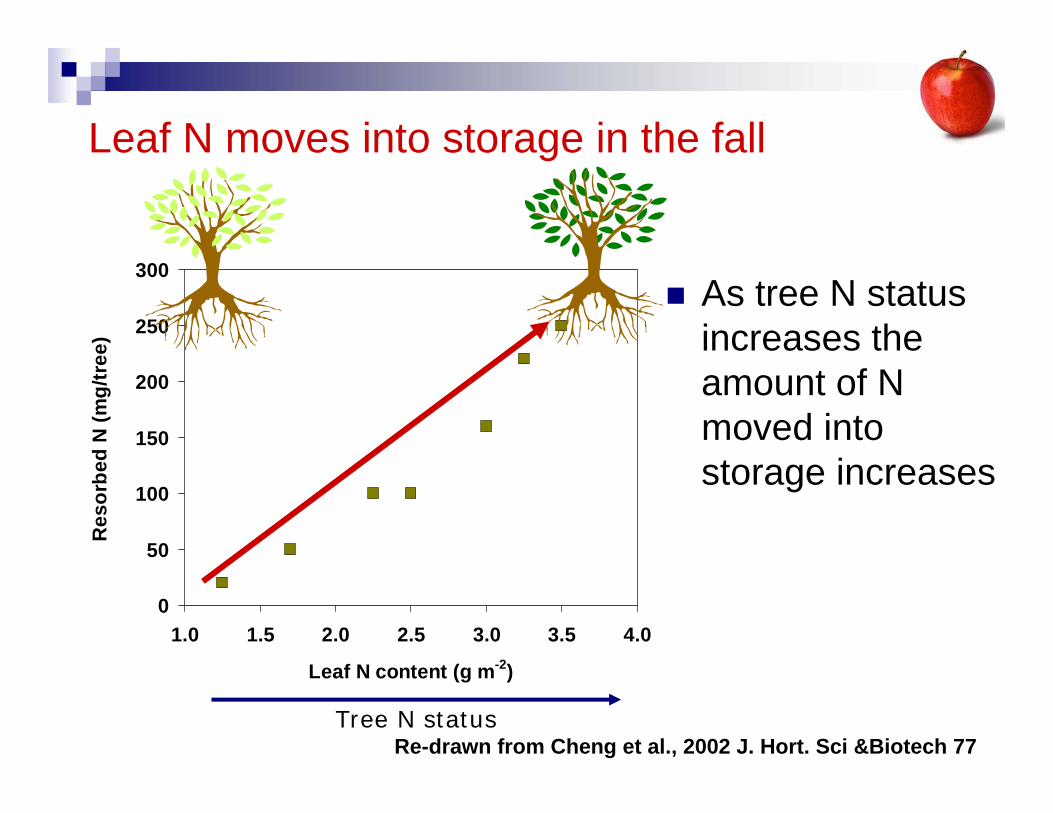
Leaf N moves into storage in the fall
0
50
100
150
200
250
300
1.0 1.5 2.0 2.5 3.0 3.5 4.0
Leaf N content (g m-2)
Res
orbe
d N
(mg/
tree
)
As tree N status increases the amount of N moved into storage increases
Tree N statusRe-drawn from Cheng et al., 2002 J. Hort. Sci &Biotech 77
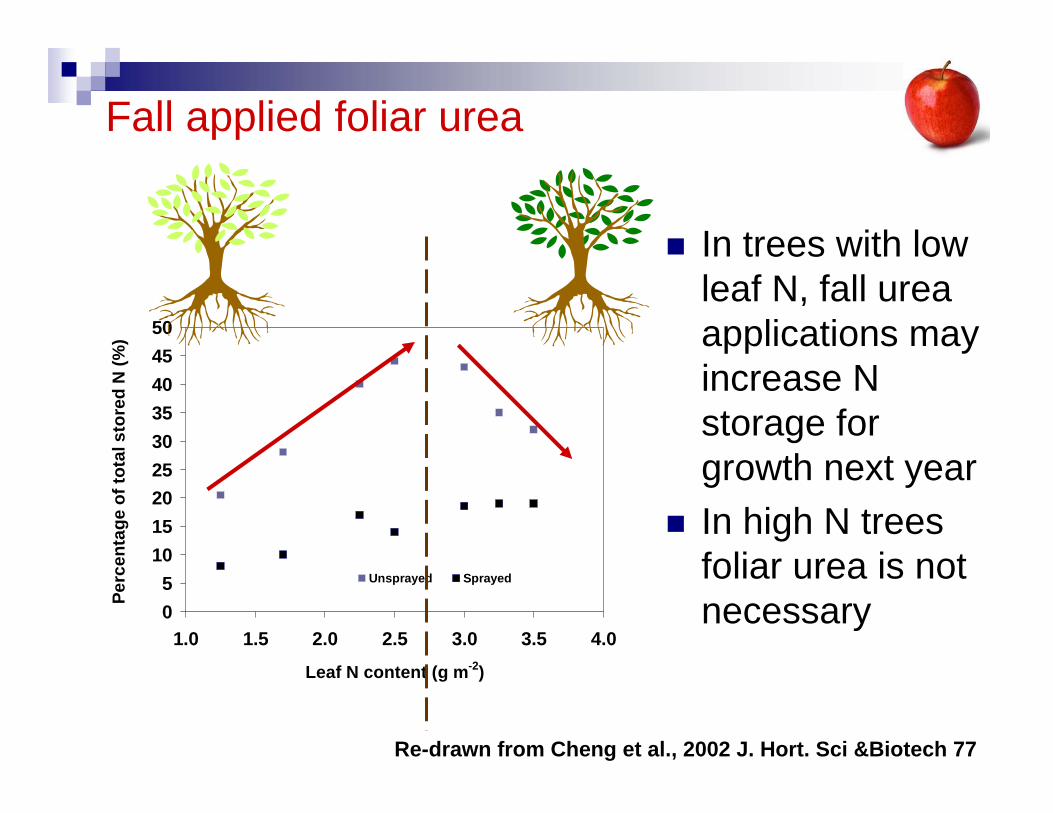
Fall applied foliar urea
05
101520253035404550
1.0 1.5 2.0 2.5 3.0 3.5 4.0
Leaf N content (g m-2)
Perc
enta
ge o
f tot
al s
tore
d N
(%)
Unsprayed Sprayed
In trees with low leaf N, fall urea applications may increase N storage for growth next yearIn high N trees foliar urea is not necessary
Re-drawn from Cheng et al., 2002 J. Hort. Sci &Biotech 77
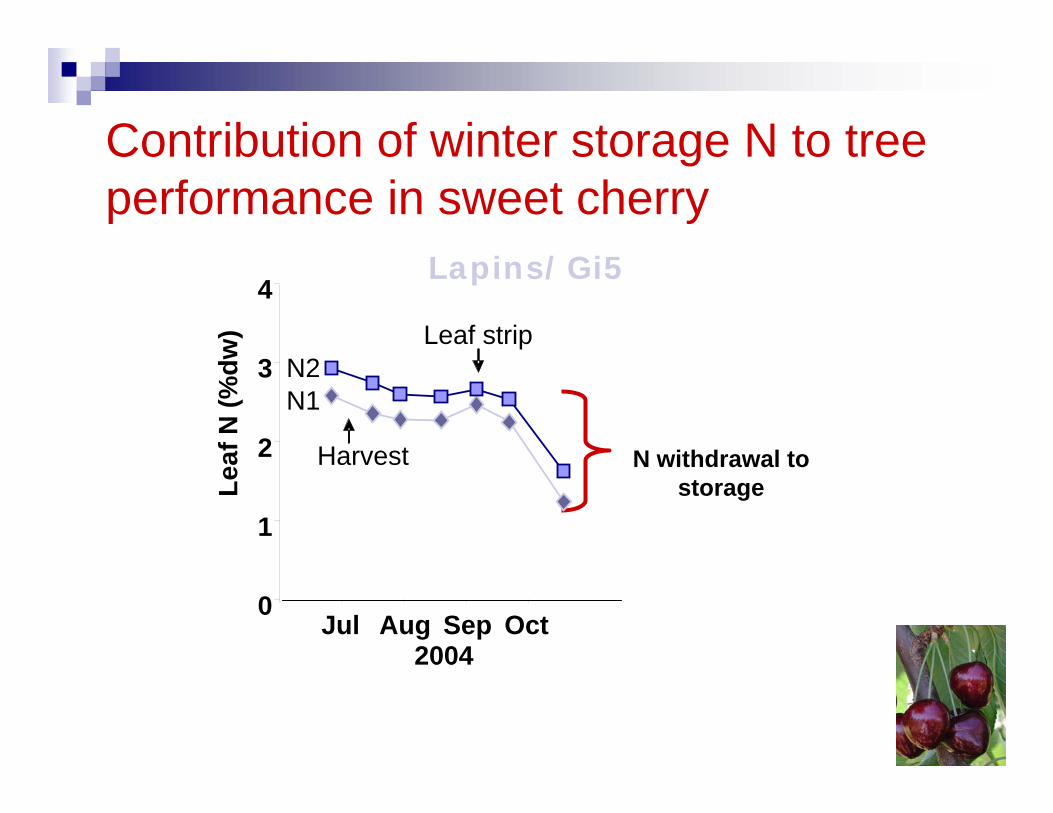
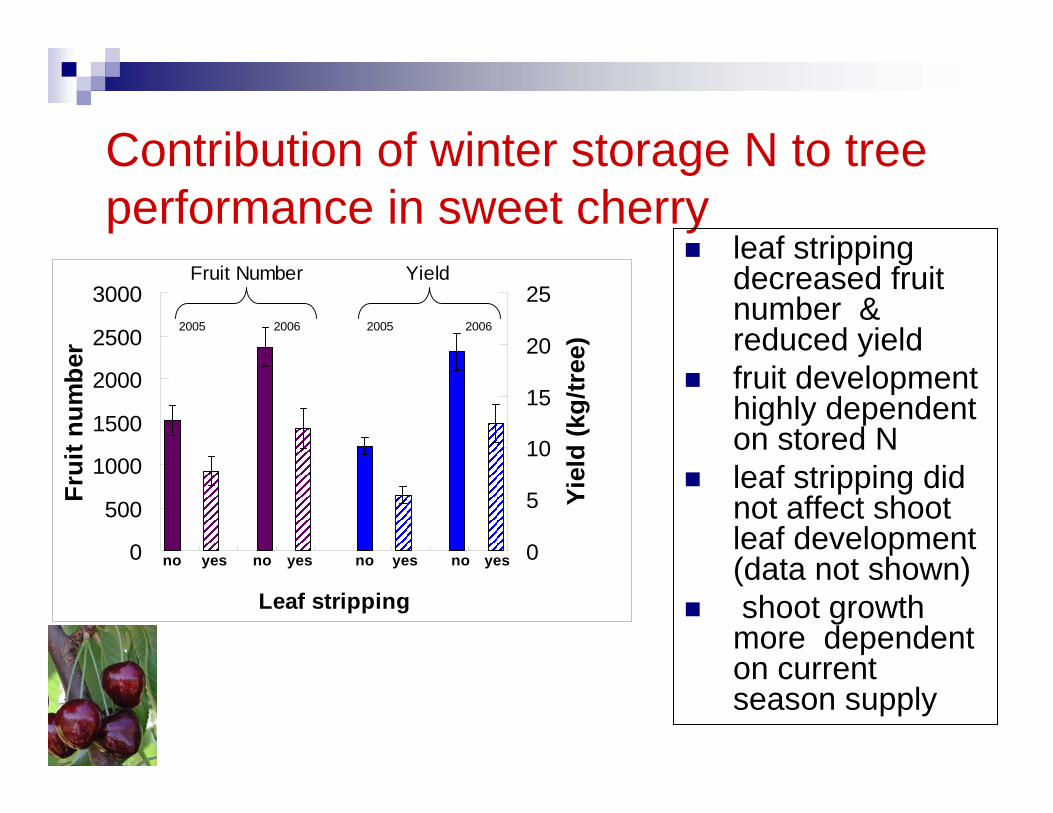
Contribution of winter storage N to tree performance in sweet cherry
N withdrawal to storage
0
1
2
3
4
Leaf
N (%
dw)
Jul Aug Sep Oct
N2N1
2004
Harvest
Leaf strip
Lapins/Gi5
Contribution of winter storage N to tree performance in sweet cherry
0
500
1000
1500
2000
2500
3000
Leaf stripping
Frui
t num
ber
0
5
10
15
20
25
Yiel
d (k
g/tr
ee)
no nononoyes yesyesyes
Fruit Number Yield
2005 2006 20062005
leaf stripping decreased fruit number & reduced yieldfruit development highly dependent on stored Nleaf stripping did not affect shoot leaf development (data not shown)shoot growth more dependent on current season supply
0
1000
2000
3000
4000
5000
6000
80 100 120 140 160 180 200 220
Day of the year
N (m
g/tr
ee)
Budbreak
Full bloom
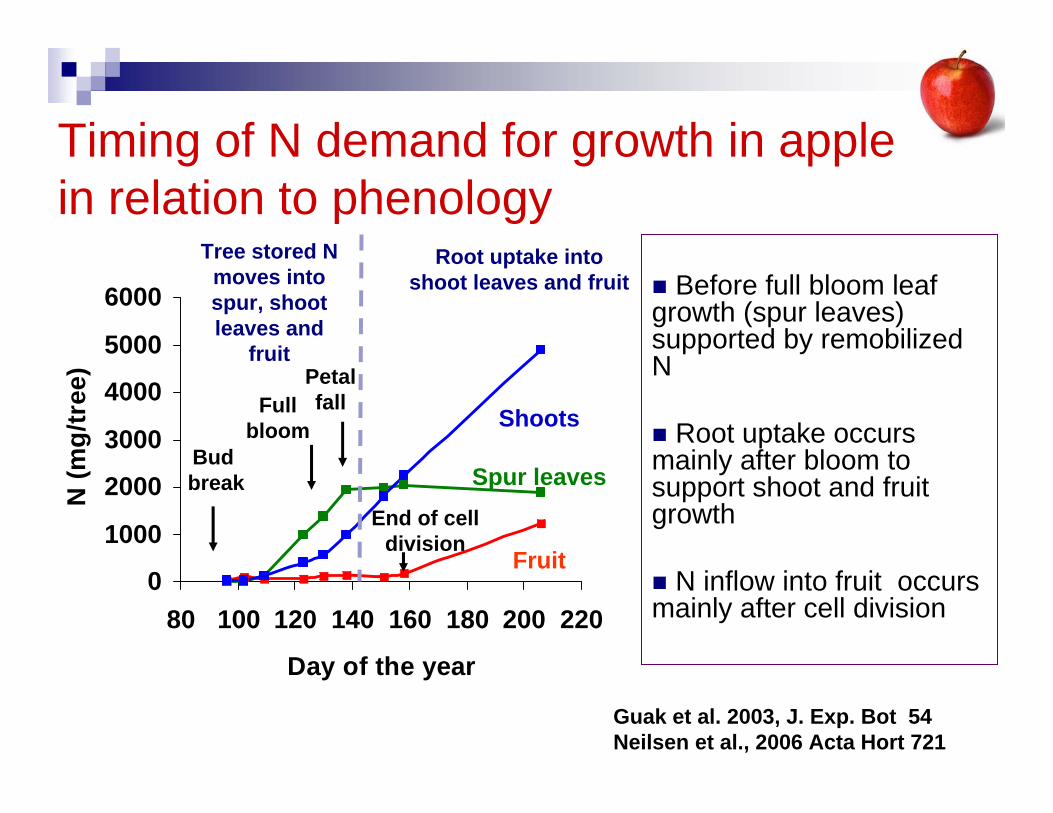
Timing of N demand for growth in apple in relation to phenology
Guak et al. 2003, J. Exp. Bot 54Neilsen et al., 2006 Acta Hort 721
Before full bloom leaf growth (spur leaves) supported by remobilized N
Root uptake occurs mainly after bloom to support shoot and fruit growth
N inflow into fruit occurs mainly after cell division
Root uptake into shoot leaves and fruit
Tree stored N moves into spur, shoot leaves and
fruit
Shoots
Spur leaves
Fruit
Petal fall
End of cell division
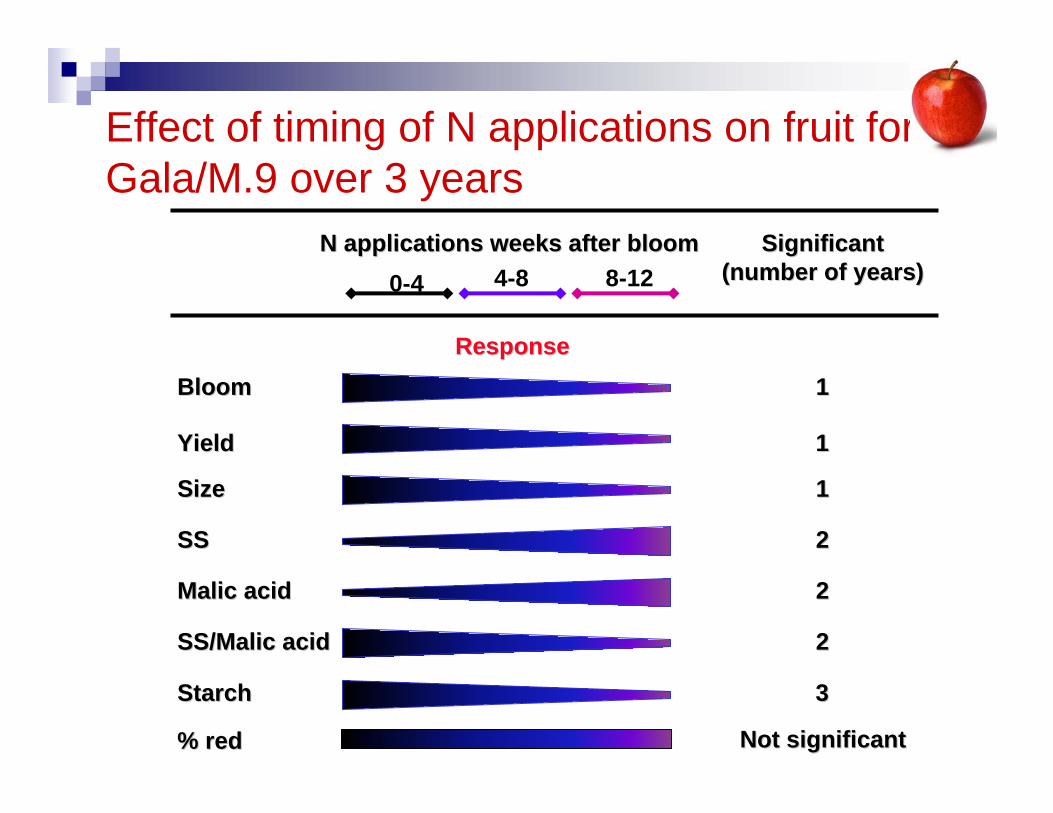
0-4 4-8 8-12N applications weeks after bloomN applications weeks after bloom SignificantSignificant
(number of years)(number of years)
ResponseResponse
BloomBloom
YieldYield
SizeSize
SSSS
MalicMalic acidacid
SS/SS/MalicMalic acidacid
StarchStarch
% red% red
11
11
11
22
22
22
33
Not significantNot significant
Effect of timing of N applications on fruit for Gala/M.9 over 3 years
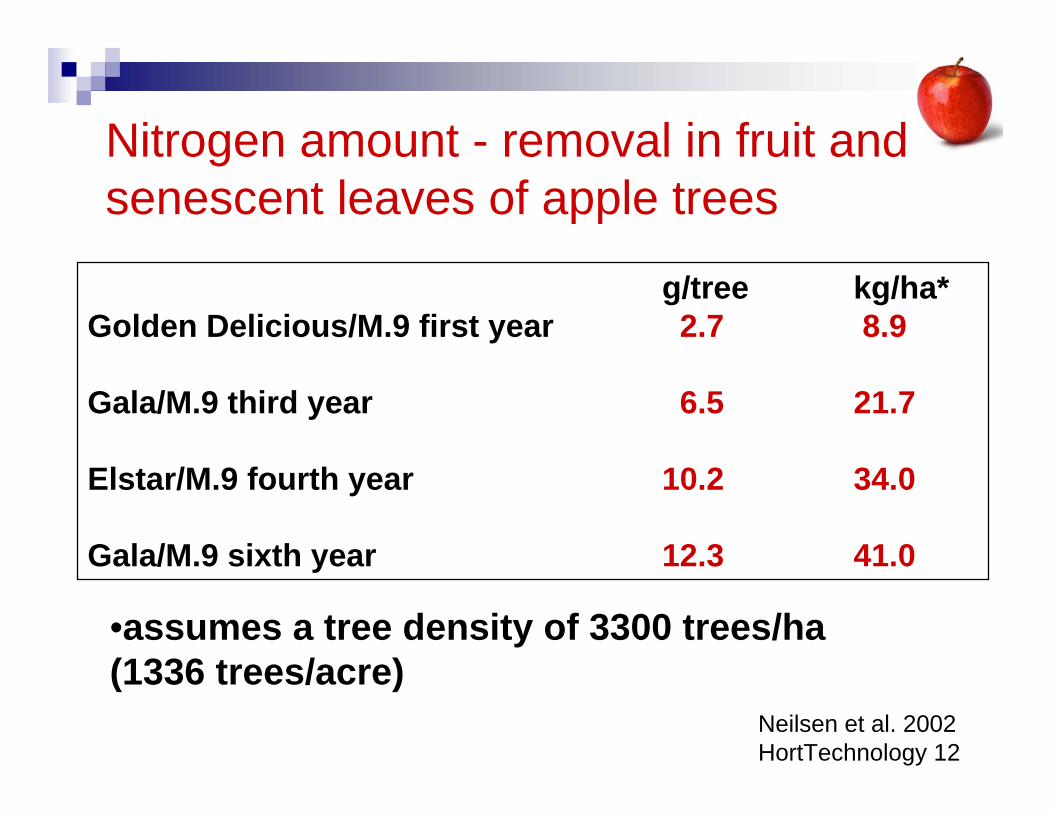
g/tree kg/ha*Golden Delicious/M.9 first year 2.7 8.9
Gala/M.9 third year 6.5 21.7
Elstar/M.9 fourth year 10.2 34.0
Gala/M.9 sixth year 12.3 41.0
•assumes a tree density of 3300 trees/ha (1336 trees/acre)
Nitrogen amount - removal in fruit and senescent leaves of apple trees
Neilsen et al. 2002HortTechnology 12
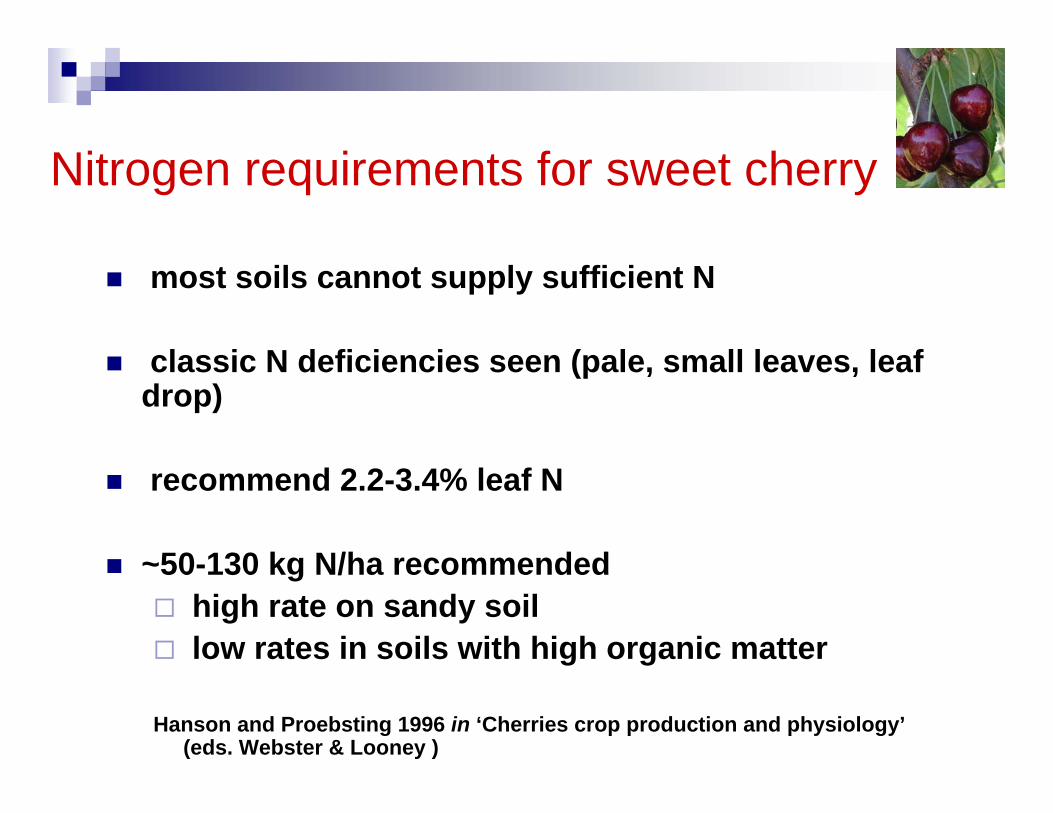
Nitrogen requirements for sweet cherry
most soils cannot supply sufficient N
classic N deficiencies seen (pale, small leaves, leaf drop)
recommend 2.2-3.4% leaf N
~50-130 kg N/ha recommended high rate on sandy soil low rates in soils with high organic matter
Hanson and Proebsting 1996 in ‘Cherries crop production and physiology’(eds. Webster & Looney )
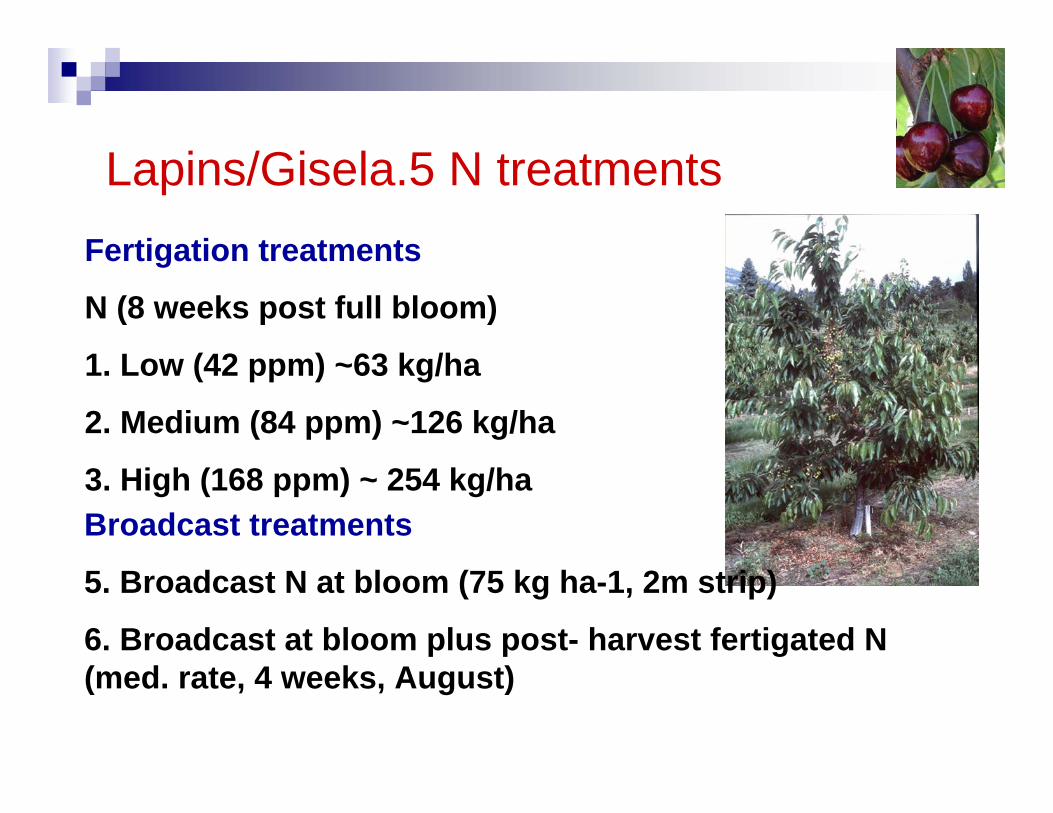
Fertigation treatments
N (8 weeks post full bloom)
1. Low (42 ppm) ~63 kg/ha
2. Medium (84 ppm) ~126 kg/ha
3. High (168 ppm) ~ 254 kg/haBroadcast treatments
5. Broadcast N at bloom (75 kg ha-1, 2m strip)
6. Broadcast at bloom plus post- harvest fertigated N (med. rate, 4 weeks, August)
Lapins/Gisela.5 N treatments
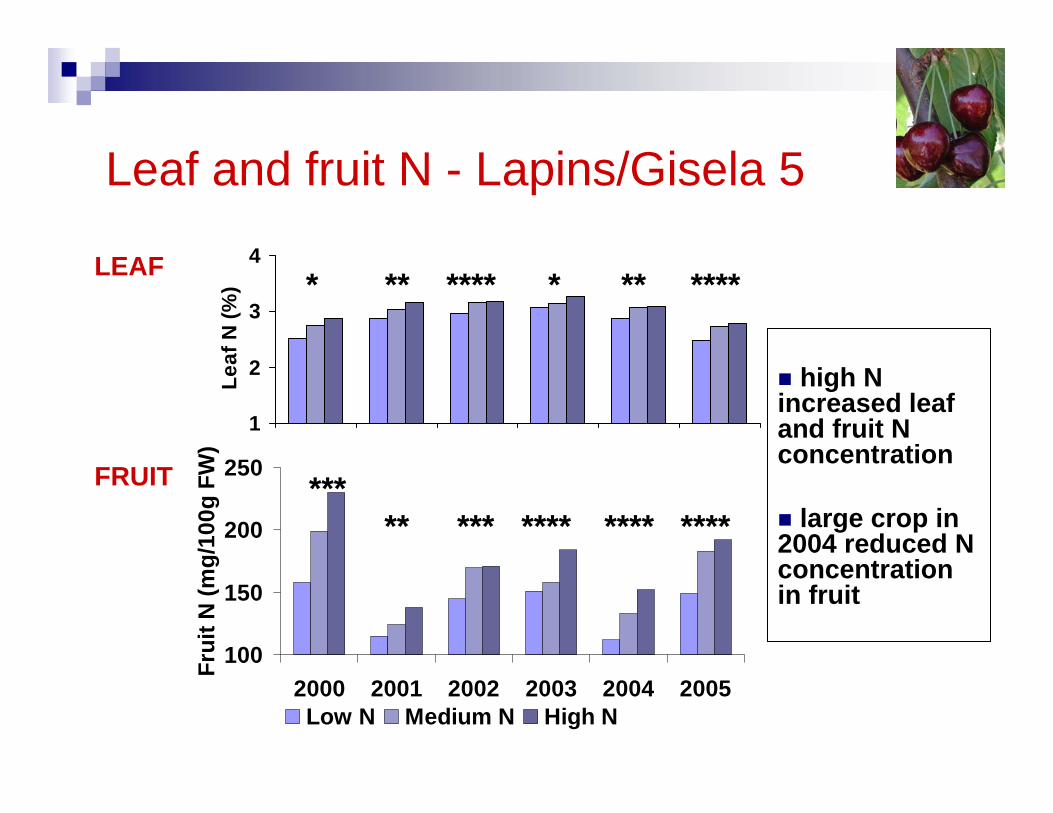
Leaf and fruit N - Lapins/Gisela 5
LEAF
FRUIT
high N increased leaf and fruit N concentration
large crop in 2004 reduced N concentration in fruit
100
150
200
250
2000 2001 2002 2003 2004 2005
Frui
t N (m
g/10
0g F
W)
Low N Medium N High N
******* ****** *** ****
1
2
3
4Le
af N
(%) **** * *** ** ****
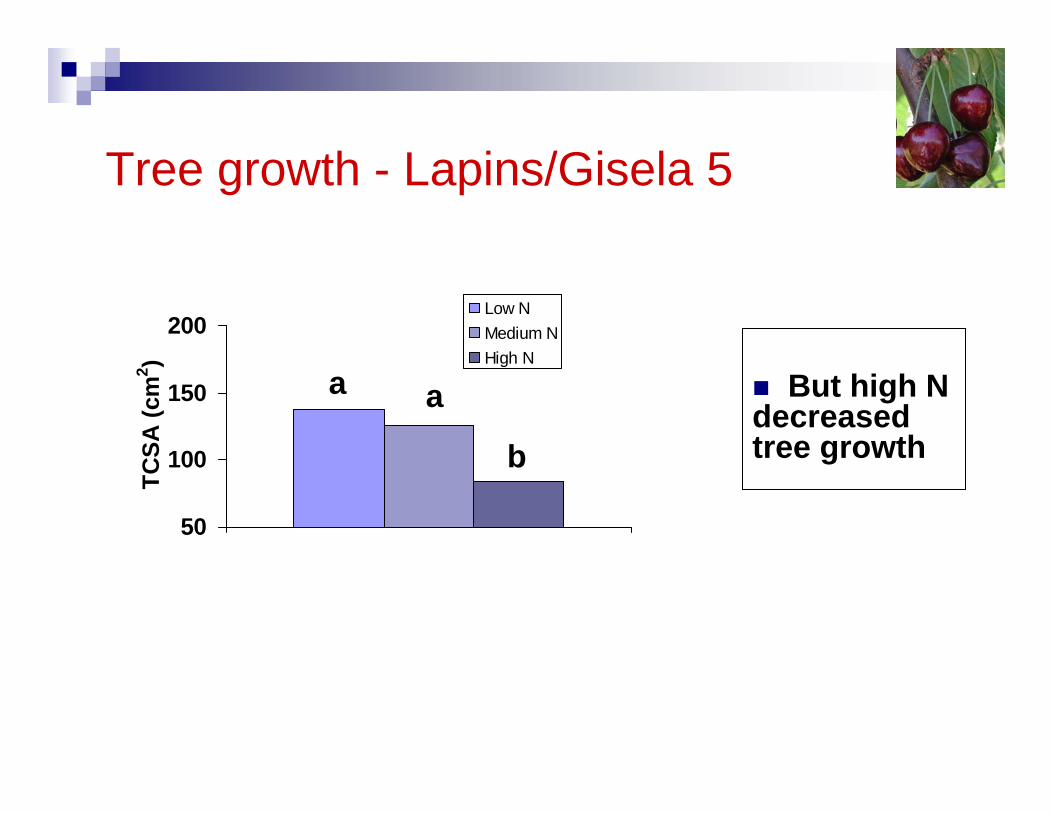
Tree growth - Lapins/Gisela 5
But high N decreased tree growth
50
100
150
200
TCSA
(cm
2 )
Low NMedium NHigh N
a
b
a
0
10
20
30
40
50
Yiel
d (k
g/tr
ee) Low N
Medium NHigh N
***
**** ***
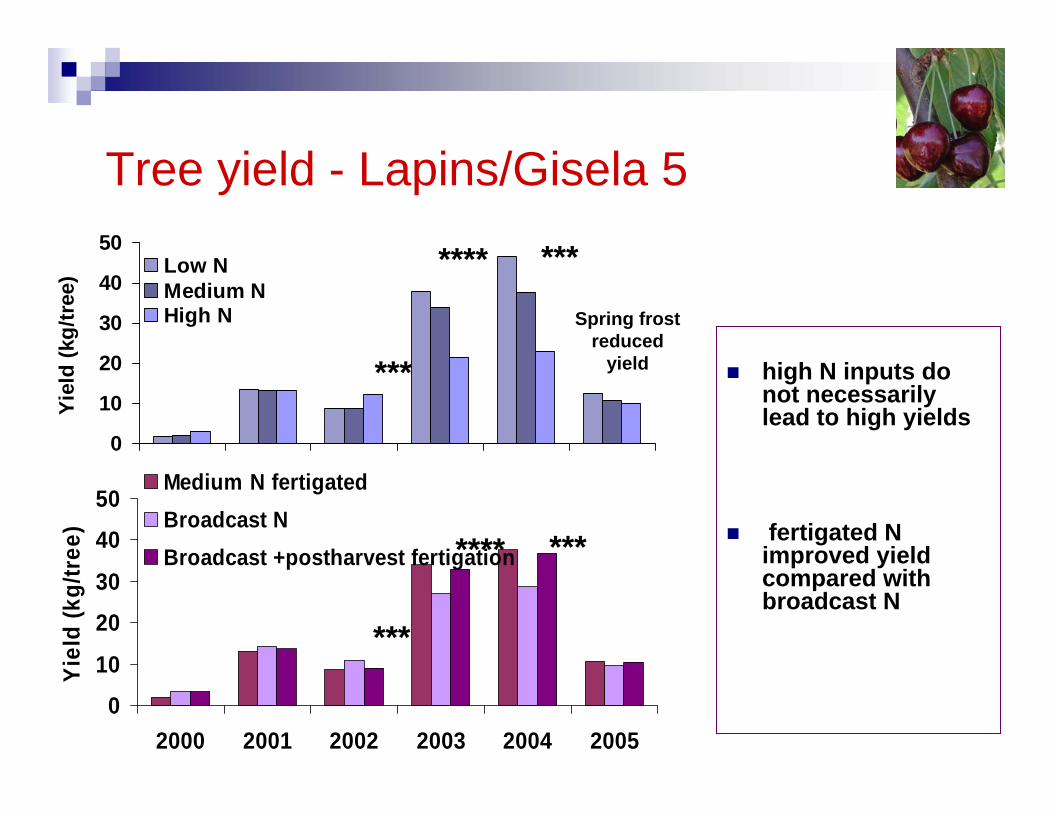
Tree yield - Lapins/Gisela 5
high N inputs do not necessarily lead to high yields
fertigated N improved yield compared with broadcast N
0
10
20
30
40
50
2000 2001 2002 2003 2004 2005
Yiel
d (k
g/tr
ee)
Medium N fertigatedBroadcast NBroadcast +postharvest fertigation
***
**** ***
Spring frost reduced
yield
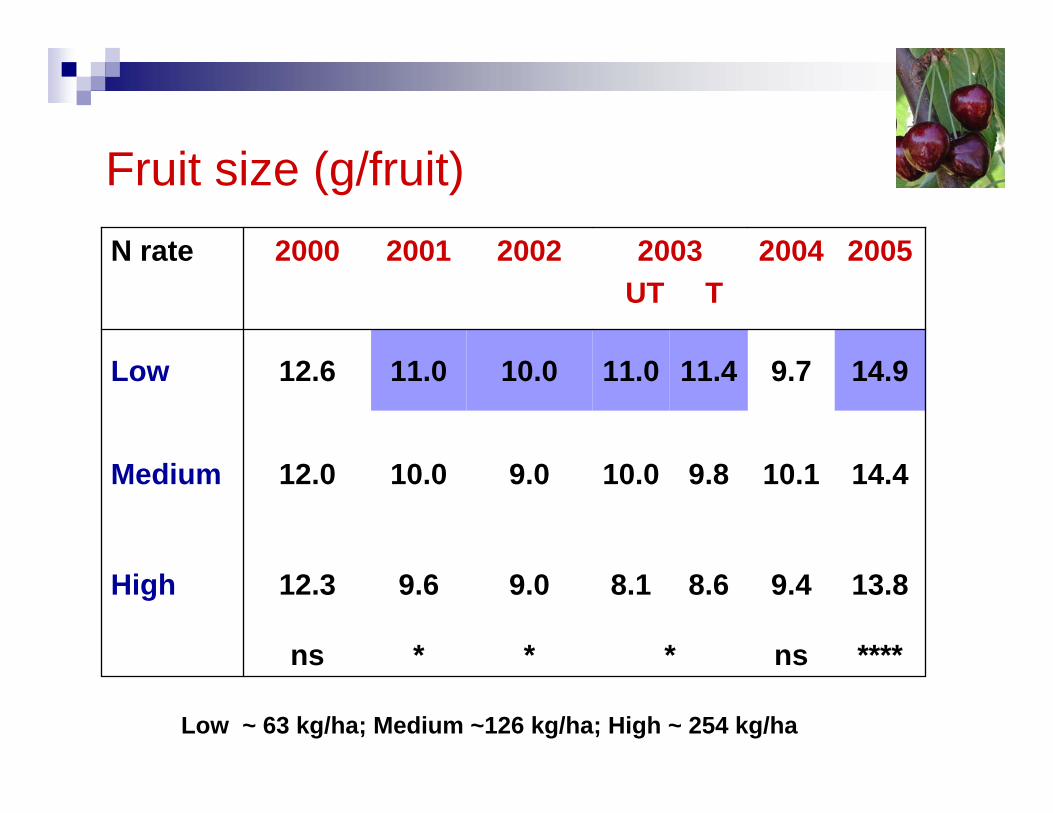
ns
9.4
10.1
9.7
2004
****
13.8
14.4
14.9
2005
8.68.19.09.612.3High
9.8
11.4
***ns
10.09.010.012.0Medium
11.010.011.012.6Low
2003 UT T
200220012000N rate
Low ~ 63 kg/ha; Medium ~126 kg/ha; High ~ 254 kg/ha
Fruit size (g/fruit)
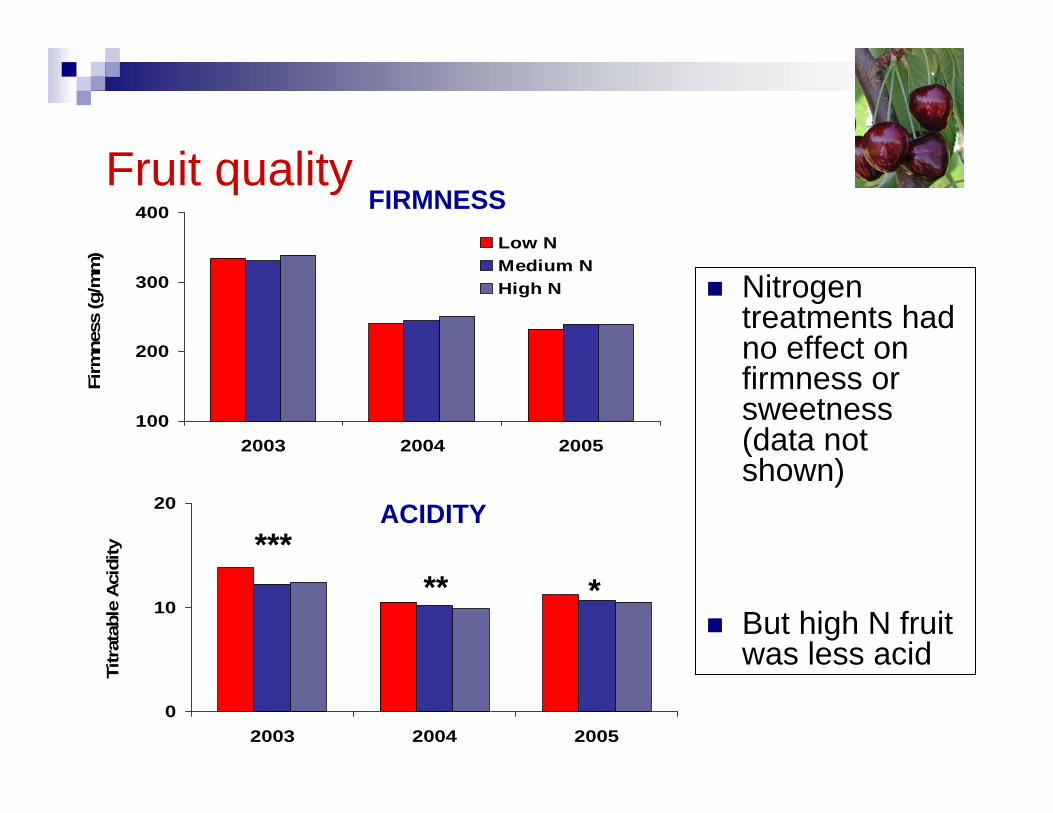
Fruit quality
Nitrogen treatments had no effect on firmness or sweetness (data not shown)
But high N fruit was less acid
100
200
300
400
2003 2004 2005
Firm
ness
(g/m
m) Low N
Medium NHigh N
FIRMNESS
0
10
20
2003 2004 2005
Titr
atab
le A
cidi
ty ***
**
ACIDITY
*
Boronvery mobile
Narrow range between sufficiency and deficiency
Mobile nutrients – N, B
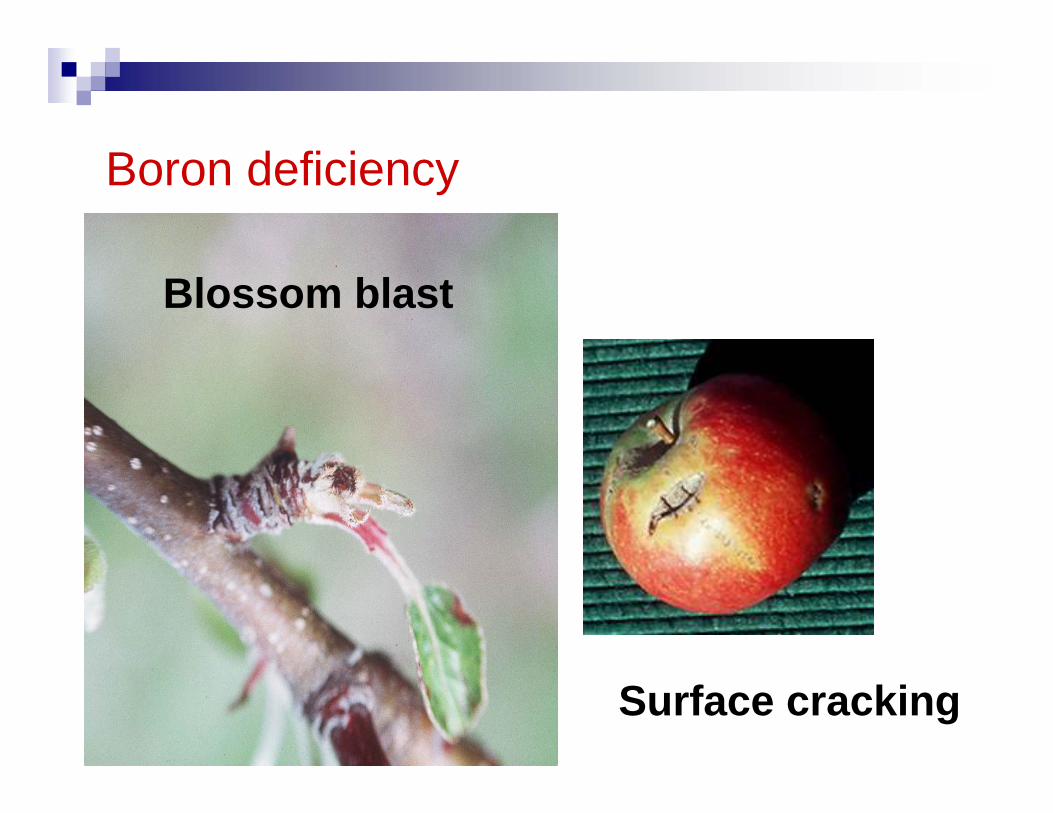
Blossom blast
Surface cracking
Boron deficiency
0
0.2
0.4
0.6
0.8
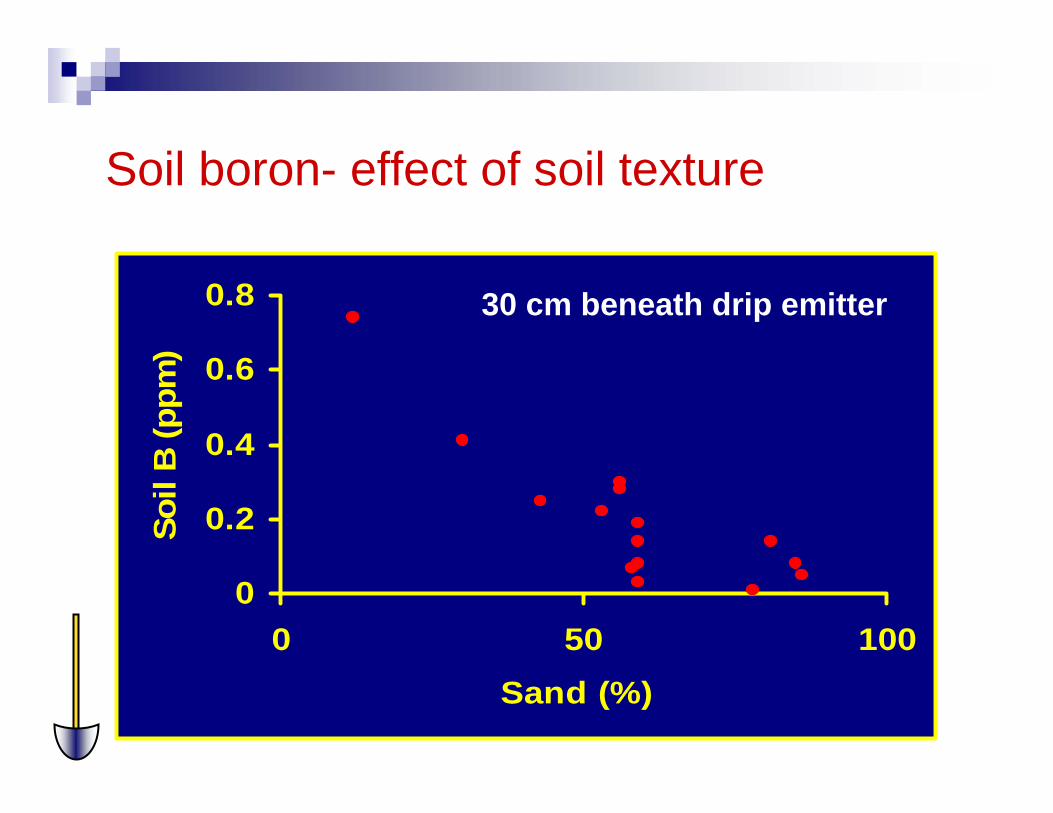
0 50 100Sand (%)
Soil
B (p
pm)
Soil boron- effect of soil texture
30 cm beneath drip emitter
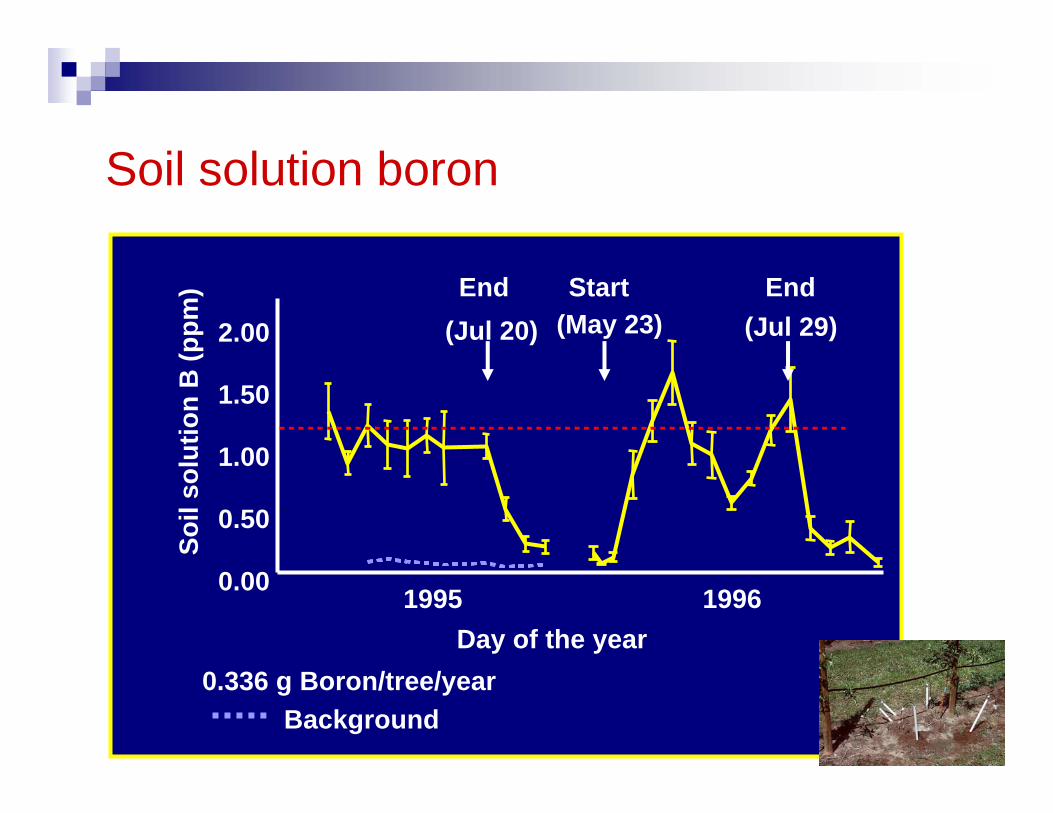
Day of the year0.336 g Boron/tree/year
Background
0.00
0.50
1.00
1.50
2.00
Soil
solu
tion
B (p
pm) End
(Jul 29)Start
(May 23)
1995 1996
End(Jul 20)
Soil solution boron
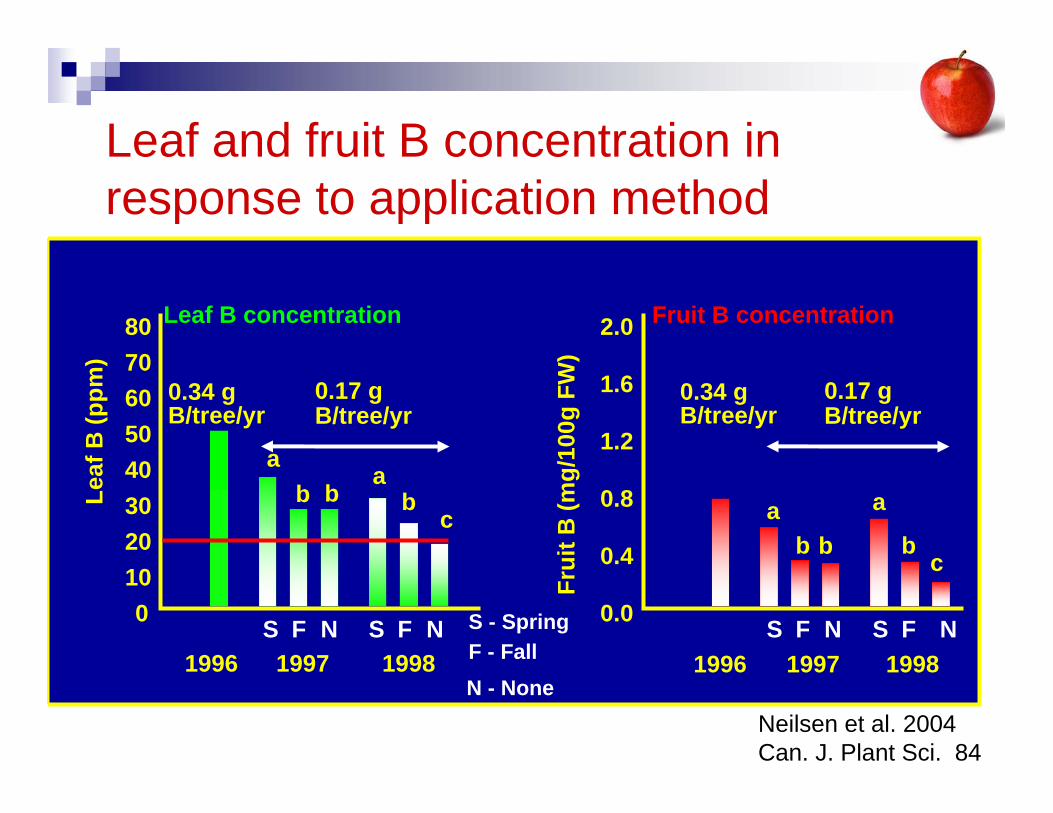
S - SpringF - FallN - None
01020304050607080
Leaf
B (p
pm)
Leaf B concentration
1996 1997S F N
0.34 g B/tree/yr
ab b
0.17 g B/tree/yr
1998S F N
ab
c
Frui
t B (m
g/10
0g F
W)
0.0
0.4
0.8
1.2
1.6
2.0 Fruit B concentration
1996 1997
ab b
1998
0.34 g B/tree/yr
0.17 g B/tree/yr
S F N S F N
a
bc
Leaf and fruit B concentration in response to application method
Neilsen et al. 2004Can. J. Plant Sci. 84
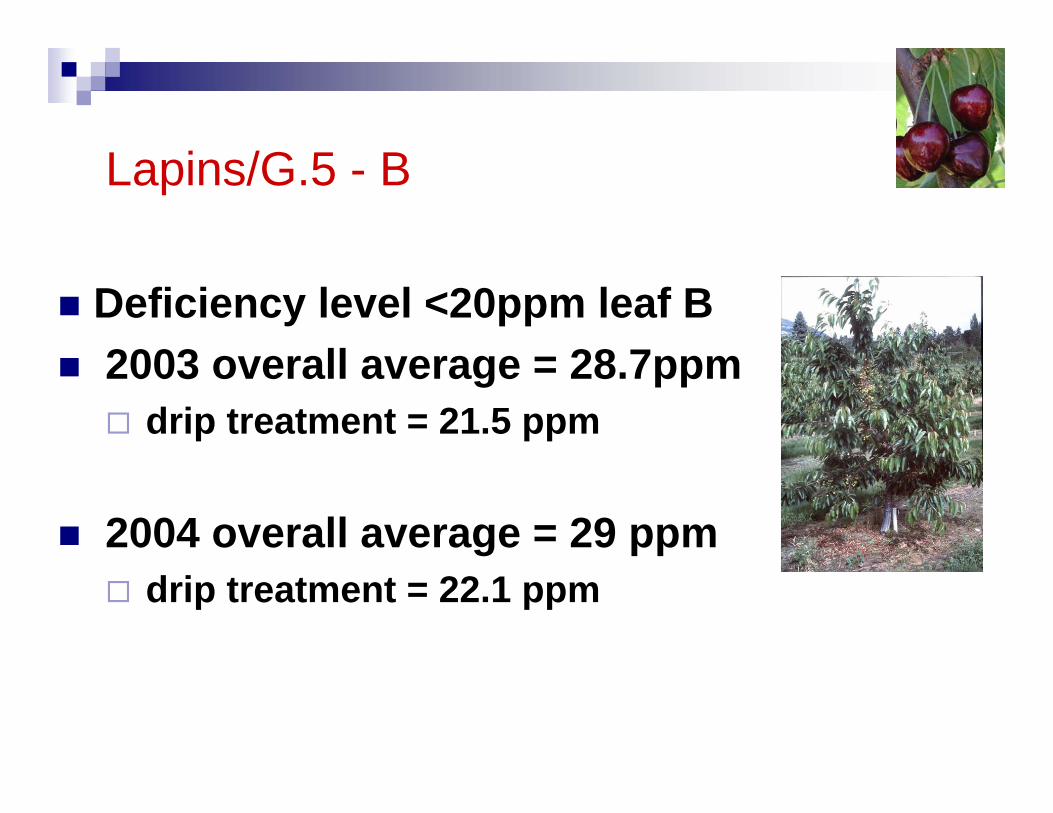
Lapins/G.5 - B
Deficiency level <20ppm leaf B2003 overall average = 28.7ppm
drip treatment = 21.5 ppm
2004 overall average = 29 ppmdrip treatment = 22.1 ppm
Immobile nutrients
Phosphorus and potassiumimmobile
much less information available on internal cycling and uptake patterns than N
Spatially targeted applications required
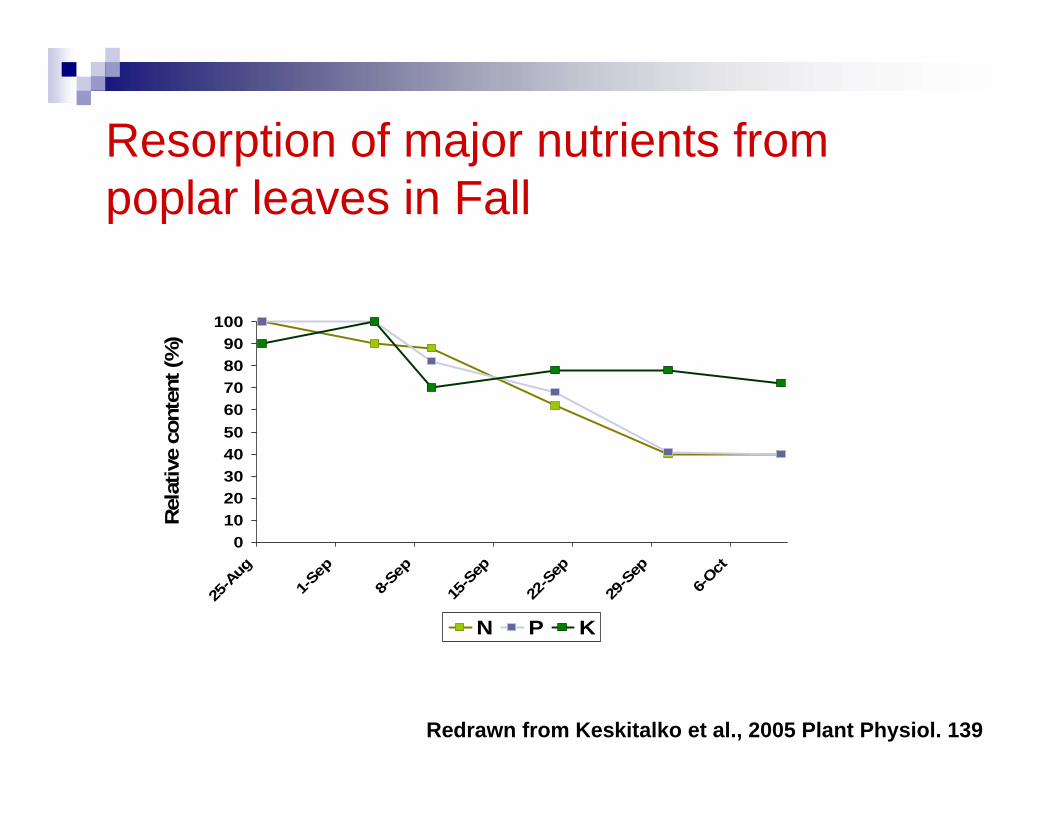
Resorption of major nutrients from poplar leaves in Fall
0102030405060708090
100
25-A
ug
1-Sep
8-Sep
15-S
ep
22-S
ep
29-S
ep
6-Oct
Rel
ativ
e co
nten
t (%
)
N P K
Redrawn from Keskitalko et al., 2005 Plant Physiol. 139
130 160 190 220
Day of the year
200
0
150
100
50
Soil
P (p
pm)
Year 1Year 2Year 3
Single application
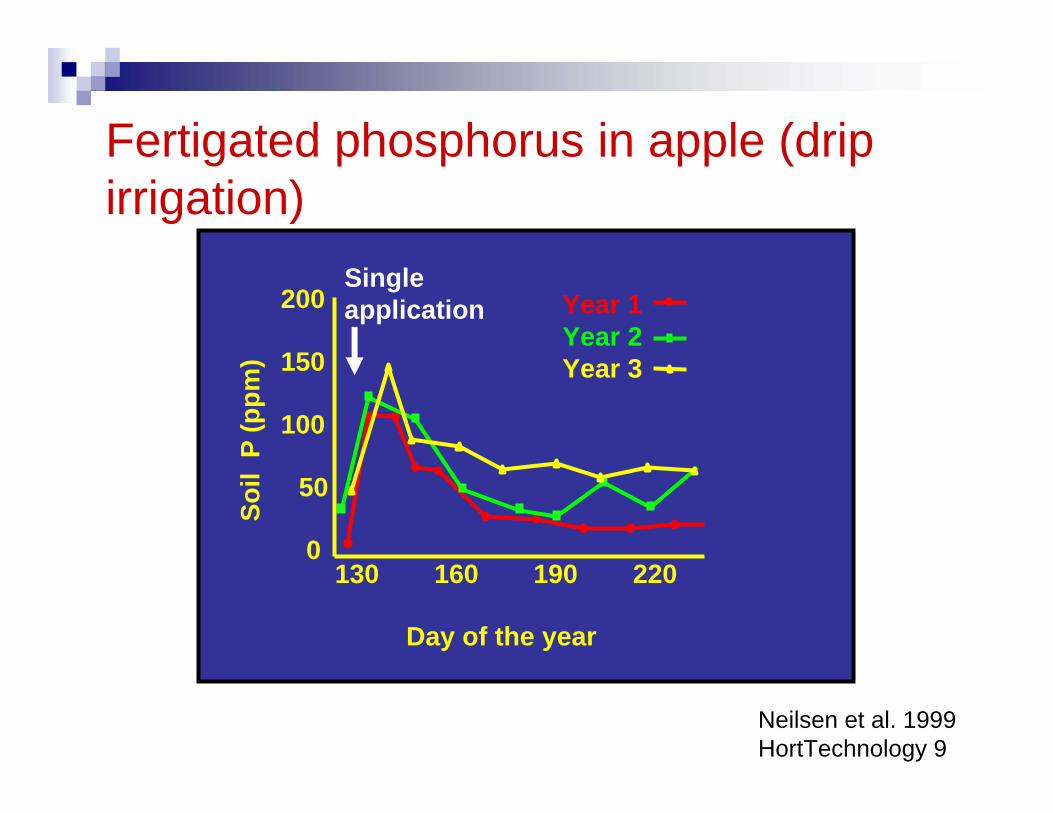
Fertigated phosphorus in apple (drip irrigation)
Neilsen et al. 1999HortTechnology 9
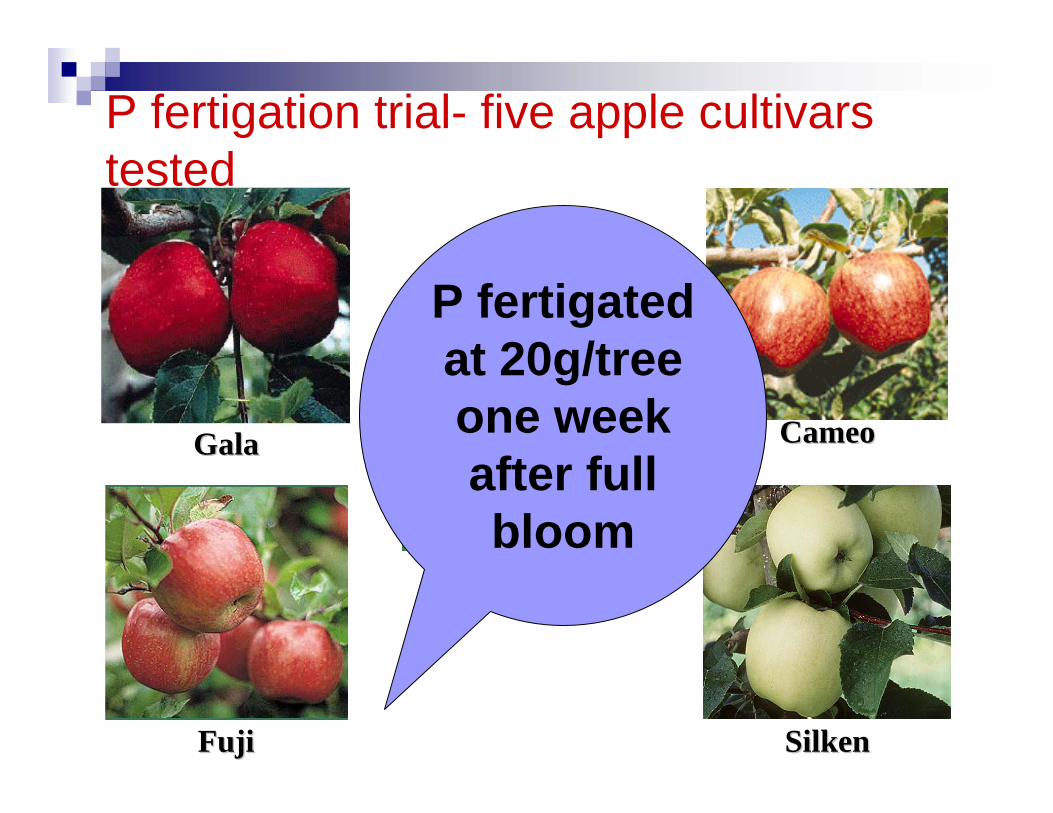
GalaGala
FujiFuji
CameoCameo
AmbrosiaAmbrosia
SilkenSilken
P fertigation trial- five apple cultivars tested
P fertigatedat 20g/tree one week after full bloom
Cum
ulat
ive
Yie
ld(k
g/tre
e)
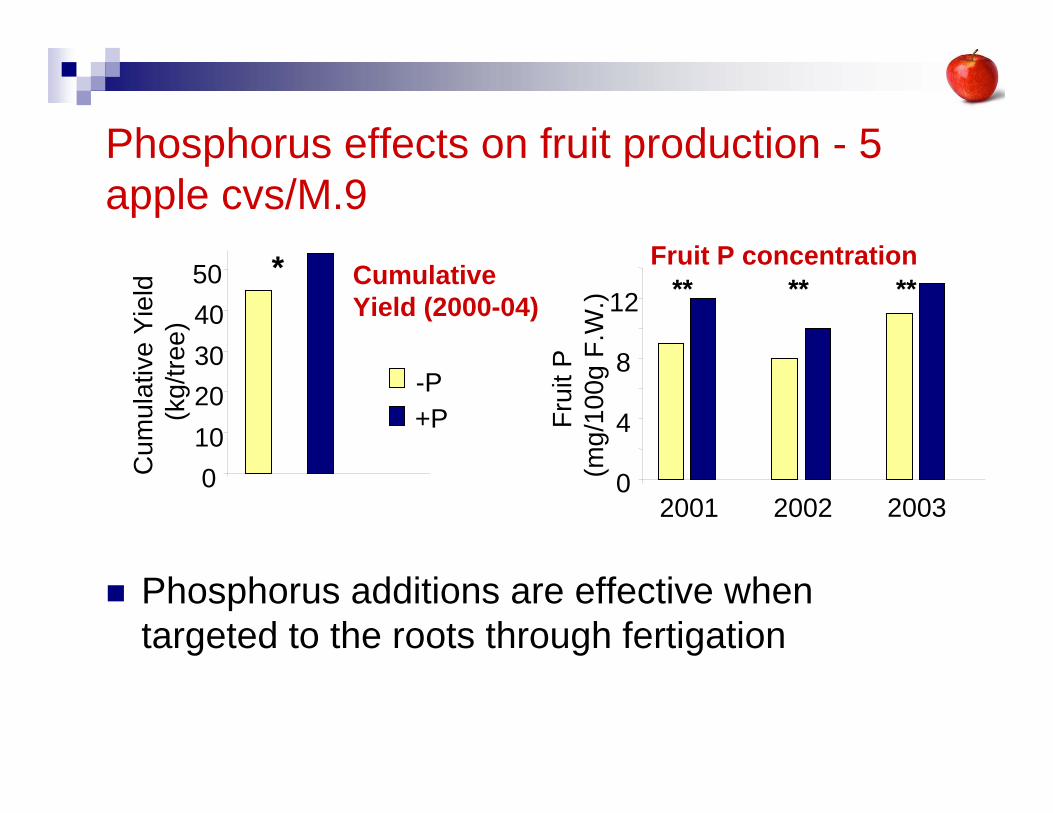
Cumulative Yield (2000-04)
0
-P+P
1020304050 *
0
4
8
12
2001 2002 2003
Frui
t P(m
g/10
0g F
.W.)
Fruit P concentration ** ** **
Phosphorus effects on fruit production - 5 apple cvs/M.9
Phosphorus additions are effective when targeted to the roots through fertigation
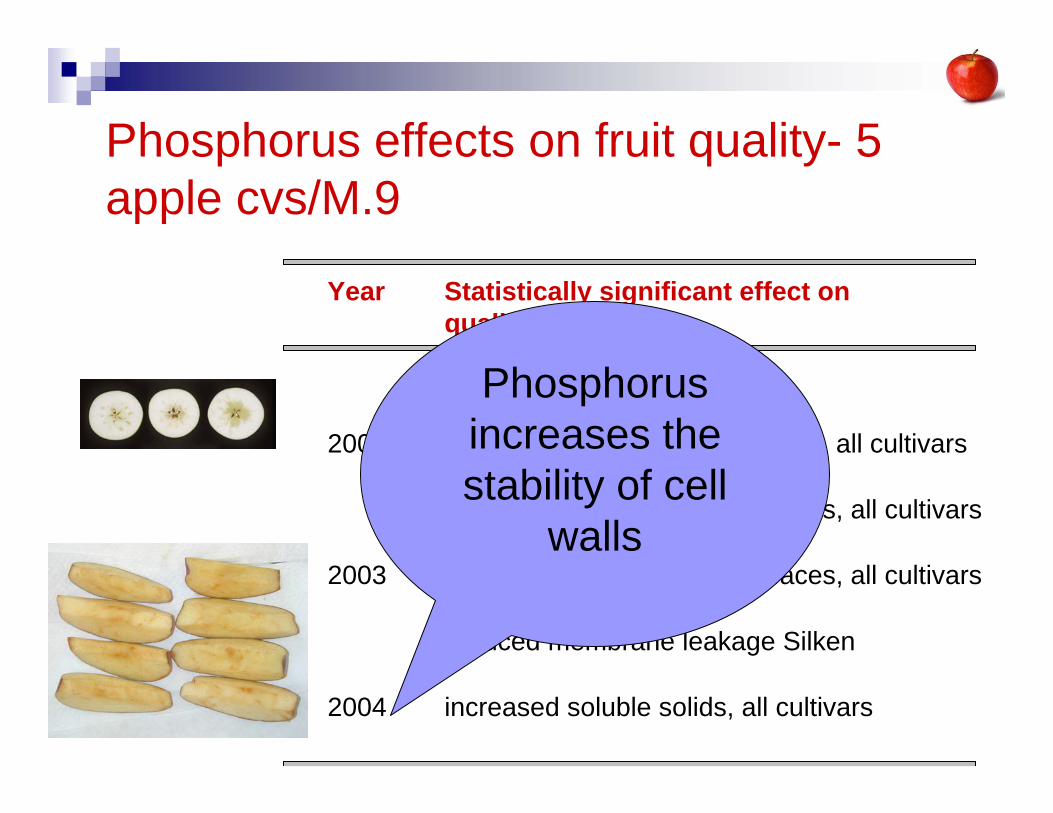
Year Statistically significant effect on quality
2002 reduced incidence of water core, all cultivars
reduced browning of cut surfaces, all cultivars
2003 reduced browning of cut surfaces, all cultivars
reduced membrane leakage Silken
2004 increased soluble solids, all cultivars
Phosphorus effects on fruit quality- 5 apple cvs/M.9
Phosphorus increases the stability of cell
walls
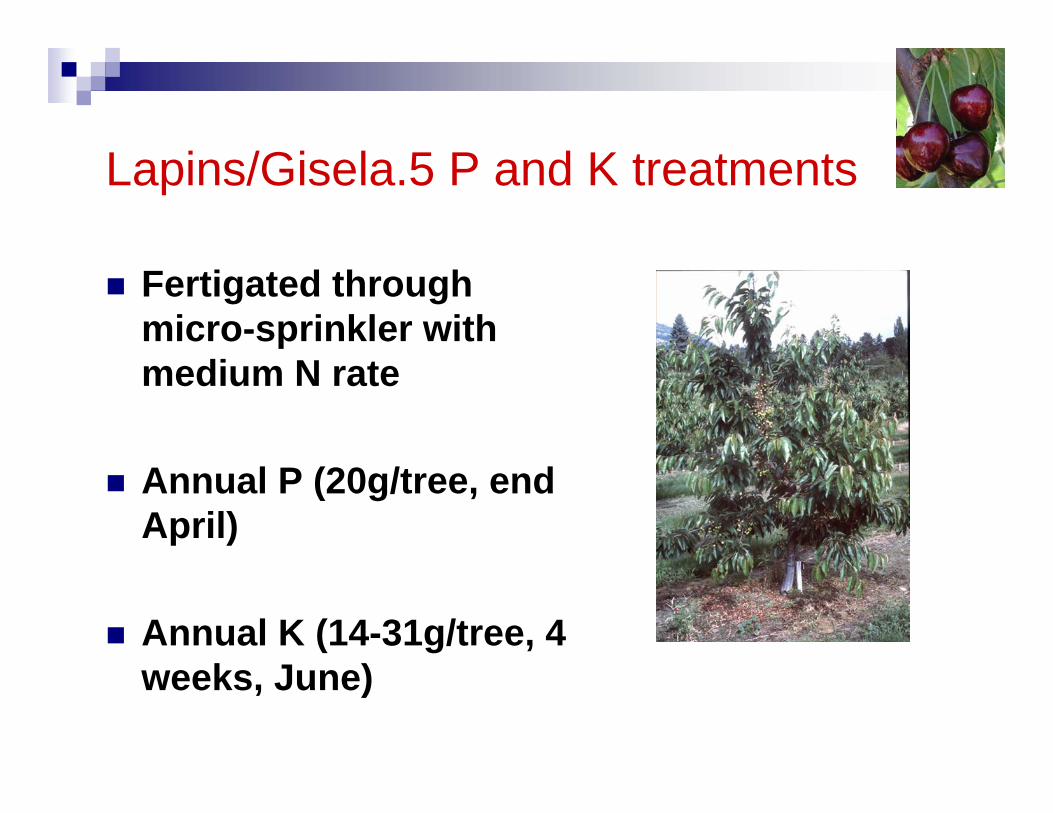
Lapins/Gisela.5 P and K treatments
Fertigated through micro-sprinkler with medium N rate
Annual P (20g/tree, end April)
Annual K (14-31g/tree, 4 weeks, June)
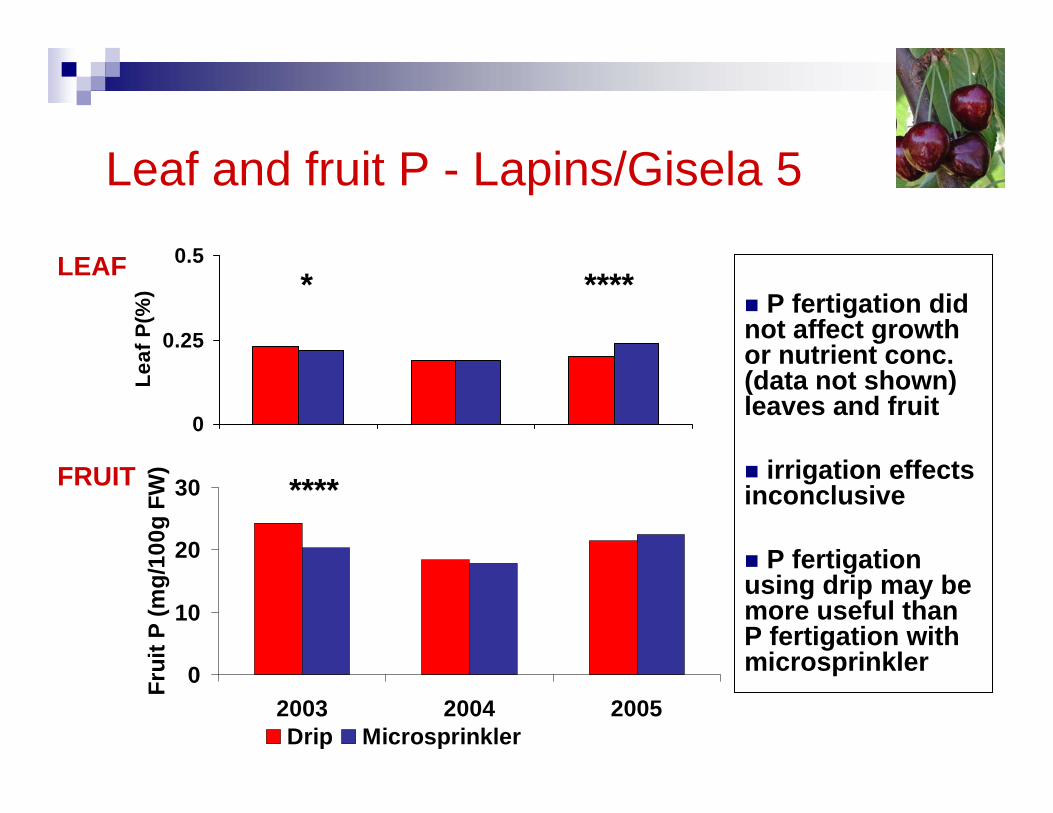
Leaf and fruit P - Lapins/Gisela 5
0
0.25
0.5
Leaf
P(%
) *
0
10
20
30
2003 2004 2005
Frui
t P (m
g/10
0g F
W)
Drip Microsprinkler
LEAF
FRUIT
P fertigation did not affect growth or nutrient conc. (data not shown) leaves and fruit
irrigation effects inconclusive
P fertigationusing drip may be more useful than P fertigation with microsprinkler
****
****
PotassiumManagement options

0
5
10
15
20
YEAR 1 YEAR 2 YEAR 3 YEAR 4
0 g K/tree/year15 g K/tree/year
Soil
solu
tion
K (p
pm)
Soil solution K concentration in response to fertigation under drip
Neilsen et al. 2004 JASHS 80
0g K/tree/year15g K/tree/year
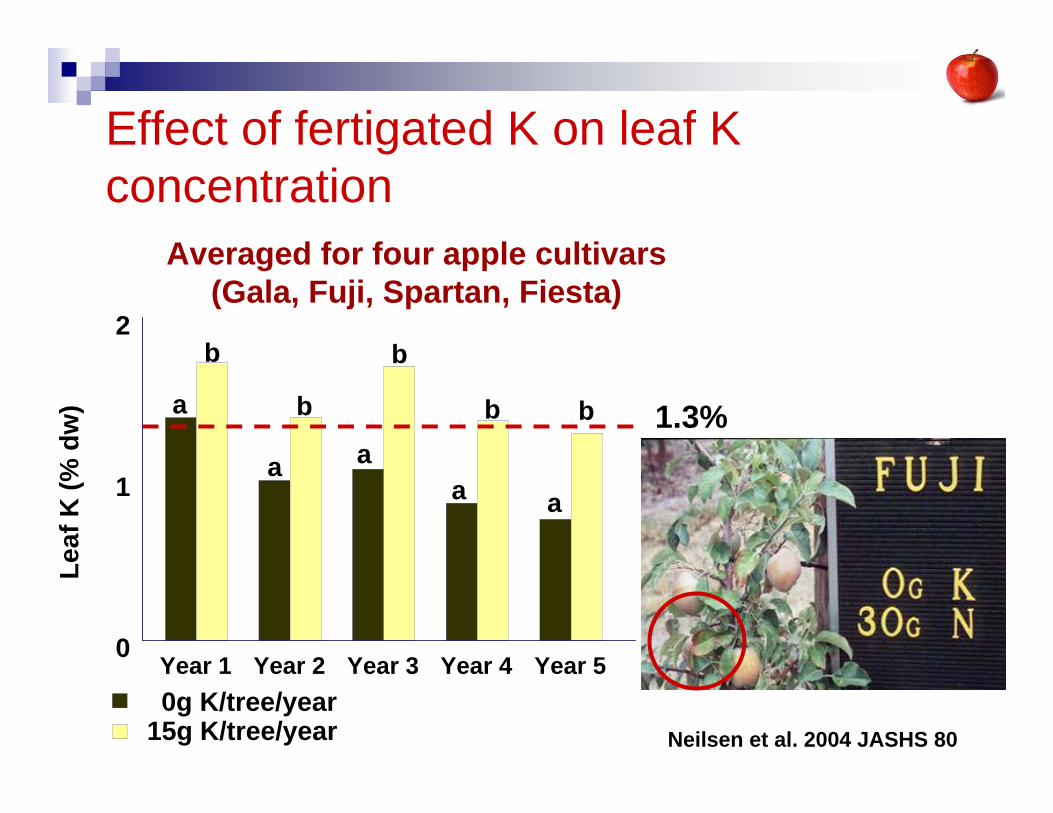
Averaged for four apple cultivars (Gala, Fuji, Spartan, Fiesta)
Effect of fertigated K on leaf K concentration
Year 1 Year 2 Year 3 Year 4 Year 50
1
2
Leaf
K (%
dw
)
b
aa
a
a a
b bb
b
1.3%
Neilsen et al. 2004 JASHS 80
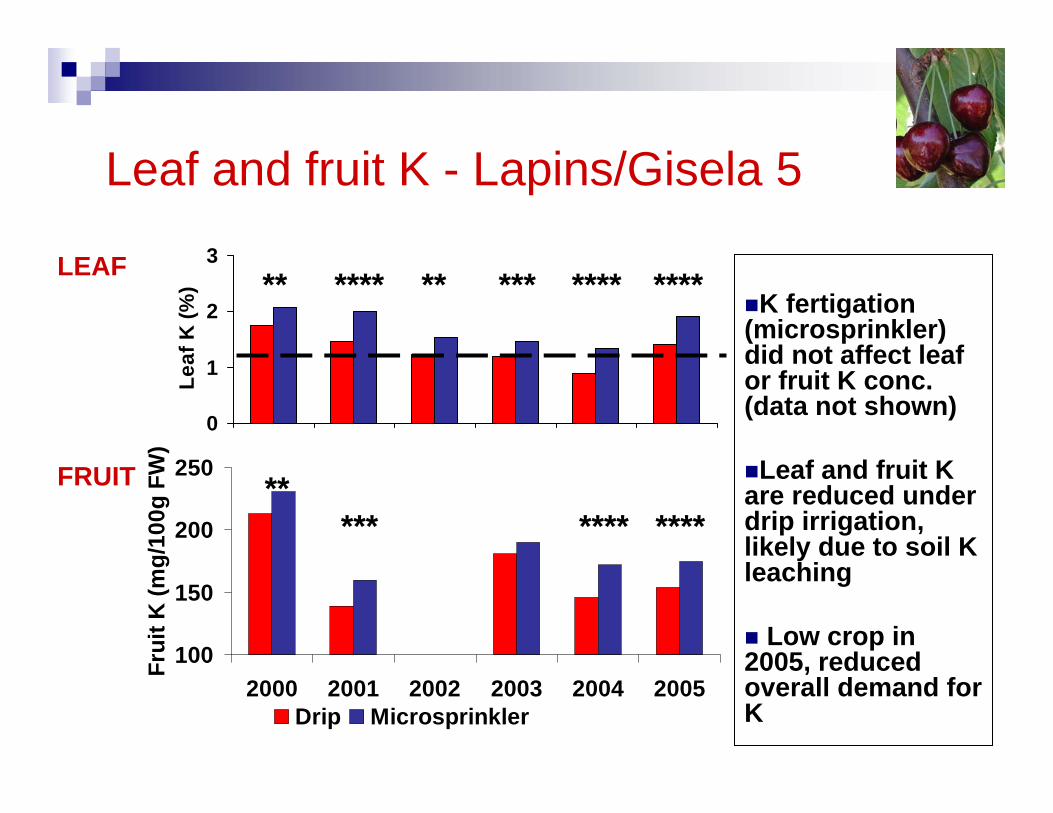
Leaf and fruit K - Lapins/Gisela 5
0
1
2
3
Leaf
K (%
) ** *** ****** ****
100
150
200
250
2000 2001 2002 2003 2004 2005
Frui
t K (m
g/10
0g F
W)
Drip Microsprinkler
*********
LEAF
FRUIT
K fertigation(microsprinkler) did not affect leaf or fruit K conc. (data not shown)
Leaf and fruit K are reduced under drip irrigation, likely due to soil K leaching
Low crop in 2005, reduced overall demand for K
****
****
Nutrient management and soil quality
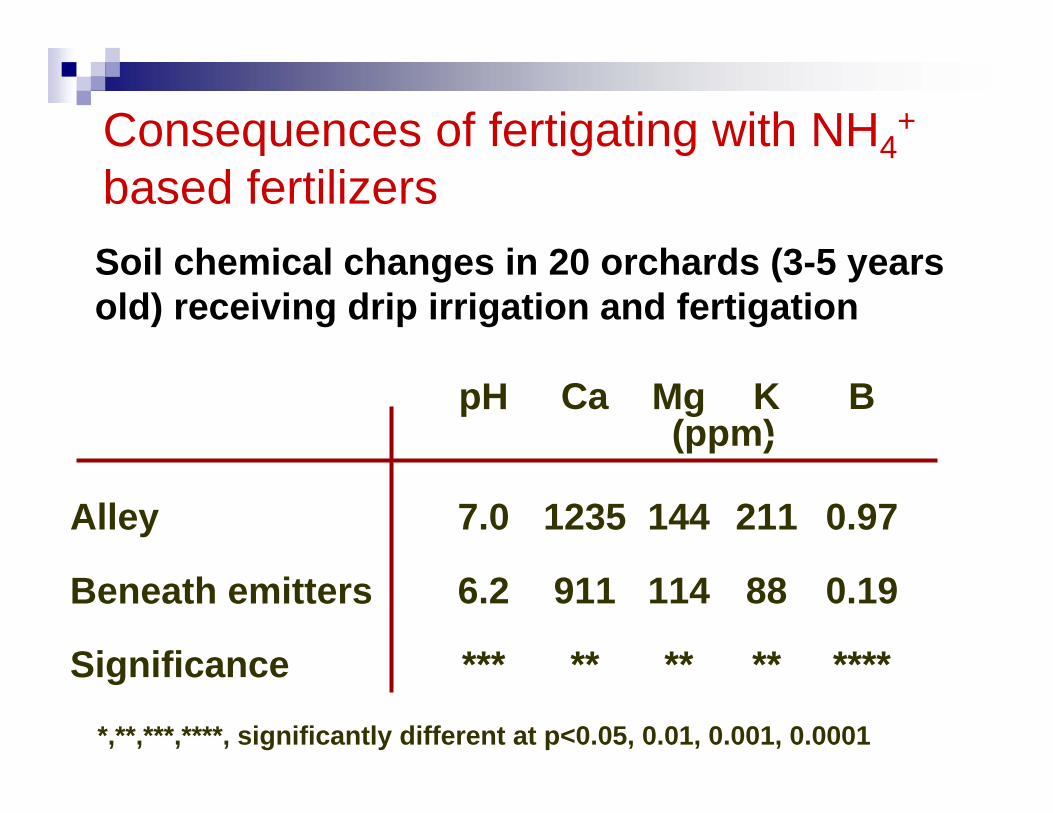
Alley
Beneath emitters
Significance
(ppm)pH
7.0
6.2
***
B
0.97
0.19
****
K
211
88
**
Mg
144
114
**
Ca
1235
911
**
*,**,***,****, significantly different at p<0.05, 0.01, 0.001, 0.0001
Soil chemical changes in 20 orchards (3-5 years old) receiving drip irrigation and fertigation
Consequences of fertigating with NH4+
based fertilizers
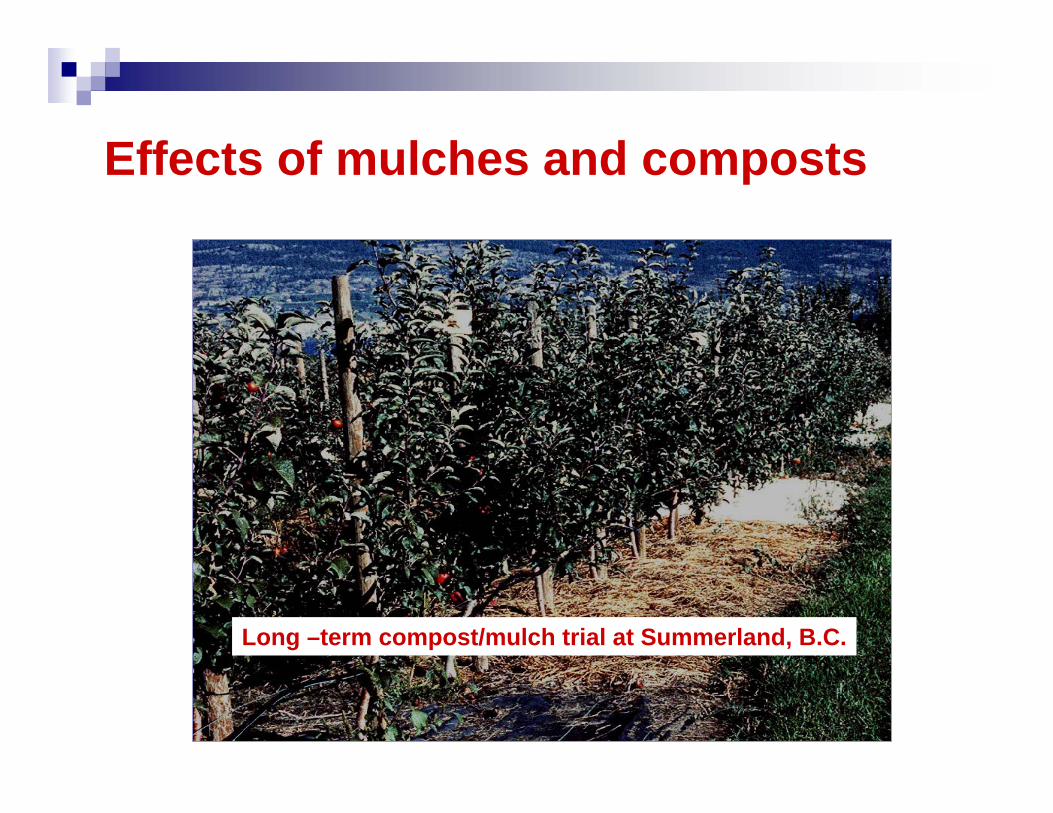
Effects of mulches and composts
Long –term compost/mulch trial at Summerland, B.C.
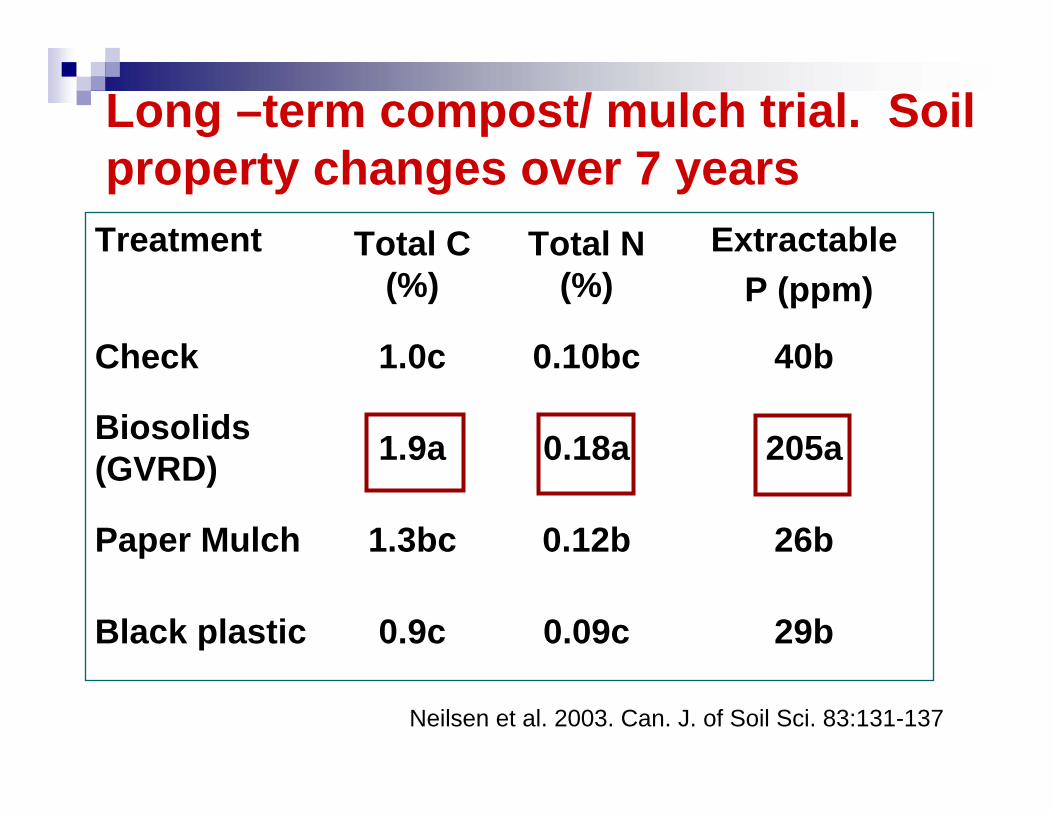
29b0.09c0.9cBlack plastic
26b0.12b1.3bcPaper Mulch
205a0.18a1.9aBiosolids(GVRD)
40b0.10bc1.0cCheck
ExtractableP (ppm)
Total N (%)
Total C (%)
Treatment
Neilsen et al. 2003. Can. J. of Soil Sci. 83:131-137
Long –term compost/ mulch trial. Soil property changes over 7 years
Water and nutrient management are linked
Retention of nutrients in the root zone for as long as possible will improve nutrient use efficiency
fertilizer applications are timed to meet tree demandwater applications are scheduled to meet
evaporative demand
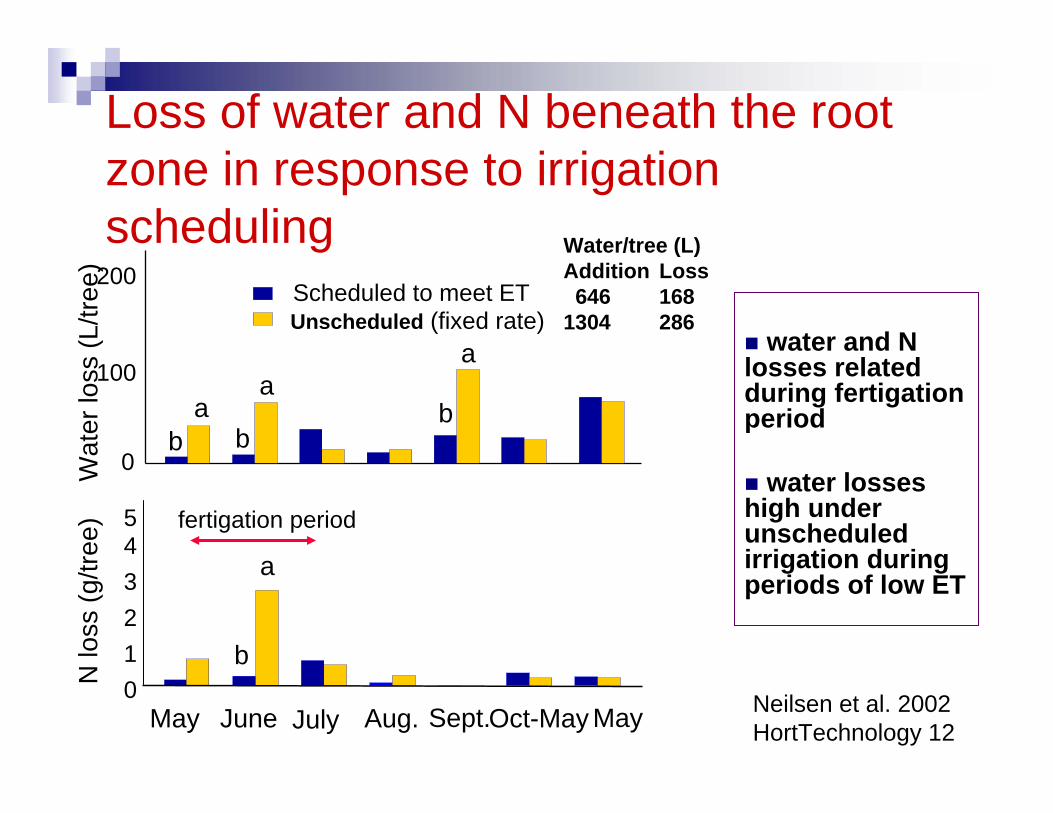
Loss of water and N beneath the root zone in response to irrigation scheduling
Wat
er lo
ss (L
/tree
)
aa
a
0
100
200
0
2345
N lo
ss (g
/tree
)
a
fertigation period
1
May June July Aug. Sept.Oct-May May
Scheduled to meet ETUnscheduled (fixed rate)
Water/tree (L)Addition Loss
646 1681304 286
b
b
bb
Neilsen et al. 2002HortTechnology 12
water and N losses related during fertigationperiod
water losses high under unscheduled irrigation during periods of low ET
Drip Microsprinkler
b
a
b
a a
b
a
b0
40
80
120
Wat
er d
rain
age
(L/tr
ee)
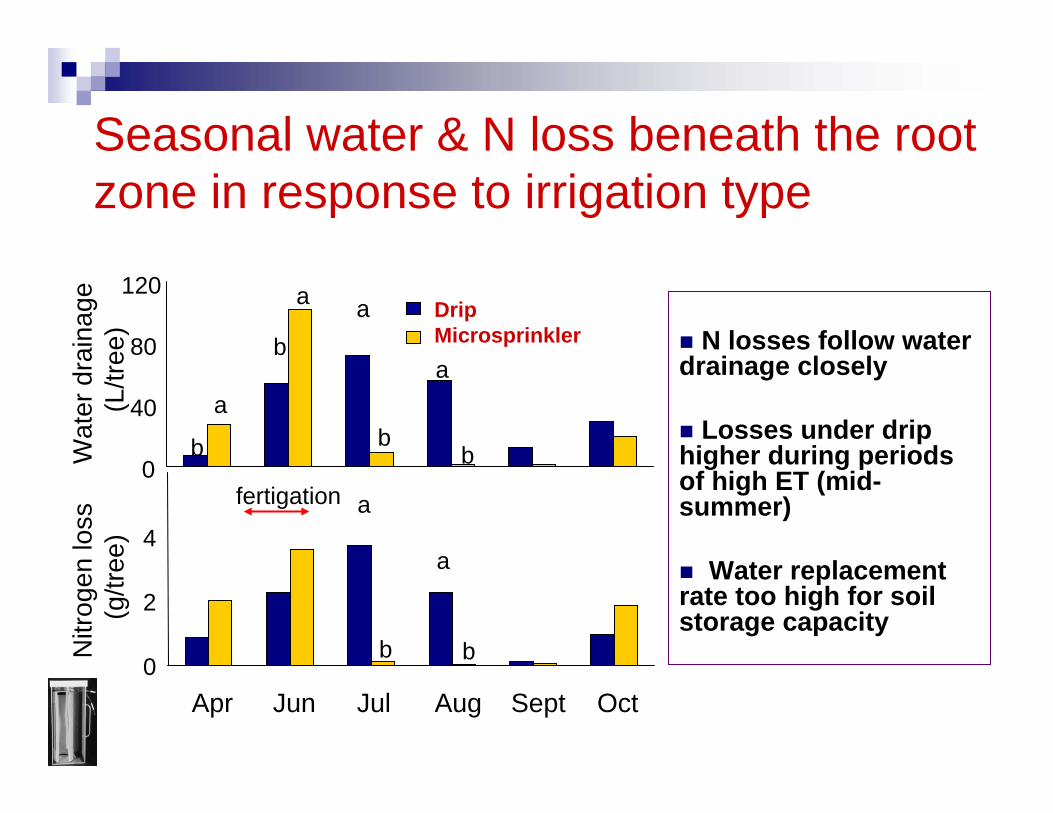
Seasonal water & N loss beneath the root zone in response to irrigation type
0
2
4
Apr Jun Jul Aug Sept Oct
Nitr
ogen
loss
(g
/tree
)
a
b
a
b
fertigation
N losses follow water drainage closely
Losses under drip higher during periods of high ET (mid-summer)
Water replacement rate too high for soil storage capacity
Day of the year
0
0.5
1
1.5
2
2.5
67 130 138 165 207 236 264 291
DripMulch+amendment+dripMicrosprinklerMulch+amendment+M/S
Orth
o-P
loss
(g/tr
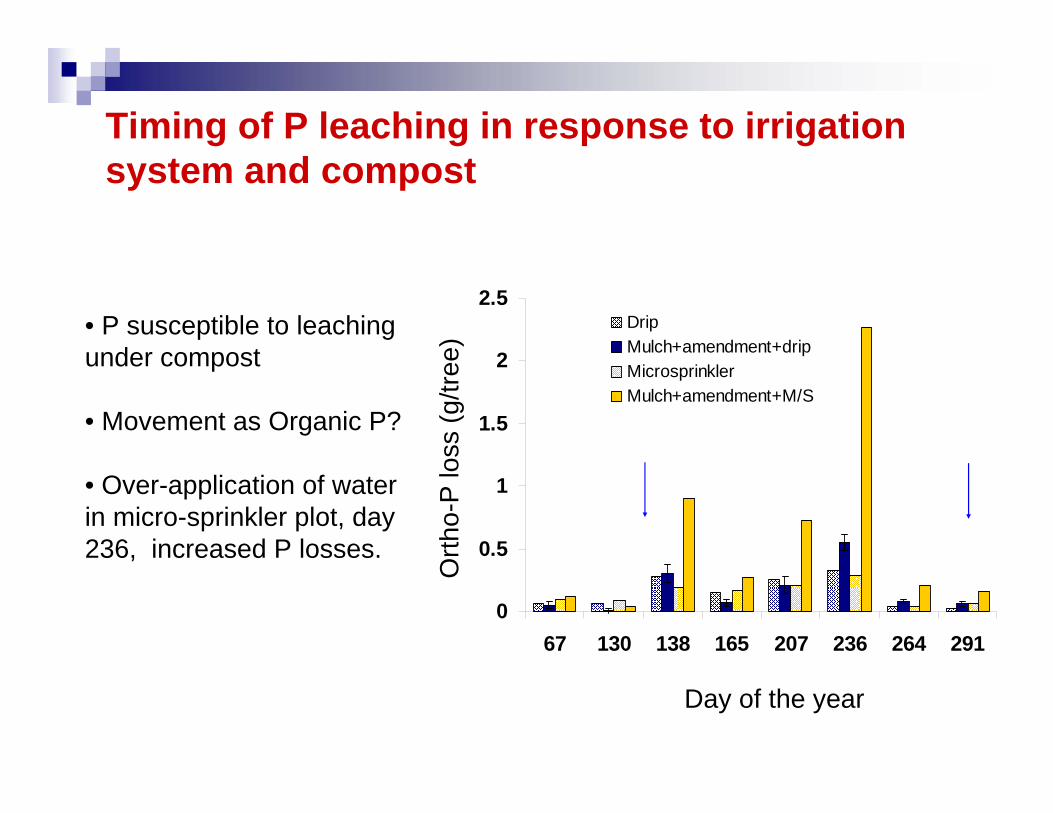
ee)• P susceptible to leaching
under compost
• Movement as Organic P?
• Over-application of water in micro-sprinkler plot, day 236, increased P losses.
Timing of P leaching in response to irrigation system and compost
ConclusionsMobile nutrients
Water management (scheduling, irrigation method) and timing of N application determines the retention of N in the root zone and availability.
Aided by improved understanding of tree N cycling and time of root uptake
Fertigation allows precise timing of N additions and is more effective than broadcast applications
Very high N applications, may be detrimental to production
B deficiency more prevalent in sandy soils and can be managed by fertigation –with care
Conclusions Less mobile nutrients
Fertigation may improve the mobility and effectiveness of P applications, but only with drip irrigationDrip irrigation, may cause soil K leaching and reduce availability – K fertigaitonthrough drip can offset thisFertigating K through microsprinkler does not improve K uptakeSize controlling rootstocks may take be more susceptible to K deficiencyP leaching may occur when organic amendments are used
International Dwarf Fruit Tree Association
Washington Tree Fruit Research Commission
Okanagan Kootenay Cherry Fruit Growers Association
Agriculture and Agri-food Canada Matching Investment Initiative MII
Financial support
Thank you