Embed Size (px)
Citation preview
Macquarie Group Limited
Richard Sheppard, Deputy Managing Director Stuart Green, Executive Director, Head of Investor Relations
Goldman Sachs JBWere Fifth Annual Australian Investment Forum September 2009
2
Disclaimer
This material has been prepared for professional investors.
The firm preparing this report has not taken into account any customer’s particular investment objectives, financial resources or other relevant circumstances and the opinions and recommendations herein are not intended to represent recommendations of particular investments to particular customers. All securities transactions involve risks, which include (among others) the risk of adverse or unanticipated market, financial or political developments and, in international transactions, currency risk. Due care and attention has been used in the preparation of forecast information. However, actual results may vary from forecasts and any variation may be materially positive or negative. Forecasts, by their very nature, are subject to uncertainty and contingencies many of which are outside the control of Macquarie Group Limited (“Macquarie”).
3
Agenda
FY09 Review 4.
1Q10 Update 3.
Recent Activity2.
About Macquarie1.
1. About Macquarie
5
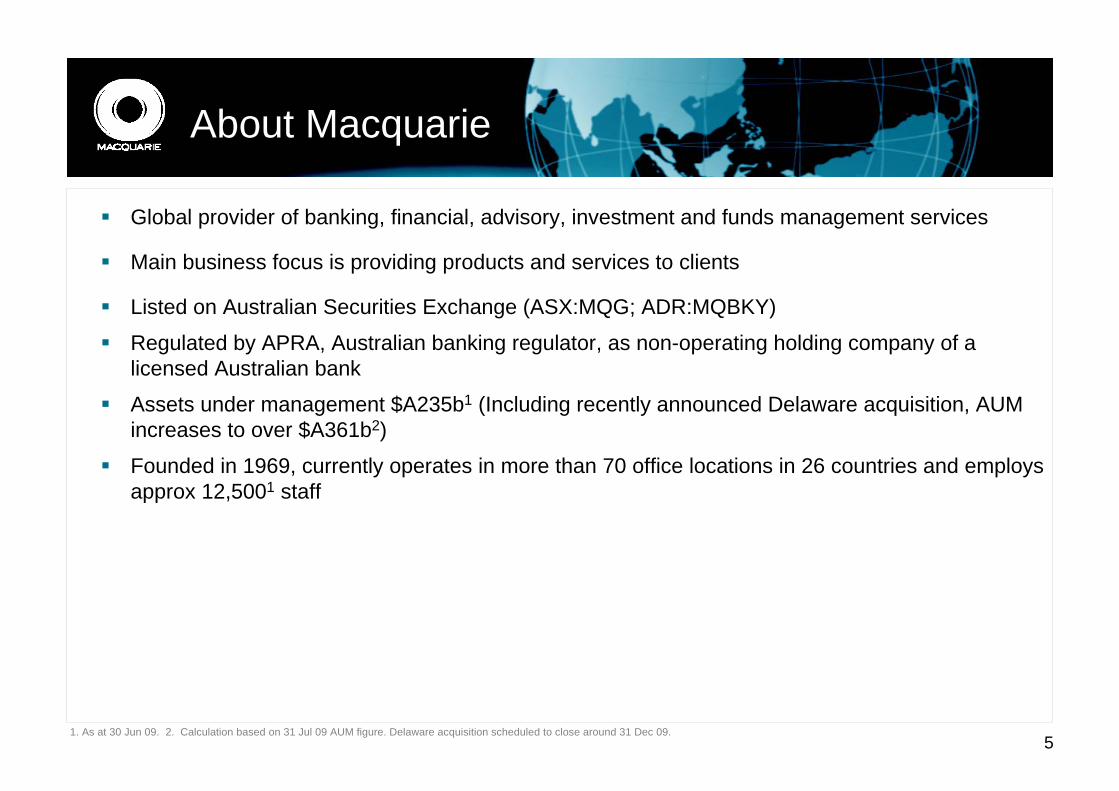
About Macquarie
Global provider of banking, financial, advisory, investment and funds management services
Main business focus is providing products and services to clients
Listed on Australian Securities Exchange (ASX:MQG; ADR:MQBKY)
Regulated by APRA, Australian banking regulator, as non-operating holding company of a licensed Australian bank
Assets under management $A235b1 (Including recently announced Delaware acquisition, AUM increases to over $A361b2)
Founded in 1969, currently operates in more than 70 office locations in 26 countries and employs approx 12,5001 staff
1. As at 30 Jun 09. 2. Calculation based on 31 Jul 09 AUM figure. Delaware acquisition scheduled to close around 31 Dec 09.
6
0
400
800
1,200
1,600
2,000
2005 2006 2007 2008 2009
$Am
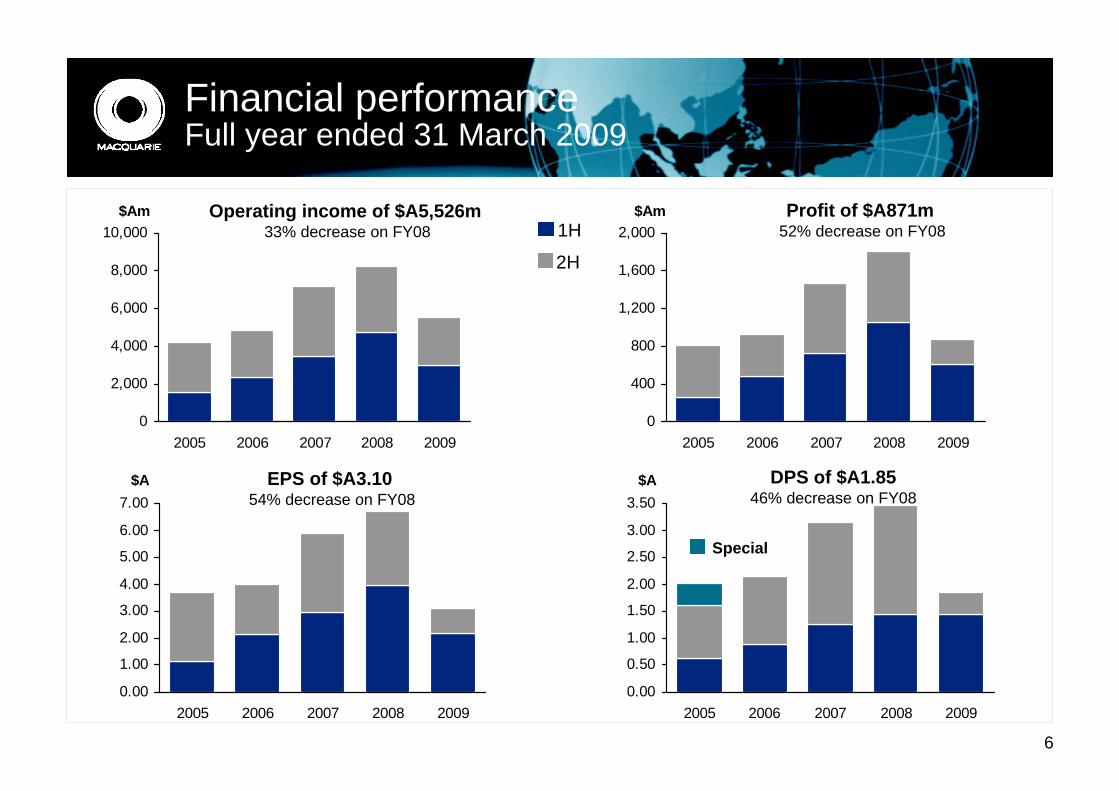
Financial performance Full year ended 31 March 2009
0
2,000
4,000
6,000
8,000
10,000
2005 2006 2007 2008 2009
$Am Profit of $A871m52% decrease on FY08
Operating income of $A5,526m33% decrease on FY08
0.00
1.00
2.00
3.00
4.00
5.00
6.00
7.00
2005 2006 2007 2008 2009
$A EPS of $A3.10 54% decrease on FY08
0.00
0.50
1.00
1.50
2.00
2.50
3.00
3.50
2005 2006 2007 2008 2009
$A DPS of $A1.8546% decrease on FY08
Special
1H
2H
7
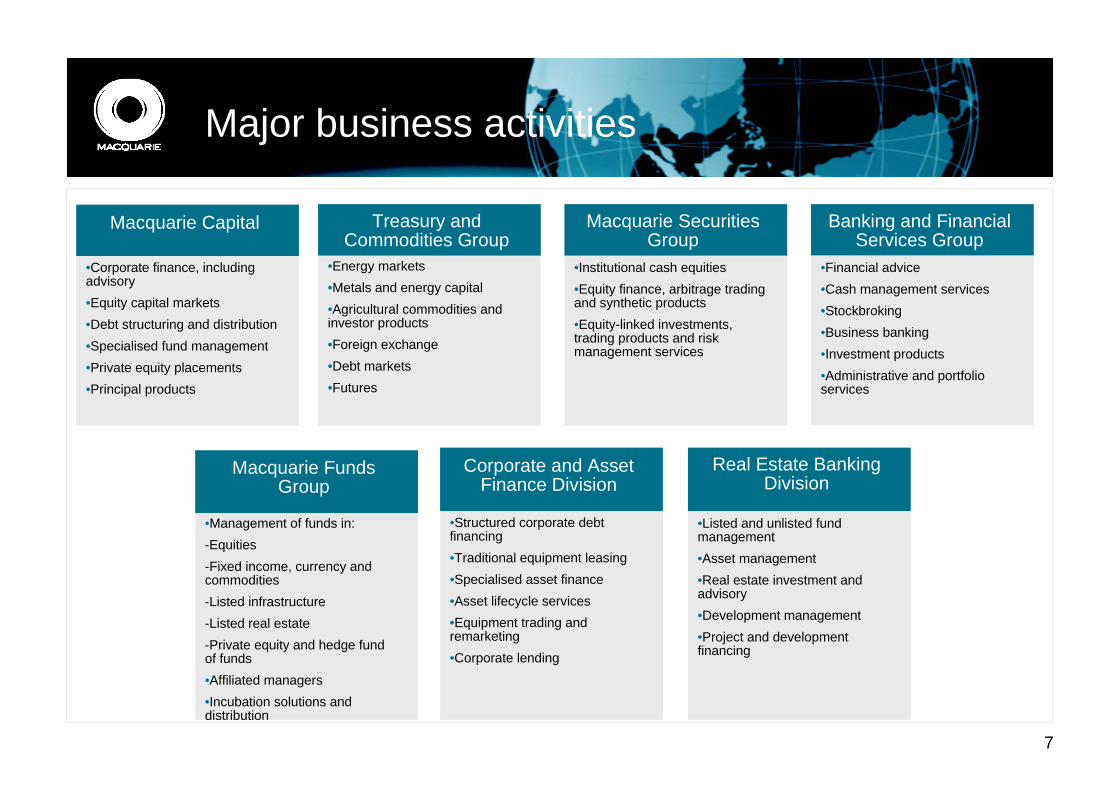
Major business activities
Macquarie Capital Treasury and Commodities Group
Macquarie Securities Group
Banking and Financial Services Group
Macquarie Funds Group
Corporate and Asset Finance Division
Real Estate Banking Division
•Corporate finance, including advisory•Equity capital markets•Debt structuring and distribution•Specialised fund management•Private equity placements•Principal products
•Energy markets•Metals and energy capital•Agricultural commodities and investor products•Foreign exchange•Debt markets•Futures
•Institutional cash equities•Equity finance, arbitrage trading and synthetic products•Equity-linked investments, trading products and risk management services
•Financial advice•Cash management services•Stockbroking•Business banking•Investment products•Administrative and portfolio services
•Management of funds in:-Equities-Fixed income, currency and commodities -Listed infrastructure-Listed real estate-Private equity and hedge fund of funds•Affiliated managers•Incubation solutions and distribution
•Structured corporate debt financing•Traditional equipment leasing•Specialised asset finance•Asset lifecycle services•Equipment trading and remarketing•Corporate lending
•Listed and unlisted fund management•Asset management•Real estate investment and advisory•Development management•Project and development financing
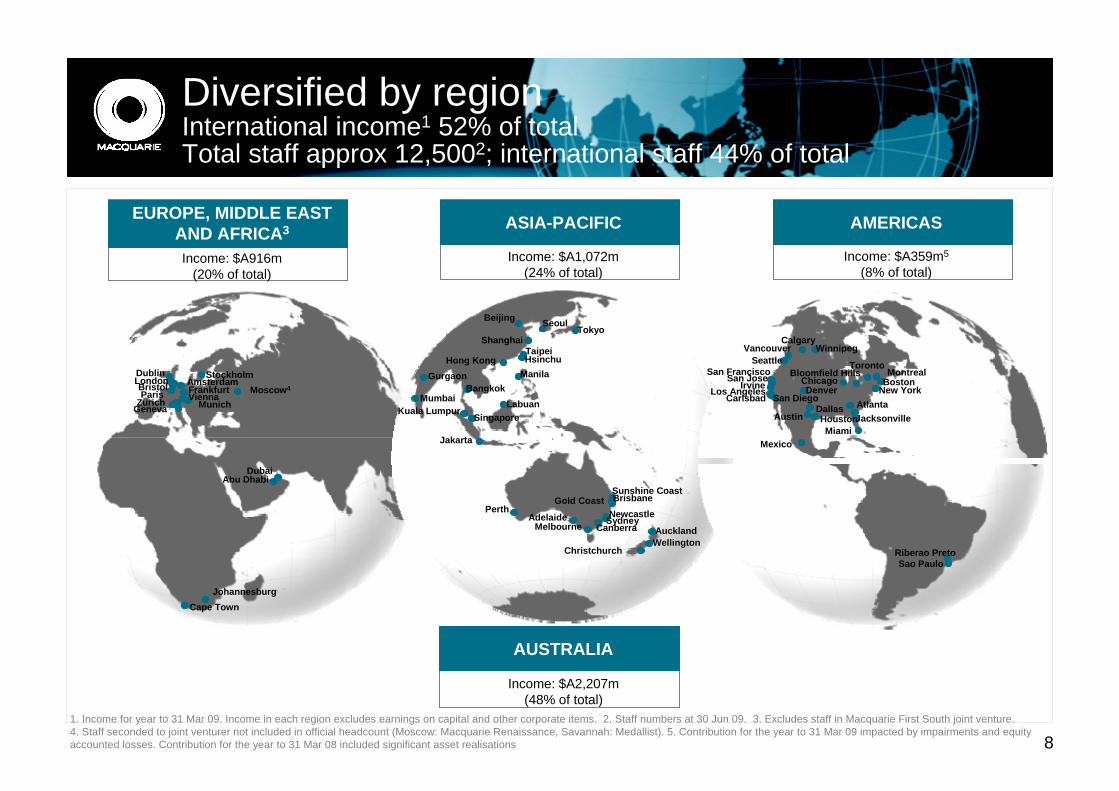
81. Income for year to 31 Mar 09. Income in each region excludes earnings on capital and other corporate items. 2. Staff numbers at 30 Jun 09. 3. Excludes staff in Macquarie First South joint venture. 4. Staff seconded to joint venturer not included in official headcount (Moscow: Macquarie Renaissance, Savannah: Medallist). 5. Contribution for the year to 31 Mar 09 impacted by impairments and equity accounted losses. Contribution for the year to 31 Mar 08 included significant asset realisations
Diversified by regionInternational income1 52% of totalTotal staff approx 12,5002; international staff 44% of total
AUSTRALIA
Income: $A2,207m(48% of total)
EUROPE, MIDDLE EAST AND AFRICA3
Income: $A916m(20% of total)
Income: $A1,072m(24% of total)
ASIA-PACIFIC
Income: $A359m5
(8% of total)
AMERICAS
Dublin
Paris ViennaAmsterdamLondon
Zurich MunichFrankfurt
Geneva
Abu Dhabi
Mumbai
Cape TownJohannesburg
AucklandWellington
Christchurch
Jakarta
BangkokLabuan
SingaporeKuala Lumpur
SeoulTokyo
ManilaHong Kong
TaipeiHsinchu
Shanghai
Beijing
Sao Paulo
ChicagoToronto
Montreal
JacksonvilleMiami
San JoseSan FranciscoSeattle
Vancouver
New YorkBoston
CarlsbadLos AngelesIrvine
San Diego
Houston
Denver
Sunshine CoastBrisbaneGold Coast
SydneyNewcastle
CanberraMelbourneAdelaide
Perth
CalgaryWinnipeg
Gurgaon
AtlantaMoscow4
Bloomfield Hills
Dallas
Stockholm
Dubai
Bristol
Austin
Mexico
Riberao Preto
9
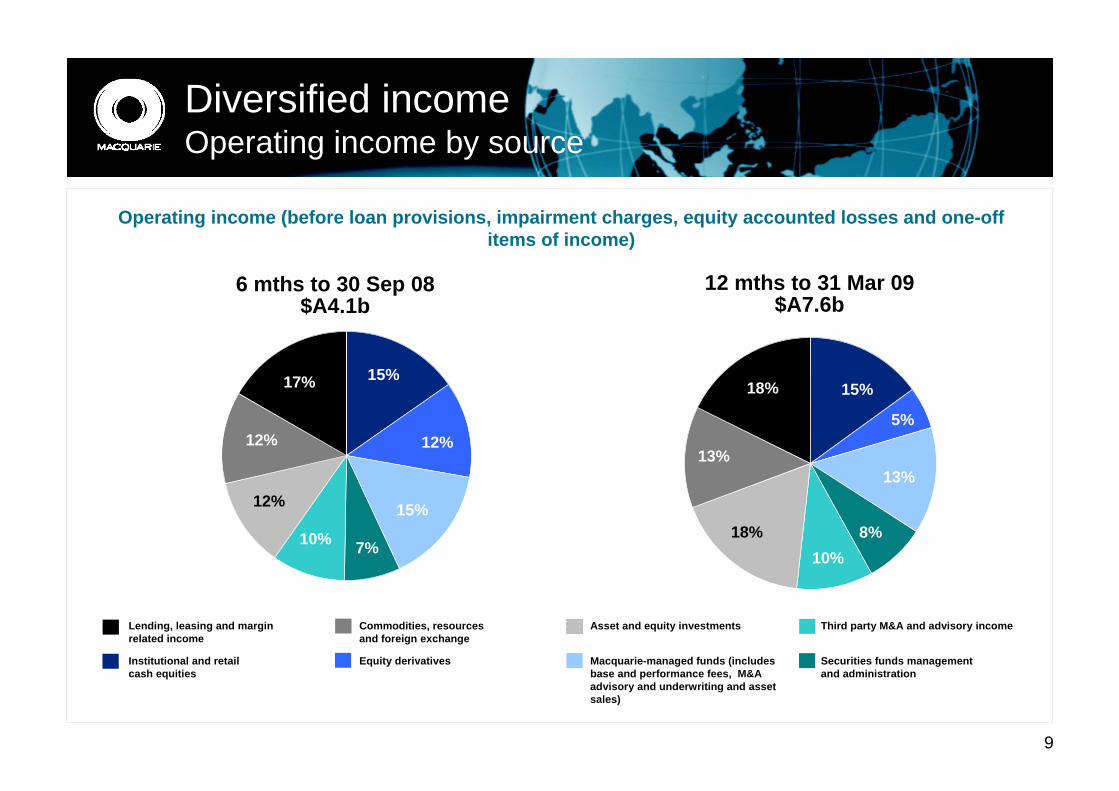
Diversified incomeOperating income by source
Securities funds management and administration
Macquarie-managed funds (includes base and performance fees, M&A advisory and underwriting and asset sales)
Equity derivativesInstitutional and retail cash equities
Third party M&A and advisory incomeAsset and equity investmentsCommodities, resourcesand foreign exchange
Lending, leasing and margin related income
17%
12%
12%
10%
15%
12%
15%
7%
Operating income (before loan provisions, impairment charges, equity accounted losses and one-off items of income)
6 mths to 30 Sep 08$A4.1b
12 mths to 31 Mar 09$A7.6b
15%
5%
13%
8%10%
18%
13%
18%
10
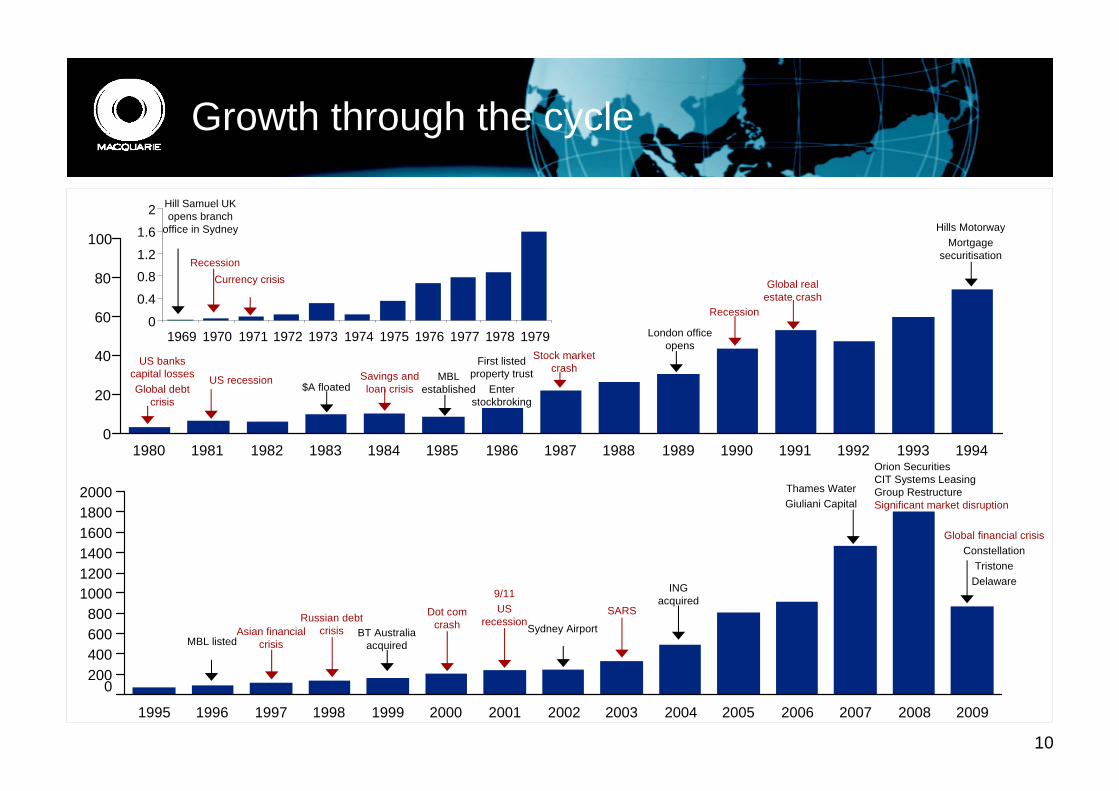
0
20
40
60
80
100
1980 1981 1982 1983 1984 1985 1986 1987 1988 1989 1990 1991 1992 1993 1994
0
0.4
0.81.2
1.6
2
1969 1970 1971 1972 1973 1974 1975 1976 1977 1978 1979
Hill Samuel UK opens branch
office in Sydney
RecessionCurrency crisis
US banks capital lossesGlobal debt
crisis
US recession $A floatedSavings and loan crisis
MBL established
First listed property trust
Enter stockbroking
Stock market crash
London office opens
Recession
Global real estate crash
Hills MotorwayMortgage
securitisation
0
Orion SecuritiesCIT Systems LeasingGroup RestructureSignificant market disruption
200400600800
100012001400160018002000
1995 1996 1997 1998 1999 2000 2001 2002 2003 2004 2005 2006 2007 2008 2009
MBL listedAsian financial
crisis
Russian debt crisis BT Australia
acquired
Dot com crash
9/11US
recessionSydney Airport
SARS
ING acquired
Thames WaterGiuliani Capital
Global financial crisisConstellation
TristoneDelaware
Growth through the cycle
11
Macquarie model – focus over the medium term
Client driven business— Main business focus is providing products and services to clients— Trading businesses focussed on client transactions— Minimal proprietary trading
Alignment of interests with shareholders, investors, staff — Alignment through co-investment by Macquarie Group and staff— Performance driven remuneration
Conservative approach to risk management— Conservative capital and funding profiles— Apply a stress test approach to all risk types, examining the consequences of worst case outcomes and
gaining confidence that can be tolerated— Determine aggregate risk appetite by assessing risk relative to earnings more than by reference to
capital
Incremental growth and evolution — Significant portion of profit comes from businesses that did not exist five years ago but grew from areas
of real expertise— Business initiatives driven from within the Operating Groups which are closest to markets and clients
Diversified by business and geographyAn ability to adapt to change
12
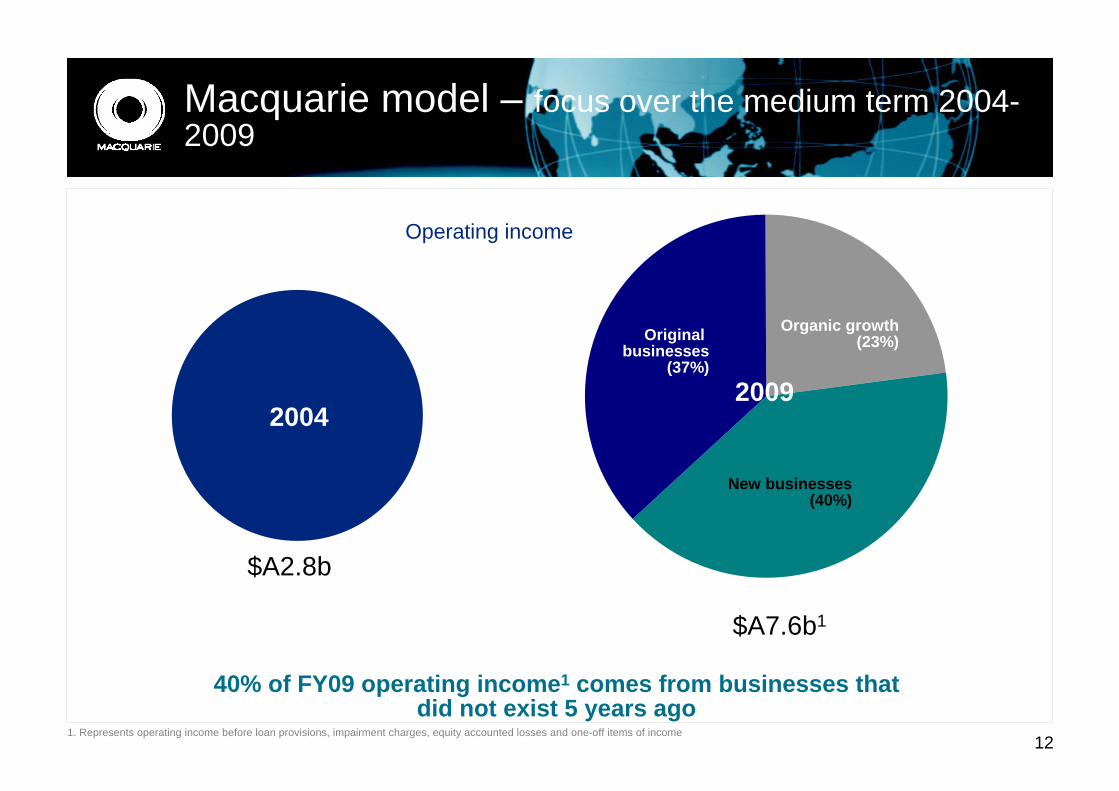
$A2.8b
$A7.6b1
New businesses(40%)
Organic growth(23%)
Macquarie model – focus over the medium term 2004-2009
Operating income
20042009
40% of FY09 operating income1 comes from businesses that did not exist 5 years ago
1. Represents operating income before loan provisions, impairment charges, equity accounted losses and one-off items of income
Original businesses
(37%)
13
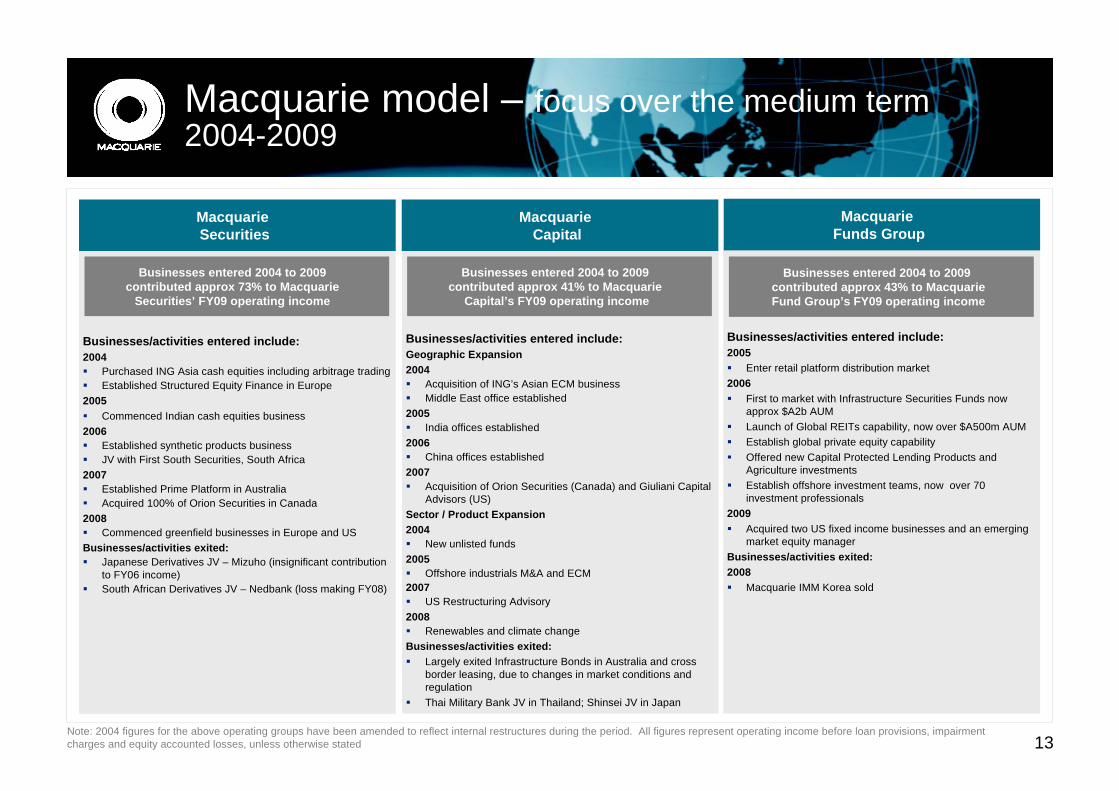
Businesses/activities entered include: 2004
Purchased ING Asia cash equities including arbitrage tradingEstablished Structured Equity Finance in Europe
2005Commenced Indian cash equities business
2006Established synthetic products businessJV with First South Securities, South Africa
2007Established Prime Platform in AustraliaAcquired 100% of Orion Securities in Canada
2008Commenced greenfield businesses in Europe and US
Businesses/activities exited: Japanese Derivatives JV – Mizuho (insignificant contribution to FY06 income) South African Derivatives JV – Nedbank (loss making FY08)
Macquarie model – focus over the medium term2004-2009
Macquarie Securities
Note: 2004 figures for the above operating groups have been amended to reflect internal restructures during the period. All figures represent operating income before loan provisions, impairment charges and equity accounted losses, unless otherwise stated
Businesses entered 2004 to 2009 contributed approx 73% to Macquarie
Securities’ FY09 operating income
Businesses/activities entered include: Geographic Expansion2004
Acquisition of ING’s Asian ECM businessMiddle East office established
2005India offices established
2006China offices established
2007Acquisition of Orion Securities (Canada) and Giuliani Capital Advisors (US)
Sector / Product Expansion2004
New unlisted funds 2005
Offshore industrials M&A and ECM2007
US Restructuring Advisory2008
Renewables and climate changeBusinesses/activities exited:
Largely exited Infrastructure Bonds in Australia and cross border leasing, due to changes in market conditions and regulationThai Military Bank JV in Thailand; Shinsei JV in Japan
Macquarie Capital
Businesses entered 2004 to 2009 contributed approx 41% to Macquarie
Capital’s FY09 operating income
Businesses/activities entered include: 2005
Enter retail platform distribution market2006
First to market with Infrastructure Securities Funds now approx $A2b AUMLaunch of Global REITs capability, now over $A500m AUMEstablish global private equity capabilityOffered new Capital Protected Lending Products and Agriculture investmentsEstablish offshore investment teams, now over 70 investment professionals
2009Acquired two US fixed income businesses and an emerging market equity manager
Businesses/activities exited: 2008
Macquarie IMM Korea sold
Macquarie Funds Group
Businesses entered 2004 to 2009 contributed approx 43% to MacquarieFund Group’s FY09 operating income
14
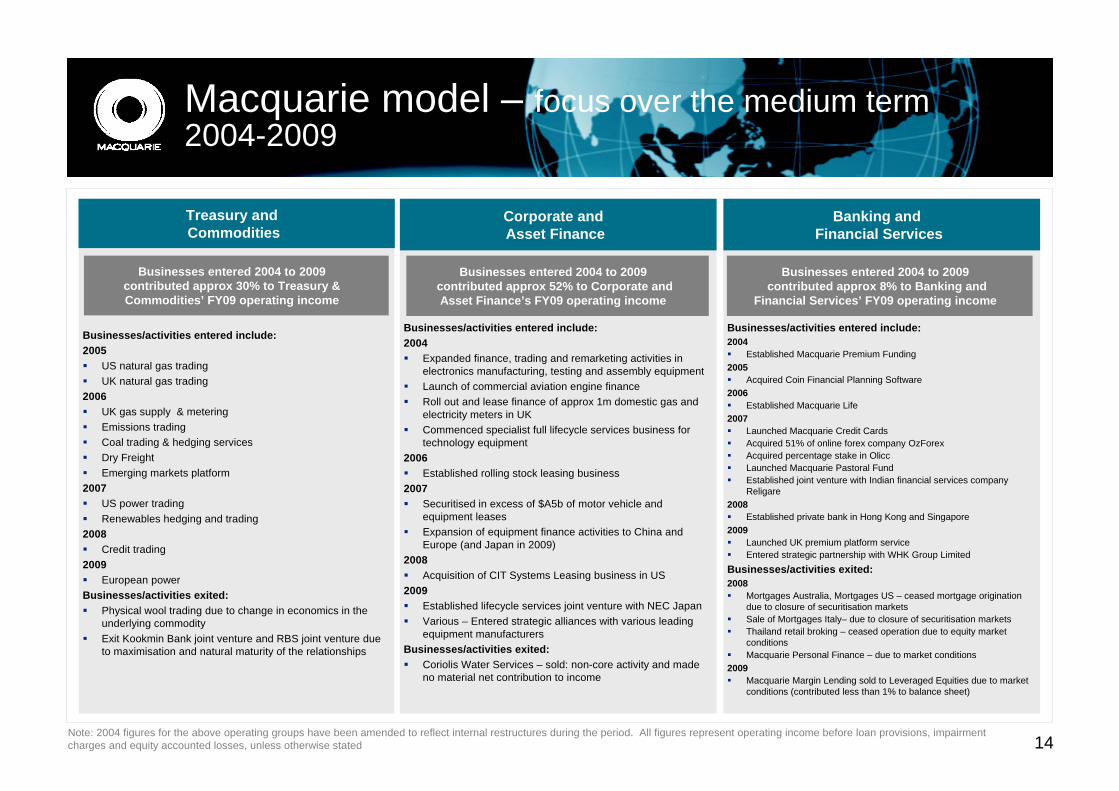
Businesses/activities entered include: 2005
US natural gas tradingUK natural gas trading
2006UK gas supply & meteringEmissions tradingCoal trading & hedging servicesDry FreightEmerging markets platform
2007US power trading Renewables hedging and trading
2008Credit trading
2009European power
Businesses/activities exited: Physical wool trading due to change in economics in the underlying commodity Exit Kookmin Bank joint venture and RBS joint venture due to maximisation and natural maturity of the relationships
Businesses/activities entered include: 2004
Expanded finance, trading and remarketing activities in electronics manufacturing, testing and assembly equipmentLaunch of commercial aviation engine financeRoll out and lease finance of approx 1m domestic gas and electricity meters in UKCommenced specialist full lifecycle services business for technology equipment
2006Established rolling stock leasing business
2007Securitised in excess of $A5b of motor vehicle and equipment leasesExpansion of equipment finance activities to China and Europe (and Japan in 2009)
2008Acquisition of CIT Systems Leasing business in US
2009Established lifecycle services joint venture with NEC JapanVarious – Entered strategic alliances with various leading equipment manufacturers
Businesses/activities exited: Coriolis Water Services – sold: non-core activity and made no material net contribution to income
Corporate and Asset Finance
Macquarie model – focus over the medium term2004-2009
Businesses entered 2004 to 2009 contributed approx 52% to Corporate andAsset Finance’s FY09 operating income
Businesses entered 2004 to 2009 contributed approx 30% to Treasury & Commodities’ FY09 operating income
Treasury and Commodities
Businesses/activities entered include: 2004
Established Macquarie Premium Funding2005
Acquired Coin Financial Planning Software 2006
Established Macquarie Life2007
Launched Macquarie Credit CardsAcquired 51% of online forex company OzForexAcquired percentage stake in OliccLaunched Macquarie Pastoral FundEstablished joint venture with Indian financial services companyReligare
2008Established private bank in Hong Kong and Singapore
2009Launched UK premium platform serviceEntered strategic partnership with WHK Group Limited
Businesses/activities exited: 2008
Mortgages Australia, Mortgages US – ceased mortgage origination due to closure of securitisation marketsSale of Mortgages Italy– due to closure of securitisation marketsThailand retail broking – ceased operation due to equity market conditionsMacquarie Personal Finance – due to market conditions
2009Macquarie Margin Lending sold to Leveraged Equities due to market conditions (contributed less than 1% to balance sheet)
Banking and Financial Services
Businesses entered 2004 to 2009 contributed approx 8% to Banking and
Financial Services’ FY09 operating income
Note: 2004 figures for the above operating groups have been amended to reflect internal restructures during the period. All figures represent operating income before loan provisions, impairment charges and equity accounted losses, unless otherwise stated
15
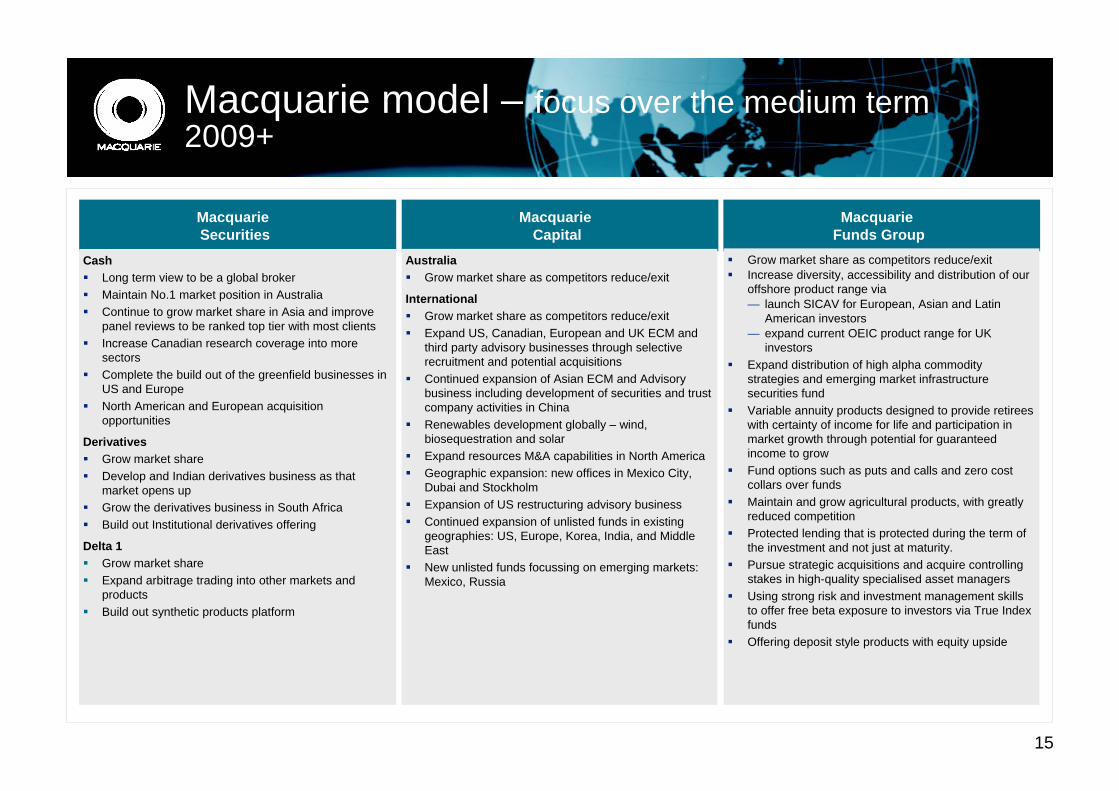
Macquarie Capital
Macquarie Securities
Australia Grow market share as competitors reduce/exit
InternationalGrow market share as competitors reduce/exitExpand US, Canadian, European and UK ECM and third party advisory businesses through selective recruitment and potential acquisitionsContinued expansion of Asian ECM and Advisory business including development of securities and trust company activities in ChinaRenewables development globally – wind, biosequestration and solar Expand resources M&A capabilities in North AmericaGeographic expansion: new offices in Mexico City, Dubai and StockholmExpansion of US restructuring advisory business Continued expansion of unlisted funds in existing geographies: US, Europe, Korea, India, and Middle EastNew unlisted funds focussing on emerging markets: Mexico, Russia
CashLong term view to be a global brokerMaintain No.1 market position in AustraliaContinue to grow market share in Asia and improve panel reviews to be ranked top tier with most clientsIncrease Canadian research coverage into more sectorsComplete the build out of the greenfield businesses in US and Europe North American and European acquisition opportunities
DerivativesGrow market shareDevelop and Indian derivatives business as that market opens upGrow the derivatives business in South AfricaBuild out Institutional derivatives offering
Delta 1Grow market share Expand arbitrage trading into other markets and productsBuild out synthetic products platform
Macquarie model – focus over the medium term2009+
Macquarie Funds Group
Grow market share as competitors reduce/exitIncrease diversity, accessibility and distribution of our offshore product range via— launch SICAV for European, Asian and Latin
American investors— expand current OEIC product range for UK
investorsExpand distribution of high alpha commodity strategies and emerging market infrastructure securities fundVariable annuity products designed to provide retirees with certainty of income for life and participation in market growth through potential for guaranteed income to growFund options such as puts and calls and zero cost collars over fundsMaintain and grow agricultural products, with greatly reduced competitionProtected lending that is protected during the term of the investment and not just at maturity.Pursue strategic acquisitions and acquire controlling stakes in high-quality specialised asset managersUsing strong risk and investment management skills to offer free beta exposure to investors via True Index fundsOffering deposit style products with equity upside
16
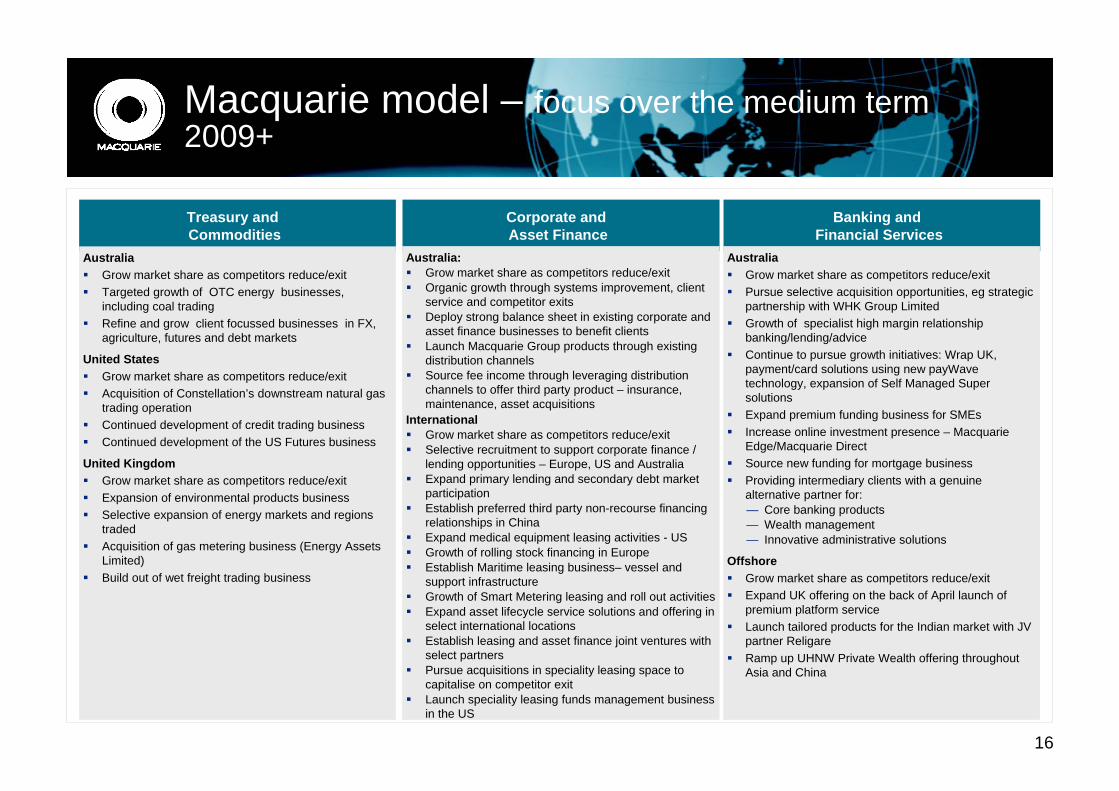
Treasury and Commodities
AustraliaGrow market share as competitors reduce/exitTargeted growth of OTC energy businesses, including coal trading Refine and grow client focussed businesses in FX, agriculture, futures and debt markets
United States Grow market share as competitors reduce/exitAcquisition of Constellation’s downstream natural gas trading operationContinued development of credit trading business Continued development of the US Futures business
United Kingdom Grow market share as competitors reduce/exitExpansion of environmental products businessSelective expansion of energy markets and regions traded Acquisition of gas metering business (Energy Assets Limited)Build out of wet freight trading business
Macquarie model – focus over the medium term2009+
Corporate and Asset Finance
Australia:Grow market share as competitors reduce/exitOrganic growth through systems improvement, client service and competitor exitsDeploy strong balance sheet in existing corporate and asset finance businesses to benefit clientsLaunch Macquarie Group products through existing distribution channelsSource fee income through leveraging distribution channels to offer third party product – insurance, maintenance, asset acquisitions
InternationalGrow market share as competitors reduce/exitSelective recruitment to support corporate finance / lending opportunities – Europe, US and AustraliaExpand primary lending and secondary debt market participation Establish preferred third party non-recourse financing relationships in ChinaExpand medical equipment leasing activities - USGrowth of rolling stock financing in EuropeEstablish Maritime leasing business– vessel and support infrastructureGrowth of Smart Metering leasing and roll out activitiesExpand asset lifecycle service solutions and offering in select international locationsEstablish leasing and asset finance joint ventures with select partnersPursue acquisitions in speciality leasing space to capitalise on competitor exitLaunch speciality leasing funds management business in the US
Banking and Financial Services
AustraliaGrow market share as competitors reduce/exitPursue selective acquisition opportunities, eg strategic partnership with WHK Group LimitedGrowth of specialist high margin relationship banking/lending/adviceContinue to pursue growth initiatives: Wrap UK, payment/card solutions using new payWavetechnology, expansion of Self Managed Super solutionsExpand premium funding business for SMEsIncrease online investment presence – Macquarie Edge/Macquarie DirectSource new funding for mortgage business Providing intermediary clients with a genuine alternative partner for:— Core banking products— Wealth management— Innovative administrative solutions
OffshoreGrow market share as competitors reduce/exitExpand UK offering on the back of April launch of premium platform service Launch tailored products for the Indian market with JV partner ReligareRamp up UHNW Private Wealth offering throughout Asia and China
2. Recent Activity

18
Key initiatives over the last 12 months
Large range of initiatives completed across the Groups
—Acquisitions
—Divestment of non-core businesses
—Raised funding and capital
—Increased maturity profile of debt
—Divestment of low yielding assets from balance sheet
—Review and implementation of initiatives across listed funds
—Continued expansion of unlisted specialist funds
19191919
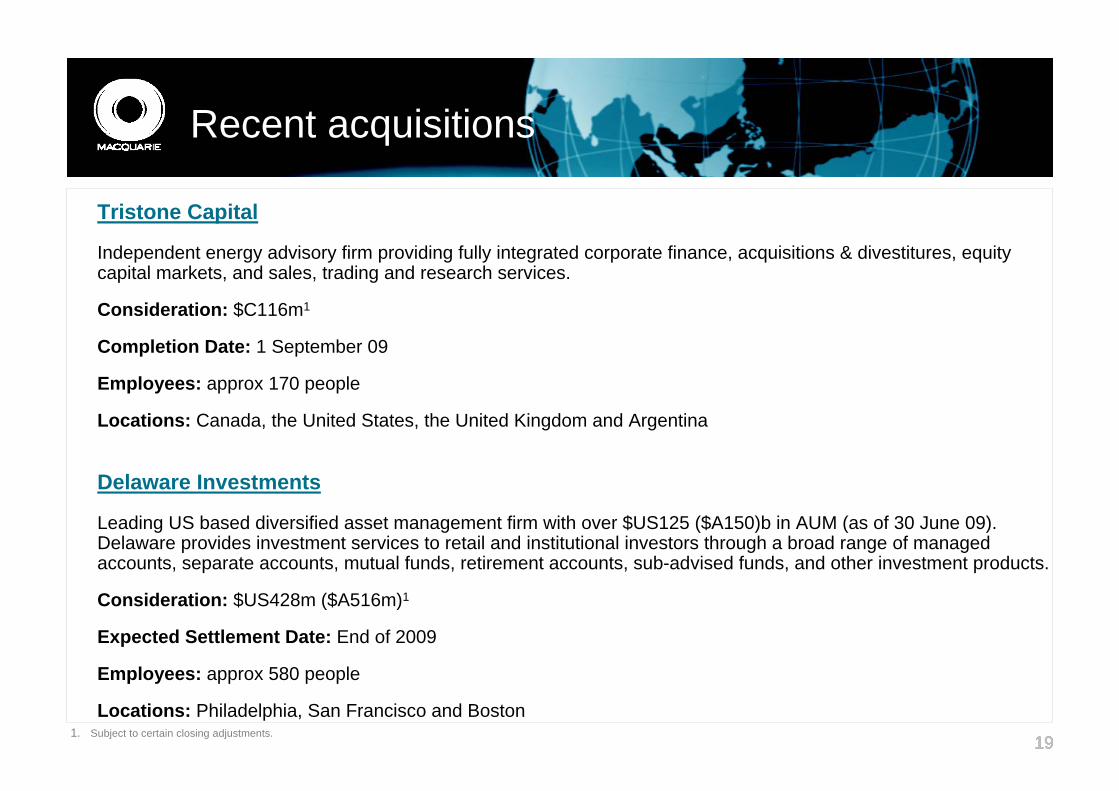
Recent acquisitions
Tristone Capital
Independent energy advisory firm providing fully integrated corporate finance, acquisitions & divestitures, equity capital markets, and sales, trading and research services.
Consideration: $C116m1
Completion Date: 1 September 09
Employees: approx 170 people
Locations: Canada, the United States, the United Kingdom and Argentina
Delaware Investments
Leading US based diversified asset management firm with over $US125 ($A150)b in AUM (as of 30 June 09). Delaware provides investment services to retail and institutional investors through a broad range of managed accounts, separate accounts, mutual funds, retirement accounts, sub-advised funds, and other investment products.
Consideration: $US428m ($A516m)1
Expected Settlement Date: End of 2009
Employees: approx 580 people
Locations: Philadelphia, San Francisco and Boston1. Subject to certain closing adjustments.
2020
Recent acquisitions
Constellation Energy
Houston-based downstream natural gas trading business providing physical and financial natural gas. Constellation Energy has been fully integrated into Macquarie’s existing North American natural gas trading and marketing platform, Macquarie Cook Energy. The combined business is a top 5 gas trader in the North American market interacting with approximately 400 clients and counterparties.
Completion Date: 28 March 2009
Employees: approx 110 people
Locations: Houston, Calgary
21
New unlisted funds
August 2009: Entered into in a joint venture with China Everbright, to establish two infrastructure funds to invest in Greater China, one aimed at foreign investors and one at domestic, with an aggregate fund target of $US1.5b.
August 2009: Russia’s State Development Bank, Vnesheconombank (VEB) and the Macquarie Renaissance Infrastructure Fund (MRIF) signed formal agreements for VEB to become the cornerstone investor in MRIF, the first major private fund dedicated to investing directly in infrastructure in Russia and other key CIS markets.
VEB joins other major investors and in total they have committed $US530m to the first close of the Fund. The International Finance Corporation (IFC), a member of the World Bank Group and the European Bank for Reconstruction and Development each agreed to make a $US100m investment in the Fund.
April 2009: Launched the Macquarie-SBI Infrastructure Fund (MSIF) in joint venture with the State Bank of India (SBI), investing in infrastructure projects in India. Over $US1b already raised with total capital anticipated to be between $US2b and $US3b. MSIF is managed by the SBI and Macquarie joint venture, with the International Finance Corporation (IFC), a member of the World Bank Group, as a minority shareholder and cornerstone investor in MSIF.
22
Funding update
Completed $A1.2b equity raising
— $A540m institutional placement at $A27.00
— $A669m retail share purchase plan (SPP) at $A26.60 (institutional price less $A0.40 final dividend)
MQG issued $US1.5b of Non-Government guaranteed debt in two issues
— 5yr $US1b
— 10yr $US500m
MBL issued ~$A16b1 of Government guaranteed term debt since guarantee was introduced in November 08
Retail deposits up 103% from March 08 to $A13.4b at March 09
MIPS tender offer resulted in MQG booking a realised profit of approximately $A130 million in 1Q10. Under the tender offer, MQG secured approximately £157m ($A324m) of MIPS, out of a total £200m
1. Converted to AUD using 31 Aug fx rate.
23
Balance sheet initiatives
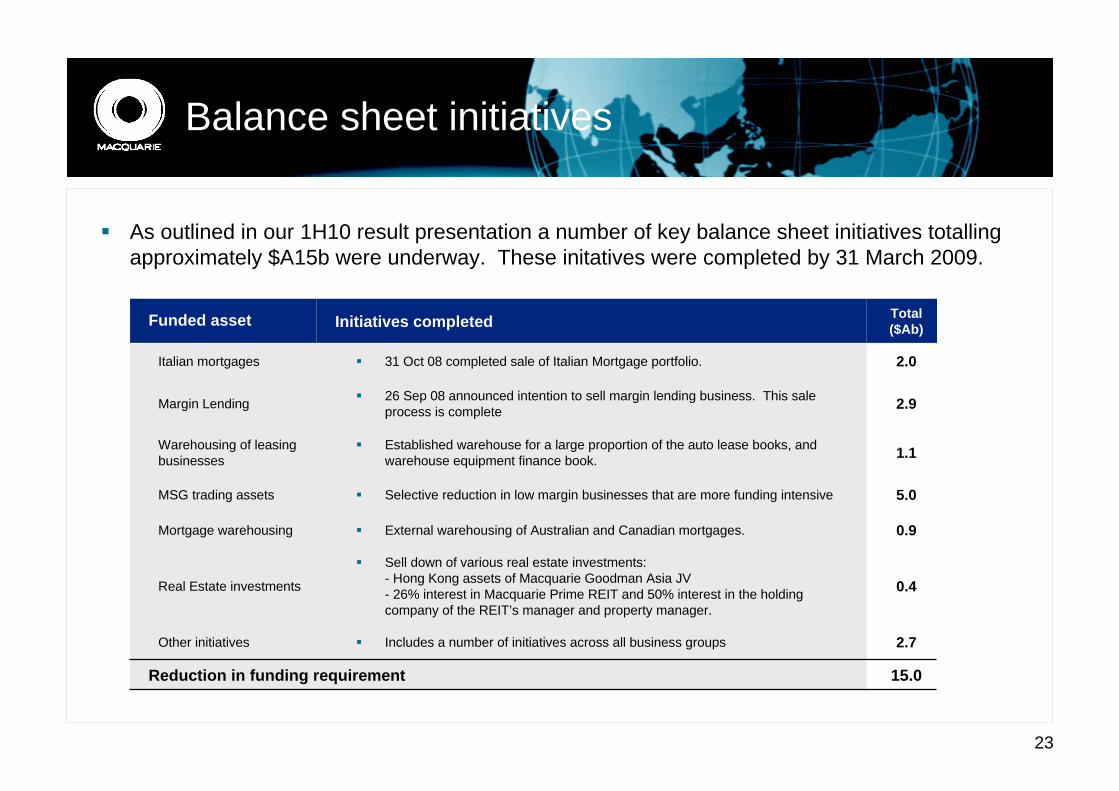
As outlined in our 1H10 result presentation a number of key balance sheet initiatives totalling approximately $A15b were underway. These initatives were completed by 31 March 2009.
2.7
0.4Sell down of various real estate investments:- Hong Kong assets of Macquarie Goodman Asia JV- 26% interest in Macquarie Prime REIT and 50% interest in the holding company of the REIT’s manager and property manager.
Real Estate investments
Includes a number of initiatives across all business groupsOther initiatives
15.0Reduction in funding requirement
0.9External warehousing of Australian and Canadian mortgages.Mortgage warehousing
5.0Selective reduction in low margin businesses that are more funding intensiveMSG trading assets
Established warehouse for a large proportion of the auto lease books, and warehouse equipment finance book.
26 Sep 08 announced intention to sell margin lending business. This sale process is complete
31 Oct 08 completed sale of Italian Mortgage portfolio.
Initiatives completed
1.1
2.9
2.0
Total ($Ab)
Margin Lending
Italian mortgages
Warehousing of leasing businesses
Funded asset
24
Update on specialist listed funds
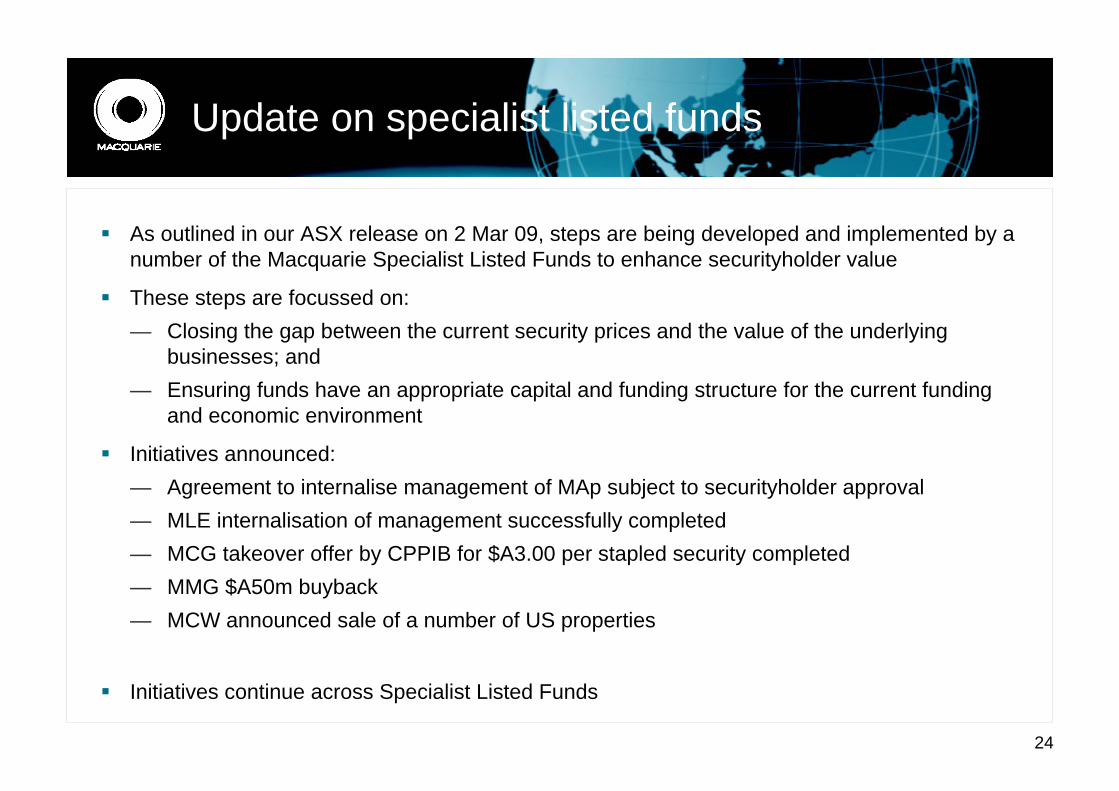
As outlined in our ASX release on 2 Mar 09, steps are being developed and implemented by a number of the Macquarie Specialist Listed Funds to enhance securityholder value
These steps are focussed on: — Closing the gap between the current security prices and the value of the underlying
businesses; and — Ensuring funds have an appropriate capital and funding structure for the current funding
and economic environment
Initiatives announced:— Agreement to internalise management of MAp subject to securityholder approval— MLE internalisation of management successfully completed — MCG takeover offer by CPPIB for $A3.00 per stapled security completed— MMG $A50m buyback— MCW announced sale of a number of US properties
Initiatives continue across Specialist Listed Funds

3. 1Q10 Update
26
1Q10 update
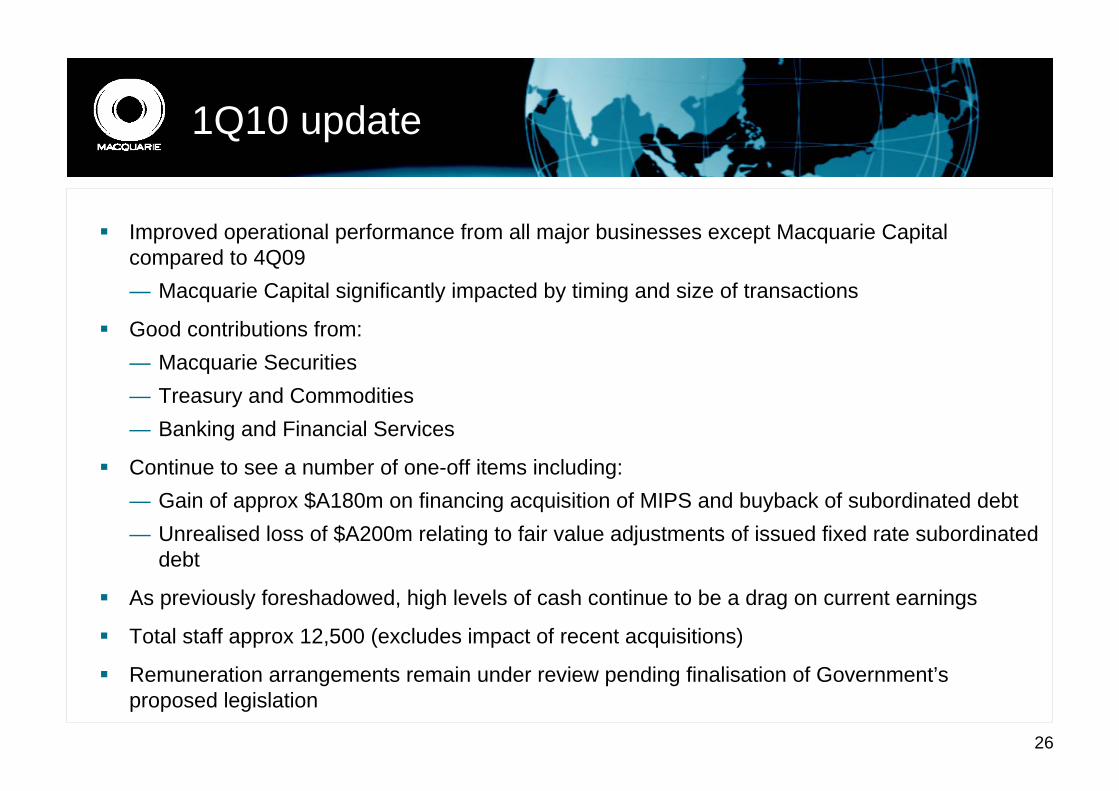
Improved operational performance from all major businesses except Macquarie Capital compared to 4Q09— Macquarie Capital significantly impacted by timing and size of transactions
Good contributions from:— Macquarie Securities — Treasury and Commodities— Banking and Financial Services
Continue to see a number of one-off items including:— Gain of approx $A180m on financing acquisition of MIPS and buyback of subordinated debt— Unrealised loss of $A200m relating to fair value adjustments of issued fixed rate subordinated
debt
As previously foreshadowed, high levels of cash continue to be a drag on current earnings
Total staff approx 12,500 (excludes impact of recent acquisitions)
Remuneration arrangements remain under review pending finalisation of Government’s proposed legislation
27
1Q10Activities across the Group
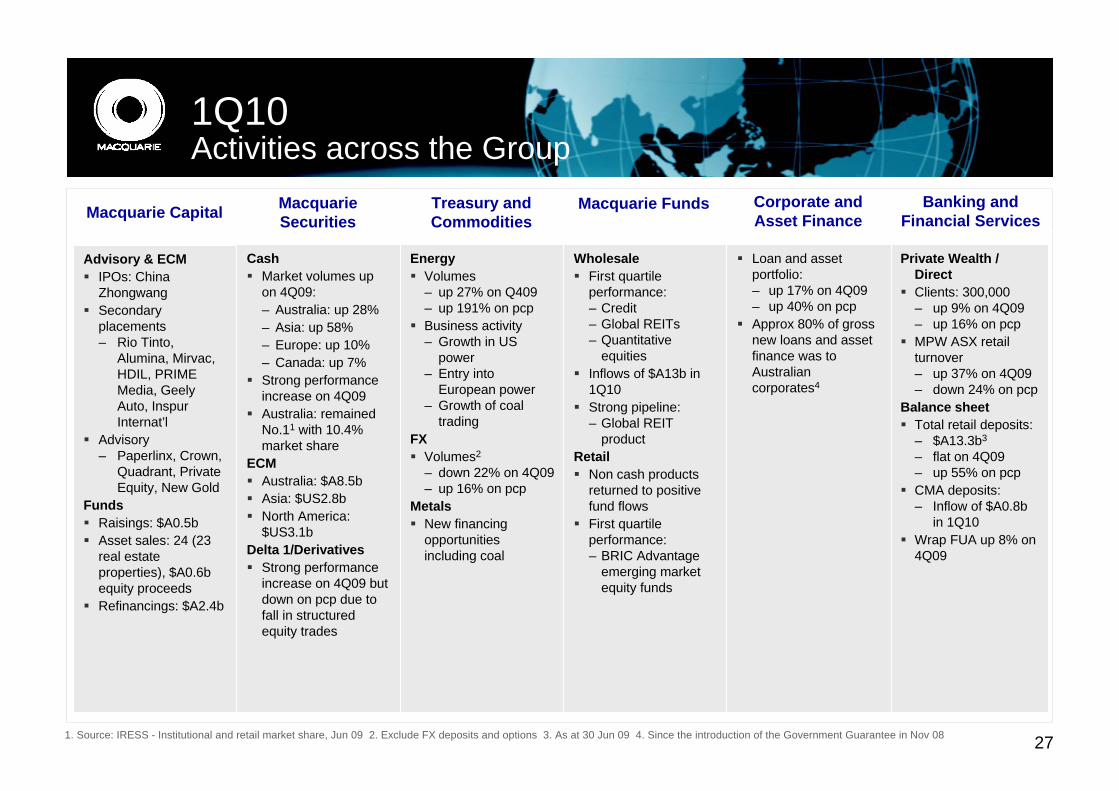
Macquarie Capital
Advisory & ECMIPOs: China ZhongwangSecondary placements– Rio Tinto,
Alumina, Mirvac, HDIL, PRIME Media, GeelyAuto, InspurInternat’l
Advisory– Paperlinx, Crown,
Quadrant, Private Equity, New Gold
FundsRaisings: $A0.5b Asset sales: 24 (23 real estate properties), $A0.6b equity proceedsRefinancings: $A2.4b
Macquarie Securities
CashMarket volumes up on 4Q09:– Australia: up 28%– Asia: up 58%– Europe: up 10%– Canada: up 7%Strong performance increase on 4Q09Australia: remained No.11 with 10.4% market share
ECMAustralia: $A8.5bAsia: $US2.8bNorth America: $US3.1b
Delta 1/DerivativesStrong performance increase on 4Q09 but down on pcp due to fall in structured equity trades
Treasury and Commodities
EnergyVolumes– up 27% on Q409– up 191% on pcpBusiness activity– Growth in US
power– Entry into
European power– Growth of coal
tradingFX
Volumes2
– down 22% on 4Q09– up 16% on pcp
MetalsNew financing opportunities including coal
Macquarie Funds
WholesaleFirst quartile performance:– Credit– Global REITs– Quantitative
equitiesInflows of $A13b in 1Q10Strong pipeline: – Global REIT
productRetail
Non cash products returned to positive fund flowsFirst quartile performance:– BRIC Advantage
emerging market equity funds
Banking and Financial Services
Private Wealth / DirectClients: 300,000– up 9% on 4Q09– up 16% on pcpMPW ASX retail turnover– up 37% on 4Q09– down 24% on pcp
Balance sheetTotal retail deposits:– $A13.3b3
– flat on 4Q09– up 55% on pcpCMA deposits: – Inflow of $A0.8b
in 1Q10Wrap FUA up 8% on 4Q09
Corporate and Asset Finance
Loan and asset portfolio: – up 17% on 4Q09– up 40% on pcpApprox 80% of gross new loans and asset finance was to Australian corporates4
1. Source: IRESS - Institutional and retail market share, Jun 09 2. Exclude FX deposits and options 3. As at 30 Jun 09 4. Since the introduction of the Government Guarantee in Nov 08
28
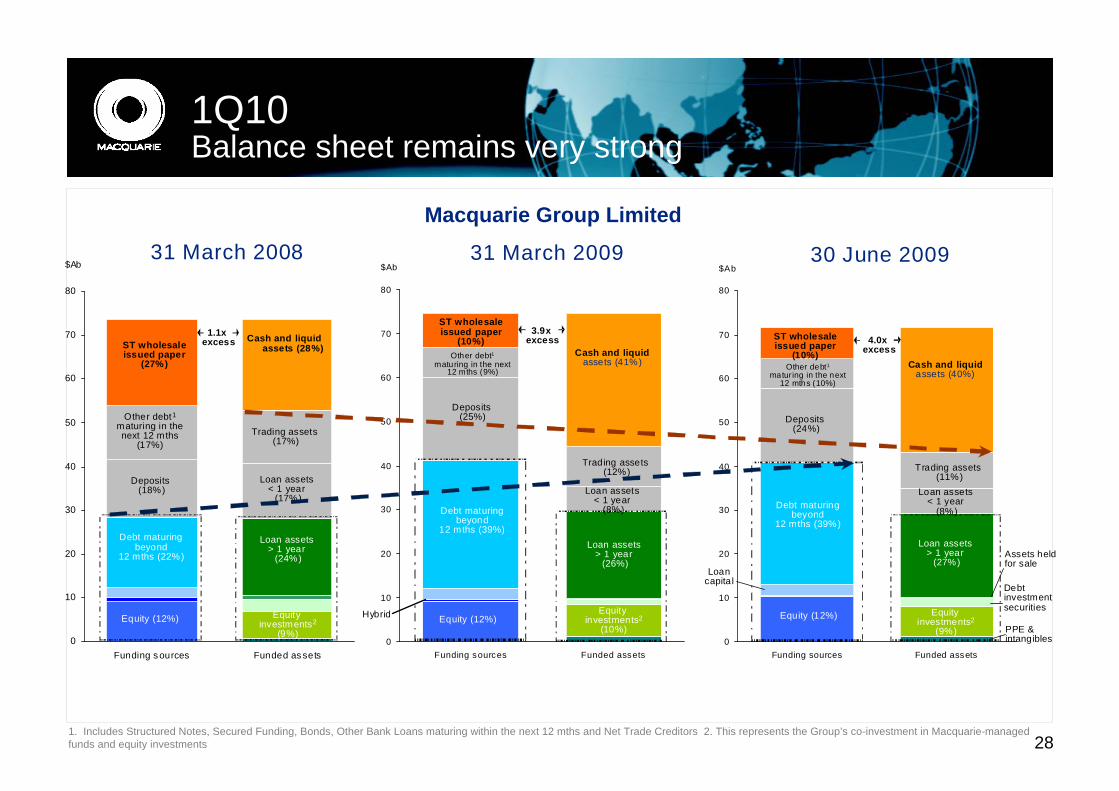
1Q10 Balance sheet remains very strong
1. Includes Structured Notes, Secured Funding, Bonds, Other Bank Loans maturing within the next 12 mths and Net Trade Creditors 2. This represents the Group’s co-investment in Macquarie-managed funds and equity investments
Macquarie Group Limited
31 March 2008 31 March 2009 30 June 2009
0
10
20
30
40
50
60
70
80
Funding sources Funded assets
$Ab
0
10
20
30
40
50
60
70
80
Funding s ources Funded as sets
$Ab
0
10
20
30
40
50
60
70
80
Funding sources Funded assets
$Ab
Trading assets (12%)
Loan assets < 1 year
(8%)
Loan assets > 1 year
(27%)
Equity investments2
(9%)
Debt investmentsecurities
Assets held for sale
PPE & intangibles
Cash and liquidassets (41%)
Hybrid
Debt maturing beyond
12 mths (39%)
Deposits (25%)
ST wholesaleissued paper
(10%)Other debt1
maturing in the next 12 mths (9%)
3.9x excess
Loan assets > 1 year
(26%)
Equity investments2
(10%)Equity (12%)
Cash and liquidassets (28%)
Trading assets (17%)
Loan assets < 1 year
(17%)
Loan assets > 1 year
(24%)
Equity investments2
(9%)
1.1x excess
Debt maturing beyond
12 mths (22%)
Deposits (18%)
Equity (12%)
ST wholesaleissued paper
(27%)
Other debt1
maturing in thenext 12 mths
(17%)
ST wholesaleissued paper
(10%)
Deposits (24%)
Debt maturing beyond
12 mths (39%)
Equity (12%)
Loan capital
Cash and liquidassets (40%)
Trading assets (11%)
Loan assets < 1 year
(8%)
4.0x excess
Other debt1
maturing in the next 12 mths (10%)
29
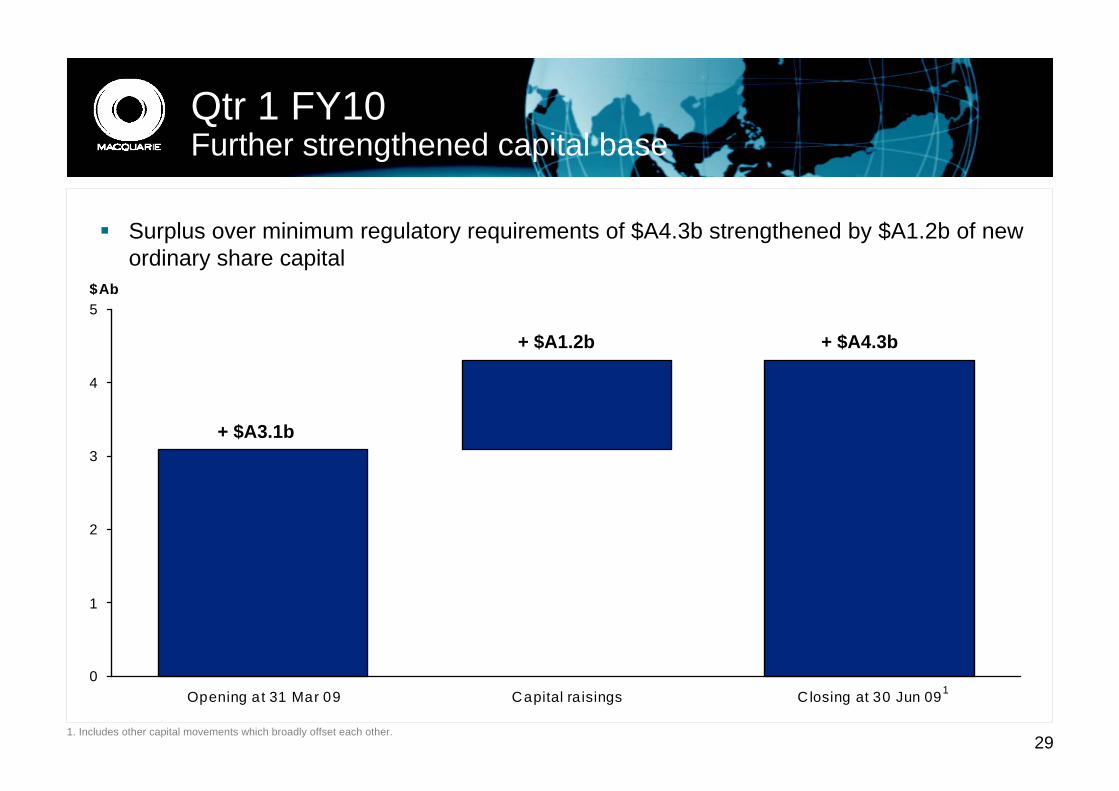
Surplus over minimum regulatory requirements of $A4.3b strengthened by $A1.2b of new ordinary share capital
Qtr 1 FY10 Further strengthened capital base
1. Includes other capital movements which broadly offset each other.
+ $A3.1b
+ $A1.2b + $A4.3b
10
1
2
3
4
5
Opening at 31 Mar 09 Capital ra isings Closing at 30 Jun 09
$Ab
303030
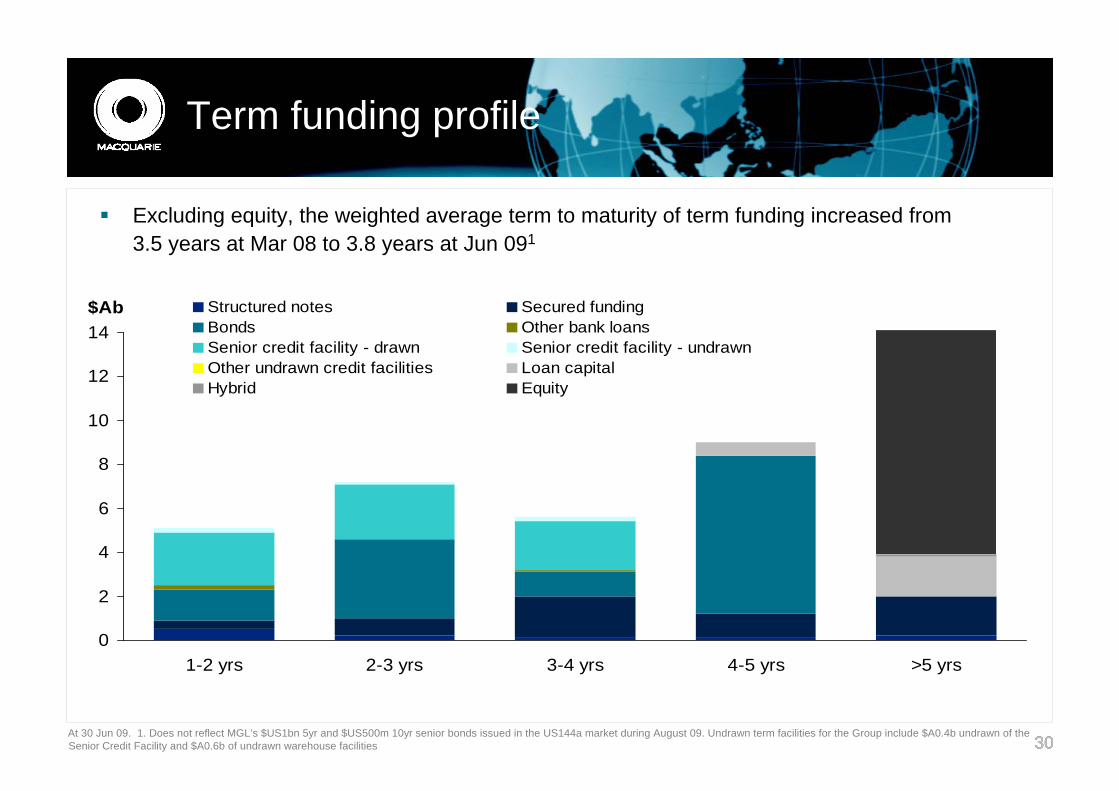
Term funding profile
Excluding equity, the weighted average term to maturity of term funding increased from 3.5 years at Mar 08 to 3.8 years at Jun 091
At 30 Jun 09. 1. Does not reflect MGL’s $US1bn 5yr and $US500m 10yr senior bonds issued in the US144a market during August 09. Undrawn term facilities for the Group include $A0.4b undrawn of the Senior Credit Facility and $A0.6b of undrawn warehouse facilities
0
2
4
6
8
10
12
14
1-2 yrs 2-3 yrs 3-4 yrs 4-5 yrs >5 yrs
$Ab Structured notes Secured fundingBonds Other bank loansSenior credit facility - drawn Senior credit facility - undrawnOther undrawn credit facilities Loan capitalHybrid Equity
31
0
50
100
150
200
250
2005 2006 2007 2008 2009 Jun-09
Banking and Financial ServicesMacquarie Funds GroupReal Estate Banking DivisionMacquarie Capital Funds
$Ab
$A140b
$A97b
$A243b
$A197b
$A232b
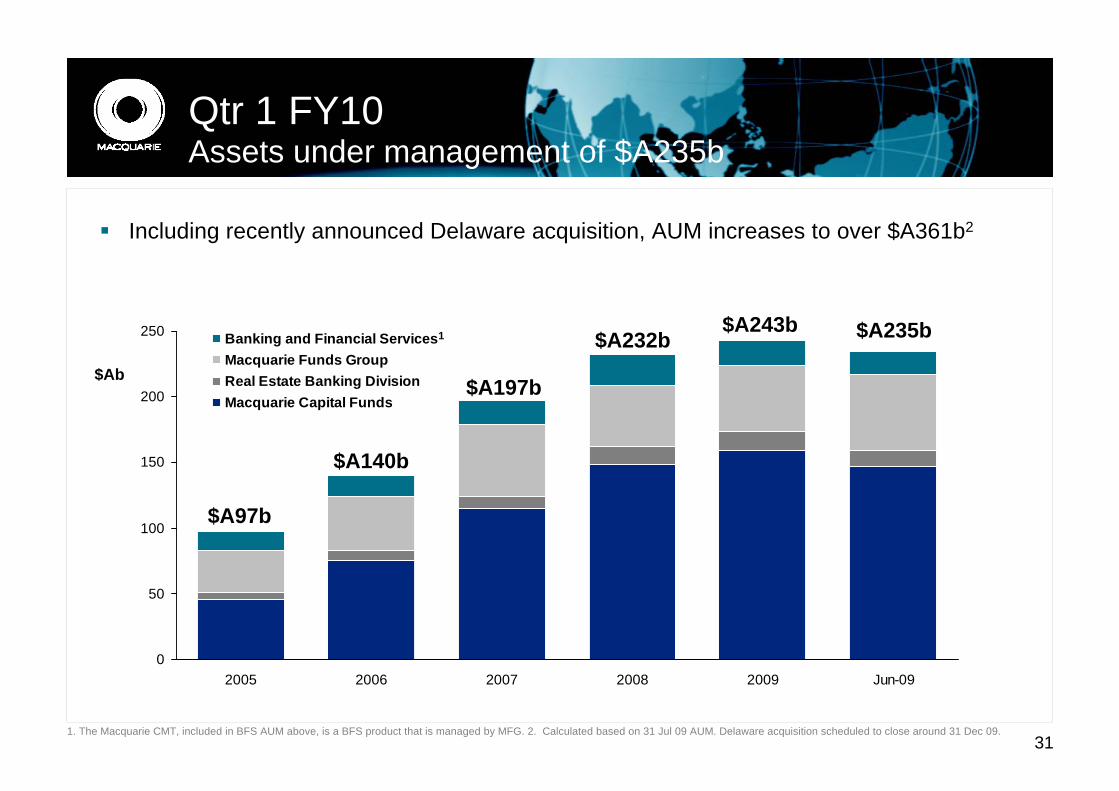
Qtr 1 FY10Assets under management of $A235b
1. The Macquarie CMT, included in BFS AUM above, is a BFS product that is managed by MFG. 2. Calculated based on 31 Jul 09 AUM. Delaware acquisition scheduled to close around 31 Dec 09.
1 $A235b
Including recently announced Delaware acquisition, AUM increases to over $A361b2
32
Outlook
We continue to maintain a cautious stance with a conservative approach to funding and capital, notwithstanding some improvement in market conditions
Market conditions continue to be volatile, making short-term forecasting extremely difficult
1H10 profit currently estimated to be approx midway between 1H09 and 2H09 levels but remains subject to market conditions and significant swing factors and excludes the impact of one-off items
— Swing factors include completion rate of transactions, asset realisations and asset prices
— One off items include factors such as the internalisation of MAp management and the completion of the periodic review for potential impairment charges
— For 1Q10 one-off items broadly offset each other
Surplus capital and high cash levels, strong team and market conditions provide opportunities for medium term growth building upon:
— Strength, diversification and global reach of our businesses
— Ongoing organic growth initiatives and incremental acquisitions
— Effective risk management

4. FY09 Review
34
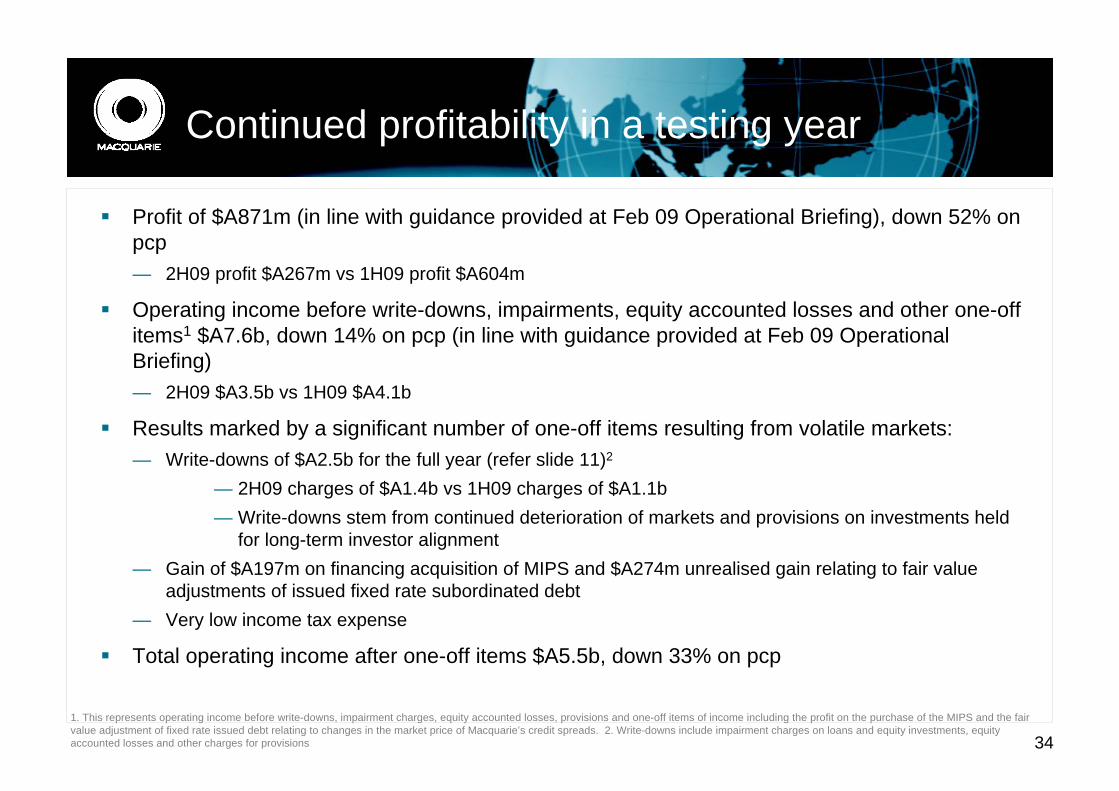
Profit of $A871m (in line with guidance provided at Feb 09 Operational Briefing), down 52% on pcp— 2H09 profit $A267m vs 1H09 profit $A604m
Operating income before write-downs, impairments, equity accounted losses and other one-off items1 $A7.6b, down 14% on pcp (in line with guidance provided at Feb 09 Operational Briefing)— 2H09 $A3.5b vs 1H09 $A4.1b
Results marked by a significant number of one-off items resulting from volatile markets: — Write-downs of $A2.5b for the full year (refer slide 11)2
— 2H09 charges of $A1.4b vs 1H09 charges of $A1.1b— Write-downs stem from continued deterioration of markets and provisions on investments held
for long-term investor alignment— Gain of $A197m on financing acquisition of MIPS and $A274m unrealised gain relating to fair value
adjustments of issued fixed rate subordinated debt— Very low income tax expense
Total operating income after one-off items $A5.5b, down 33% on pcp
Continued profitability in a testing year
1. This represents operating income before write-downs, impairment charges, equity accounted losses, provisions and one-off items of income including the profit on the purchase of the MIPS and the fair value adjustment of fixed rate issued debt relating to changes in the market price of Macquarie’s credit spreads. 2. Write-downs include impairment charges on loans and equity investments, equity accounted losses and other charges for provisions
35
Employment expenses down $A1.8b or 44% on pcp
Share based payments expense of $A128m relating to share options, most issued at exercise prices significantly above the current share price
EPS $A3.10, down 54% on pcp
Return on equity 9.9%, down from 23.7% for pcp
Final dividend of $A0.40 per share franked to 60%— Total dividend for FY09 is $A1.85 per share, down 46% on pcp— 60% payout ratio on total dividends for the full year which is in line with previously stated dividend policy
of 50-60% payout ratio
Continued profitability in a testing year
36
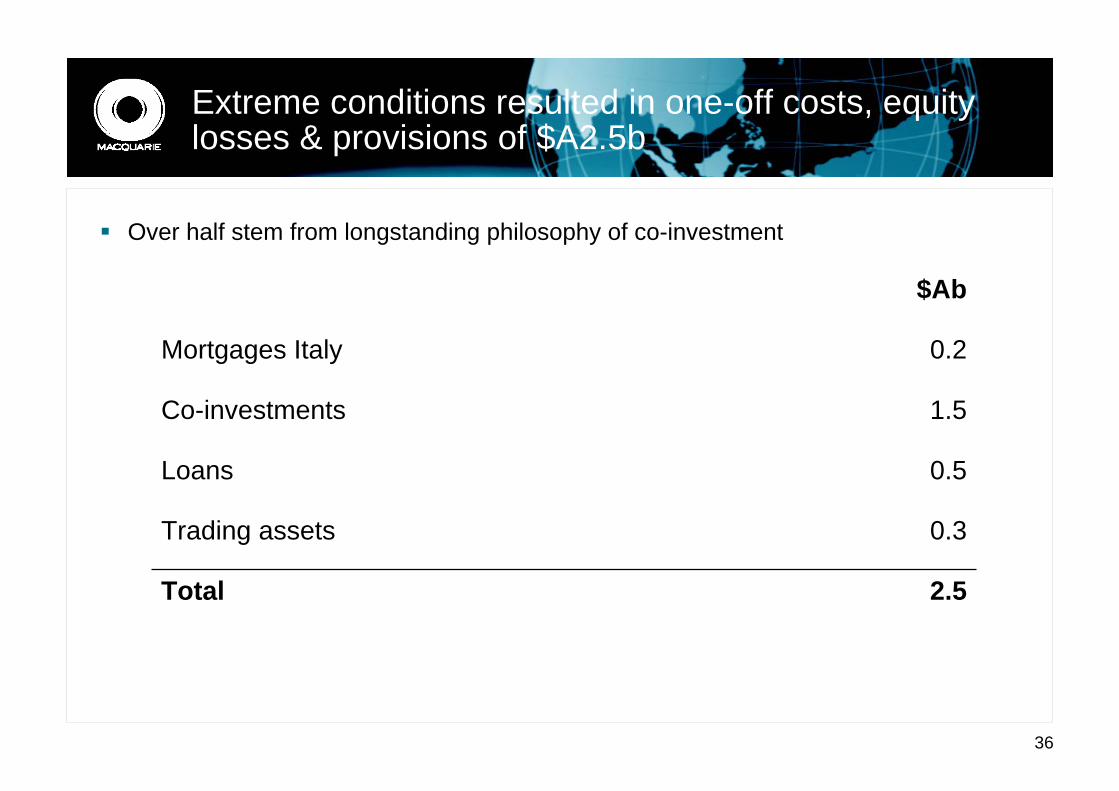
Extreme conditions resulted in one-off costs, equity losses & provisions of $A2.5b
Over half stem from longstanding philosophy of co-investment
2.5Total
0.3Trading assets
0.5Loans
1.5Co-investments
0.2Mortgages Italy
$Ab
37
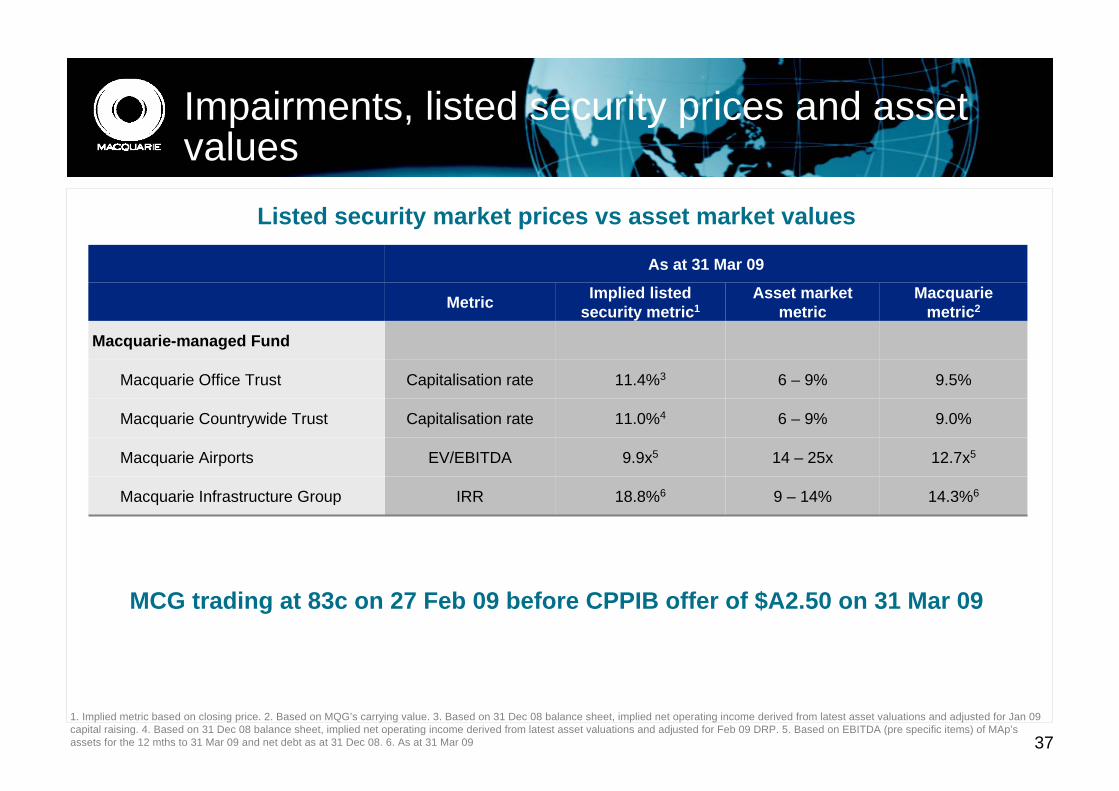
Impairments, listed security prices and asset values
9.0%6 – 9%11.0%4Capitalisation rateMacquarie Countrywide Trust
9.5%6 – 9%11.4%3Capitalisation rateMacquarie Office Trust
As at 31 Mar 09
IRR
EV/EBITDA
Metric
14.3%69 – 14% 18.8%6Macquarie Infrastructure Group
14 – 25x
Asset market metric
9.9x5
Implied listed security metric1
12.7x5
Macquarie metric2
Macquarie Airports
Macquarie-managed Fund
MCG trading at 83c on 27 Feb 09 before CPPIB offer of $A2.50 on 31 Mar 09
Listed security market prices vs asset market values
1. Implied metric based on closing price. 2. Based on MQG’s carrying value. 3. Based on 31 Dec 08 balance sheet, implied net operating income derived from latest asset valuations and adjusted for Jan 09 capital raising. 4. Based on 31 Dec 08 balance sheet, implied net operating income derived from latest asset valuations and adjusted for Feb 09 DRP. 5. Based on EBITDA (pre specific items) of MAp’sassets for the 12 mths to 31 Mar 09 and net debt as at 31 Dec 08. 6. As at 31 Mar 09
38
0
10
20
30
40
50
60
70
80
Funding sources Funded assets
$Ab
0
10
20
30
40
50
60
70
80
Funding sources Funded assets
$Ab
`
0
10
20
30
40
50
60
70
80
Funding sources Funded assets
$Ab
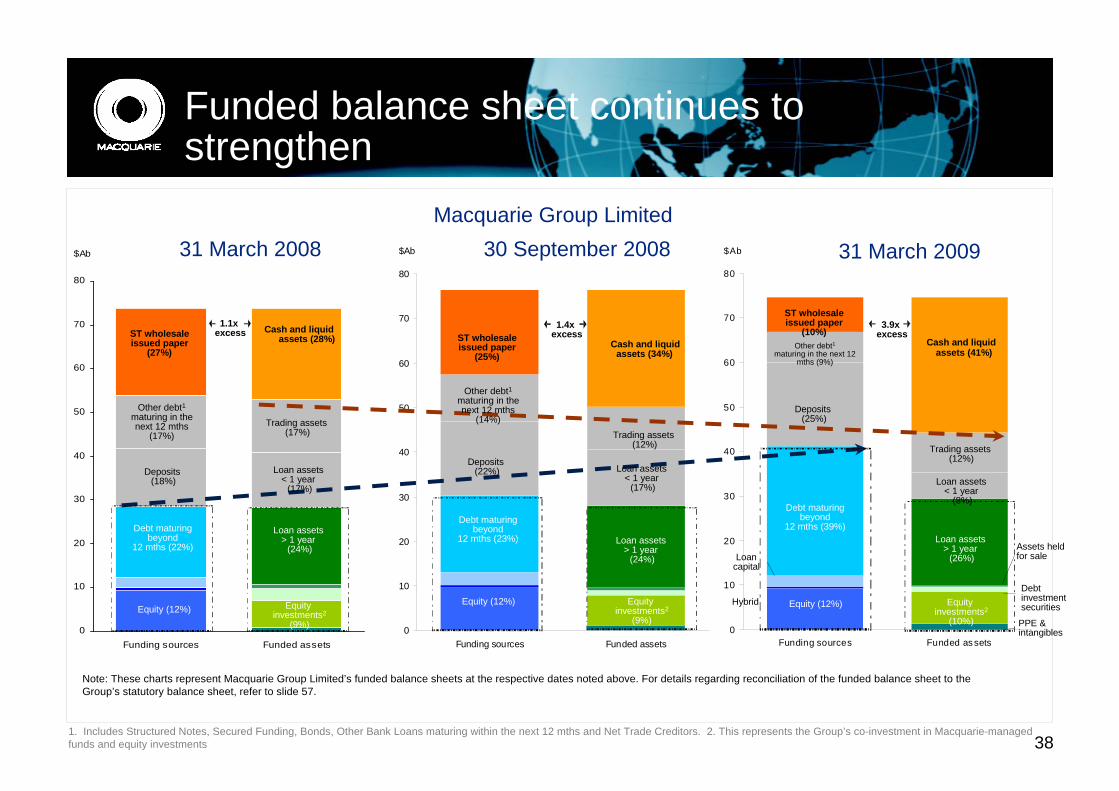
Funded balance sheet continues to strengthen
31 March 2008 30 September 2008 31 March 2009
1. Includes Structured Notes, Secured Funding, Bonds, Other Bank Loans maturing within the next 12 mths and Net Trade Creditors. 2. This represents the Group’s co-investment in Macquarie-managed funds and equity investments
Macquarie Group Limited
Note: These charts represent Macquarie Group Limited’s funded balance sheets at the respective dates noted above. For details regarding reconciliation of the funded balance sheet to the Group’s statutory balance sheet, refer to slide 57.
assets (41%)
Trading assets (12%)
Loan assets < 1 year
(8%)
Loan assets > 1 year
(26%)
Equity investments2
(10%)
Debt investmentsecurities
Assets held for sale
PPE & intangibles
Cash and liquid
Hybrid
Loan capital
Debt maturing beyond
12 mths (39%)
Deposits (25%)
Equity (12%)
ST wholesaleissued paper
(10%)Other debt1
maturing in the next 12 mths (9%)
3.9x excess
1.4x excess
Cash and liquidassets (34%)
Trading assets (12%)
Loan assets < 1 year
(17%)
Loan assets > 1 year
(24%)
Equity investments2
(9%)
Debt maturing beyond
12 mths (23%)
Deposits (22%)
Equity (12%)
ST wholesaleissued paper
(25%)
Other debt1maturing in thenext 12 mths
(14%)
Cash and liquidassets (28%)
Trading assets (17%)
Loan assets < 1 year
(17%)
Loan assets > 1 year
(24%)
Equity investments2
(9%)
1.1x excess
Debt maturing beyond
12 mths (22%)
Deposits (18%)
Equity (12%)
ST wholesaleissued paper
(27%)
Other debt1maturing in thenext 12 mths
(17%)
39
$Ab
$A140b
$A97b
$A243b
$A197b
$A232b
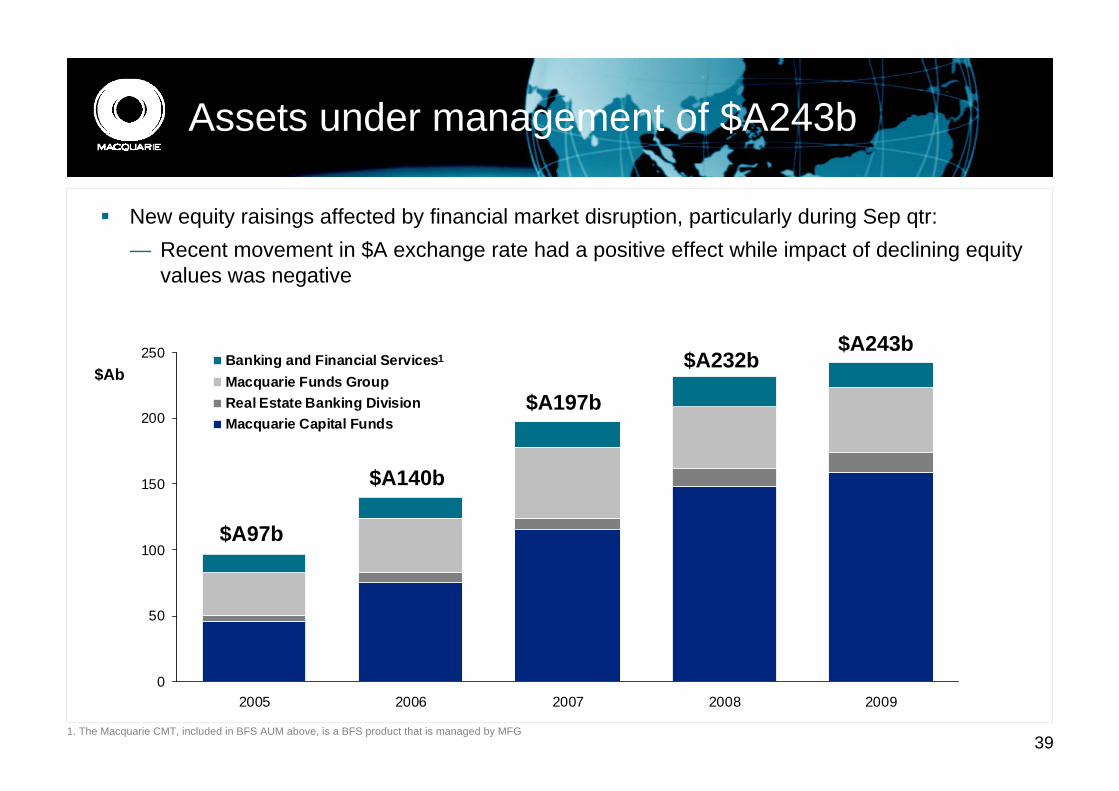
Assets under management of $A243b
New equity raisings affected by financial market disruption, particularly during Sep qtr: — Recent movement in $A exchange rate had a positive effect while impact of declining equity
values was negative
1. The Macquarie CMT, included in BFS AUM above, is a BFS product that is managed by MFG
1
0
50
100
150
200
250
2005 2006 2007 2008 2009
Banking and Financial ServicesMacquarie Funds GroupReal Estate Banking DivisionMacquarie Capital Funds
40
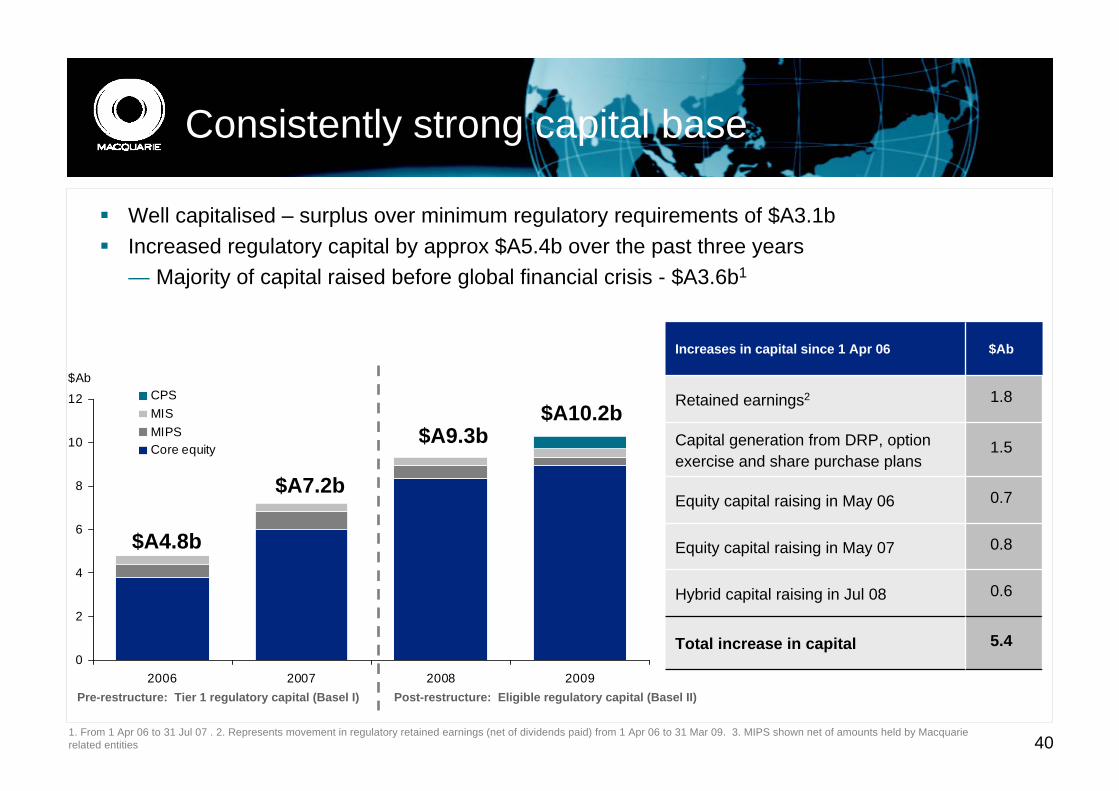
Consistently strong capital base
$A9.3b
$A7.2b
$A4.8b
Post-restructure: Eligible regulatory capital (Basel II)
$A10.2b
Pre-restructure: Tier 1 regulatory capital (Basel I)
1. From 1 Apr 06 to 31 Jul 07 . 2. Represents movement in regulatory retained earnings (net of dividends paid) from 1 Apr 06 to 31 Mar 09. 3. MIPS shown net of amounts held by Macquarie related entities
Well capitalised – surplus over minimum regulatory requirements of $A3.1bIncreased regulatory capital by approx $A5.4b over the past three years— Majority of capital raised before global financial crisis - $A3.6b1
1.5Capital generation from DRP, option exercise and share purchase plans
Increases in capital since 1 Apr 06 $Ab
Retained earnings2 1.8
Equity capital raising in May 06 0.7
Equity capital raising in May 07 0.8
Hybrid capital raising in Jul 08 0.6
Total increase in capital 5.4
3
0
2
4
6
8
10
12
2006 2007 2008 2009
$AbCPSMISMIPSCore equity
41
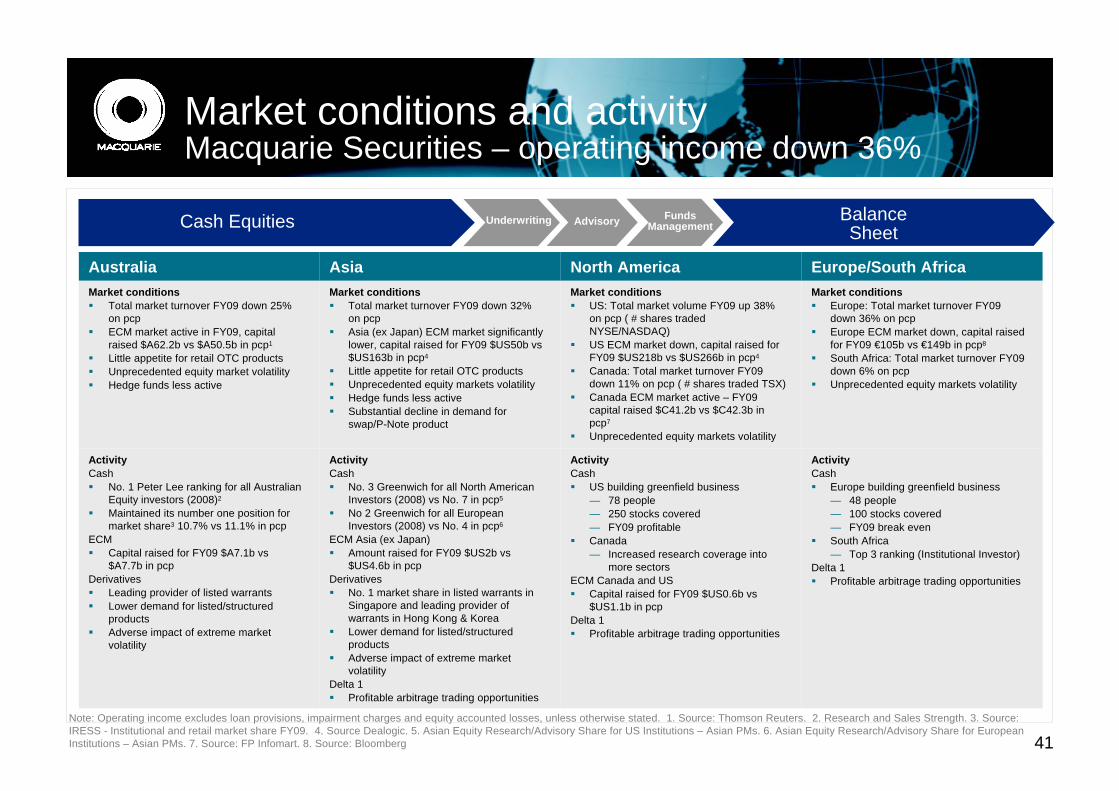
Market conditions and activity Macquarie Securities – operating income down 36%
Market conditionsEurope: Total market turnover FY09 down 36% on pcpEurope ECM market down, capital raised for FY09 €105b vs €149b in pcp8
South Africa: Total market turnover FY09 down 6% on pcpUnprecedented equity markets volatility
Market conditionsUS: Total market volume FY09 up 38% on pcp ( # shares traded NYSE/NASDAQ) US ECM market down, capital raised for FY09 $US218b vs $US266b in pcp4
Canada: Total market turnover FY09 down 11% on pcp ( # shares traded TSX) Canada ECM market active – FY09 capital raised $C41.2b vs $C42.3b in pcp7
Unprecedented equity markets volatility
Market conditionsTotal market turnover FY09 down 32% on pcpAsia (ex Japan) ECM market significantly lower, capital raised for FY09 $US50b vs $US163b in pcp4
Little appetite for retail OTC productsUnprecedented equity markets volatilityHedge funds less active Substantial decline in demand for swap/P-Note product
Market conditionsTotal market turnover FY09 down 25% on pcpECM market active in FY09, capital raised $A62.2b vs $A50.5b in pcp1
Little appetite for retail OTC productsUnprecedented equity market volatilityHedge funds less active
Activity Cash
No. 3 Greenwich for all North American Investors (2008) vs No. 7 in pcp5
No 2 Greenwich for all European Investors (2008) vs No. 4 in pcp6
ECM Asia (ex Japan)Amount raised for FY09 $US2b vs $US4.6b in pcp
DerivativesNo. 1 market share in listed warrants in Singapore and leading provider of warrants in Hong Kong & KoreaLower demand for listed/structured productsAdverse impact of extreme market volatility
Delta 1Profitable arbitrage trading opportunities
Asia
ActivityCash
US building greenfield business— 78 people— 250 stocks covered— FY09 profitableCanada— Increased research coverage into
more sectorsECM Canada and US
Capital raised for FY09 $US0.6b vs$US1.1b in pcp
Delta 1Profitable arbitrage trading opportunities
North America
Activity Cash
Europe building greenfield business— 48 people— 100 stocks covered— FY09 break evenSouth Africa— Top 3 ranking (Institutional Investor)
Delta 1Profitable arbitrage trading opportunities
Europe/South Africa
ActivityCash
No. 1 Peter Lee ranking for all Australian Equity investors (2008)2
Maintained its number one position for market share3 10.7% vs 11.1% in pcp
ECMCapital raised for FY09 $A7.1b vs $A7.7b in pcp
DerivativesLeading provider of listed warrantsLower demand for listed/structured productsAdverse impact of extreme market volatility
Australia
Underwriting Advisory FundsManagement
BalanceSheetCash Equities
Note: Operating income excludes loan provisions, impairment charges and equity accounted losses, unless otherwise stated. 1. Source: Thomson Reuters. 2. Research and Sales Strength. 3. Source: IRESS - Institutional and retail market share FY09. 4. Source Dealogic. 5. Asian Equity Research/Advisory Share for US Institutions – Asian PMs. 6. Asian Equity Research/Advisory Share for European Institutions – Asian PMs. 7. Source: FP Infomart. 8. Source: Bloomberg
42
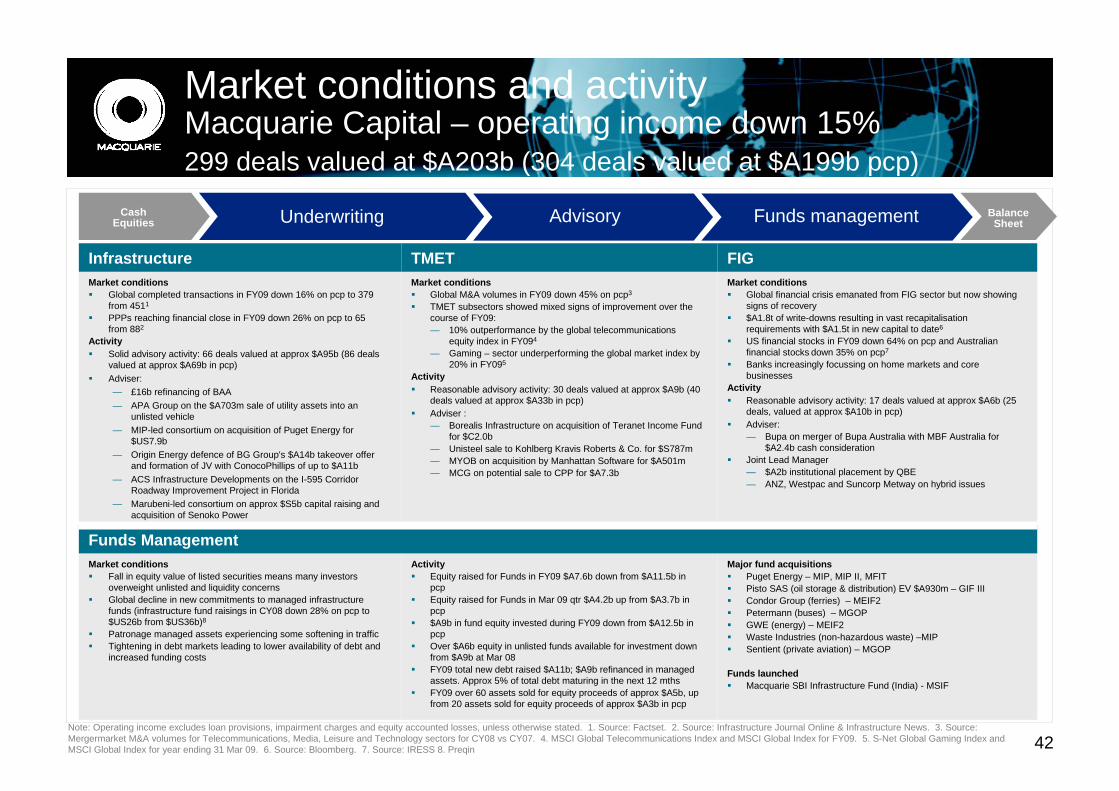
Market conditions and activityMacquarie Capital – operating income down 15%299 deals valued at $A203b (304 deals valued at $A199b pcp)
Funds ManagementMajor fund acquisitions
Puget Energy – MIP, MIP II, MFITPisto SAS (oil storage & distribution) EV $A930m – GIF IIICondor Group (ferries) – MEIF2Petermann (buses) – MGOPGWE (energy) – MEIF2Waste Industries (non-hazardous waste) –MIP Sentient (private aviation) – MGOP
Funds launchedMacquarie SBI Infrastructure Fund (India) - MSIF
ActivityEquity raised for Funds in FY09 $A7.6b down from $A11.5b in pcpEquity raised for Funds in Mar 09 qtr $A4.2b up from $A3.7b in pcp$A9b in fund equity invested during FY09 down from $A12.5b in pcpOver $A6b equity in unlisted funds available for investment downfrom $A9b at Mar 08FY09 total new debt raised $A11b; $A9b refinanced in managed assets. Approx 5% of total debt maturing in the next 12 mthsFY09 over 60 assets sold for equity proceeds of approx $A5b, up from 20 assets sold for equity proceeds of approx $A3b in pcp
Market conditionsFall in equity value of listed securities means many investors overweight unlisted and liquidity concernsGlobal decline in new commitments to managed infrastructure funds (infrastructure fund raisings in CY08 down 28% on pcp to $US26b from $US36b)8
Patronage managed assets experiencing some softening in trafficTightening in debt markets leading to lower availability of debt and increased funding costs
Market conditionsGlobal financial crisis emanated from FIG sector but now showingsigns of recovery$A1.8t of write-downs resulting in vast recapitalisation requirements with $A1.5t in new capital to date6
US financial stocks in FY09 down 64% on pcp and Australian financial stocks down 35% on pcp7
Banks increasingly focussing on home markets and core businesses
ActivityReasonable advisory activity: 17 deals valued at approx $A6b (25deals, valued at approx $A10b in pcp)Adviser:— Bupa on merger of Bupa Australia with MBF Australia for
$A2.4b cash consideration Joint Lead Manager— $A2b institutional placement by QBE — ANZ, Westpac and Suncorp Metway on hybrid issues
Market conditionsGlobal M&A volumes in FY09 down 45% on pcp3
TMET subsectors showed mixed signs of improvement over the course of FY09:— 10% outperformance by the global telecommunications
equity index in FY094
— Gaming – sector underperforming the global market index by 20% in FY095
ActivityReasonable advisory activity: 30 deals valued at approx $A9b (40deals valued at approx $A33b in pcp)Adviser :— Borealis Infrastructure on acquisition of Teranet Income Fund
for $C2.0b— Unisteel sale to Kohlberg Kravis Roberts & Co. for $S787m— MYOB on acquisition by Manhattan Software for $A501m— MCG on potential sale to CPP for $A7.3b
Market conditionsGlobal completed transactions in FY09 down 16% on pcp to 379 from 4511
PPPs reaching financial close in FY09 down 26% on pcp to 65 from 882
ActivitySolid advisory activity: 66 deals valued at approx $A95b (86 deals valued at approx $A69b in pcp)Adviser:— £16b refinancing of BAA — APA Group on the $A703m sale of utility assets into an
unlisted vehicle— MIP-led consortium on acquisition of Puget Energy for
$US7.9b— Origin Energy defence of BG Group's $A14b takeover offer
and formation of JV with ConocoPhillips of up to $A11b— ACS Infrastructure Developments on the I-595 Corridor
Roadway Improvement Project in Florida— Marubeni-led consortium on approx $S5b capital raising and
acquisition of Senoko Power
TMET FIGInfrastructure
Cash Equities Underwriting Advisory Balance
SheetFunds management
Note: Operating income excludes loan provisions, impairment charges and equity accounted losses, unless otherwise stated. 1. Source: Factset. 2. Source: Infrastructure Journal Online & Infrastructure News. 3. Source: Mergermarket M&A volumes for Telecommunications, Media, Leisure and Technology sectors for CY08 vs CY07. 4. MSCI Global Telecommunications Index and MSCI Global Index for FY09. 5. S-Net Global Gaming Index and MSCI Global Index for year ending 31 Mar 09. 6. Source: Bloomberg. 7. Source: IRESS 8. Preqin
43
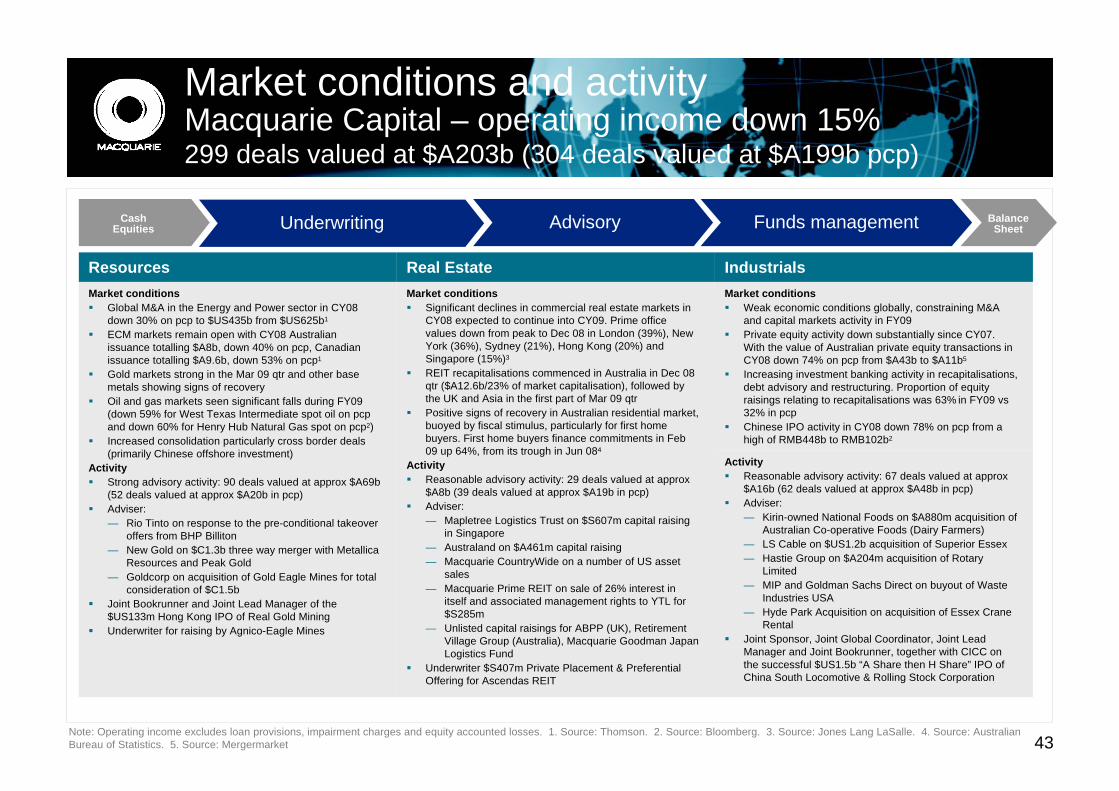
Market conditionsWeak economic conditions globally, constraining M&A and capital markets activity in FY09 Private equity activity down substantially since CY07. With the value of Australian private equity transactions in CY08 down 74% on pcp from $A43b to $A11b5
Increasing investment banking activity in recapitalisations, debt advisory and restructuring. Proportion of equity raisings relating to recapitalisations was 63% in FY09 vs 32% in pcpChinese IPO activity in CY08 down 78% on pcp from a high of RMB448b to RMB102b2
Market conditionsSignificant declines in commercial real estate markets in CY08 expected to continue into CY09. Prime office values down from peak to Dec 08 in London (39%), New York (36%), Sydney (21%), Hong Kong (20%) and Singapore (15%)3
REIT recapitalisations commenced in Australia in Dec 08 qtr ($A12.6b/23% of market capitalisation), followed by the UK and Asia in the first part of Mar 09 qtrPositive signs of recovery in Australian residential market, buoyed by fiscal stimulus, particularly for first home buyers. First home buyers finance commitments in Feb 09 up 64%, from its trough in Jun 084
ActivityReasonable advisory activity: 29 deals valued at approx $A8b (39 deals valued at approx $A19b in pcp)Adviser:— Mapletree Logistics Trust on $S607m capital raising
in Singapore— Australand on $A461m capital raising — Macquarie CountryWide on a number of US asset
sales— Macquarie Prime REIT on sale of 26% interest in
itself and associated management rights to YTL for $S285m
— Unlisted capital raisings for ABPP (UK), Retirement Village Group (Australia), Macquarie Goodman Japan Logistics Fund
Underwriter $S407m Private Placement & Preferential Offering for Ascendas REIT
Market conditionsGlobal M&A in the Energy and Power sector in CY08 down 30% on pcp to $US435b from $US625b1
ECM markets remain open with CY08 Australian issuance totalling $A8b, down 40% on pcp, Canadian issuance totalling $A9.6b, down 53% on pcp1
Gold markets strong in the Mar 09 qtr and other base metals showing signs of recoveryOil and gas markets seen significant falls during FY09 (down 59% for West Texas Intermediate spot oil on pcp and down 60% for Henry Hub Natural Gas spot on pcp2)Increased consolidation particularly cross border deals (primarily Chinese offshore investment)
ActivityStrong advisory activity: 90 deals valued at approx $A69b (52 deals valued at approx $A20b in pcp)Adviser:— Rio Tinto on response to the pre-conditional takeover
offers from BHP Billiton — New Gold on $C1.3b three way merger with Metallica
Resources and Peak Gold — Goldcorp on acquisition of Gold Eagle Mines for total
consideration of $C1.5bJoint Bookrunner and Joint Lead Manager of the $US133m Hong Kong IPO of Real Gold MiningUnderwriter for raising by Agnico-Eagle Mines
Resources Real Estate
ActivityReasonable advisory activity: 67 deals valued at approx $A16b (62 deals valued at approx $A48b in pcp)Adviser:— Kirin-owned National Foods on $A880m acquisition of
Australian Co-operative Foods (Dairy Farmers)— LS Cable on $US1.2b acquisition of Superior Essex— Hastie Group on $A204m acquisition of Rotary
Limited — MIP and Goldman Sachs Direct on buyout of Waste
Industries USA— Hyde Park Acquisition on acquisition of Essex Crane
RentalJoint Sponsor, Joint Global Coordinator, Joint Lead Manager and Joint Bookrunner, together with CICC on the successful $US1.5b “A Share then H Share” IPO of China South Locomotive & Rolling Stock Corporation
Industrials
Cash Equities Underwriting Advisory Balance
SheetFunds management
Market conditions and activityMacquarie Capital – operating income down 15%299 deals valued at $A203b (304 deals valued at $A199b pcp)
Note: Operating income excludes loan provisions, impairment charges and equity accounted losses. 1. Source: Thomson. 2. Source: Bloomberg. 3. Source: Jones Lang LaSalle. 4. Source: Australian Bureau of Statistics. 5. Source: Mergermarket
44
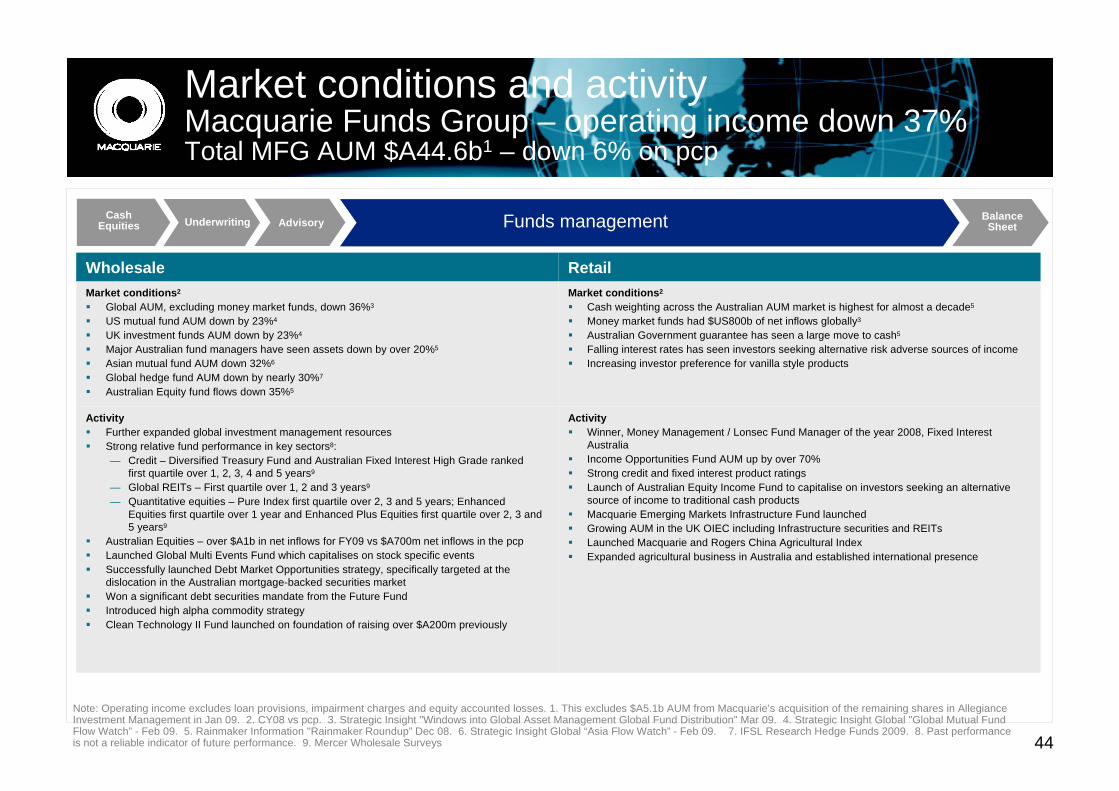
Market conditions and activity Macquarie Funds Group – operating income down 37%Total MFG AUM $A44.6b1 – down 6% on pcp
Market conditions2
Cash weighting across the Australian AUM market is highest for almost a decade5
Money market funds had $US800b of net inflows globally3
Australian Government guarantee has seen a large move to cash5
Falling interest rates has seen investors seeking alternative risk adverse sources of incomeIncreasing investor preference for vanilla style products
Market conditions2
Global AUM, excluding money market funds, down 36%3
US mutual fund AUM down by 23%4
UK investment funds AUM down by 23%4
Major Australian fund managers have seen assets down by over 20%5
Asian mutual fund AUM down 32%6
Global hedge fund AUM down by nearly 30%7
Australian Equity fund flows down 35%5
ActivityWinner, Money Management / Lonsec Fund Manager of the year 2008, Fixed Interest AustraliaIncome Opportunities Fund AUM up by over 70% Strong credit and fixed interest product ratingsLaunch of Australian Equity Income Fund to capitalise on investors seeking an alternative source of income to traditional cash productsMacquarie Emerging Markets Infrastructure Fund launched Growing AUM in the UK OIEC including Infrastructure securities and REITsLaunched Macquarie and Rogers China Agricultural IndexExpanded agricultural business in Australia and established international presence
Retail
Activity Further expanded global investment management resourcesStrong relative fund performance in key sectors8:— Credit – Diversified Treasury Fund and Australian Fixed Interest High Grade ranked
first quartile over 1, 2, 3, 4 and 5 years9
— Global REITs – First quartile over 1, 2 and 3 years9
— Quantitative equities – Pure Index first quartile over 2, 3 and 5 years; Enhanced Equities first quartile over 1 year and Enhanced Plus Equities first quartile over 2, 3 and 5 years9
Australian Equities – over $A1b in net inflows for FY09 vs $A700m net inflows in the pcpLaunched Global Multi Events Fund which capitalises on stock specific events Successfully launched Debt Market Opportunities strategy, specifically targeted at the dislocation in the Australian mortgage-backed securities marketWon a significant debt securities mandate from the Future Fund Introduced high alpha commodity strategy Clean Technology II Fund launched on foundation of raising over $A200m previously
Wholesale
Advisory Funds management BalanceSheet
Cash Equities Underwriting Advisory
Note: Operating income excludes loan provisions, impairment charges and equity accounted losses. 1. This excludes $A5.1b AUM from Macquarie’s acquisition of the remaining shares in Allegiance Investment Management in Jan 09. 2. CY08 vs pcp. 3. Strategic Insight "Windows into Global Asset Management Global Fund Distribution" Mar 09. 4. Strategic Insight Global "Global Mutual Fund Flow Watch” - Feb 09. 5. Rainmaker Information "Rainmaker Roundup” Dec 08. 6. Strategic Insight Global “Asia Flow Watch” - Feb 09. 7. IFSL Research Hedge Funds 2009. 8. Past performance is not a reliable indicator of future performance. 9. Mercer Wholesale Surveys
45
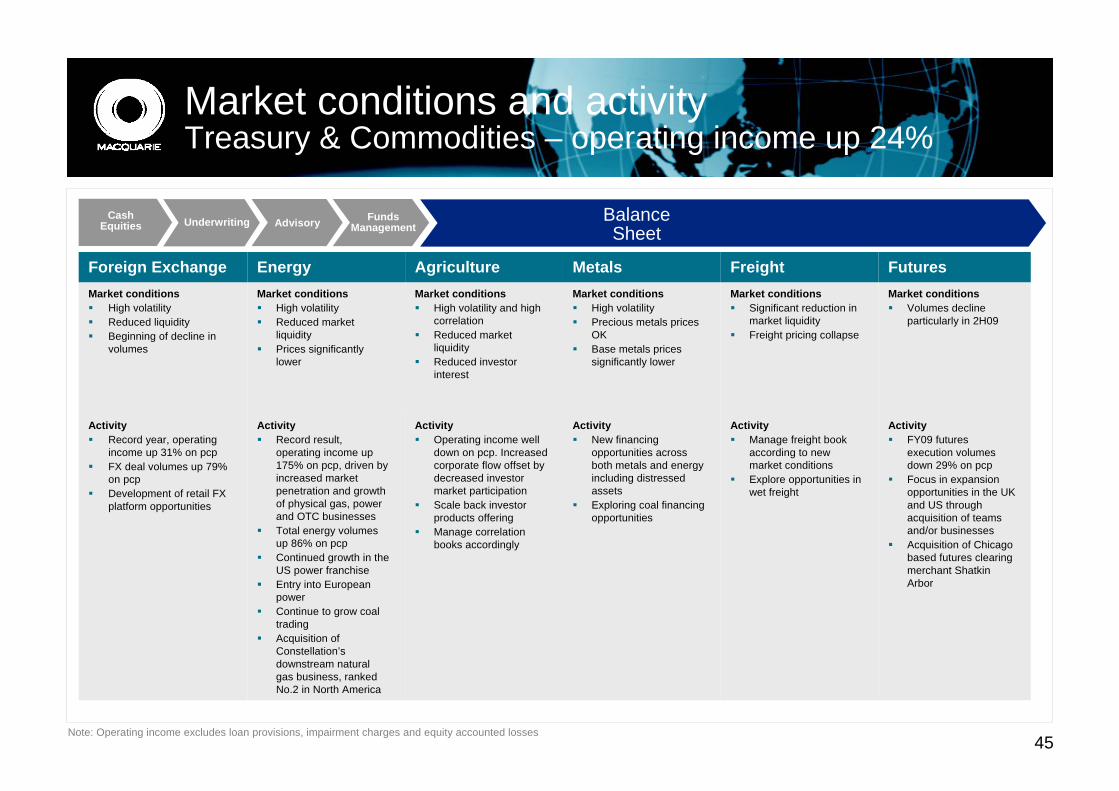
Market conditions and activity Treasury & Commodities – operating income up 24%
Market conditionsVolumes decline particularly in 2H09
Market conditionsSignificant reduction in market liquidity Freight pricing collapse
Market conditionsHigh volatilityPrecious metals prices OK Base metals prices significantly lower
Market conditionsHigh volatility and high correlation Reduced market liquidity Reduced investor interest
Market conditionsHigh volatility Reduced market liquidityPrices significantly lower
Market conditionsHigh volatility Reduced liquidityBeginning of decline in volumes
Foreign Exchange Energy Agriculture Metals Freight Futures
ActivityRecord year, operating income up 31% on pcpFX deal volumes up 79% on pcp Development of retail FX platform opportunities
ActivityRecord result, operating income up 175% on pcp, driven by increased market penetration and growth of physical gas, power and OTC businessesTotal energy volumes up 86% on pcp Continued growth in the US power franchise Entry into European power Continue to grow coal tradingAcquisition of Constellation’s downstream natural gas business, ranked No.2 in North America
Activity Operating income well down on pcp. Increased corporate flow offset by decreased investor market participation Scale back investor products offering Manage correlation books accordingly
ActivityNew financing opportunities across both metals and energy including distressed assetsExploring coal financing opportunities
ActivityManage freight book according to new market conditions Explore opportunities in wet freight
ActivityFY09 futures execution volumes down 29% on pcpFocus in expansion opportunities in the UK and US through acquisition of teams and/or businesses Acquisition of Chicago based futures clearing merchant ShatkinArbor
Cash Equities Underwriting Advisory Funds
ManagementBalanceSheet
Note: Operating income excludes loan provisions, impairment charges and equity accounted losses
46
Market conditions and activity Other banking divisions
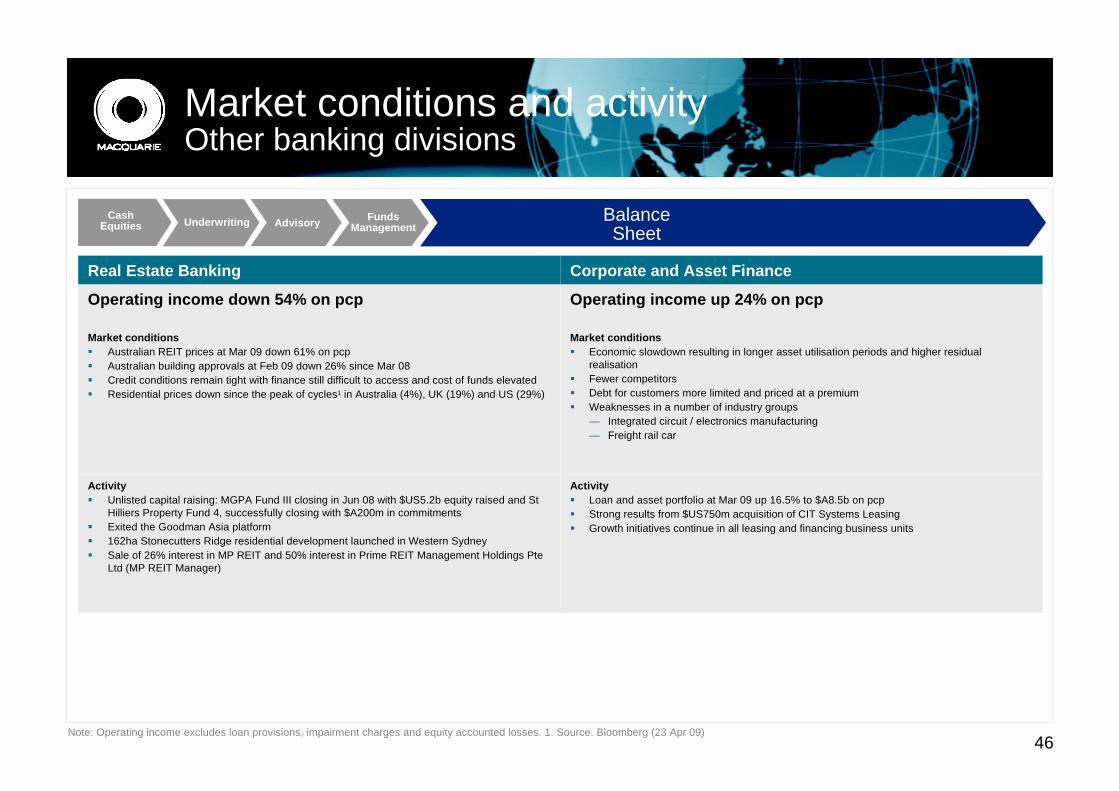
Operating income up 24% on pcp
Market conditionsEconomic slowdown resulting in longer asset utilisation periods and higher residual realisation Fewer competitorsDebt for customers more limited and priced at a premiumWeaknesses in a number of industry groups— Integrated circuit / electronics manufacturing— Freight rail car
Operating income down 54% on pcp
Market conditionsAustralian REIT prices at Mar 09 down 61% on pcpAustralian building approvals at Feb 09 down 26% since Mar 08Credit conditions remain tight with finance still difficult to access and cost of funds elevatedResidential prices down since the peak of cycles1 in Australia (4%), UK (19%) and US (29%)
ActivityLoan and asset portfolio at Mar 09 up 16.5% to $A8.5b on pcpStrong results from $US750m acquisition of CIT Systems LeasingGrowth initiatives continue in all leasing and financing business units
Corporate and Asset Finance
ActivityUnlisted capital raising: MGPA Fund III closing in Jun 08 with $US5.2b equity raised and St Hilliers Property Fund 4, successfully closing with $A200m in commitmentsExited the Goodman Asia platform162ha Stonecutters Ridge residential development launched in Western SydneySale of 26% interest in MP REIT and 50% interest in Prime REIT Management Holdings Pte Ltd (MP REIT Manager)
Real Estate Banking
Cash Equities Underwriting Advisory Funds
ManagementBalanceSheet
Note: Operating income excludes loan provisions, impairment charges and equity accounted losses. 1. Source: Bloomberg (23 Apr 09)
47
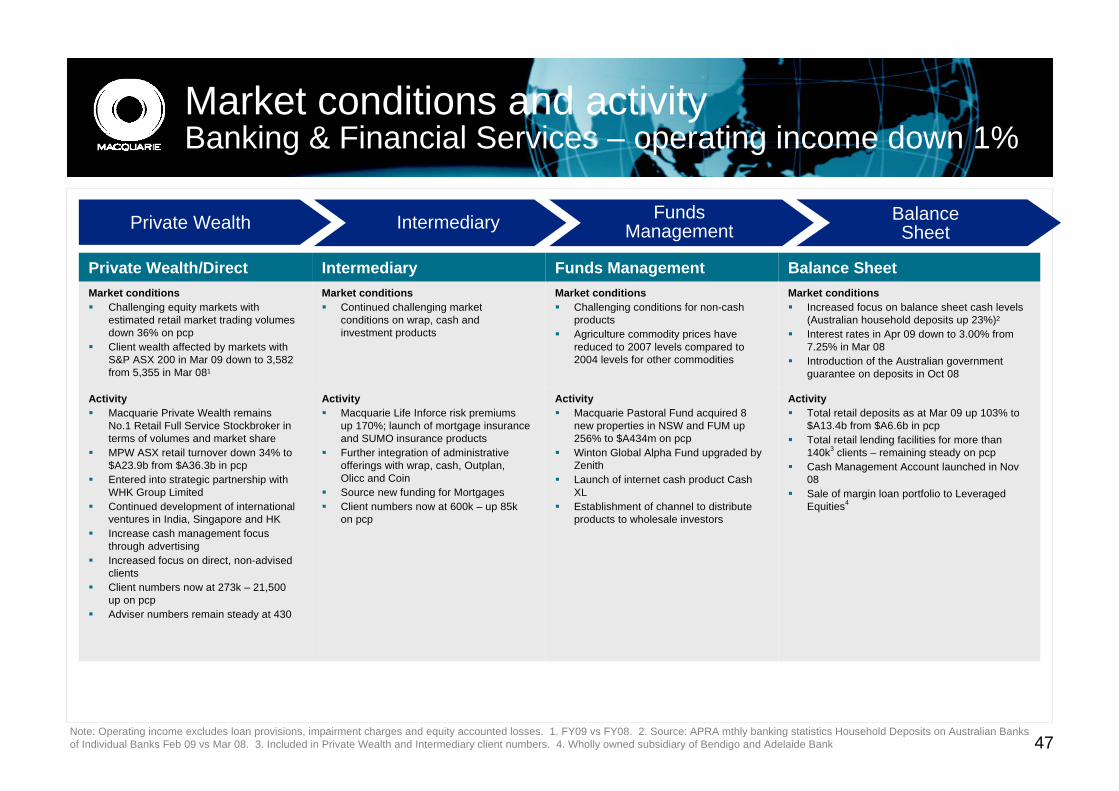
Market conditions and activity Banking & Financial Services – operating income down 1%
Note: Operating income excludes loan provisions, impairment charges and equity accounted losses. 1. FY09 vs FY08. 2. Source: APRA mthly banking statistics Household Deposits on Australian Banks of Individual Banks Feb 09 vs Mar 08. 3. Included in Private Wealth and Intermediary client numbers. 4. Wholly owned subsidiary of Bendigo and Adelaide Bank
Market conditionsIncreased focus on balance sheet cash levels (Australian household deposits up 23%)2
Interest rates in Apr 09 down to 3.00% from 7.25% in Mar 08Introduction of the Australian government guarantee on deposits in Oct 08
Market conditionsChallenging conditions for non-cash productsAgriculture commodity prices have reduced to 2007 levels compared to 2004 levels for other commodities
Market conditionsContinued challenging market conditions on wrap, cash and investment products
Market conditionsChallenging equity markets with estimated retail market trading volumes down 36% on pcpClient wealth affected by markets with S&P ASX 200 in Mar 09 down to 3,582 from 5,355 in Mar 081
ActivityMacquarie Life Inforce risk premiums up 170%; launch of mortgage insurance and SUMO insurance productsFurther integration of administrative offerings with wrap, cash, Outplan, Olicc and CoinSource new funding for MortgagesClient numbers now at 600k – up 85k on pcp
Intermediary
ActivityMacquarie Pastoral Fund acquired 8 new properties in NSW and FUM up 256% to $A434m on pcpWinton Global Alpha Fund upgraded by ZenithLaunch of internet cash product Cash XLEstablishment of channel to distribute products to wholesale investors
Funds Management
ActivityTotal retail deposits as at Mar 09 up 103% to $A13.4b from $A6.6b in pcpTotal retail lending facilities for more than 140k3 clients – remaining steady on pcpCash Management Account launched in Nov 08 Sale of margin loan portfolio to Leveraged Equities4
Balance Sheet
ActivityMacquarie Private Wealth remains No.1 Retail Full Service Stockbroker in terms of volumes and market share MPW ASX retail turnover down 34% to $A23.9b from $A36.3b in pcpEntered into strategic partnership with WHK Group LimitedContinued development of international ventures in India, Singapore and HKIncrease cash management focus through advertisingIncreased focus on direct, non-advisedclients Client numbers now at 273k – 21,500 up on pcpAdviser numbers remain steady at 430
Private Wealth/Direct
Private Wealth Intermediary FundsManagement
BalanceSheet

Further Information:Result Analysis
49
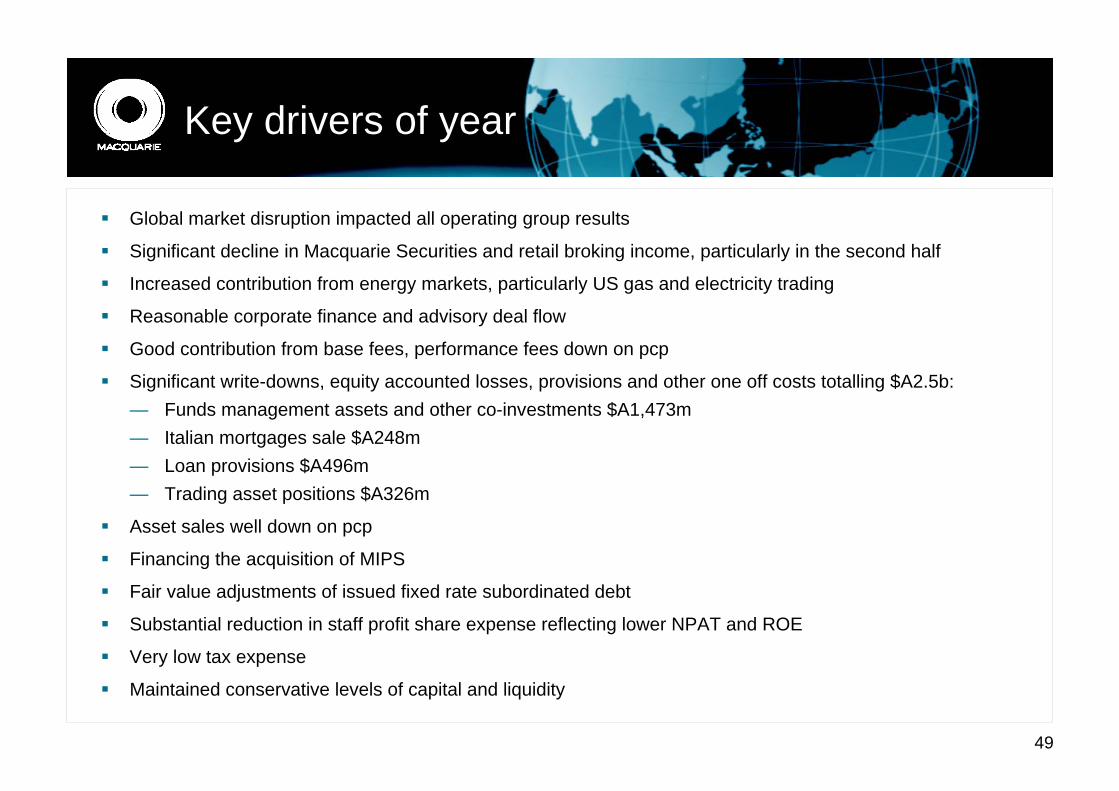
Key drivers of year
Global market disruption impacted all operating group results
Significant decline in Macquarie Securities and retail broking income, particularly in the second half
Increased contribution from energy markets, particularly US gas and electricity trading
Reasonable corporate finance and advisory deal flow
Good contribution from base fees, performance fees down on pcp
Significant write-downs, equity accounted losses, provisions and other one off costs totalling $A2.5b:— Funds management assets and other co-investments $A1,473m— Italian mortgages sale $A248m— Loan provisions $A496m— Trading asset positions $A326m
Asset sales well down on pcp
Financing the acquisition of MIPS
Fair value adjustments of issued fixed rate subordinated debt
Substantial reduction in staff profit share expense reflecting lower NPAT and ROE
Very low tax expense
Maintained conservative levels of capital and liquidity
50
Refer slide 11209(616)(1,901)Write-downs, impairment charges
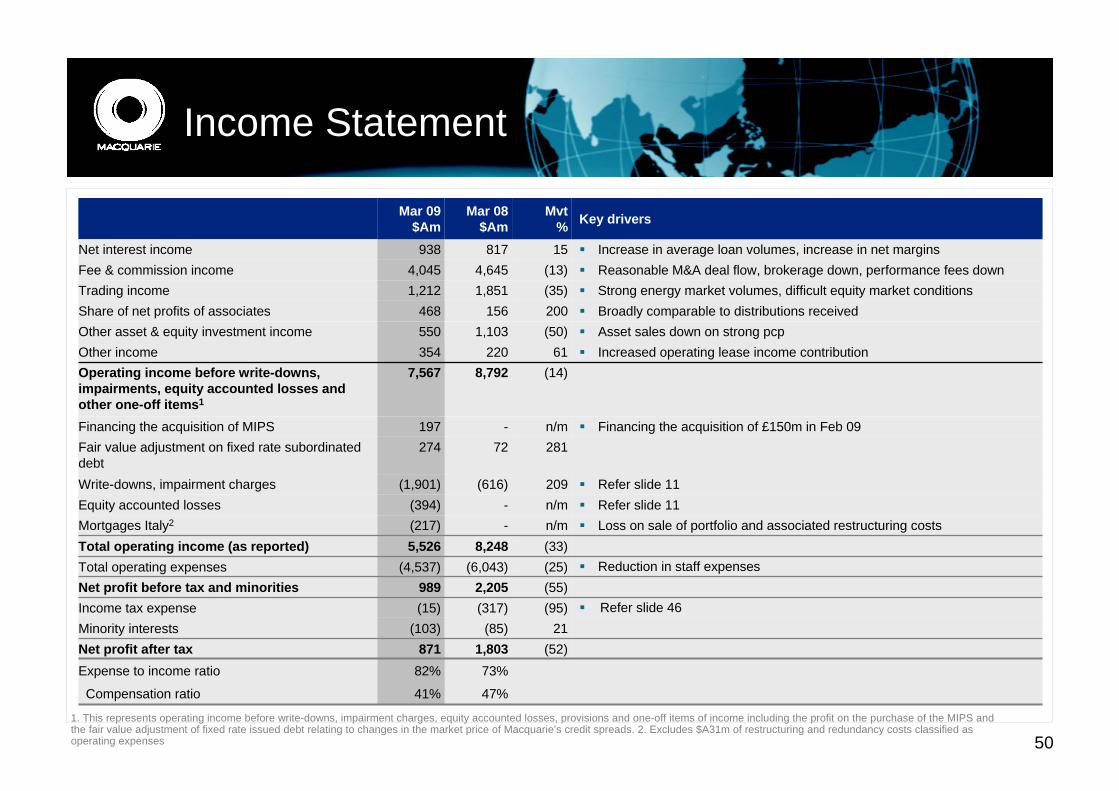
(14)8,7927,567Operating income before write-downs, impairments, equity accounted losses and other one-off items1
Increased operating lease income contribution61220354Other income
28172274Fair value adjustment on fixed rate subordinated debt
Financing the acquisition of £150m in Feb 09n/m-197Financing the acquisition of MIPS
Broadly comparable to distributions received200156468Share of net profits of associates
47%41%Compensation ratio
73%82%Expense to income ratio
Refer slide 11n/m-(394)Equity accounted lossesLoss on sale of portfolio and associated restructuring costsn/m-(217)Mortgages Italy2
(52)1,803871Net profit after tax
Refer slide 46
Reduction in staff expenses
Asset sales down on strong pcp
Strong energy market volumes, difficult equity market conditionsReasonable M&A deal flow, brokerage down, performance fees downIncrease in average loan volumes, increase in net margins
Key drivers
(103)(15)989
(4,537)5,526
550
1,2124,045
938
Mar 09$Am
(95)(317)Income tax expense21(85)Minority interests
(55)2,205Net profit before tax and minorities
(50)1,103Other asset & equity investment income
(25)(33)
(35)(13)
15
Mvt%
(6,043)8,248
1,8514,645
817
Mar 08$Am
Total operating income (as reported)Total operating expenses
Trading incomeFee & commission incomeNet interest income
Income Statement
1. This represents operating income before write-downs, impairment charges, equity accounted losses, provisions and one-off items of income including the profit on the purchase of the MIPS and the fair value adjustment of fixed rate issued debt relating to changes in the market price of Macquarie’s credit spreads. 2. Excludes $A31m of restructuring and redundancy costs classified as operating expenses
51
n/m-197Financing the acquisition of MIPS
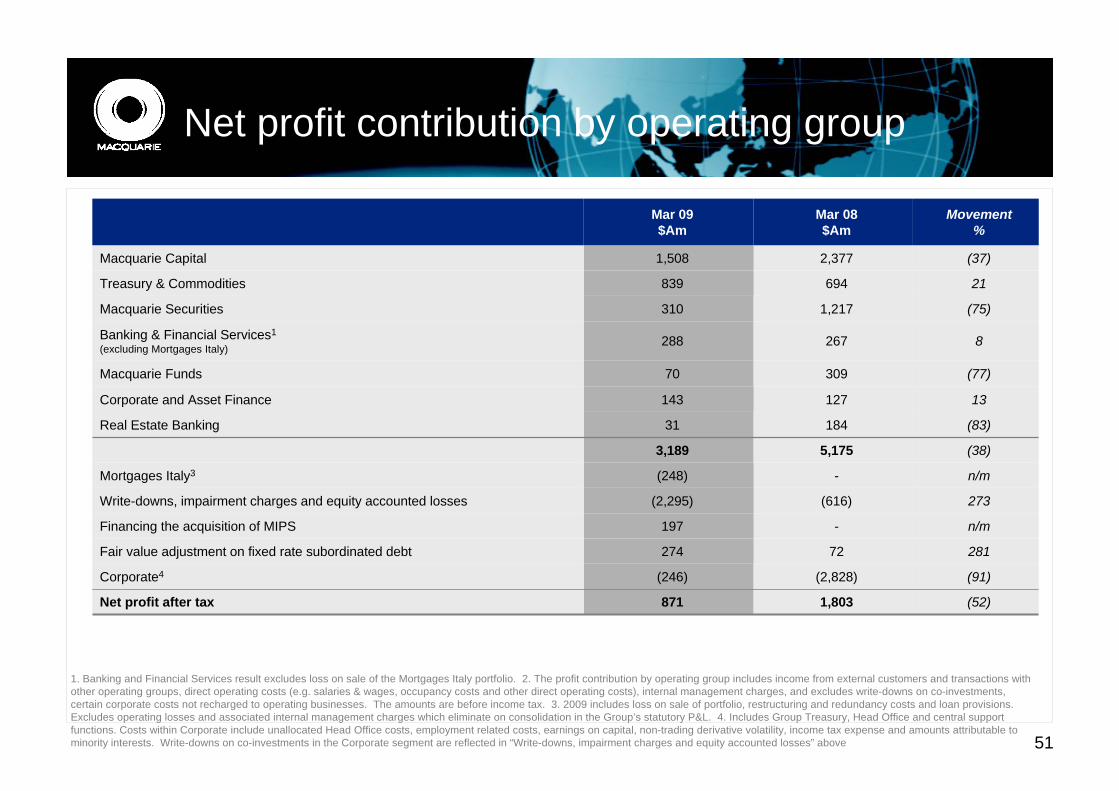
273(616)(2,295)Write-downs, impairment charges and equity accounted losses
13127143Corporate and Asset Finance
(37)2,3771,508Macquarie Capital
21694839Treasury & Commodities
(52)
(91)
281
n/m
(38)
(83)
(77)
8
(75)
Movement%
72274Fair value adjustment on fixed rate subordinated debt
-(248)Mortgages Italy3
871
(246)
3,189
31
70
288
310
Mar 09$Am
1,803
(2,828)
5,175
184
309
267
1,217
Mar 08$Am
Real Estate Banking
Corporate4
Banking & Financial Services1
(excluding Mortgages Italy)
Macquarie Funds
Macquarie Securities
Net profit after tax
1. Banking and Financial Services result excludes loss on sale of the Mortgages Italy portfolio. 2. The profit contribution by operating group includes income from external customers and transactions with other operating groups, direct operating costs (e.g. salaries & wages, occupancy costs and other direct operating costs), internal management charges, and excludes write-downs on co-investments, certain corporate costs not recharged to operating businesses. The amounts are before income tax. 3. 2009 includes loss on sale of portfolio, restructuring and redundancy costs and loan provisions. Excludes operating losses and associated internal management charges which eliminate on consolidation in the Group’s statutory P&L. 4. Includes Group Treasury, Head Office and central support functions. Costs within Corporate include unallocated Head Office costs, employment related costs, earnings on capital, non-trading derivative volatility, income tax expense and amounts attributable to minority interests. Write-downs on co-investments in the Corporate segment are reflected in “Write-downs, impairment charges and equity accounted losses” above
Net profit contribution by operating group
52
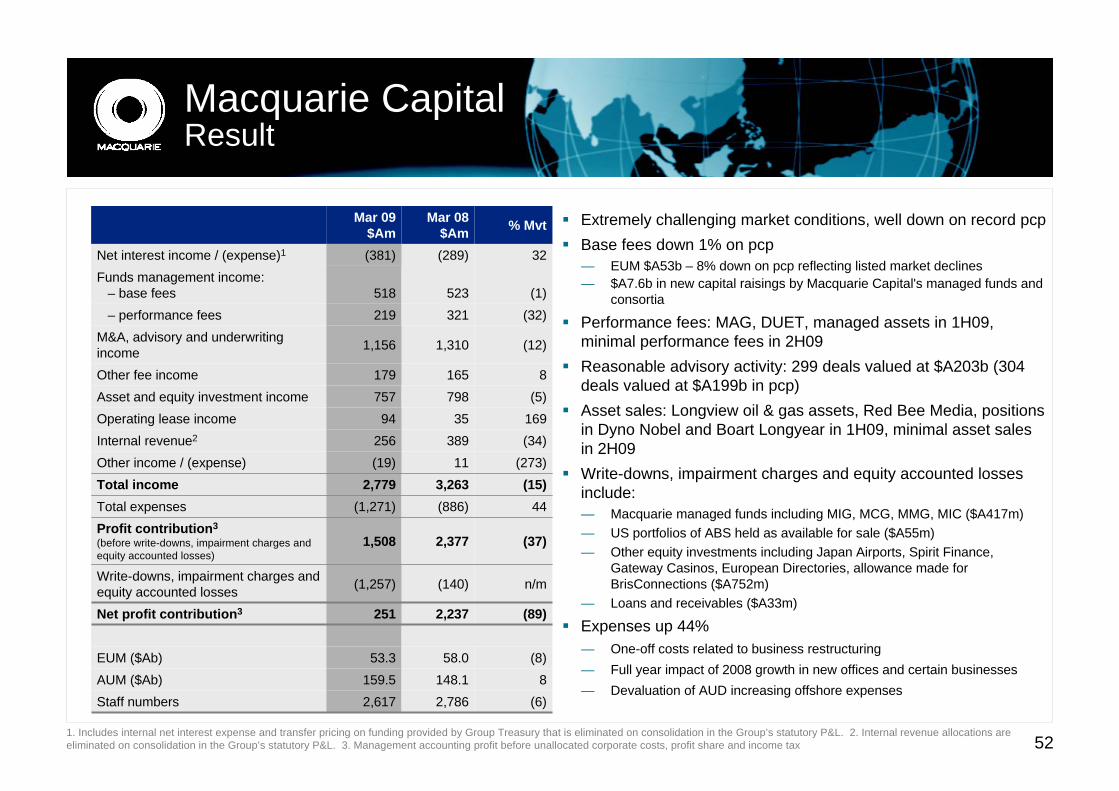
(273)11(19)Other income / (expense)
n/m(140)(1,257)Write-downs, impairment charges and equity accounted losses
(89)2,237251Net profit contribution3
(34)389256Internal revenue2
1693594Operating lease income
8165179Other fee income
(12)1,3101,156M&A, advisory and underwriting income
32(289)(381)Net interest income / (expense)1
2,617159.553.3
1,508
(1,271)2,779
757
219518
Mar 09 $Am
(8)58.0EUM ($Ab)8148.1AUM ($Ab)
(1)523Funds management income:
– base fees(32)321– performance fees
(37)2,377Profit contribution3
(before write-downs, impairment charges and equity accounted losses)
(6)
44(15)
(5)
% Mvt
2,786
(886)3,263
798
Mar 08$Am
Total income Total expenses
Staff numbers
Asset and equity investment income
AmericasMacCap
Securities19%
MacCapAdvisers
45%
Macquarie Capital Result
Extremely challenging market conditions, well down on record pcpBase fees down 1% on pcp— EUM $A53b – 8% down on pcp reflecting listed market declines— $A7.6b in new capital raisings by Macquarie Capital's managed funds and
consortia
Performance fees: MAG, DUET, managed assets in 1H09, minimal performance fees in 2H09Reasonable advisory activity: 299 deals valued at $A203b (304 deals valued at $A199b in pcp)Asset sales: Longview oil & gas assets, Red Bee Media, positionsin Dyno Nobel and Boart Longyear in 1H09, minimal asset sales in 2H09Write-downs, impairment charges and equity accounted losses include:— Macquarie managed funds including MIG, MCG, MMG, MIC ($A417m)— US portfolios of ABS held as available for sale ($A55m)— Other equity investments including Japan Airports, Spirit Finance,
Gateway Casinos, European Directories, allowance made for BrisConnections ($A752m)
— Loans and receivables ($A33m)
Expenses up 44%— One-off costs related to business restructuring— Full year impact of 2008 growth in new offices and certain businesses— Devaluation of AUD increasing offshore expenses
1. Includes internal net interest expense and transfer pricing on funding provided by Group Treasury that is eliminated on consolidation in the Group’s statutory P&L. 2. Internal revenue allocations are eliminated on consolidation in the Group’s statutory P&L. 3. Management accounting profit before unallocated corporate costs, profit share and income tax
53
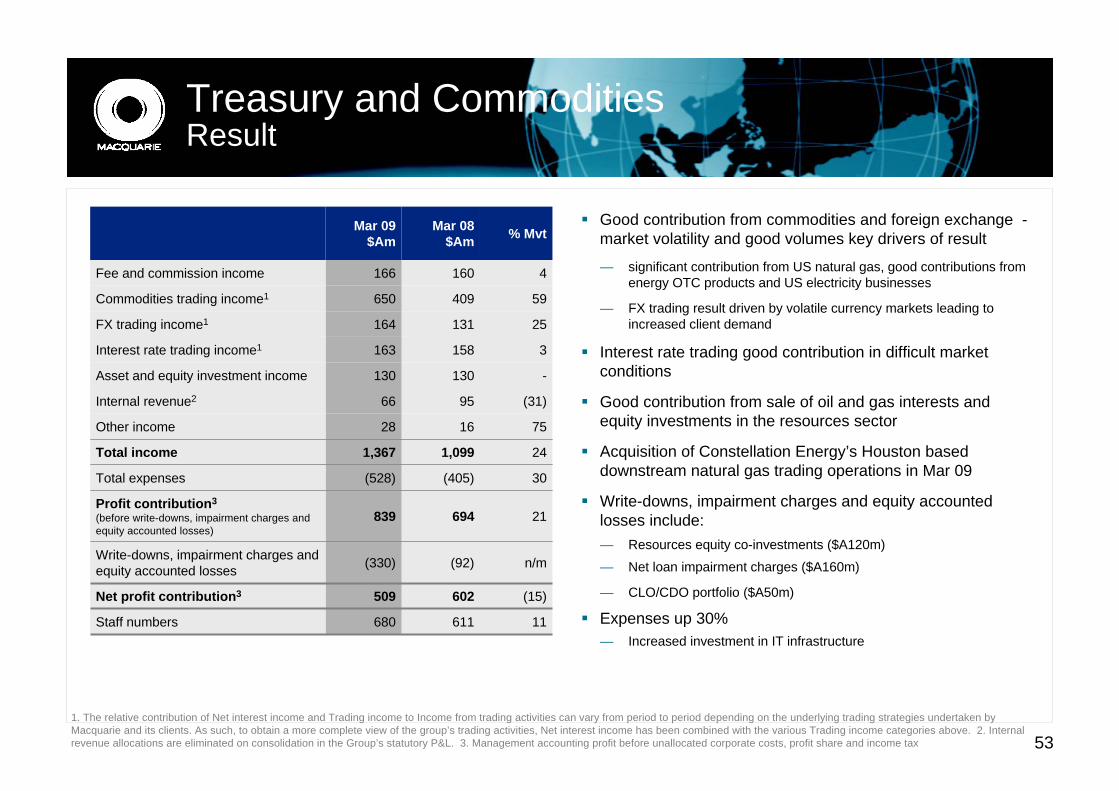
21694839Profit contribution3
(before write-downs, impairment charges and equity accounted losses)
n/m(92)(330)Write-downs, impairment charges and equity accounted losses
(31)9566Internal revenue2
-130130Asset and equity investment income
4160166Fee and commission income
25131164FX trading income1
3158163Interest rate trading income1
59409650Commodities trading income1
(15)602509Net profit contribution3
611
(405)
1,099
16
Mar 08$Am
11
30
24
75
% Mvt
680
(528)
1,367
28
Mar 09 $Am
Total income
Other income
Total expenses
Staff numbers
Good contribution from commodities and foreign exchange -market volatility and good volumes key drivers of result
— significant contribution from US natural gas, good contributions from energy OTC products and US electricity businesses
— FX trading result driven by volatile currency markets leading toincreased client demand
Interest rate trading good contribution in difficult market conditions
Good contribution from sale of oil and gas interests and equity investments in the resources sector
Acquisition of Constellation Energy’s Houston based downstream natural gas trading operations in Mar 09
Write-downs, impairment charges and equity accounted losses include:— Resources equity co-investments ($A120m)
— Net loan impairment charges ($A160m)
— CLO/CDO portfolio ($A50m)
Expenses up 30%— Increased investment in IT infrastructure
Treasury and CommoditiesResult
1. The relative contribution of Net interest income and Trading income to Income from trading activities can vary from period to period depending on the underlying trading strategies undertaken by Macquarie and its clients. As such, to obtain a more complete view of the group’s trading activities, Net interest income has been combined with the various Trading income categories above. 2. Internal revenue allocations are eliminated on consolidation in the Group’s statutory P&L. 3. Management accounting profit before unallocated corporate costs, profit share and income tax
54
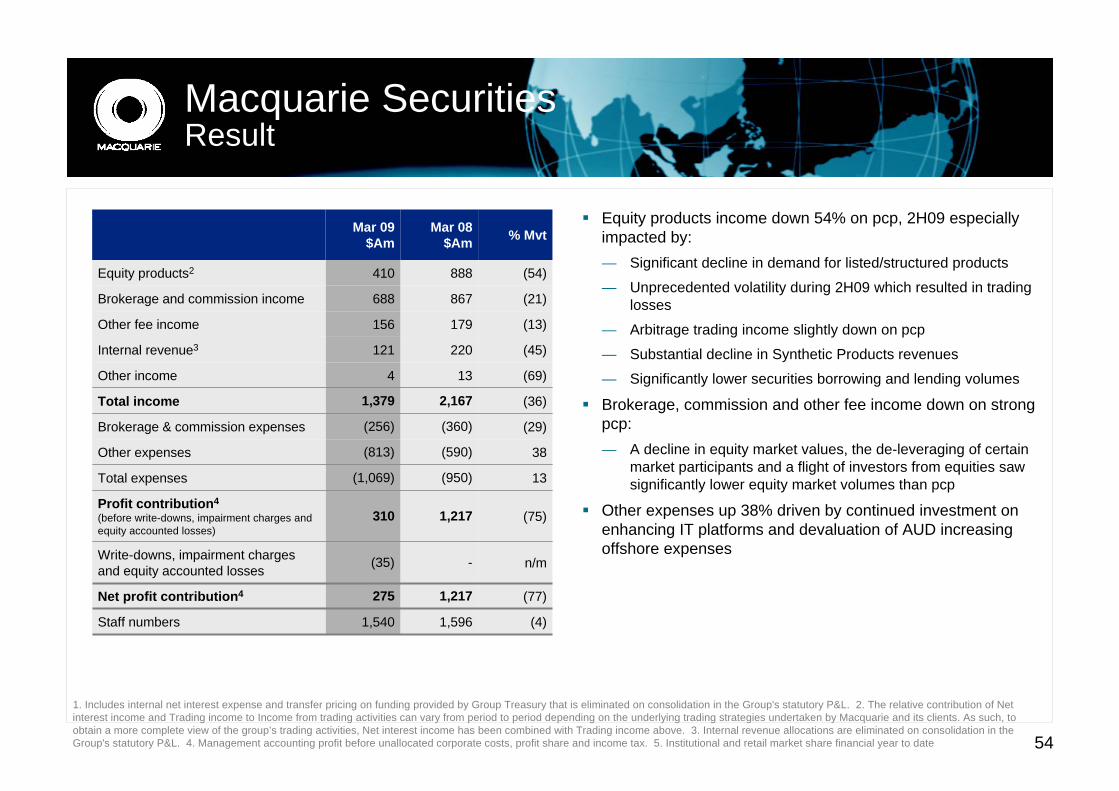
(54)888410Equity products2
n/m-(35)Write-downs, impairment charges and equity accounted losses
(75)1,217310Profit contribution4
(before write-downs, impairment charges and equity accounted losses)
(29)(360)(256)Brokerage & commission expenses
38(590)(813)Other expenses
(13)179156Other fee income
(45)220121Internal revenue3
(21)867688Brokerage and commission income
(77)1,217275Net profit contribution4
1,596
(950)
2,167
13
Mar 08$Am
(4)
13
(36)
(69)
% Mvt
1,540
(1,069)
1,379
4
Mar 09 $Am
Total income
Other income
Total expenses
Staff numbers
Macquarie SecuritiesResult
Equity products income down 54% on pcp, 2H09 especially impacted by:— Significant decline in demand for listed/structured products
— Unprecedented volatility during 2H09 which resulted in trading losses
— Arbitrage trading income slightly down on pcp
— Substantial decline in Synthetic Products revenues
— Significantly lower securities borrowing and lending volumes
Brokerage, commission and other fee income down on strong pcp:— A decline in equity market values, the de-leveraging of certain
market participants and a flight of investors from equities saw significantly lower equity market volumes than pcp
Other expenses up 38% driven by continued investment on enhancing IT platforms and devaluation of AUD increasing offshore expenses
1. Includes internal net interest expense and transfer pricing on funding provided by Group Treasury that is eliminated on consolidation in the Group's statutory P&L. 2. The relative contribution of Net interest income and Trading income to Income from trading activities can vary from period to period depending on the underlying trading strategies undertaken by Macquarie and its clients. As such, to obtain a more complete view of the group’s trading activities, Net interest income has been combined with Trading income above. 3. Internal revenue allocations are eliminated on consolidation in the Group's statutory P&L. 4. Management accounting profit before unallocated corporate costs, profit share and income tax. 5. Institutional and retail market share financial year to date
55
n/m149Asset and equity investment income
379(29)(139)Write-downs, impairment charges and equity accounted losses
(9)114104FUM / FUA6 ($Ab)
n/m238(99)Net profit contribution3
n/m7(22)Internal revenue2
325775Banking, lending and securitisation fee income
(23)256198Brokerage and commissions
n/m-(248)Mortgages Italy4
26338425Net interest income1
(7)247229Funds management income
(7)144134Platform and other administration fee income
(17)23.119.2AUM5 ($Ab)
8267288Profit contribution3(excl. Mortgages Italy and before write-downs, impairment charges and equity accounted losses)
3,058
(903)1,170
120
Mar 08$Am
(15)
(3)(1)
(39)
% Mvt
2,598
(873)1,161
73
Mar 09 $Am
Total income Other income
Total expenses
Staff numbers
Banking and Financial ServicesResult
1. Includes internal net interest expense and transfer pricing on funding provided by Group Treasury that is eliminated on consolidation in the Group’s statutory P&L. 2. Internal revenue allocations are eliminated on consolidation in the Group’s statutory P&L. 3. Management accounting profit before unallocated corporate costs, profit share and income tax. 4. Excludes operating losses and internal management charges (eliminated on consolidation in the Group's statutory P&L) totalling $A59m. These amounts are included in “Profit contribution” above. 5. The Macquarie CMT, reported in AUM above, is a BFS marketed product that is managed by MFG. 6. Funds under management / advice/ administration (“FUM / FUA” ) includes AUM, funds on BFS platforms (eg. Wrap FUA), total loan & deposit portfolios, client CHESS holdings and funds under advice (eg. Macquarie Private Bank). 7. Based on consideration traded
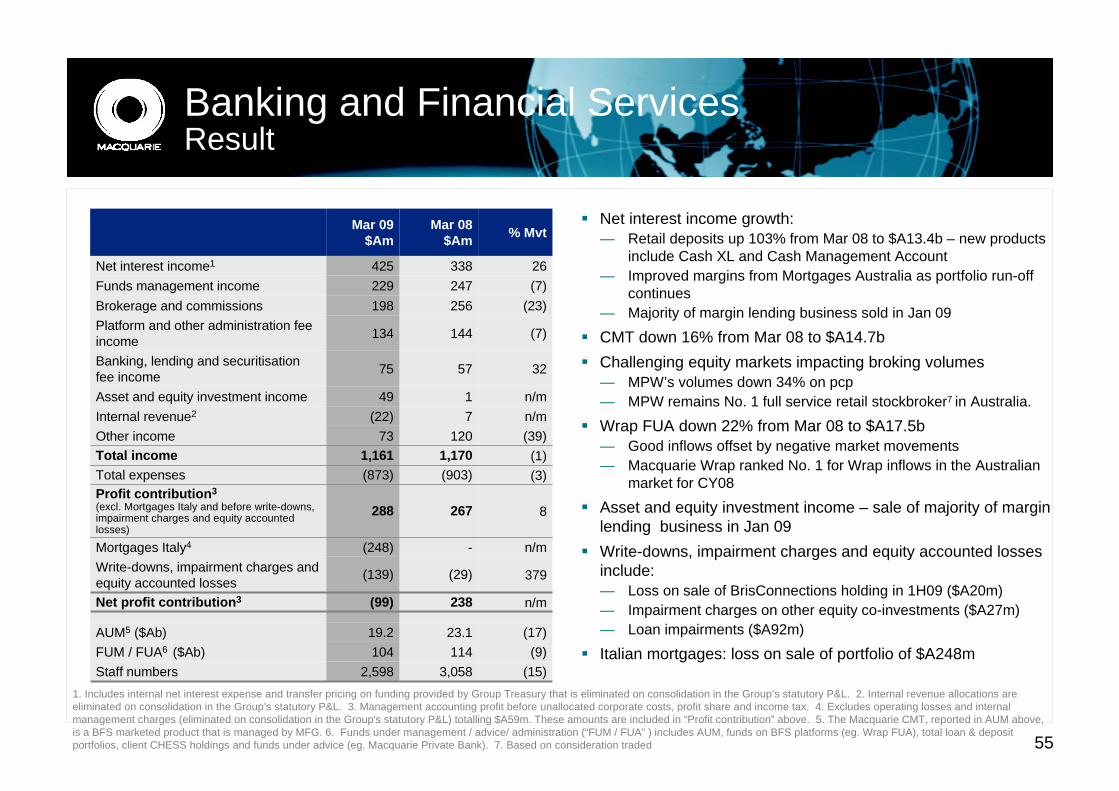
Net interest income growth:— Retail deposits up 103% from Mar 08 to $A13.4b – new products
include Cash XL and Cash Management Account— Improved margins from Mortgages Australia as portfolio run-off
continues— Majority of margin lending business sold in Jan 09
CMT down 16% from Mar 08 to $A14.7b Challenging equity markets impacting broking volumes— MPW’s volumes down 34% on pcp— MPW remains No. 1 full service retail stockbroker7 in Australia.
Wrap FUA down 22% from Mar 08 to $A17.5b— Good inflows offset by negative market movements— Macquarie Wrap ranked No. 1 for Wrap inflows in the Australian
market for CY08
Asset and equity investment income – sale of majority of margin lending business in Jan 09Write-downs, impairment charges and equity accounted losses include:— Loss on sale of BrisConnections holding in 1H09 ($A20m)— Impairment charges on other equity co-investments ($A27m)— Loan impairments ($A92m)
Italian mortgages: loss on sale of portfolio of $A248m
56
Macquarie FundsResult
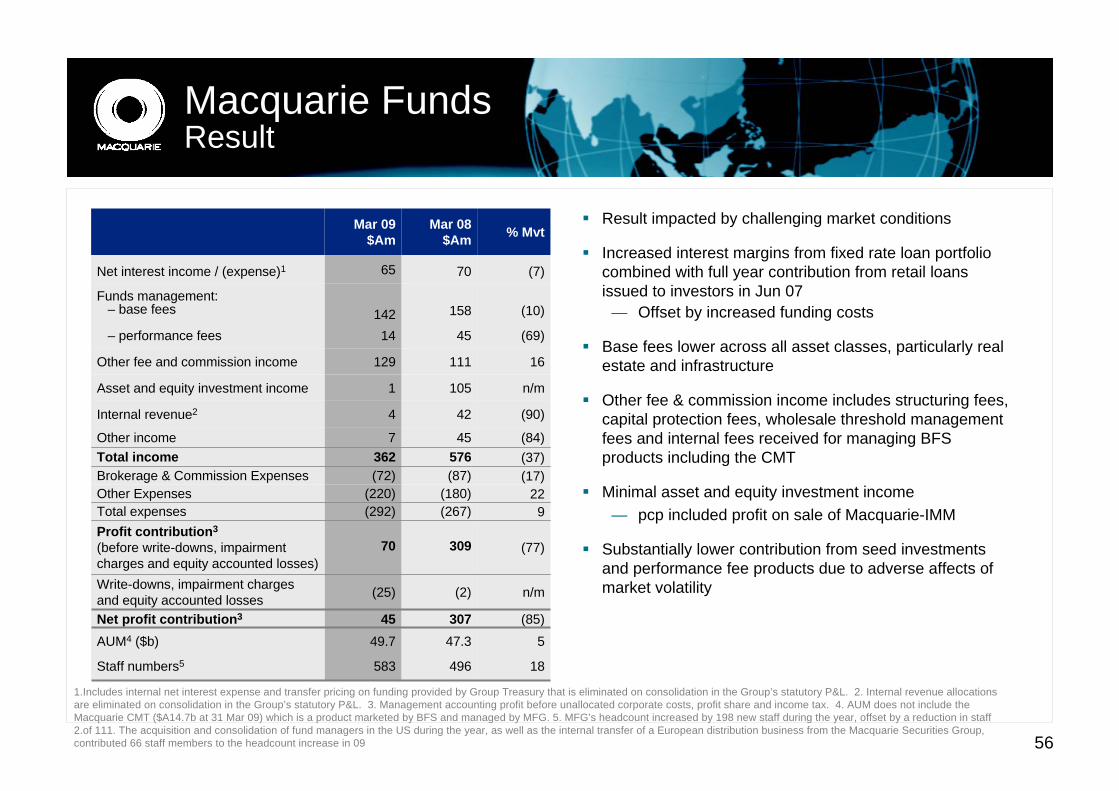
Result impacted by challenging market conditions
Increased interest margins from fixed rate loan portfolio combined with full year contribution from retail loans issued to investors in Jun 07
— Offset by increased funding costs
Base fees lower across all asset classes, particularly real estate and infrastructure
Other fee & commission income includes structuring fees, capital protection fees, wholesale threshold management fees and internal fees received for managing BFS products including the CMT
Minimal asset and equity investment income— pcp included profit on sale of Macquarie-IMM
Substantially lower contribution from seed investments and performance fee products due to adverse affects of market volatility
1.Includes internal net interest expense and transfer pricing on funding provided by Group Treasury that is eliminated on consolidation in the Group’s statutory P&L. 2. Internal revenue allocations are eliminated on consolidation in the Group’s statutory P&L. 3. Management accounting profit before unallocated corporate costs, profit share and income tax. 4. AUM does not include the Macquarie CMT ($A14.7b at 31 Mar 09) which is a product marketed by BFS and managed by MFG. 5. MFG’s headcount increased by 198 new staff during the year, offset by a reduction in staff 2.of 111. The acquisition and consolidation of fund managers in the US during the year, as well as the internal transfer of a European distribution business from the Macquarie Securities Group, contributed 66 staff members to the headcount increase in 09
(17)(87)(72)Brokerage & Commission Expenses22(180)(220)Other Expenses
547.349.7AUM4 ($b)
n/m(2)(25)Write-downs, impairment charges and equity accounted losses
(85)30745Net profit contribution3
(90)424Internal revenue2
n/m1051Asset and equity investment income
(7)7065Net interest income / (expense)1
16111129Other fee and commission income
(10)158142Funds management:
– base fees
(69)4514– performance fees
18496583Staff numbers5
(77)30970Profit contribution3
(before write-downs, impairment charges and equity accounted losses)
(267)
57645
Mar 08$Am
9
(37)(84)
% Mvt
(292)
3627
Mar 09 $Am
Total income
Total expenses
Other income
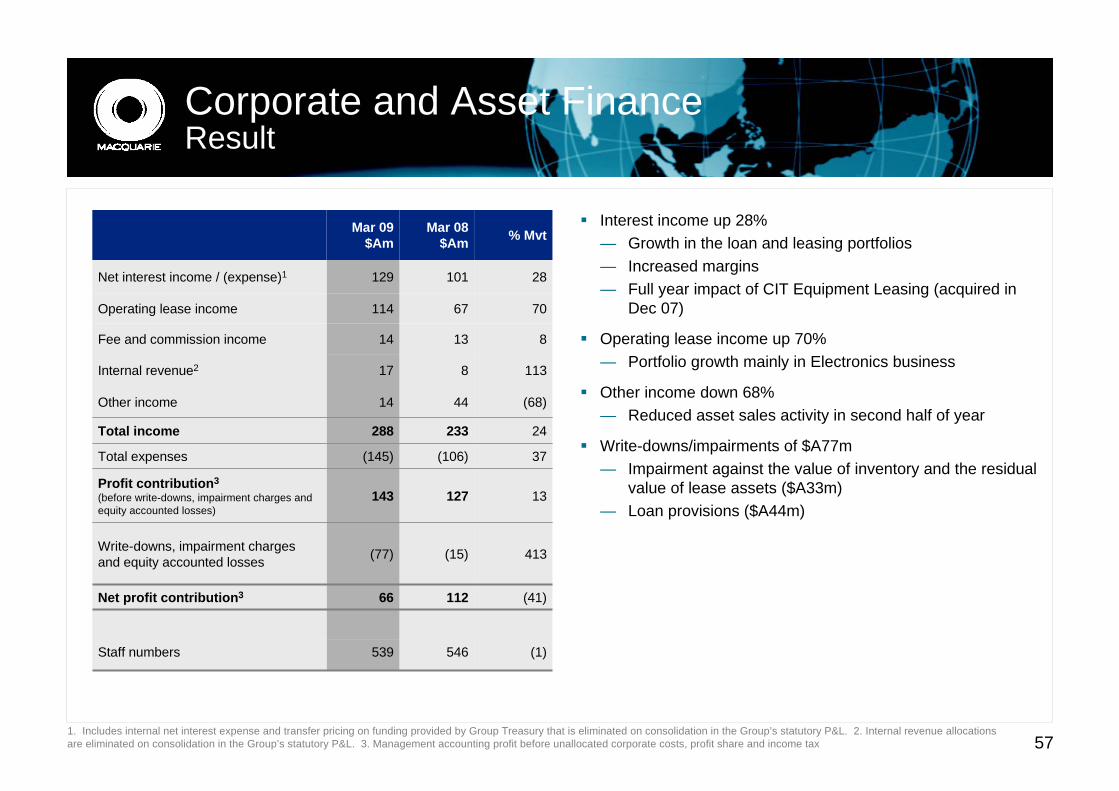
57
7067114Operating lease income
13127143Profit contribution3
(before write-downs, impairment charges and equity accounted losses)
413(15)(77)Write-downs, impairment charges and equity accounted losses
(41)11266Net profit contribution3
113817Internal revenue2
28101129Net interest income / (expense)1
81314Fee and commission income
(1)546539Staff numbers
(106)
233
44
Mar 08$Am
37
24
(68)
% Mvt
(145)
288
14
Mar 09 $Am
Total income
Total expenses
Other income
Corporate and Asset FinanceResult
1. Includes internal net interest expense and transfer pricing on funding provided by Group Treasury that is eliminated on consolidation in the Group’s statutory P&L. 2. Internal revenue allocations are eliminated on consolidation in the Group’s statutory P&L. 3. Management accounting profit before unallocated corporate costs, profit share and income tax
Interest income up 28%— Growth in the loan and leasing portfolios— Increased margins— Full year impact of CIT Equipment Leasing (acquired in
Dec 07)
Operating lease income up 70%— Portfolio growth mainly in Electronics business
Other income down 68%— Reduced asset sales activity in second half of year
Write-downs/impairments of $A77m— Impairment against the value of inventory and the residual
value of lease assets ($A33m)— Loan provisions ($A44m)
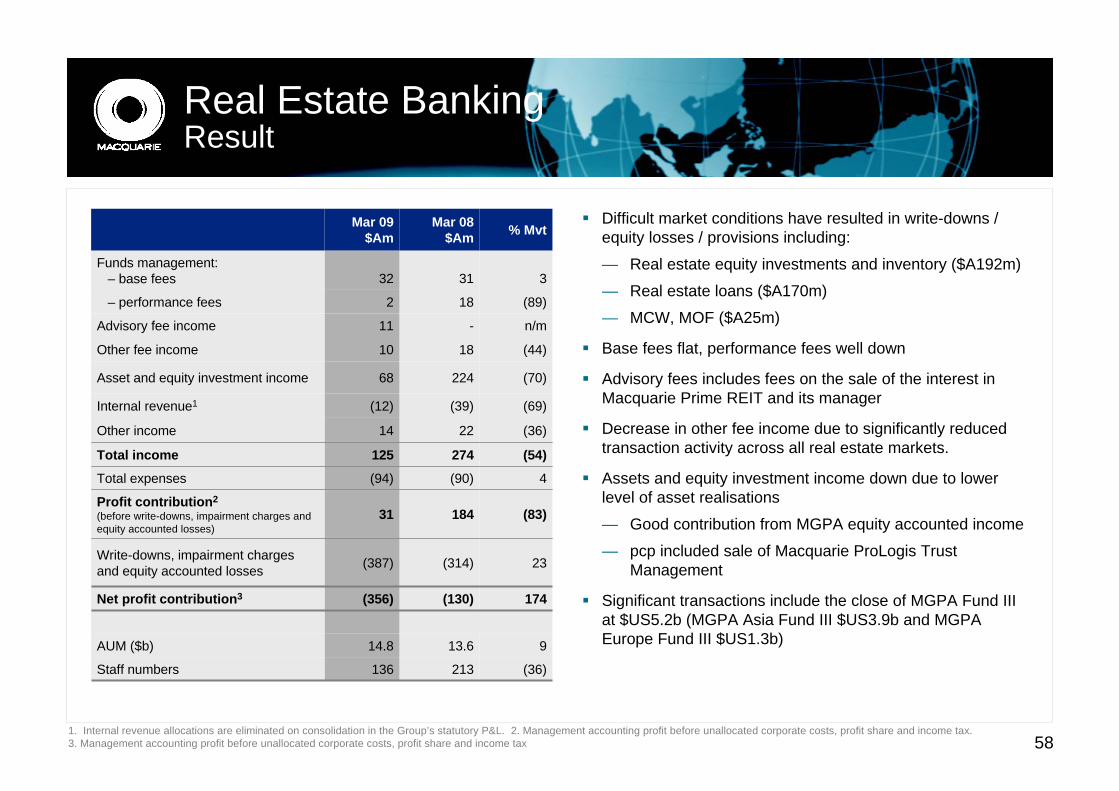
58
913.614.8AUM ($b)
23(314)(387)Write-downs, impairment charges and equity accounted losses
174(130)(356)Net profit contribution3
(69)(39)(12)Internal revenue1
(70)22468Asset and equity investment income
(44)1810Other fee income
n/m-11Advisory fee income
33132Funds management:
– base fees
(89)182– performance fees
(36)213136Staff numbers
(83)18431Profit contribution2
(before write-downs, impairment charges and equity accounted losses)
(90)
274
22
Mar 08$Am
4
(54)
(36)
% Mvt
(94)
125
14
Mar 09 $Am
Total income
Total expenses
Other income
Real Estate BankingResult
1. Internal revenue allocations are eliminated on consolidation in the Group’s statutory P&L. 2. Management accounting profit before unallocated corporate costs, profit share and income tax. 3. Management accounting profit before unallocated corporate costs, profit share and income tax
Difficult market conditions have resulted in write-downs / equity losses / provisions including:
— Real estate equity investments and inventory ($A192m)
— Real estate loans ($A170m)
— MCW, MOF ($A25m)
Base fees flat, performance fees well down
Advisory fees includes fees on the sale of the interest in Macquarie Prime REIT and its manager
Decrease in other fee income due to significantly reduced transaction activity across all real estate markets.
Assets and equity investment income down due to lower level of asset realisations
— Good contribution from MGPA equity accounted income
— pcp included sale of Macquarie ProLogis Trust Management
Significant transactions include the close of MGPA Fund III at $US5.2b (MGPA Asia Fund III $US3.9b and MGPA Europe Fund III $US1.3b)
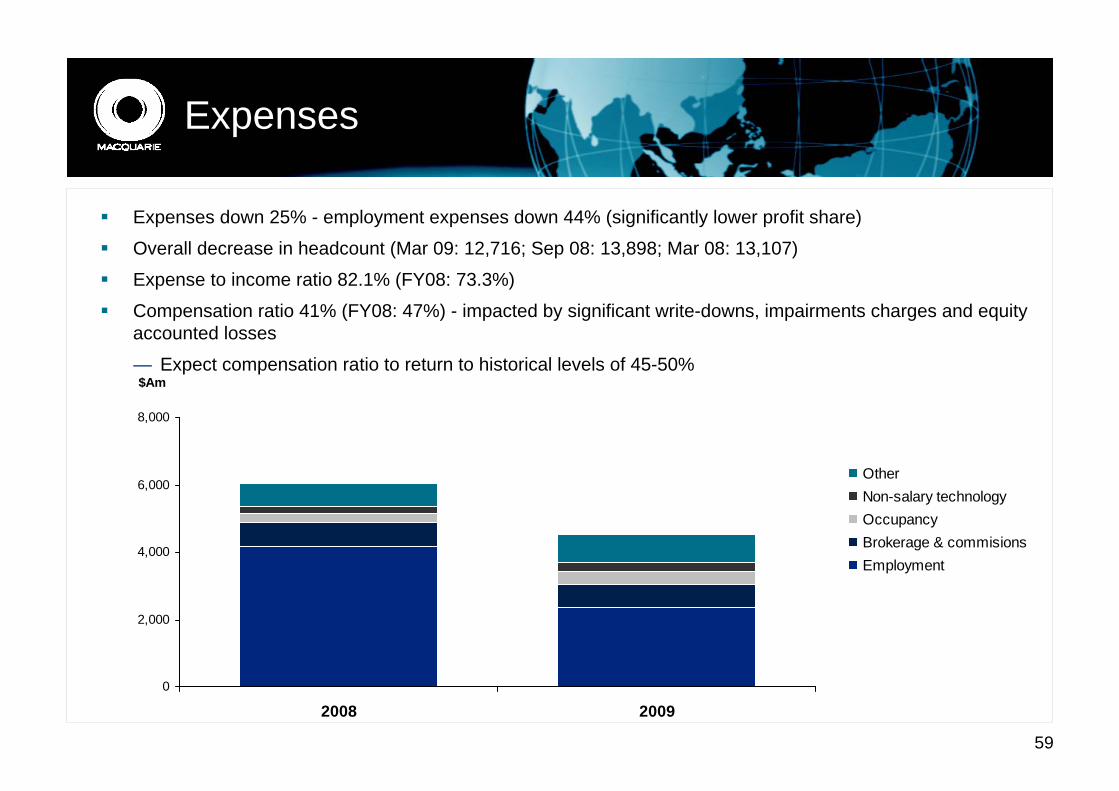
59
Expenses
Expenses down 25% - employment expenses down 44% (significantly lower profit share)
Overall decrease in headcount (Mar 09: 12,716; Sep 08: 13,898; Mar 08: 13,107)
Expense to income ratio 82.1% (FY08: 73.3%)
Compensation ratio 41% (FY08: 47%) - impacted by significant write-downs, impairments charges and equity accounted losses
— Expect compensation ratio to return to historical levels of 45-50%
0
2,000
4,000
6,000
8,000
2008 2009
$Am
OtherNon-salary technologyOccupancyBrokerage & commisionsEmployment
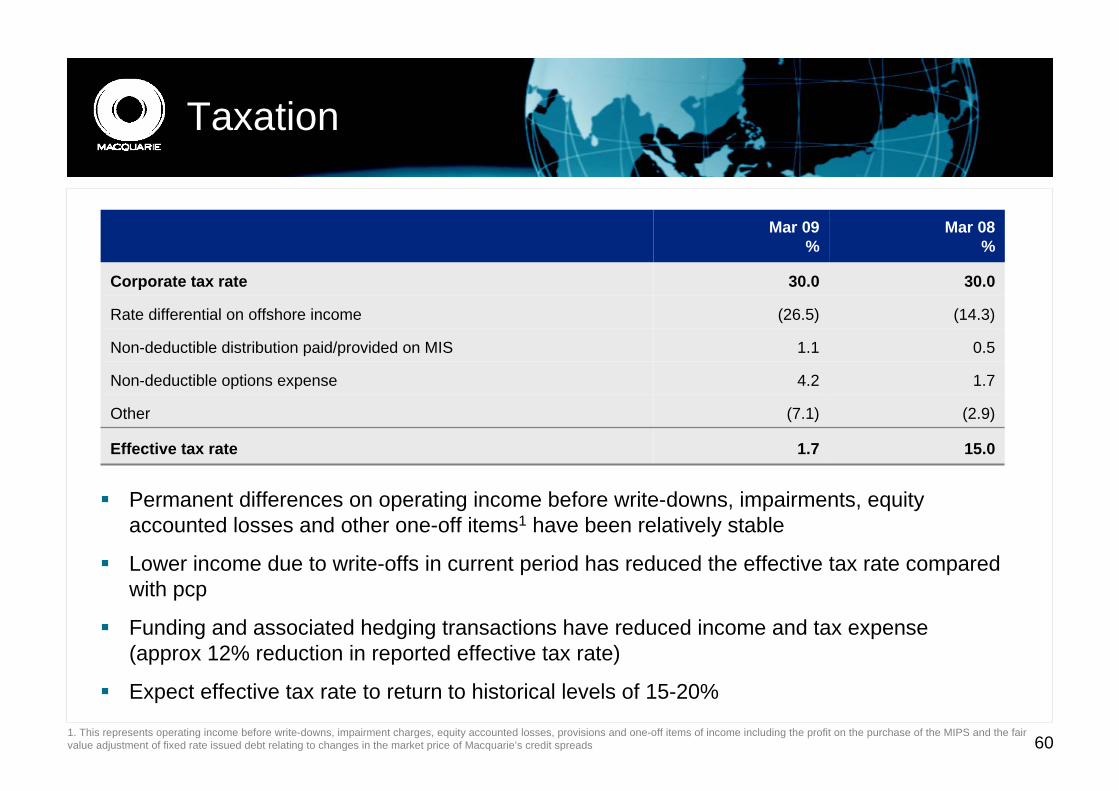
60
1.7
(7.1)
4.2
1.1
(26.5)
30.0
Mar 09%
15.0
(2.9)
1.7
0.5
(14.3)
30.0
Mar 08%
Effective tax rate
Non-deductible distribution paid/provided on MIS
Non-deductible options expense
Other
Rate differential on offshore income
Corporate tax rate
Taxation
Permanent differences on operating income before write-downs, impairments, equity accounted losses and other one-off items1 have been relatively stable
Lower income due to write-offs in current period has reduced the effective tax rate compared with pcp
Funding and associated hedging transactions have reduced income and tax expense (approx 12% reduction in reported effective tax rate)
Expect effective tax rate to return to historical levels of 15-20%
1. This represents operating income before write-downs, impairment charges, equity accounted losses, provisions and one-off items of income including the profit on the purchase of the MIPS and the fair value adjustment of fixed rate issued debt relating to changes in the market price of Macquarie’s credit spreads
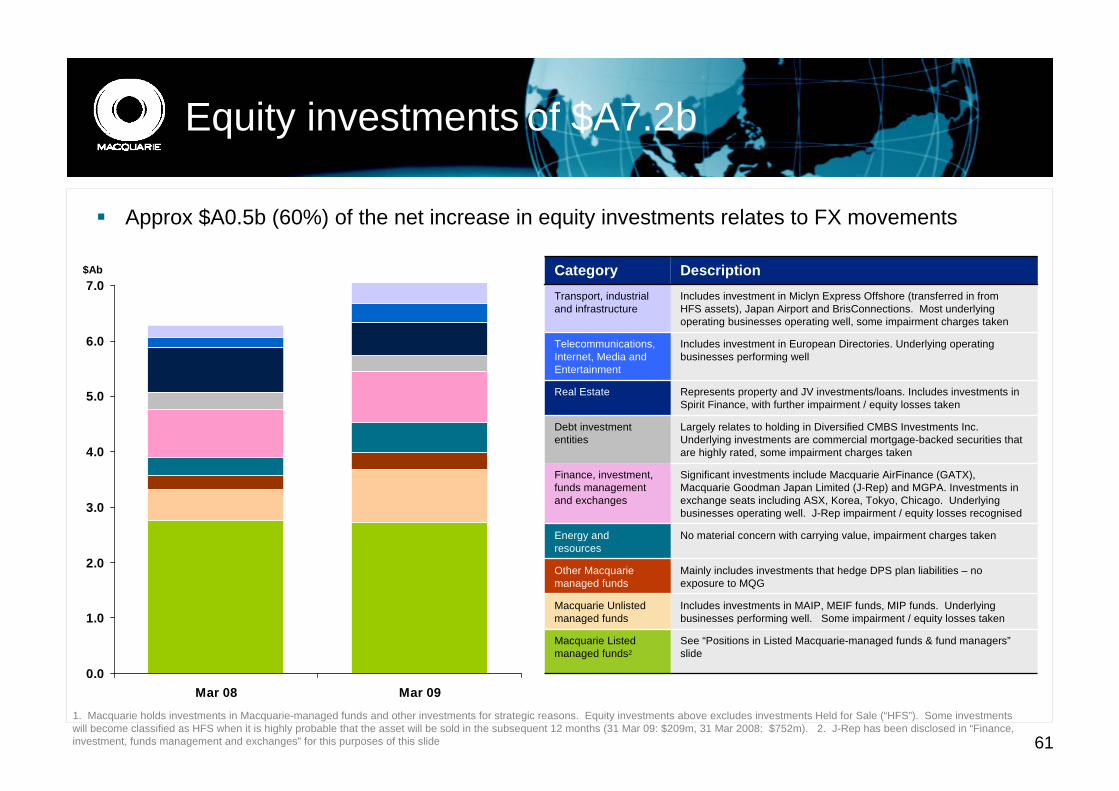
61
Equity investments of $A7.2b
1. Macquarie holds investments in Macquarie-managed funds and other investments for strategic reasons. Equity investments above excludes investments Held for Sale (“HFS”). Some investments will become classified as HFS when it is highly probable that the asset will be sold in the subsequent 12 months (31 Mar 09: $209m, 31 Mar 2008: $752m). 2. J-Rep has been disclosed in “Finance, investment, funds management and exchanges” for this purposes of this slide
DescriptionCategory
See “Positions in Listed Macquarie-managed funds & fund managers”slide
Macquarie Listed managed funds2
Includes investments in MAIP, MEIF funds, MIP funds. Underlyingbusinesses performing well. Some impairment / equity losses taken
Macquarie Unlisted managed funds
Mainly includes investments that hedge DPS plan liabilities – no exposure to MQG
Other Macquarie managed funds
No material concern with carrying value, impairment charges takenEnergy and resources
Significant investments include Macquarie AirFinance (GATX), Macquarie Goodman Japan Limited (J-Rep) and MGPA. Investments in exchange seats including ASX, Korea, Tokyo, Chicago. Underlyingbusinesses operating well. J-Rep impairment / equity losses recognised
Finance, investment, funds management and exchanges
Largely relates to holding in Diversified CMBS Investments Inc. Underlying investments are commercial mortgage-backed securities that are highly rated, some impairment charges taken
Debt investment entities
Represents property and JV investments/loans. Includes investments in Spirit Finance, with further impairment / equity losses taken
Real Estate
Includes investment in European Directories. Underlying operating businesses performing well
Telecommunications, Internet, Media and Entertainment
Includes investment in Miclyn Express Offshore (transferred in from HFS assets), Japan Airport and BrisConnections. Most underlying operating businesses operating well, some impairment charges taken
Transport, industrial and infrastructure
Approx $A0.5b (60%) of the net increase in equity investments relates to FX movements
0.0
1.0
2.0
3.0
4.0
5.0
6.0
7.0
Mar 08 Mar 09
$Ab
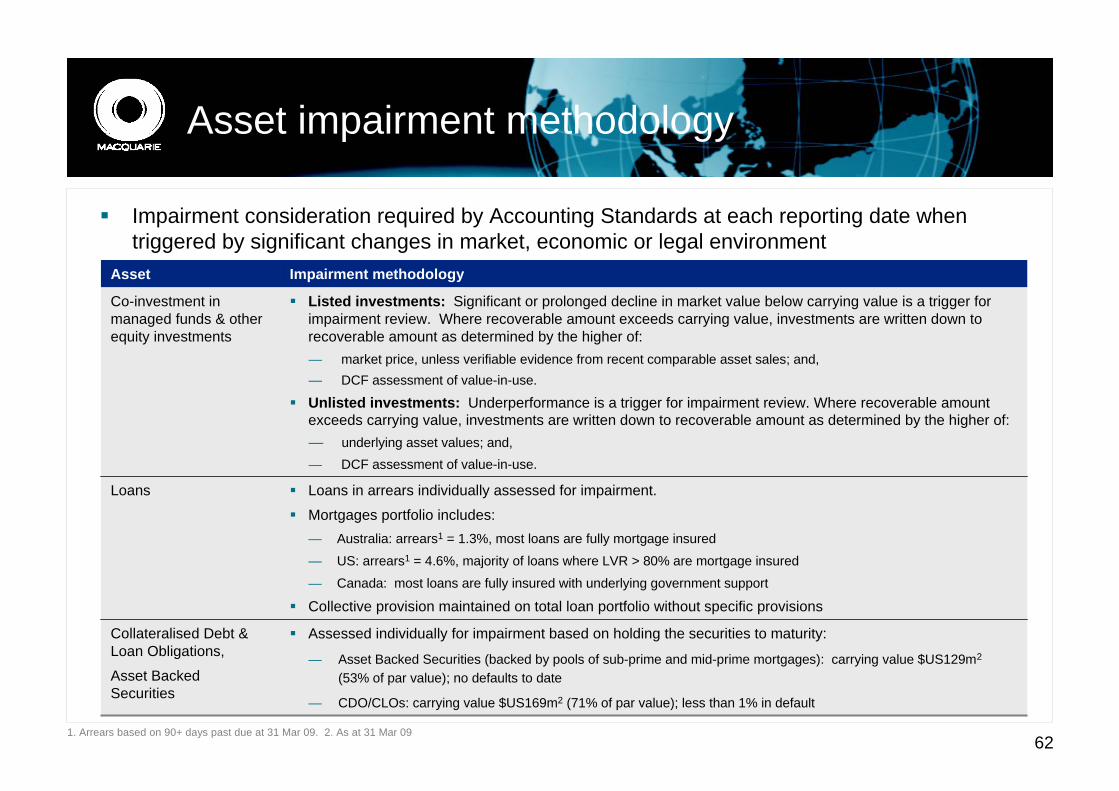
62
Asset impairment methodology
Assessed individually for impairment based on holding the securities to maturity:
— Asset Backed Securities (backed by pools of sub-prime and mid-prime mortgages): carrying value $US129m2
(53% of par value); no defaults to date
— CDO/CLOs: carrying value $US169m2 (71% of par value); less than 1% in default
Loans in arrears individually assessed for impairment.
Mortgages portfolio includes:— Australia: arrears1 = 1.3%, most loans are fully mortgage insured
— US: arrears1 = 4.6%, majority of loans where LVR > 80% are mortgage insured
— Canada: most loans are fully insured with underlying government support
Collective provision maintained on total loan portfolio without specific provisions
Listed investments: Significant or prolonged decline in market value below carrying value is a trigger for impairment review. Where recoverable amount exceeds carrying value, investments are written down to recoverable amount as determined by the higher of:— market price, unless verifiable evidence from recent comparable asset sales; and,— DCF assessment of value-in-use.
Unlisted investments: Underperformance is a trigger for impairment review. Where recoverable amount exceeds carrying value, investments are written down to recoverable amount as determined by the higher of:— underlying asset values; and,— DCF assessment of value-in-use.
Impairment methodology
Collateralised Debt & Loan Obligations,
Asset Backed Securities
Loans
Co-investment in managed funds & other equity investments
Asset
1. Arrears based on 90+ days past due at 31 Mar 09. 2. As at 31 Mar 09
Impairment consideration required by Accounting Standards at each reporting date when triggered by significant changes in market, economic or legal environment
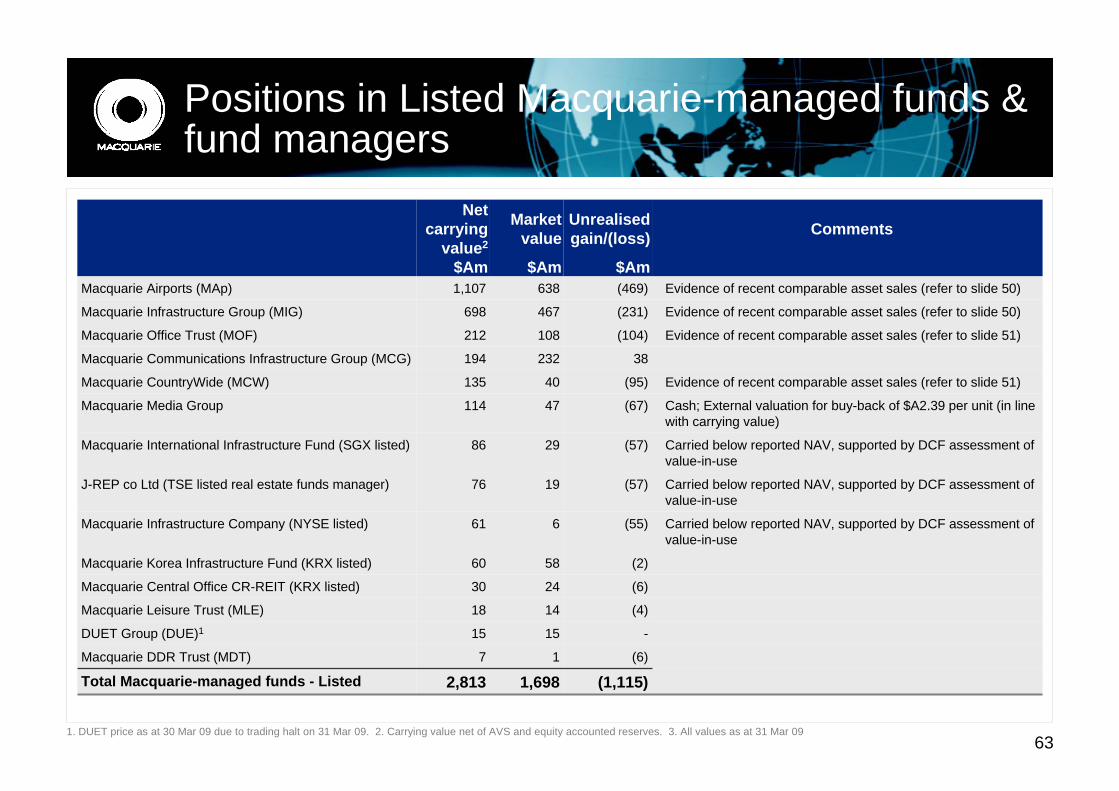
63
Carried below reported NAV, supported by DCF assessment of value-in-use
(57)1976J-REP co Ltd (TSE listed real estate funds manager)
(6)2430Macquarie Central Office CR-REIT (KRX listed)
(6)17Macquarie DDR Trust (MDT)
Carried below reported NAV, supported by DCF assessment of value-in-use
(57)2986Macquarie International Infrastructure Fund (SGX listed)
Cash; External valuation for buy-back of $A2.39 per unit (in line with carrying value)
(67)47114Macquarie Media Group
Evidence of recent comparable asset sales (refer to slide 51)(95)40135Macquarie CountryWide (MCW)
Evidence of recent comparable asset sales (refer to slide 51)(104)108212Macquarie Office Trust (MOF)
Evidence of recent comparable asset sales (refer to slide 50)(231)467698Macquarie Infrastructure Group (MIG)
-1515DUET Group (DUE)1
(1,115)
(4)
(2)
(55)
38
(469)$Am
Unrealised gain/(loss)
Carried below reported NAV, supported by DCF assessment of value-in-use
Evidence of recent comparable asset sales (refer to slide 50)
Comments
2,813
18
60
61
194
1,107$Am
Net carrying
value2
1,698
14
58
6
232
638
Market value
$Am
Total Macquarie-managed funds - Listed
Macquarie Leisure Trust (MLE)
Macquarie Korea Infrastructure Fund (KRX listed)
Macquarie Infrastructure Company (NYSE listed)
Macquarie Communications Infrastructure Group (MCG)
Macquarie Airports (MAp)
Positions in Listed Macquarie-managed funds & fund managers
1. DUET price as at 30 Mar 09 due to trading halt on 31 Mar 09. 2. Carrying value net of AVS and equity accounted reserves. 3. All values as at 31 Mar 09
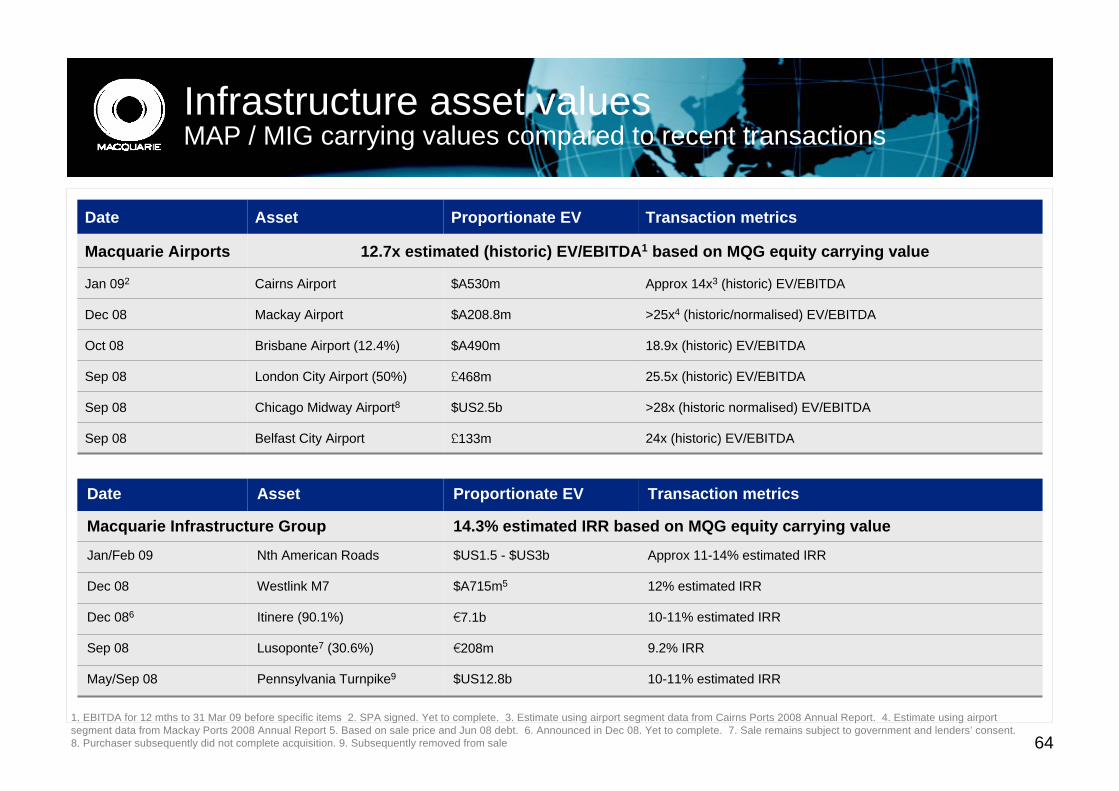
64
Infrastructure asset valuesMAP / MIG carrying values compared to recent transactions
12.7x estimated (historic) EV/EBITDA1 based on MQG equity carrying valueMacquarie Airports
>28x (historic normalised) EV/EBITDA$US2.5bChicago Midway Airport8Sep 08
24x (historic) EV/EBITDA£133mBelfast City AirportSep 08
25.5x (historic) EV/EBITDA£468mLondon City Airport (50%)Sep 08
18.9x (historic) EV/EBITDA$A490mBrisbane Airport (12.4%)Oct 08
>25x4 (historic/normalised) EV/EBITDA$A208.8mMackay AirportDec 08
Approx 14x3 (historic) EV/EBITDA$A530mCairns AirportJan 092
Transaction metricsProportionate EVAssetDate
1. EBITDA for 12 mths to 31 Mar 09 before specific items 2. SPA signed. Yet to complete. 3. Estimate using airport segment data from Cairns Ports 2008 Annual Report. 4. Estimate using airport segment data from Mackay Ports 2008 Annual Report 5. Based on sale price and Jun 08 debt. 6. Announced in Dec 08. Yet to complete. 7. Sale remains subject to government and lenders’ consent. 8. Purchaser subsequently did not complete acquisition. 9. Subsequently removed from sale
Approx 11-14% estimated IRR$US1.5 - $US3bNth American RoadsJan/Feb 09
14.3% estimated IRR based on MQG equity carrying valueMacquarie Infrastructure Group
10-11% estimated IRR$US12.8bPennsylvania Turnpike9May/Sep 08
9.2% IRR€208mLusoponte7 (30.6%)Sep 08
10-11% estimated IRR€7.1bItinere (90.1%)Dec 086
12% estimated IRR$A715m5Westlink M7Dec 08
Transaction metricsProportionate EVAssetDate
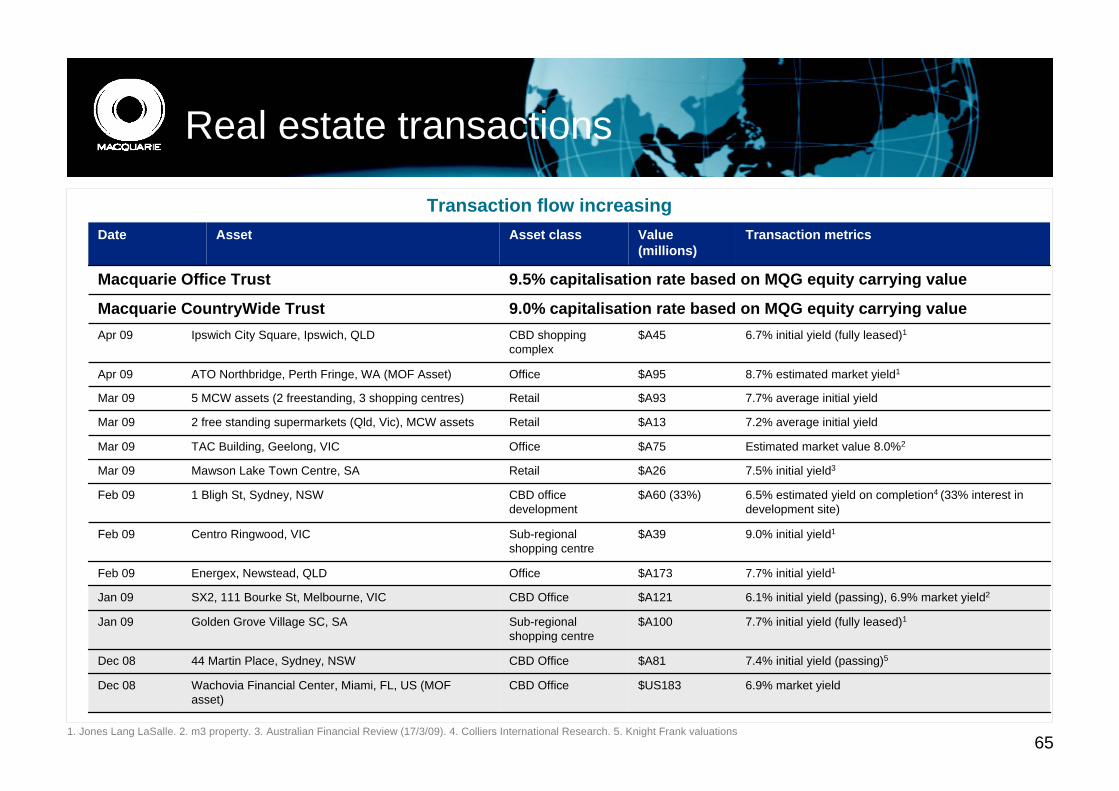
65
Real estate transactions
7.2% average initial yield$A13Retail2 free standing supermarkets (Qld, Vic), MCW assetsMar 09
7.7% average initial yield$A93Retail5 MCW assets (2 freestanding, 3 shopping centres) Mar 09
9.0% capitalisation rate based on MQG equity carrying valueMacquarie CountryWide Trust
9.5% capitalisation rate based on MQG equity carrying valueMacquarie Office Trust
6.7% initial yield (fully leased)1$A45CBD shopping complex
Ipswich City Square, Ipswich, QLDApr 09
8.7% estimated market yield1 $A95OfficeATO Northbridge, Perth Fringe, WA (MOF Asset)Apr 09
Estimated market value 8.0%2$A75OfficeTAC Building, Geelong, VICMar 09
7.5% initial yield3$A26RetailMawson Lake Town Centre, SAMar 09
6.5% estimated yield on completion4 (33% interest in development site)
$A60 (33%)CBD office development
1 Bligh St, Sydney, NSWFeb 09
9.0% initial yield1$A39Sub-regional shopping centre
Centro Ringwood, VICFeb 09
7.7% initial yield1$A173OfficeEnergex, Newstead, QLDFeb 09
6.1% initial yield (passing), 6.9% market yield2$A121CBD Office SX2, 111 Bourke St, Melbourne, VICJan 09
7.7% initial yield (fully leased)1$A100Sub-regional shopping centre
Golden Grove Village SC, SA Jan 09
CBD Office
CBD Office
Asset class
6.9% market yield$US183Wachovia Financial Center, Miami, FL, US (MOF asset)
Dec 08
7.4% initial yield (passing)5$A8144 Martin Place, Sydney, NSWDec 08
Transaction metricsValue (millions)
AssetDate
Transaction flow increasing
1. Jones Lang LaSalle. 2. m3 property. 3. Australian Financial Review (17/3/09). 4. Colliers International Research. 5. Knight Frank valuations
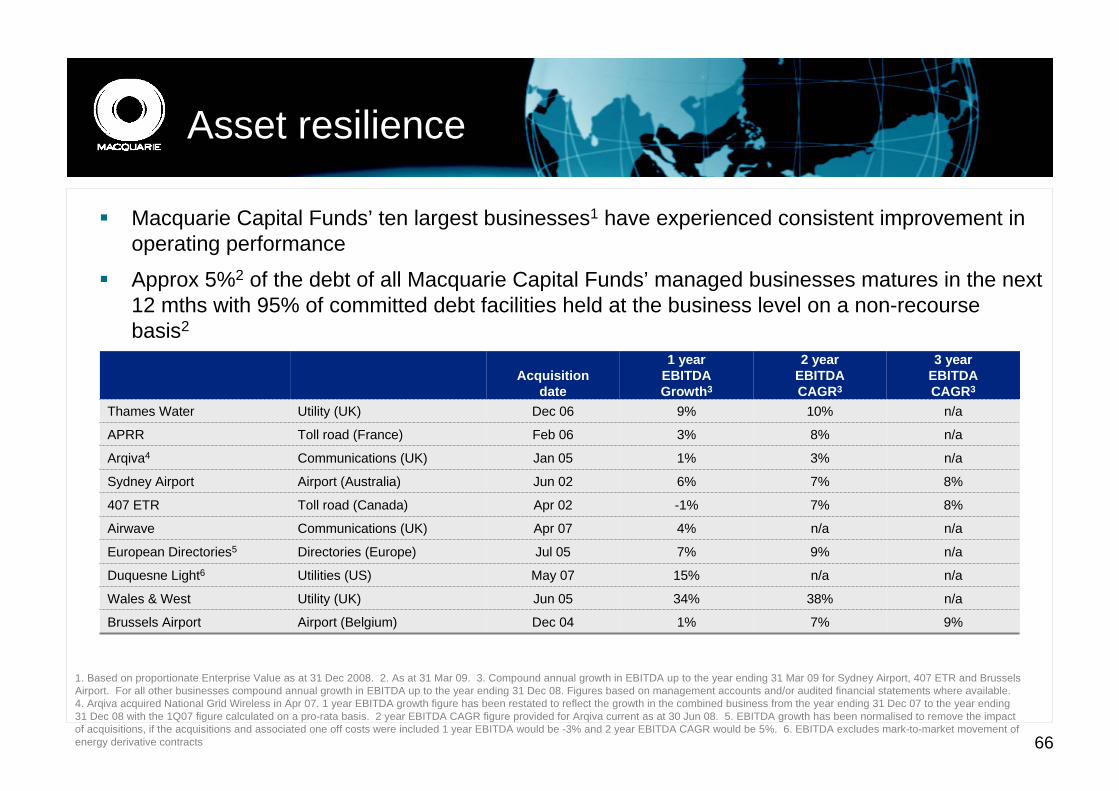
66
n/a9%7%Jul 05Directories (Europe)European Directories5
n/an/a15% May 07Utilities (US)Duquesne Light6
Dec 04
Jun 05
Apr 07
Apr 02
Jun 02
Jan 05
Feb 06
Dec 06
Acquisition date
Airport (Belgium)
Utility (UK)
Communications (UK)
Toll road (Canada)
Airport (Australia)
Communications (UK)
Toll road (France)
Utility (UK)
n/a38%34%Wales & West
n/an/a4%Airwave
n/a8%3%APRR
n/a3%1%Arqiva4
8%7%6%Sydney Airport
9%7%1%Brussels Airport
8%7%-1%407 ETR
n/a10%9%Thames Water
3 yearEBITDA CAGR3
2 yearEBITDA CAGR3
1 yearEBITDA Growth3
Asset resilience
1. Based on proportionate Enterprise Value as at 31 Dec 2008. 2. As at 31 Mar 09. 3. Compound annual growth in EBITDA up to the year ending 31 Mar 09 for Sydney Airport, 407 ETR and BrusselsAirport. For all other businesses compound annual growth in EBITDA up to the year ending 31 Dec 08. Figures based on management accounts and/or audited financial statements where available. 4. Arqiva acquired National Grid Wireless in Apr 07. 1 year EBITDA growth figure has been restated to reflect the growth in the combined business from the year ending 31 Dec 07 to the year ending 31 Dec 08 with the 1Q07 figure calculated on a pro-rata basis. 2 year EBITDA CAGR figure provided for Arqiva current as at 30 Jun 08. 5. EBITDA growth has been normalised to remove the impact of acquisitions, if the acquisitions and associated one off costs were included 1 year EBITDA would be -3% and 2 year EBITDA CAGR would be 5%. 6. EBITDA excludes mark-to-market movement of energy derivative contracts
Macquarie Capital Funds’ ten largest businesses1 have experienced consistent improvement in operating performance
Approx 5%2 of the debt of all Macquarie Capital Funds’ managed businesses matures in the next 12 mths with 95% of committed debt facilities held at the business level on a non-recourse basis2
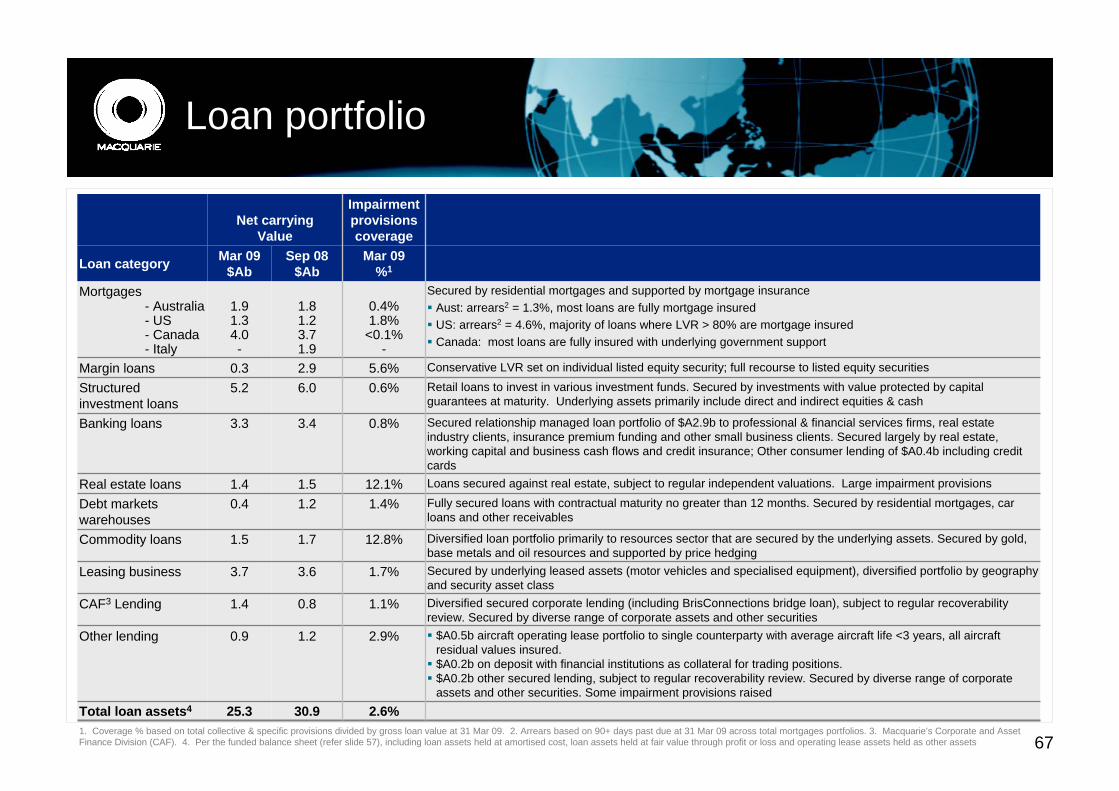
67
Loan portfolio
30.9
1.2
0.8
3.6
1.7
1.21.5
3.4
6.02.9
1.81.23.71.9
Sep 08$Ab
Net carrying Value
Impairment provisions coverage
Diversified secured corporate lending (including BrisConnections bridge loan), subject to regular recoverability review. Secured by diverse range of corporate assets and other securities
1.1%1.4CAF3 Lending
2.6%
2.9%
1.7%
12.8%
1.4%12.1%
0.8%
0.6%5.6%
0.4%1.8%
<0.1%-
Mar 09%1
Loans secured against real estate, subject to regular independent valuations. Large impairment provisions1.4Real estate loansFully secured loans with contractual maturity no greater than 12 months. Secured by residential mortgages, car loans and other receivables
0.4Debt markets warehouses
Diversified loan portfolio primarily to resources sector that are secured by the underlying assets. Secured by gold, base metals and oil resources and supported by price hedging
1.5Commodity loans
Secured by underlying leased assets (motor vehicles and specialised equipment), diversified portfolio by geography and security asset class
3.7Leasing business
Conservative LVR set on individual listed equity security; full recourse to listed equity securities0.3Margin loansRetail loans to invest in various investment funds. Secured by investments with value protected by capital guarantees at maturity. Underlying assets primarily include direct and indirect equities & cash
5.2Structured investment loans
Secured relationship managed loan portfolio of $A2.9b to professional & financial services firms, real estate industry clients, insurance premium funding and other small business clients. Secured largely by real estate, working capital and business cash flows and credit insurance; Other consumer lending of $A0.4b including credit cards
3.3Banking loans
25.3
0.9
1.91.34.0-
Mar 09$Ab
$A0.5b aircraft operating lease portfolio to single counterparty with average aircraft life <3 years, all aircraft residual values insured.$A0.2b on deposit with financial institutions as collateral for trading positions.$A0.2b other secured lending, subject to regular recoverability review. Secured by diverse range of corporate assets and other securities. Some impairment provisions raised
Secured by residential mortgages and supported by mortgage insurance Aust: arrears2 = 1.3%, most loans are fully mortgage insuredUS: arrears2 = 4.6%, majority of loans where LVR > 80% are mortgage insuredCanada: most loans are fully insured with underlying government support
Other lending
Total loan assets4
Mortgages- Australia- US- Canada- Italy
Loan category
1. Coverage % based on total collective & specific provisions divided by gross loan value at 31 Mar 09. 2. Arrears based on 90+ days past due at 31 Mar 09 across total mortgages portfolios. 3. Macquarie’s Corporate and Asset Finance Division (CAF). 4. Per the funded balance sheet (refer slide 57), including loan assets held at amortised cost, loan assets held at fair value through profit or loss and operating lease assets held as other assets

Further Information:Financial Management
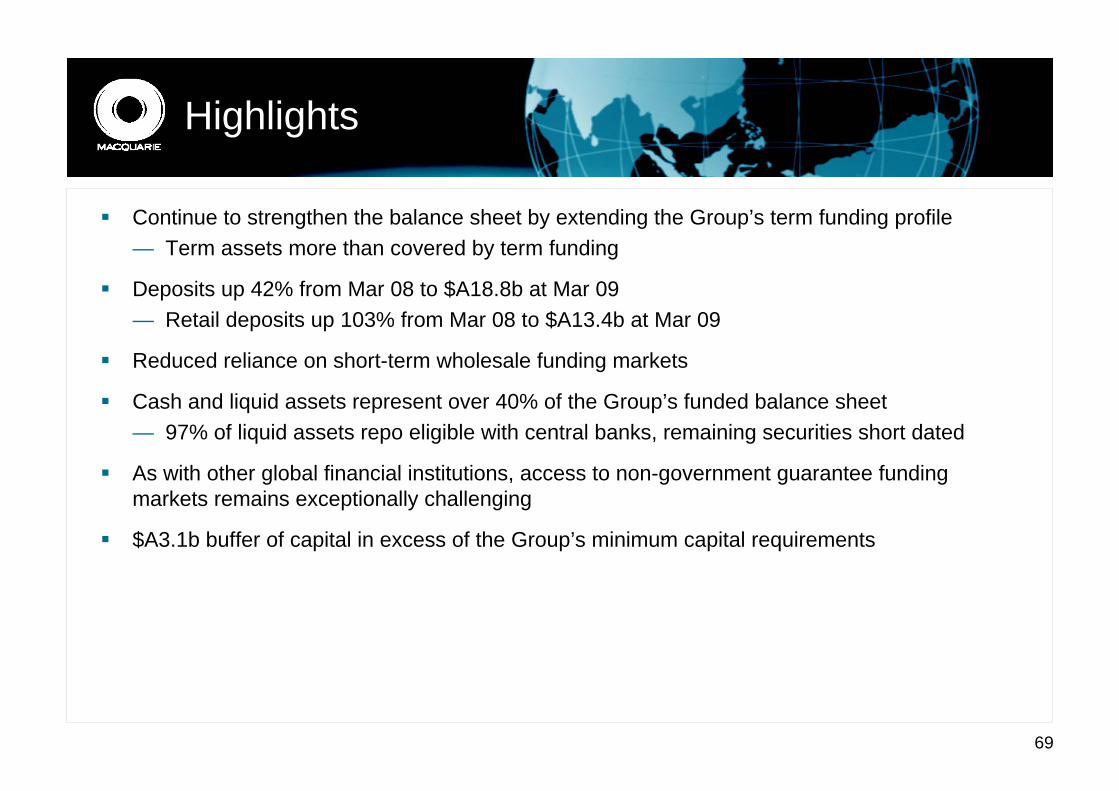
69
Highlights
Continue to strengthen the balance sheet by extending the Group’s term funding profile— Term assets more than covered by term funding
Deposits up 42% from Mar 08 to $A18.8b at Mar 09— Retail deposits up 103% from Mar 08 to $A13.4b at Mar 09
Reduced reliance on short-term wholesale funding markets
Cash and liquid assets represent over 40% of the Group’s funded balance sheet— 97% of liquid assets repo eligible with central banks, remaining securities short dated
As with other global financial institutions, access to non-government guarantee funding markets remains exceptionally challenging
$A3.1b buffer of capital in excess of the Group’s minimum capital requirements
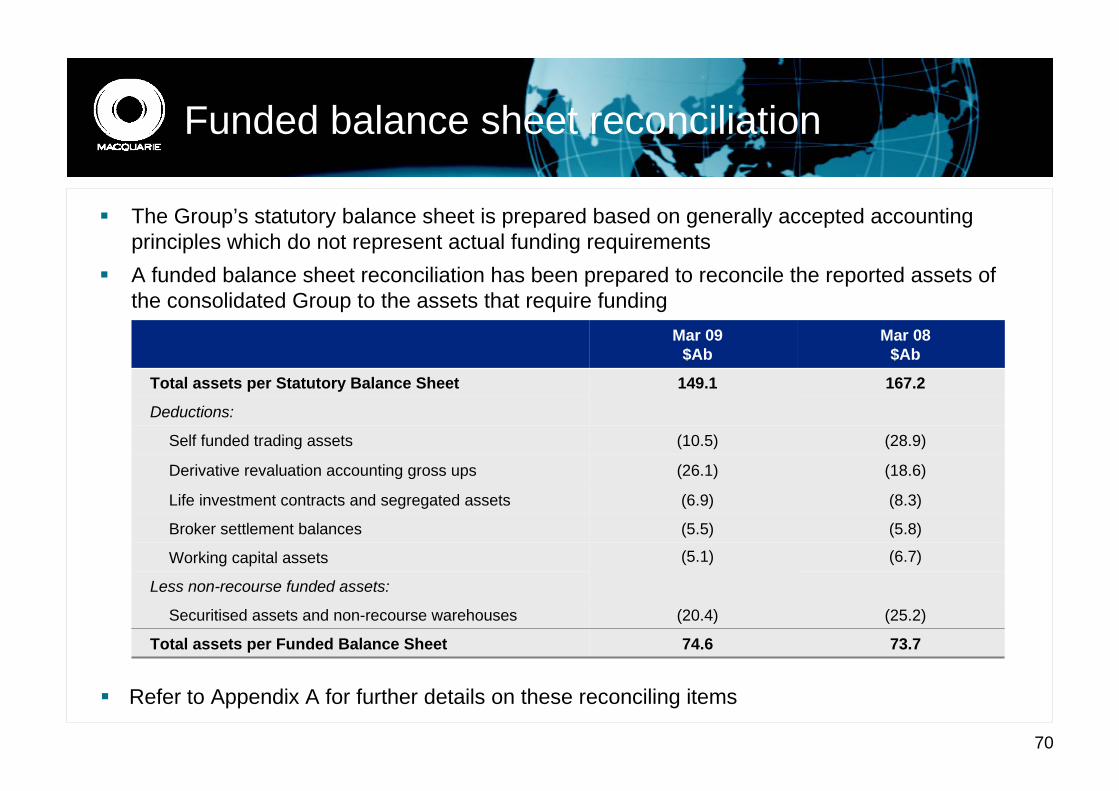
70
Funded balance sheet reconciliation
74.6
(20.4)
(5.1)
(5.5)
(6.9)
(26.1)
(10.5)
149.1
Mar 09$Ab
(5.8)Broker settlement balances
(8.3)Life investment contracts and segregated assets
(18.6)Derivative revaluation accounting gross ups
(28.9)Self funded trading assets
(6.7)Working capital assets
Deductions:
(25.2)Securitised assets and non-recourse warehouses
Less non-recourse funded assets:
167.2Total assets per Statutory Balance Sheet
73.7Total assets per Funded Balance Sheet
Mar 08$Ab
The Group’s statutory balance sheet is prepared based on generally accepted accounting principles which do not represent actual funding requirementsA funded balance sheet reconciliation has been prepared to reconcile the reported assets of the consolidated Group to the assets that require funding
Refer to Appendix A for further details on these reconciling items
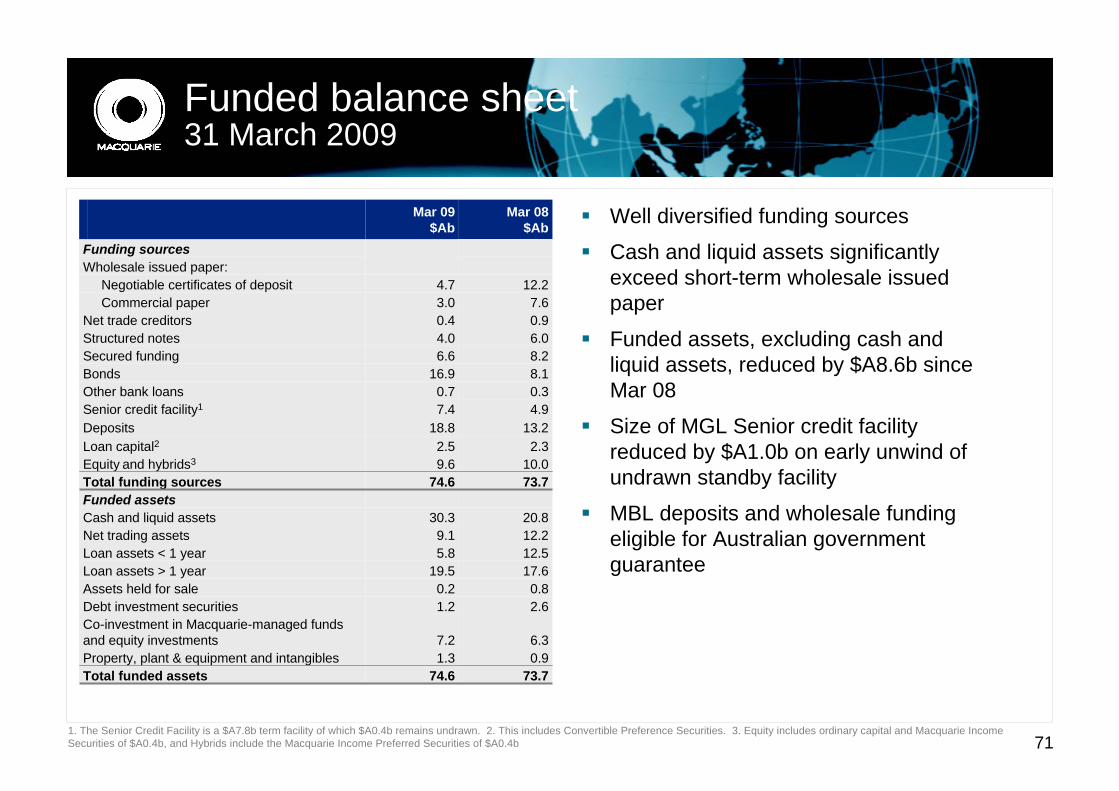
71
Funded balance sheet31 March 2009
Well diversified funding sources
Cash and liquid assets significantly exceed short-term wholesale issued paper
Funded assets, excluding cash and liquid assets, reduced by $A8.6b since Mar 08
Size of MGL Senior credit facility reduced by $A1.0b on early unwind of undrawn standby facility
MBL deposits and wholesale funding eligible for Australian government guarantee
1. The Senior Credit Facility is a $A7.8b term facility of which $A0.4b remains undrawn. 2. This includes Convertible Preference Securities. 3. Equity includes ordinary capital and Macquarie Income Securities of $A0.4b, and Hybrids include the Macquarie Income Preferred Securities of $A0.4b
13.218.8Deposits
6.37.2Co-investment in Macquarie-managed funds and equity investments
0.90.4Net trade creditors
74.61.3
1.20.2
19.55.89.1
30.3
74.69.62.5
7.40.7
16.96.64.0
3.04.7
Mar 09$Ab
Total funded assetsProperty, plant & equipment and intangibles
Debt investment securitiesAssets held for saleLoan assets > 1 yearLoan assets < 1 yearNet trading assetsCash and liquid assetsFunded assetsTotal funding sourcesEquity and hybrids3 Loan capital2
Senior credit facility1Other bank loansBondsSecured fundingStructured notes
Commercial paperNegotiable certificates of deposit
Wholesale issued paper:Funding sources
8.1
6.0
12.2
17.6
0.9
8.2
7.6
0.3
0.8
2.3
4.9
73.7
2.6
12.212.5
20.8
73.710.0
Mar 08$Ab
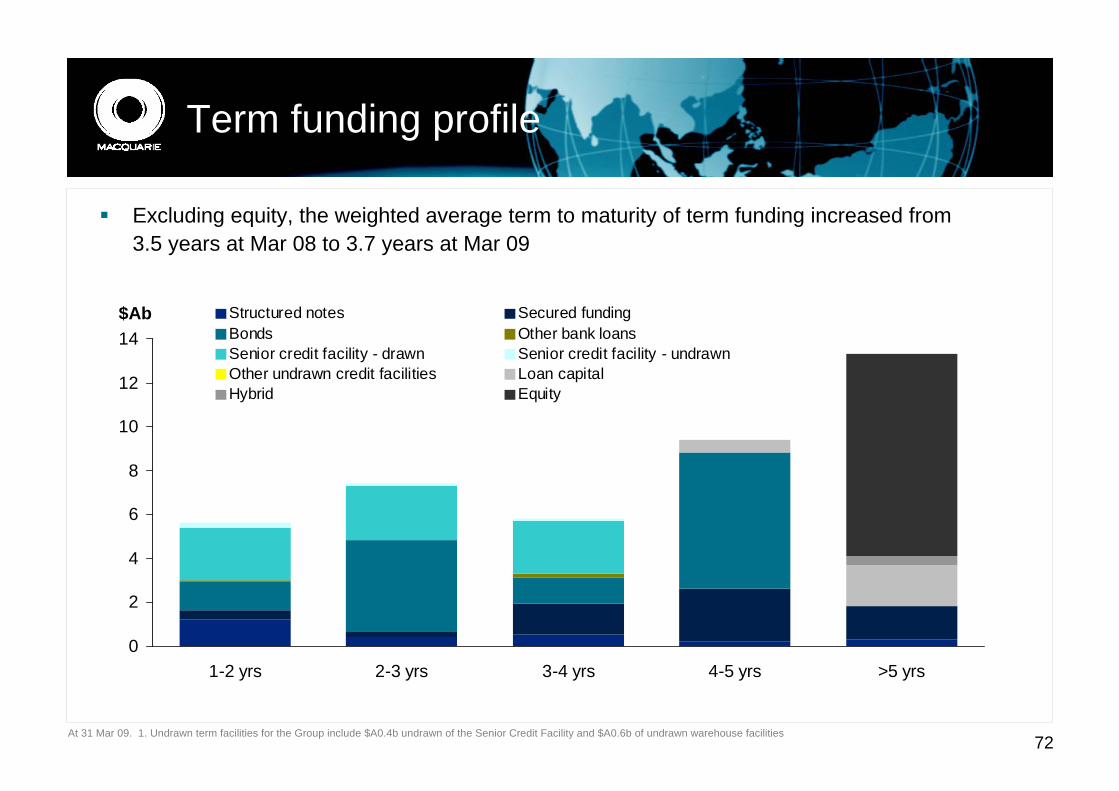
72
Term funding profile
Excluding equity, the weighted average term to maturity of term funding increased from 3.5 years at Mar 08 to 3.7 years at Mar 09
At 31 Mar 09. 1. Undrawn term facilities for the Group include $A0.4b undrawn of the Senior Credit Facility and $A0.6b of undrawn warehouse facilities
0
2
4
6
8
10
12
14
1-2 yrs 2-3 yrs 3-4 yrs 4-5 yrs >5 yrs
$Ab Structured notes Secured fundingBonds Other bank loansSenior credit facility - drawn Senior credit facility - undrawnOther undrawn credit facilities Loan capitalHybrid Equity
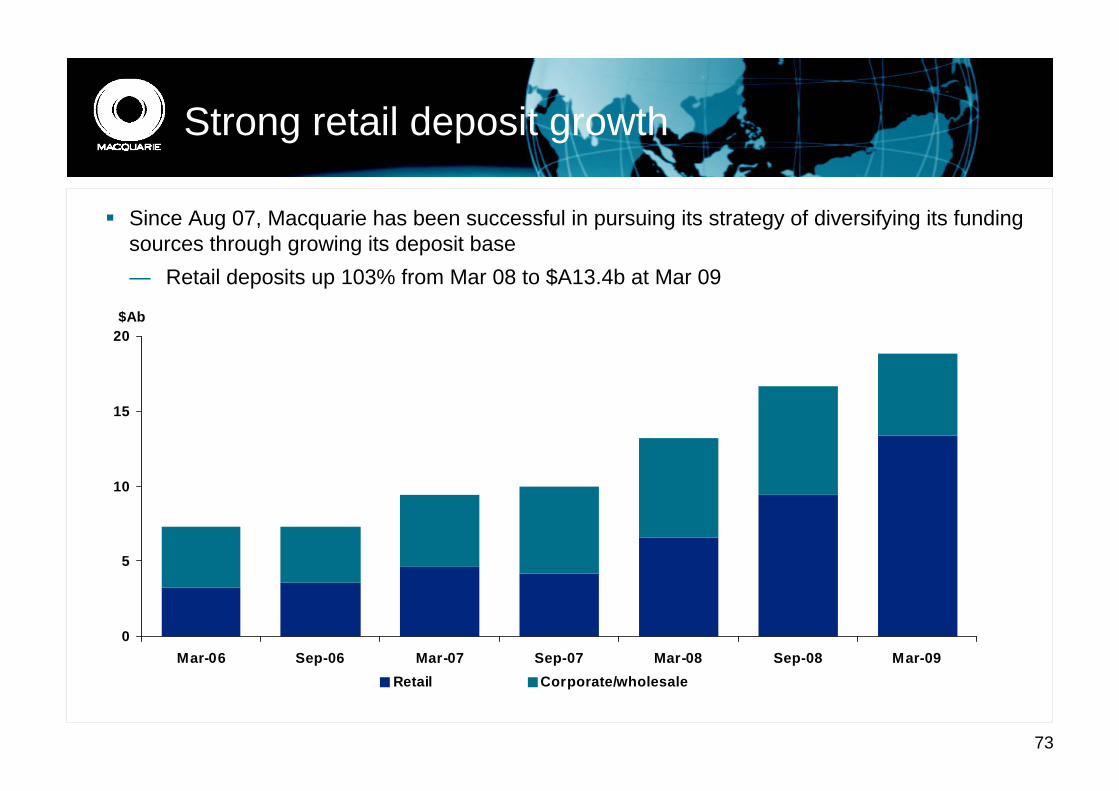
73
Strong retail deposit growth
Since Aug 07, Macquarie has been successful in pursuing its strategy of diversifying its funding sources through growing its deposit base— Retail deposits up 103% from Mar 08 to $A13.4b at Mar 09
0
5
10
15
20
Mar-06 Sep-06 Mar-07 Sep-07 Mar-08 Sep-08 Mar-09
$Ab
Retail Corporate/wholesale
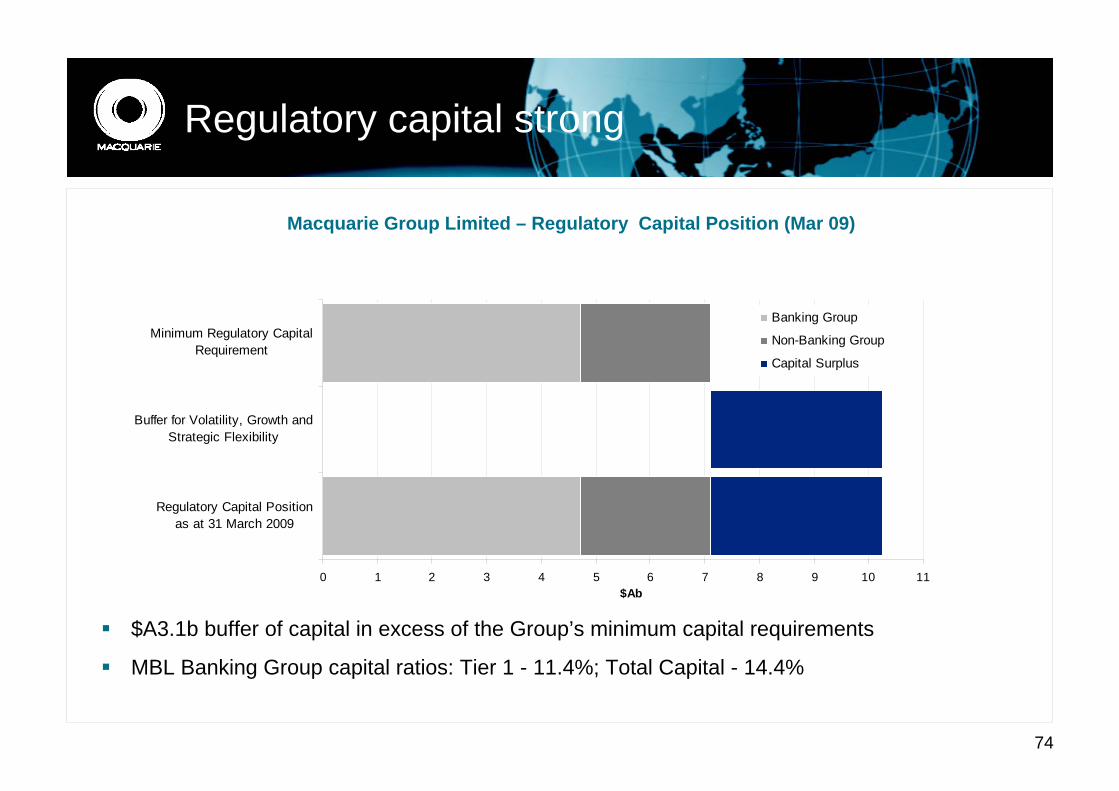
74
Regulatory capital strong
$A3.1b buffer of capital in excess of the Group’s minimum capital requirements
MBL Banking Group capital ratios: Tier 1 - 11.4%; Total Capital - 14.4%
Macquarie Group Limited – Regulatory Capital Position (Mar 09)
0 1 2 3 4 5 6 7 8 9 10 11
Minimum Regulatory CapitalRequirement
Buffer for Volatility, Growth andStrategic Flexibility
Regulatory Capital Positionas at 31 March 2009
$Ab
Banking Group
Non-Banking Group
Capital Surplus
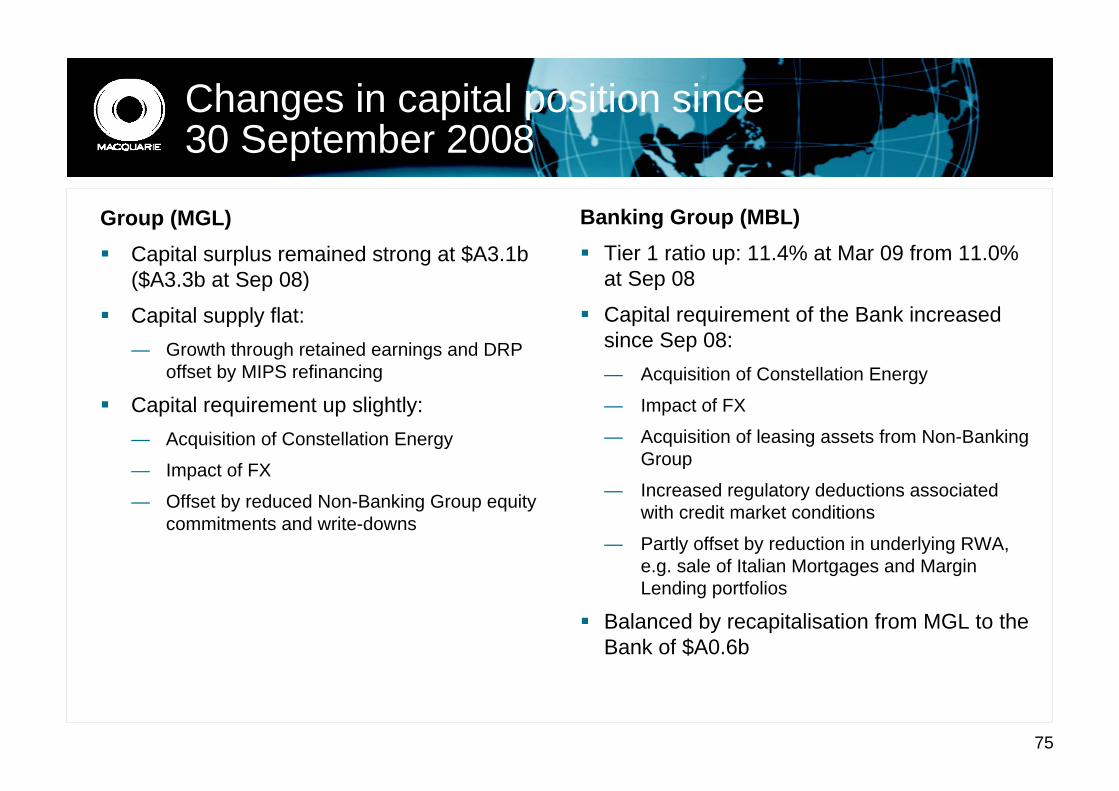
75
Changes in capital position since 30 September 2008
Group (MGL)Capital surplus remained strong at $A3.1b ($A3.3b at Sep 08)
Capital supply flat:— Growth through retained earnings and DRP
offset by MIPS refinancing
Capital requirement up slightly:— Acquisition of Constellation Energy
— Impact of FX
— Offset by reduced Non-Banking Group equity commitments and write-downs
Banking Group (MBL)Tier 1 ratio up: 11.4% at Mar 09 from 11.0% at Sep 08
Capital requirement of the Bank increased since Sep 08:— Acquisition of Constellation Energy
— Impact of FX
— Acquisition of leasing assets from Non-Banking Group
— Increased regulatory deductions associated with credit market conditions
— Partly offset by reduction in underlying RWA, e.g. sale of Italian Mortgages and Margin Lending portfolios
Balanced by recapitalisation from MGL to the Bank of $A0.6b
Appendix A:Additional Information - Funding
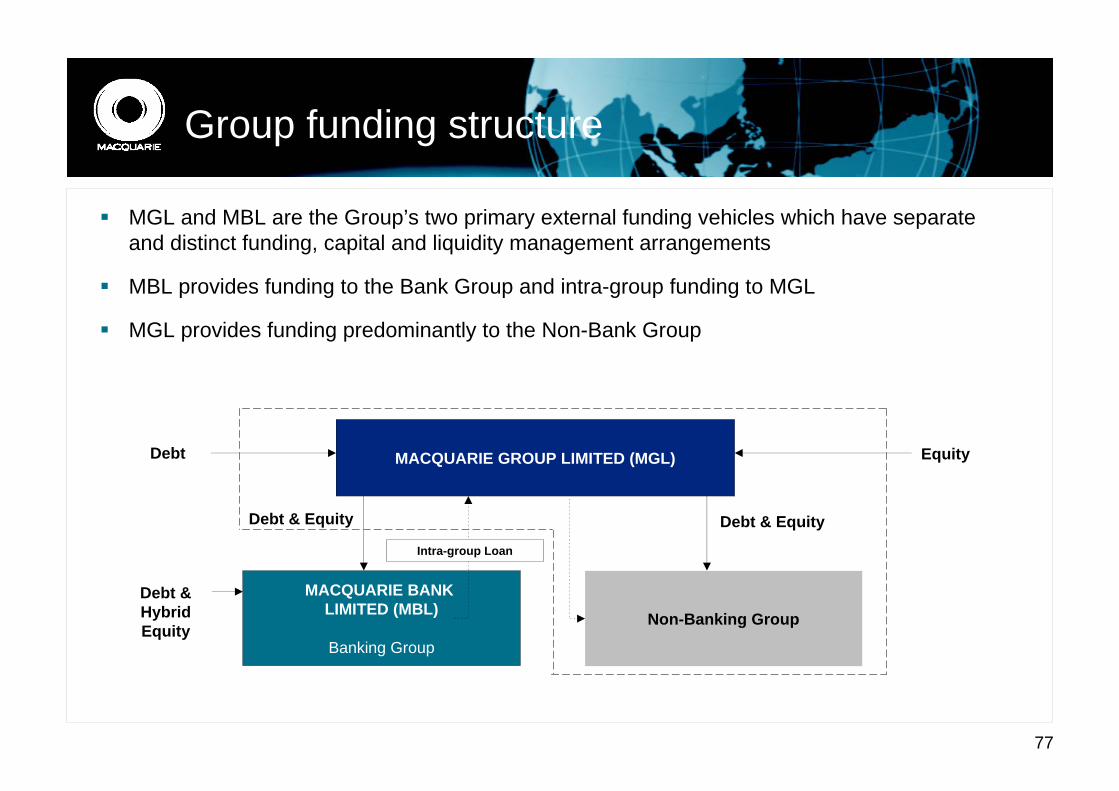
77
Group funding structure
MGL and MBL are the Group’s two primary external funding vehicles which have separate and distinct funding, capital and liquidity management arrangements
MBL provides funding to the Bank Group and intra-group funding to MGL
MGL provides funding predominantly to the Non-Bank Group
MACQUARIE GROUP LIMITED (MGL)
MACQUARIE BANK LIMITED (MBL)
Banking Group
Equity
Debt & HybridEquity
Debt & Equity Debt & Equity
Debt
Non-Banking Group
Intra-group Loan
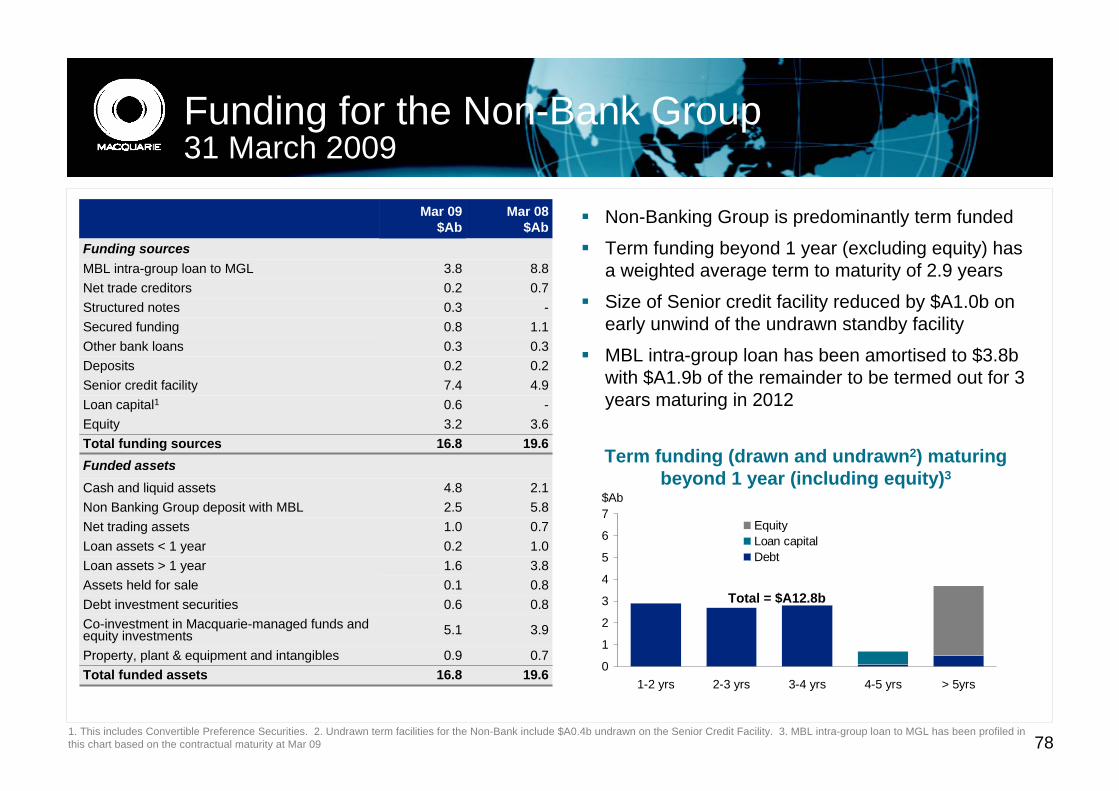
78
Funding for the Non-Bank Group31 March 2009
3.95.1Co-investment in Macquarie-managed funds and equity investments
0.70.2Net trade creditors
0.71.0Net trading assets
16.80.9
0.60.11.60.2
2.54.8
16.83.20.67.40.20.30.80.3
3.8
Mar 09$Ab
0.2Deposits
-Structured notes1.1Secured funding0.3Other bank loans
3.8Loan assets > 1 year
8.8MBL intra-group loan to MGL
-Loan capital1
5.8Non Banking Group deposit with MBL
4.9Senior credit facility
19.6Total funded assets0.7Property, plant & equipment and intangibles
0.8Debt investment securities0.8Assets held for sale
1.0Loan assets < 1 year
2.1Cash and liquid assets
Funded assets19.6Total funding sources3.6Equity
Mar 08$Ab
Funding sources
Term funding (drawn and undrawn2) maturing beyond 1 year (including equity)3
Non-Banking Group is predominantly term funded
Term funding beyond 1 year (excluding equity) has a weighted average term to maturity of 2.9 years
Size of Senior credit facility reduced by $A1.0b on early unwind of the undrawn standby facility
MBL intra-group loan has been amortised to $3.8b with $A1.9b of the remainder to be termed out for 3 years maturing in 2012
Total = $A12.8b
1. This includes Convertible Preference Securities. 2. Undrawn term facilities for the Non-Bank include $A0.4b undrawn on the Senior Credit Facility. 3. MBL intra-group loan to MGL has been profiled in this chart based on the contractual maturity at Mar 09
0
1
2
3
4
5
6
7
1-2 yrs 2-3 yrs 3-4 yrs 4-5 yrs > 5yrs
$Ab
EquityLoan capitalDebt
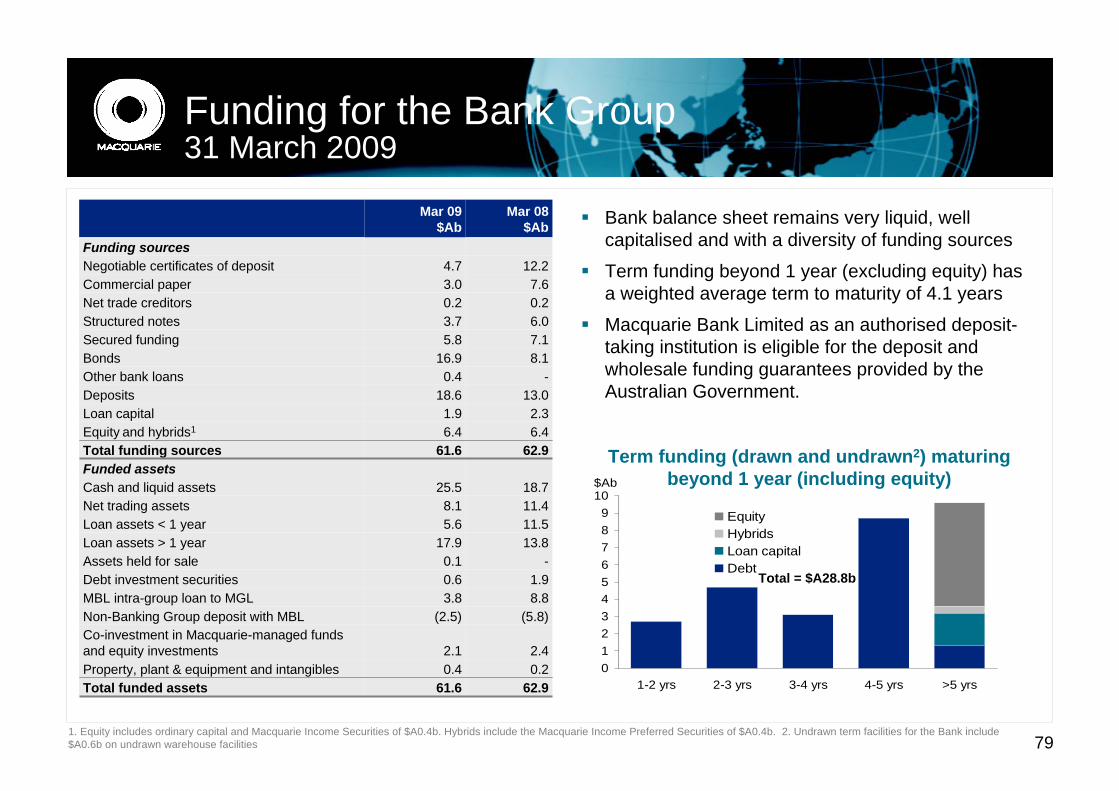
79
Funding for the Bank Group31 March 2009
Total = $A28.8b
Term funding (drawn and undrawn2) maturing beyond 1 year (including equity)
13.018.6Deposits
2.42.1Co-investment in Macquarie-managed funds and equity investments
0.20.2Net trade creditors
61.60.4
(2.5)3.80.60.1
17.95.68.1
25.5
61.66.41.9
0.416.95.83.7
3.04.7
Mar 09 $Ab
8.8MBL intra-group loan to MGL(5.8)Non-Banking Group deposit with MBL
8.1Bonds
6.0Structured notes
12.2Negotiable certificates of deposit
13.8Loan assets > 1 year
0.2Property, plant & equipment and intangibles
7.1Secured funding
7.6Commercial paper
-Other bank loans
-Assets held for sale
2.3Loan capital
62.9Total funded assets
1.9Debt investment securities
11.4Net trading assets11.5Loan assets < 1 year
18.7Cash and liquid assetsFunded assets
62.9Total funding sources6.4Equity and hybrids1
Mar 08$Ab
Funding sources
1. Equity includes ordinary capital and Macquarie Income Securities of $A0.4b. Hybrids include the Macquarie Income Preferred Securities of $A0.4b. 2. Undrawn term facilities for the Bank include $A0.6b on undrawn warehouse facilities
Bank balance sheet remains very liquid, well capitalised and with a diversity of funding sources
Term funding beyond 1 year (excluding equity) has a weighted average term to maturity of 4.1 years
Macquarie Bank Limited as an authorised deposit-taking institution is eligible for the deposit and wholesale funding guarantees provided by the Australian Government.
0123456789
10
1-2 yrs 2-3 yrs 3-4 yrs 4-5 yrs >5 yrs
$Ab
EquityHybridsLoan capitalDebt
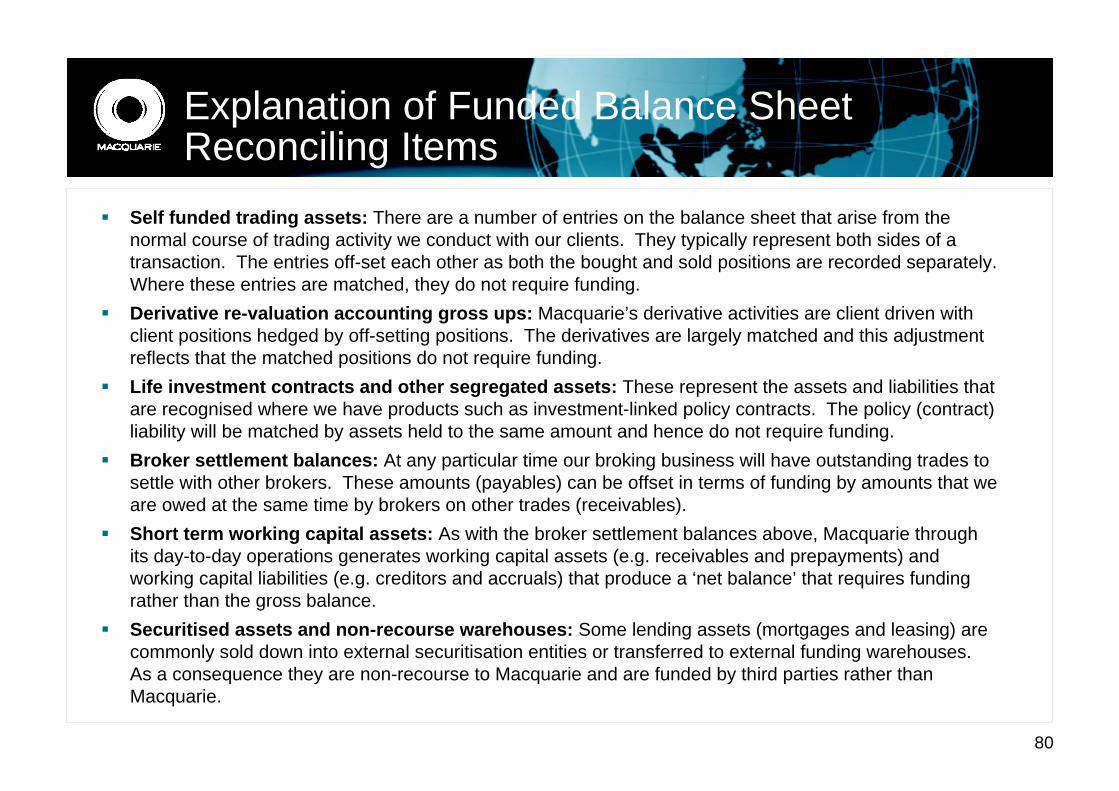
80
Explanation of Funded Balance SheetReconciling Items
Self funded trading assets: There are a number of entries on the balance sheet that arise from the normal course of trading activity we conduct with our clients. They typically represent both sides of a transaction. The entries off-set each other as both the bought and sold positions are recorded separately. Where these entries are matched, they do not require funding.Derivative re-valuation accounting gross ups: Macquarie’s derivative activities are client driven with client positions hedged by off-setting positions. The derivatives are largely matched and this adjustment reflects that the matched positions do not require funding. Life investment contracts and other segregated assets: These represent the assets and liabilities that are recognised where we have products such as investment-linked policy contracts. The policy (contract) liability will be matched by assets held to the same amount and hence do not require funding.Broker settlement balances: At any particular time our broking business will have outstanding trades to settle with other brokers. These amounts (payables) can be offset in terms of funding by amounts that we are owed at the same time by brokers on other trades (receivables).Short term working capital assets: As with the broker settlement balances above, Macquarie through its day-to-day operations generates working capital assets (e.g. receivables and prepayments) and working capital liabilities (e.g. creditors and accruals) that produce a ‘net balance’ that requires funding rather than the gross balance.Securitised assets and non-recourse warehouses: Some lending assets (mortgages and leasing) are commonly sold down into external securitisation entities or transferred to external funding warehouses. As a consequence they are non-recourse to Macquarie and are funded by third parties rather than Macquarie.
Appendix B:Additional Information - Capital
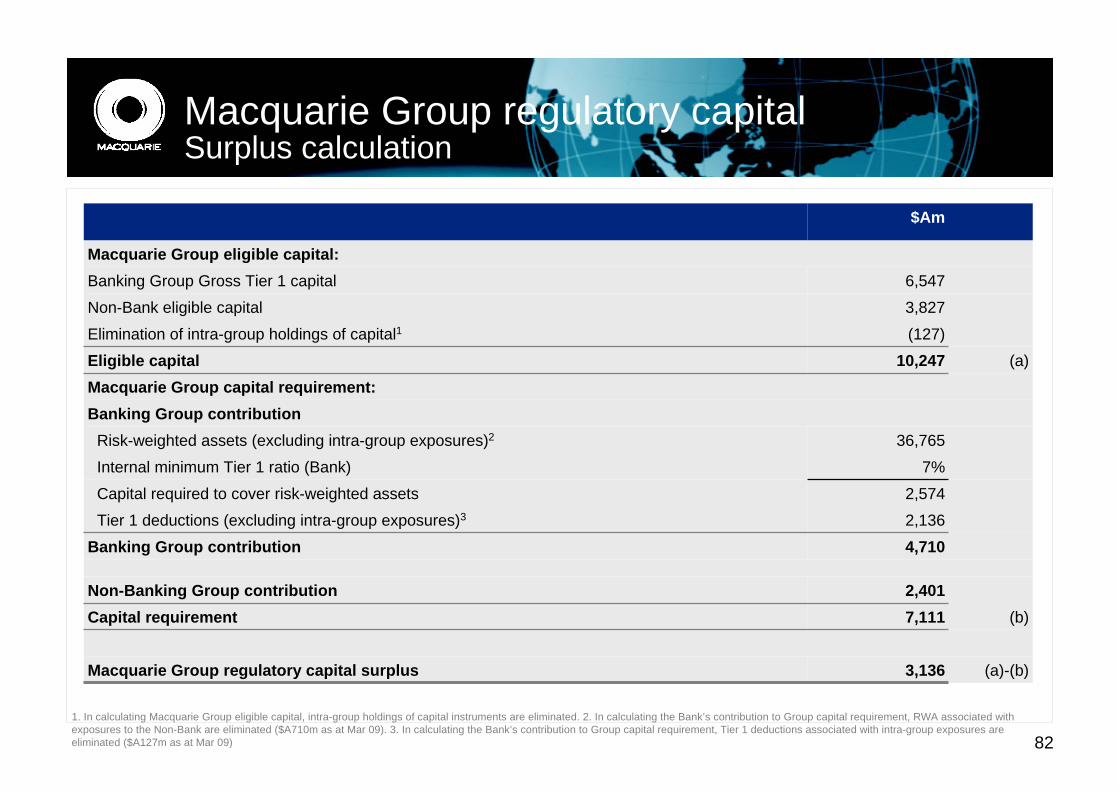
82
Macquarie Group regulatory capitalSurplus calculation
Macquarie Group eligible capital:6,547Banking Group Gross Tier 1 capital
(a)-(b)3,136 Macquarie Group regulatory capital surplus
(b)7,111 Capital requirement2,401 Non-Banking Group contribution
4,710Banking Group contribution2,136 Tier 1 deductions (excluding intra-group exposures)3
2,574 Capital required to cover risk-weighted assets
7%Internal minimum Tier 1 ratio (Bank)
36,765 Risk-weighted assets (excluding intra-group exposures)2
Banking Group contributionMacquarie Group capital requirement:
(a)10,247 Eligible capital(127) Elimination of intra-group holdings of capital13,827Non-Bank eligible capital
$Am
1. In calculating Macquarie Group eligible capital, intra-group holdings of capital instruments are eliminated. 2. In calculating the Bank’s contribution to Group capital requirement, RWA associated withexposures to the Non-Bank are eliminated ($A710m as at Mar 09). 3. In calculating the Bank’s contribution to Group capital requirement, Tier 1 deductions associated with intra-group exposures are eliminated ($A127m as at Mar 09)
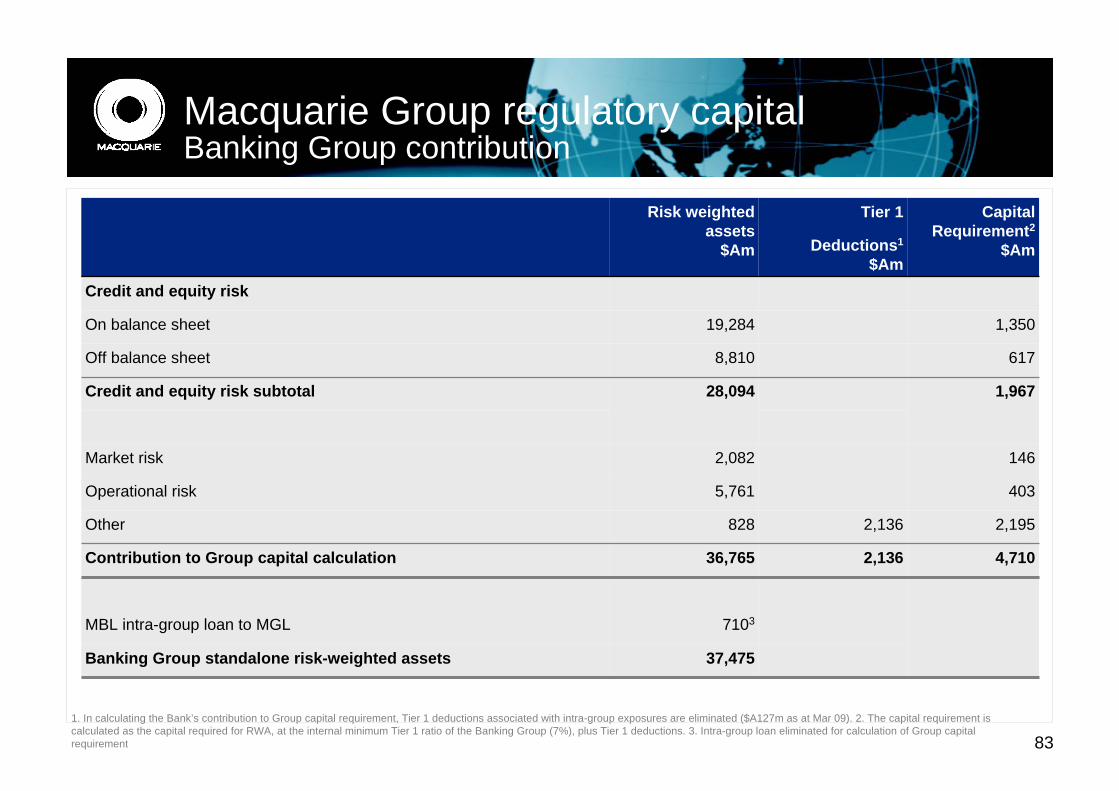
83
Macquarie Group regulatory capitalBanking Group contribution
4,710
2,195
403
146
1,967
617
1,350
Capital Requirement2
$Am
37,475
7103
36,765
828
5,761
2,082
28,094
8,810
19,284
Risk weighted assets
$Am
Banking Group standalone risk-weighted assets
MBL intra-group loan to MGL
2,136 Contribution to Group capital calculation
2,136 Other
Operational risk
Market risk
Credit and equity risk subtotal
Off balance sheet
On balance sheet
Credit and equity risk
Tier 1
Deductions1
$Am
1. In calculating the Bank’s contribution to Group capital requirement, Tier 1 deductions associated with intra-group exposures are eliminated ($A127m as at Mar 09). 2. The capital requirement is calculated as the capital required for RWA, at the internal minimum Tier 1 ratio of the Banking Group (7%), plus Tier 1 deductions. 3. Intra-group loan eliminated for calculation of Group capital requirement
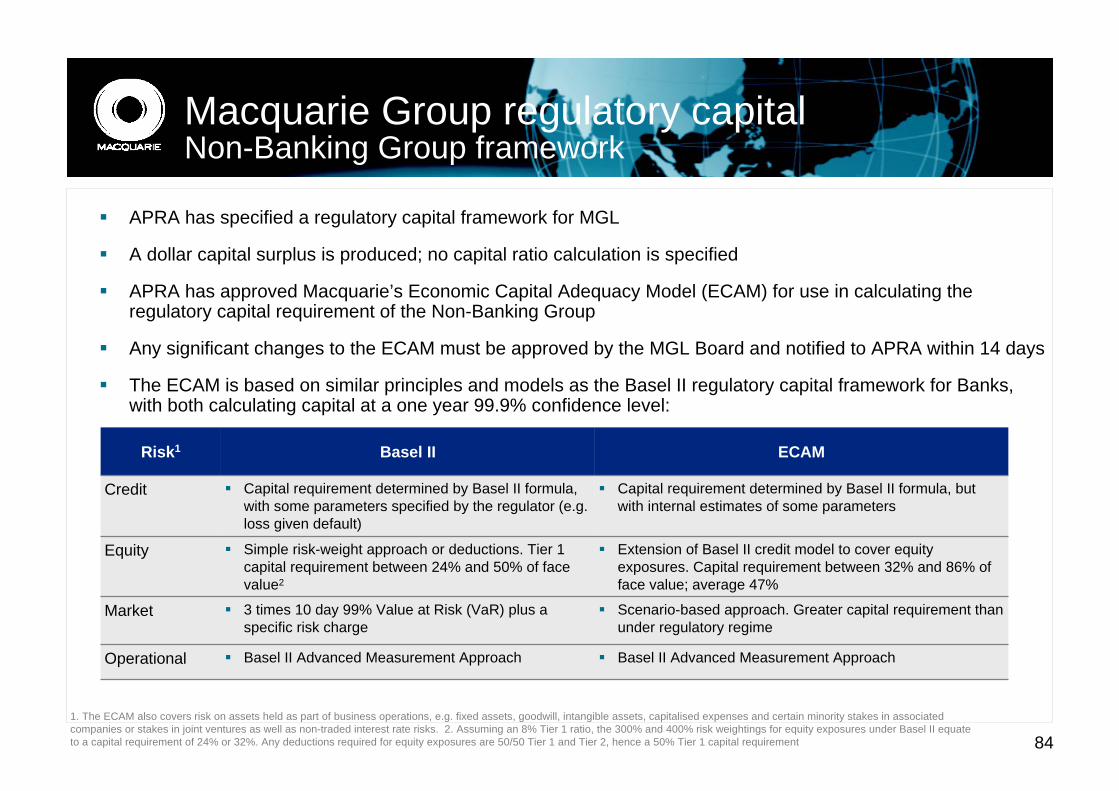
84
Macquarie Group regulatory capitalNon-Banking Group framework
APRA has specified a regulatory capital framework for MGL
A dollar capital surplus is produced; no capital ratio calculation is specified
APRA has approved Macquarie’s Economic Capital Adequacy Model (ECAM) for use in calculating the regulatory capital requirement of the Non-Banking Group
Any significant changes to the ECAM must be approved by the MGL Board and notified to APRA within 14 days
The ECAM is based on similar principles and models as the Basel II regulatory capital framework for Banks, with both calculating capital at a one year 99.9% confidence level:
Basel II Advanced Measurement Approach Basel II Advanced Measurement Approach Operational
Scenario-based approach. Greater capital requirement than under regulatory regime
3 times 10 day 99% Value at Risk (VaR) plus a specific risk charge
Market
Extension of Basel II credit model to cover equity exposures. Capital requirement between 32% and 86% of face value; average 47%
Simple risk-weight approach or deductions. Tier 1 capital requirement between 24% and 50% of face value2
Equity
Capital requirement determined by Basel II formula, but with internal estimates of some parameters
Capital requirement determined by Basel II formula, with some parameters specified by the regulator (e.g. loss given default)
Credit
ECAMBasel IIRisk1
1. The ECAM also covers risk on assets held as part of business operations, e.g. fixed assets, goodwill, intangible assets, capitalised expenses and certain minority stakes in associated companies or stakes in joint ventures as well as non-traded interest rate risks. 2. Assuming an 8% Tier 1 ratio, the 300% and 400% risk weightings for equity exposures under Basel II equate to a capital requirement of 24% or 32%. Any deductions required for equity exposures are 50/50 Tier 1 and Tier 2, hence a 50% Tier 1 capital requirement
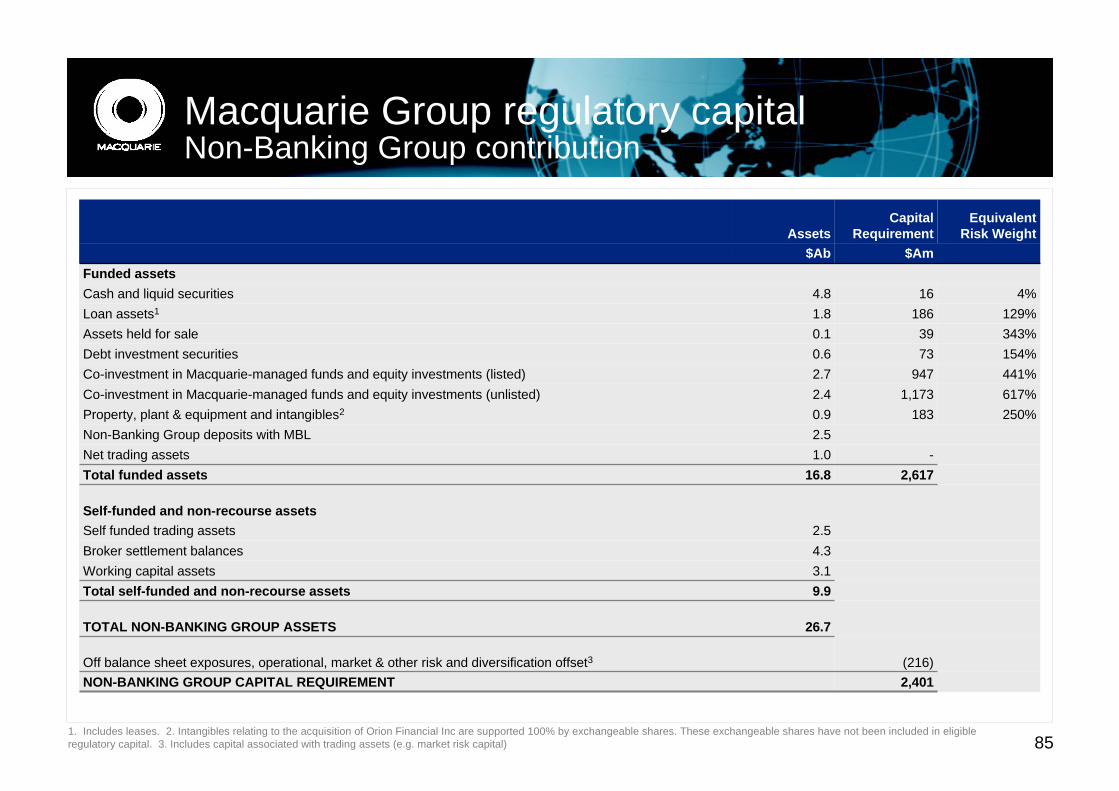
85
Macquarie Group regulatory capitalNon-Banking Group contribution
2.5Non-Banking Group deposits with MBL-1.0Net trading assets
4.3Broker settlement balances
Funded assets
2,401 NON-BANKING GROUP CAPITAL REQUIREMENT(216)Off balance sheet exposures, operational, market & other risk and diversification offset3
26.7TOTAL NON-BANKING GROUP ASSETS
9.9Total self-funded and non-recourse assets3.1Working capital assets
2.5Self funded trading assetsSelf-funded and non-recourse assets
16.8
0.92.42.70.60.11.84.8
$AbAssets
2,617 Total funded assets
250%183Property, plant & equipment and intangibles2
617%1,173 Co-investment in Macquarie-managed funds and equity investments (unlisted)441%947 Co-investment in Macquarie-managed funds and equity investments (listed)154%73 Debt investment securities343%39Assets held for sale129%186 Loan assets1
4%16 Cash and liquid securities
$Am
Equivalent Risk Weight
Capital Requirement
1. Includes leases. 2. Intangibles relating to the acquisition of Orion Financial Inc are supported 100% by exchangeable shares. These exchangeable shares have not been included in eligible regulatory capital. 3. Includes capital associated with trading assets (e.g. market risk capital)