Embed Size (px)
Citation preview
September 2007
Macquarie Bank Limited
Investor Presentation – JPMorganconferences, New York and Edinburgh
Richard SheppardDeputy Managing Director
2
Disclaimer
The name "Macquarie" refers to the Macquarie Group, which comprises Macquarie Bank Limited and its worldwide subsidiaries, affiliates, and the funds or companies that they manage.
Future results are impossible to predict. Opinions and estimates offered in this presentation constitute our judgement and are subject to change without notice, as are statements about market trends, which are based on current market conditions. This presentation may include forward-looking statements that represent opinions, estimates and forecasts, which may not be realized. We believe the information provided herein is reliable, as of the date hereof, but do not warrant its accuracy or completeness. In preparing these materials, we have relied upon and assumed, without independent verification, the accuracy and completeness of all information available from public sources.
Macquarie Bank Limited is not licensed to conduct banking business in the United States. It maintains Representative Offices in New York, Texas, California and Washington. With respect to matters pertaining to US securities laws, and to the extent required by such laws, Macquarie Bank Limited and its worldwide subsidiaries consult with, and act through, Macquarie Securities (USA) Inc., a registered broker-dealer and member of FINRA, or another US broker-dealer.
Macquarie Bank Limited, London Branch, is authorised to conduct banking business in the United Kingdom. Macquarie Bank Limited, London Branch, Macquarie Europe Limited and Macquarie Investment Management (UK) Limited are authorised and regulated by the United Kingdom Financial Services Authority.
Any Macquarie subsidiary noted in this presentation is not an authorized deposit-taking institution for the purposes of Banking Act (Commonwealth of Australia) 1959, and such subsidiaries obligations do not represent deposits or other liabilities of Macquarie Bank Limited ABN 46 008 583 542. Macquarie Bank Limited does not guarantee or otherwise provide assurance in respect of the obligations of any such subsidiary.
Past performance is not an indicator of future performance.
Throughout this report, periods prior to the 2005 financial year are reported under previous AGAAP, unless otherwise stated.
3
Agenda
Overview
Financial performance
Growing internationally
Proposed restructure
General update and outlook
Appendices
— Earnings drivers
— Analysis by business segment
— Restructure – further detail
4
A diversified financial services institution
Full service in Australia
Broad investment banking in Asia-Pacific
Focussed participation in international markets
Established 1969, banking license 1985, listed 1996
Market capitalisation: $A20.4b* – Top 15 company on ASX, over 100,000 shareholders
(*as at 9c
h 06 – Macquarie Securities)* At 19 Sept 2007
5
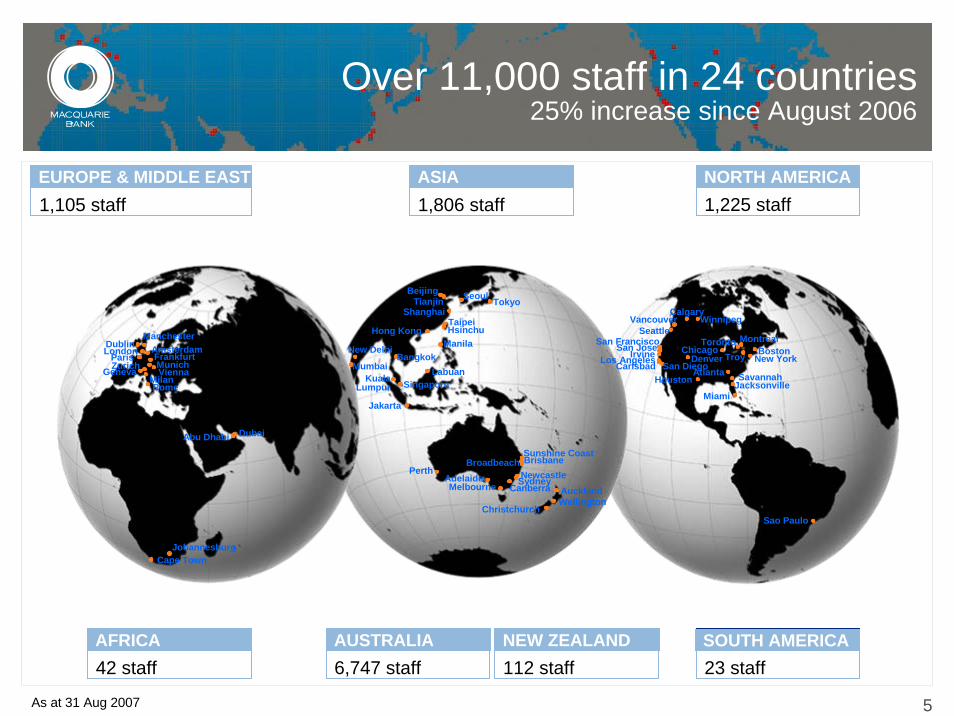
Over 11,000 staff in 24 countries25% increase since August 2006
NORTH AMERICA1,225 staff
SOUTH AMERICA23 staff
NEW ZEALAND112 staff
AUSTRALIA6,747 staff
AFRICA42 staff
ASIA1,806 staff
EUROPE & MIDDLE EAST1,105 staff
DublinParis
MilanVienna
Rome
AmsterdamLondon
Dubai
Zurich MunichFrankfurt
Geneva
Abu Dhabi
Mumbai
Cape TownJohannesburg
AucklandWellington
Christchurch
Jakarta
BangkokLabuan
SingaporeKuala Lumpur
Seoul Tokyo
ManilaHong Kong
TaipeiHsinchu
Shanghai
BeijingTianjin
Sao Paulo
ChicagoToronto Montreal
JacksonvilleSavannah
Miami
San JoseSan FranciscoSeattle
Vancouver
New YorkBoston
CarlsbadLos AngelesIrvineSan Diego
Houston
Denver
Sunshine CoastBrisbaneBroadbeach
SydneyNewcastleCanberraMelbourne
AdelaidePerth
CalgaryWinnipeg
New DelhiTroy
Atlanta
As at 31 Aug 2007
Manchester
6
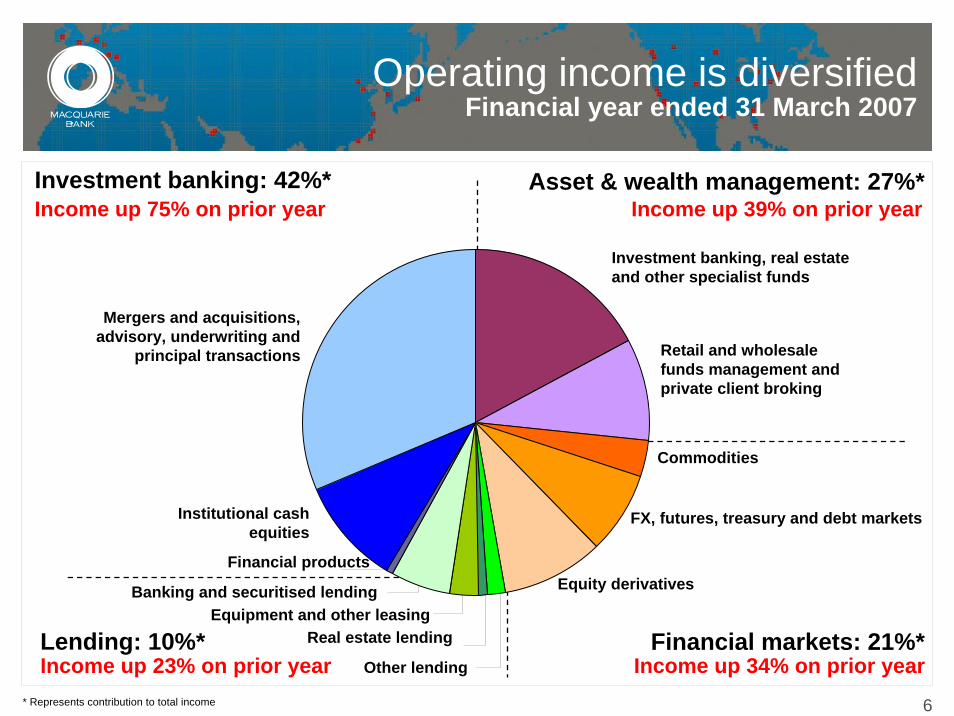
Operating income is diversified Financial year ended 31 March 2007
Asset & wealth management: 27%*Investment banking: 42%*Income up 75% on prior year Income up 39% on prior year
Financial markets: 21%*Income up 34% on prior year
Lending: 10%*Income up 23% on prior year
Commodities
FX, futures, treasury and debt markets
Mergers and acquisitions, advisory, underwriting and
principal transactions
Financial products
Equipment and other leasing
Other lending
Investment banking, real estate and other specialist funds
Equity derivatives
Institutional cash equities
Banking and securitised lending
Retail and wholesale funds management and private client broking
Real estate lending
* Represents contribution to total income
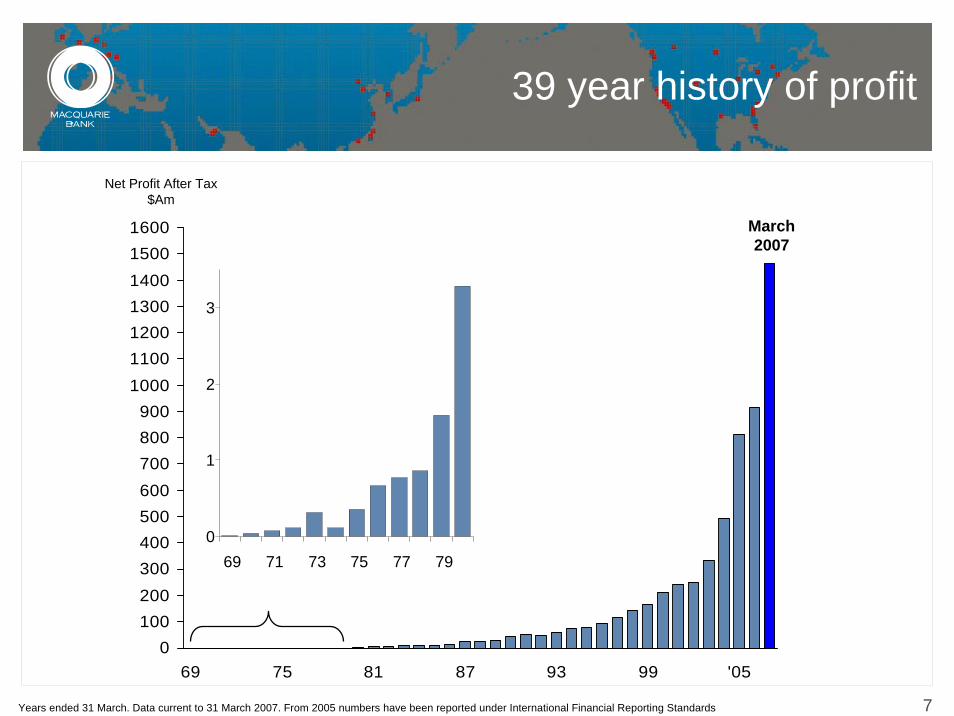
7
Net Profit After Tax $Am
Years ended 31 March. Data current to 31 March 2007. From 2005 numbers have been reported under International Financial Reporting Standards
0100200300400500600700800900
1000110012001300140015001600
69 75 81 87 93 99 '05
March 2007
39 year history of profit
0
1
2
3
69 71 73 75 77 79
8
Agenda
Overview
Financial performance
Growing internationally
Proposed restructure
General update and outlook
Appendices
— Earnings drivers
— Analysis by business segment
— Restructure – further detail
9Years ended 31 March
0
100
200
300
400
500
600
700
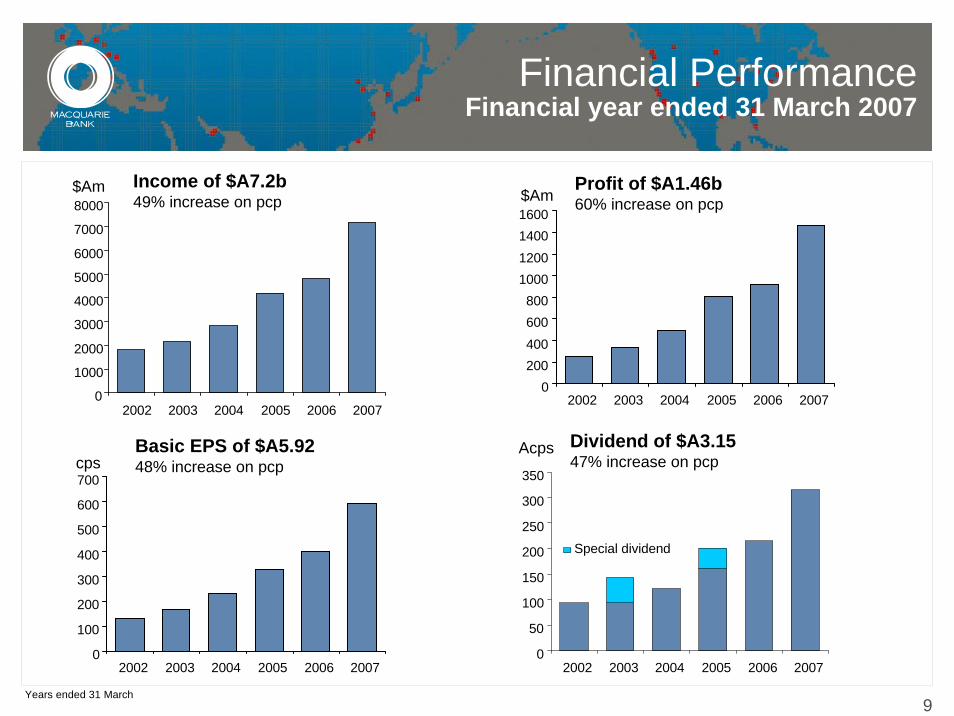
2002 2003 2004 2005 2006 2007
cpsBasic EPS of $A5.9248% increase on pcp
Profit of $A1.46b60% increase on pcp$Am
0200400600800
1000120014001600
2002 2003 2004 2005 2006 2007
Financial Performance Financial year ended 31 March 2007
0
50
100
150
200
250
300
350
2002 2003 2004 2005 2006 2007
Special dividend
Dividend of $A3.1547% increase on pcp
Acps
0
1000
2000
3000
4000
5000
6000
7000
8000
2002 2003 2004 2005 2006 2007
Income of $A7.2b49% increase on pcp
$Am
10
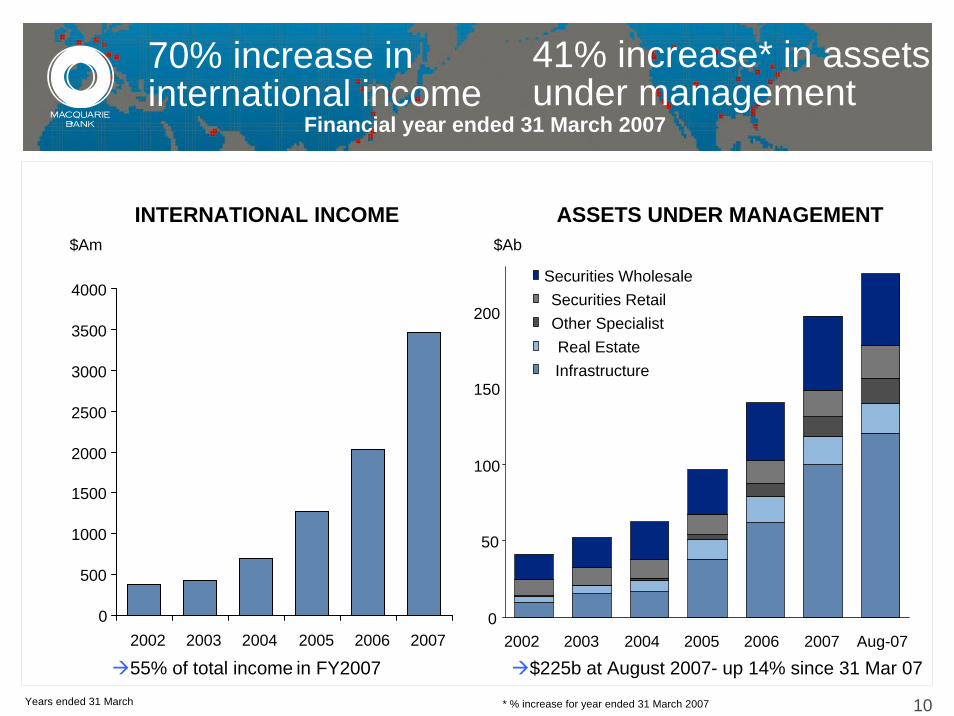
70% increase in international income
55% of total income
41% increase* in assets under management
$Am
$225b at August 2007- up 14% since 31 Mar 07
0
50
100
150
200
2002 2003 2004 2005 2006 2007 Aug-07
* % increase for year ended 31 March 2007 Years ended 31 March
Securities WholesaleSecurities RetailOther SpecialistReal EstateInfrastructure
INTERNATIONAL INCOME
0
500
1000
1500
2000
2500
3000
3500
4000
2002 2003 2004 2005 2006 2007
ASSETS UNDER MANAGEMENT
Financial year ended 31 March 2007
in FY2007
$Ab
11
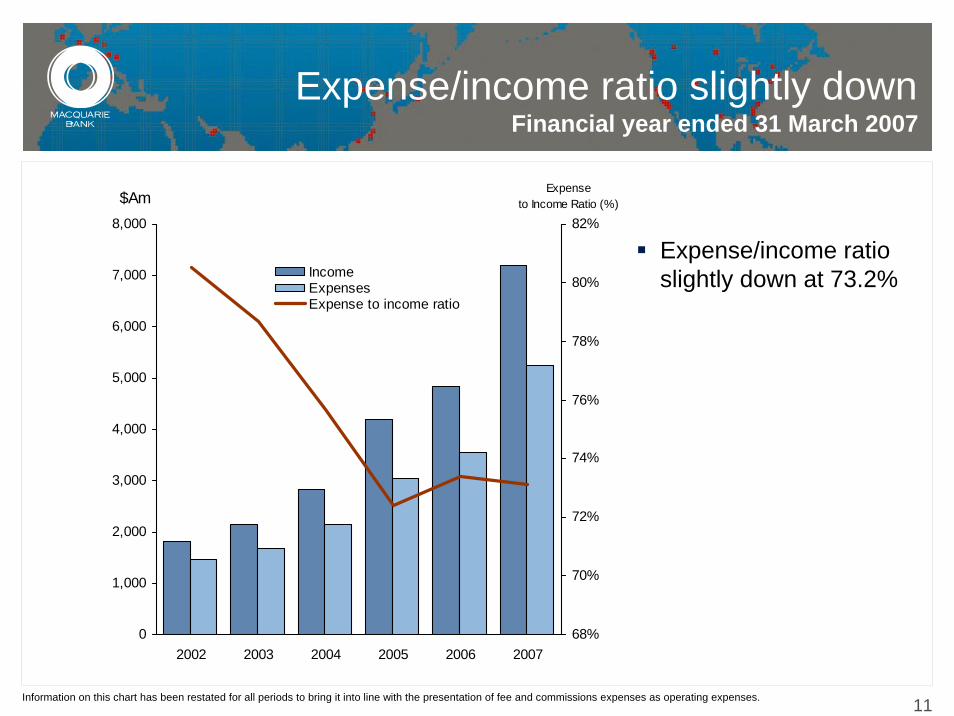
Expense/income ratio slightly down
0
1,000
2,000
3,000
4,000
5,000
6,000
7,000
8,000
2002 2003 2004 2005 2006 2007
$Am
68%
70%
72%
74%
76%
78%
80%
82%
Expense to Income Ratio (%)
IncomeExpensesExpense to income ratio
Information on this chart has been restated for all periods to bring it into line with the presentation of fee and commissions expenses as operating expenses.
Expense/income ratio slightly down at 73.2%
Financial year ended 31 March 2007
12
0
5
10
15
20
25
30
35
40
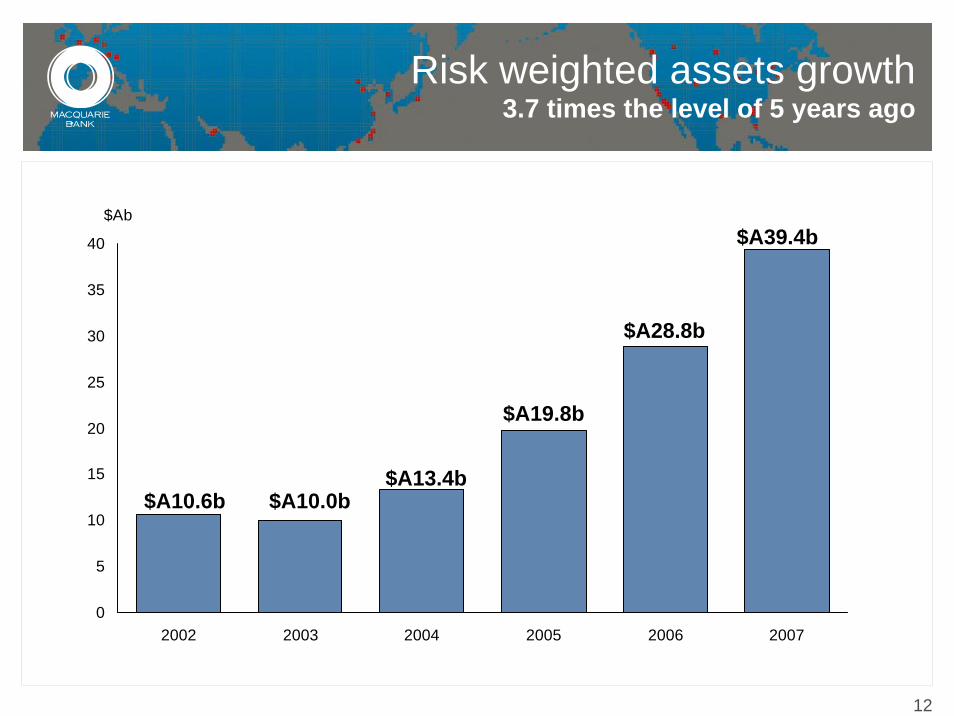
2002 2003 2004 2005 2006 2007
$Ab
$A28.8b
$A19.8b
$A13.4b$A10.0b$A10.6b
$A39.4b
Risk weighted assets growth 3.7 times the level of 5 years ago
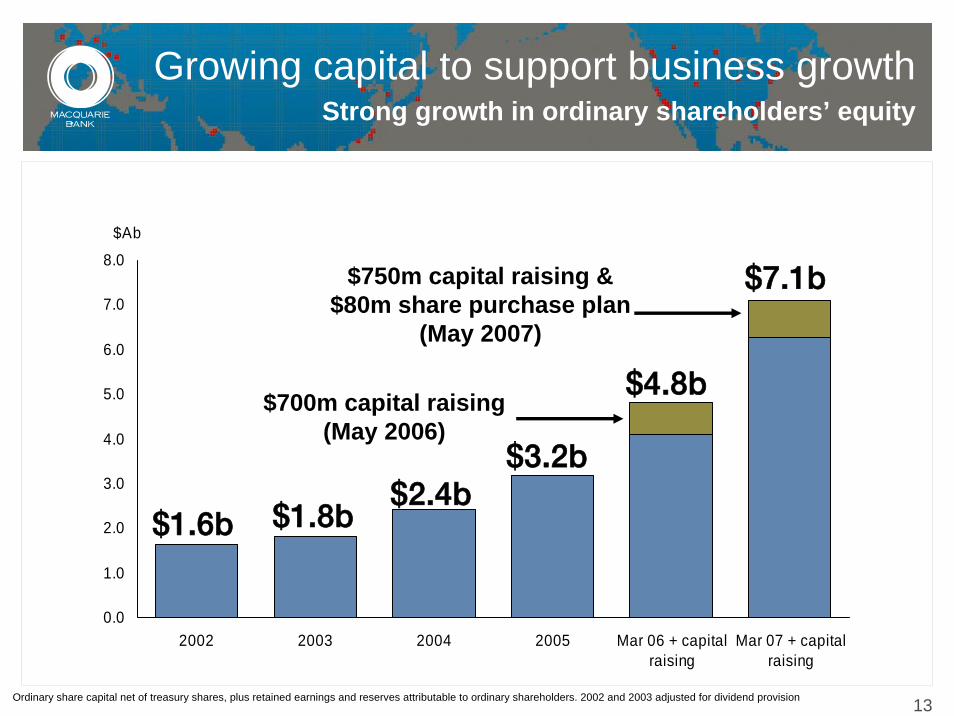
13Ordinary share capital net of treasury shares, plus retained earnings and reserves attributable to ordinary shareholders. 2002 and 2003 adjusted for dividend provision
0.0
1.0
2.0
3.0
4.0
5.0
6.0
7.0
8.0
2002 2003 2004 2005 Mar 06 + capitalraising
Mar 07 + capitalraising
$Ab
$700m capital raising(May 2006)
Growing capital to support business growthStrong growth in ordinary shareholders’ equity
AQKUÄ
APKOÄAOKQÄ
ANKUÄANKSÄ
$750m capital raising & $80m share purchase plan
(May 2007)
ATKNÄ
14
Agenda
Overview
Financial performance
Growing internationally
Proposed restructure
General update and outlook
Appendices
— Earnings drivers
— Analysis by business segment
— Restructure – further detail
15
From an Australian institution growing internationally to a global institution
headquartered in Australia
0
1,000
2,000
3,000
4,000
5,000
6,000
7,000
2002 2003 2004 2005 2006 2007
InternationalAustralia
* Excluding earnings on capital and after costs directly attributable to earning the income, including fee and commissions expenses.
$Am
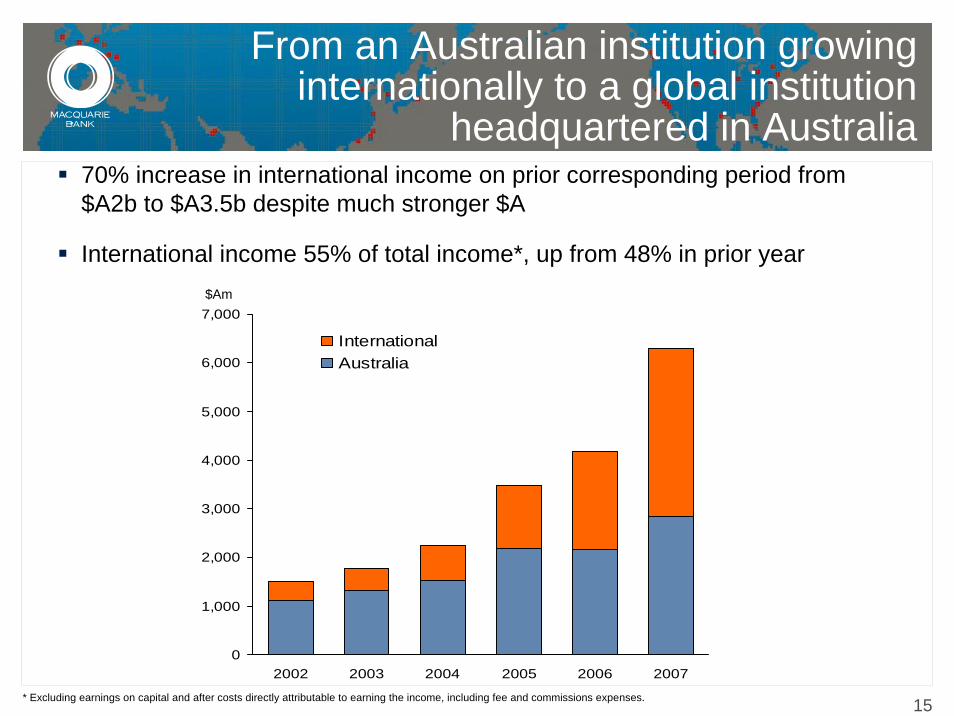
70% increase in international income on prior corresponding period from $A2b to $A3.5b despite much stronger $A
International income 55% of total income*, up from 48% in prior year
16
From an Australian institution growing internationally to a global institution
headquartered in Australia
0
4,000
8,000
12,000
16,000
20,000
24,000
2004 2005 2006 2007 Apr - Aug 07
InternationalAustralia
$Am
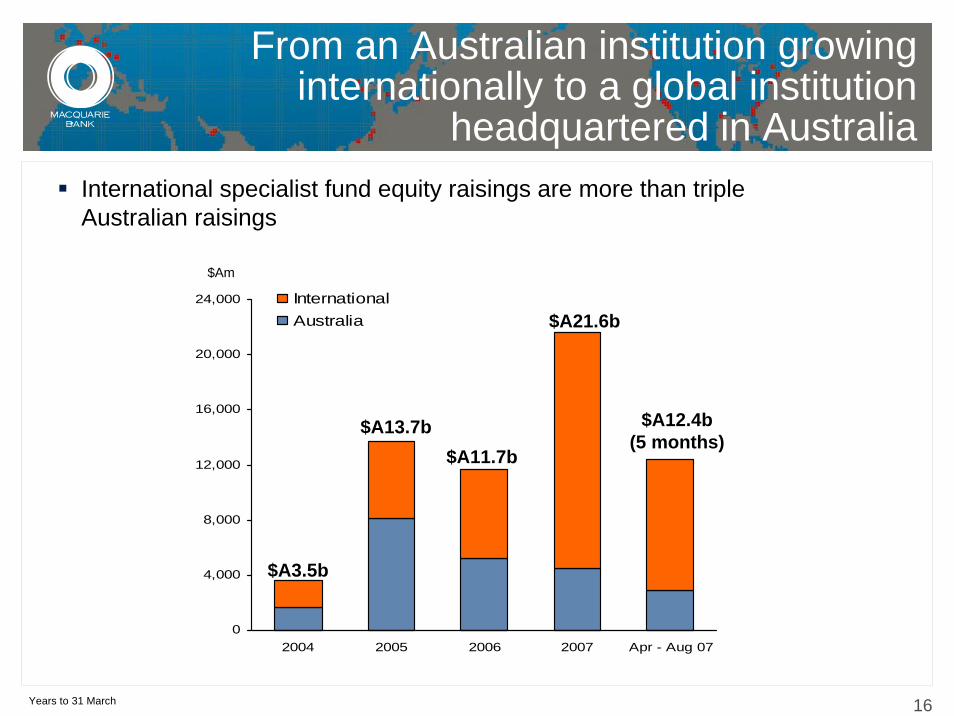
$A3.5b
$A13.7b$A11.7b
International specialist fund equity raisings are more than triple Australian raisings
$A21.6b
$A12.4b (5 months)
Years to 31 March
17
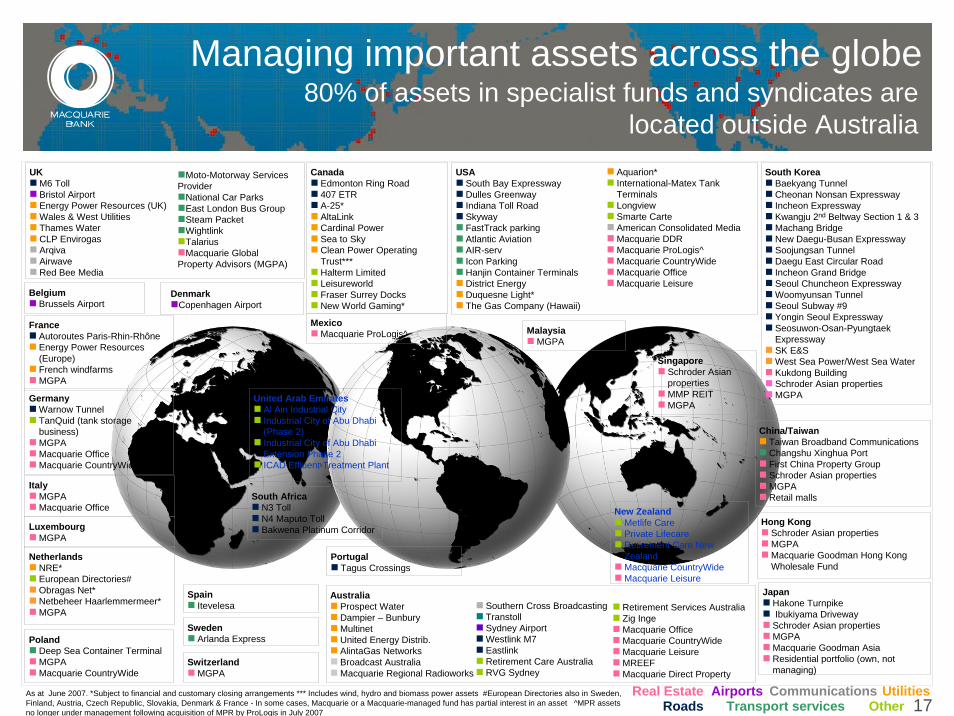
Managing important assets across the globe
South AfricaN3 Toll N4 Maputo Toll Bakwena Platinum Corridor
United Arab EmiratesAl Ain Industrial CityIndustrial City of Abu Dhabi (Phase 2)Industrial City of Abu Dhabi Extension Phase 2ICAD Effluent Treatment Plant
USASouth Bay ExpresswayDulles GreenwayIndiana Toll RoadSkywayFastTrack parkingAtlantic AviationAIR-servIcon ParkingHanjin Container TerminalsDistrict Energy Duquesne Light*The Gas Company (Hawaii)
Aquarion*International-Matex Tank TerminalsLongviewSmarte CarteAmerican Consolidated MediaMacquarie DDR Macquarie ProLogis^Macquarie CountryWide Macquarie OfficeMacquarie Leisure
CanadaEdmonton Ring Road407 ETRA-25*AltaLinkCardinal PowerSea to SkyClean Power Operating Trust***Halterm LimitedLeisureworldFraser Surrey DocksNew World Gaming*
MexicoMacquarie ProLogis^
UKM6 TollBristol AirportEnergy Power Resources (UK)Wales & West UtilitiesThames WaterCLP EnvirogasArqivaAirwaveRed Bee Media
Moto-Motorway Services Provider
National Car ParksEast London Bus GroupSteam PacketWightlinkTalariusMacquarie Global
Property Advisors (MGPA)
New ZealandMetlife CarePrivate LifecareRetirement Care New ZealandMacquarie CountryWide Macquarie Leisure
BelgiumBrussels Airport
DenmarkCopenhagen Airport
South KoreaBaekyang TunnelCheonan Nonsan ExpresswayIncheon ExpresswayKwangju 2nd Beltway Section 1 & 3Machang BridgeNew Daegu-Busan ExpresswaySoojungsan TunnelDaegu East Circular RoadIncheon Grand BridgeSeoul Chuncheon ExpresswayWoomyunsan TunnelSeoul Subway #9Yongin Seoul ExpresswaySeosuwon-Osan-Pyungtaek ExpresswaySK E&SWest Sea Power/West Sea WaterKukdong BuildingSchroder Asian propertiesMGPA
China/TaiwanTaiwan Broadband CommunicationsChangshu Xinghua PortFirst China Property GroupSchroder Asian propertiesMGPARetail malls
Hong KongSchroder Asian propertiesMGPAMacquarie Goodman Hong Kong Wholesale Fund
JapanHakone TurnpikeIbukiyama Driveway
Schroder Asian propertiesMGPAMacquarie Goodman AsiaResidential portfolio (own, not managing)
SingaporeSchroder Asian propertiesMMP REITMGPA
FranceAutoroutes Paris-Rhin-RhôneEnergy Power Resources (Europe)French windfarmsMGPA
ItalyMGPAMacquarie Office
GermanyWarnow TunnelTanQuid (tank storage business)MGPAMacquarie OfficeMacquarie CountryWide
LuxembourgMGPA
NetherlandsNRE*European Directories#Obragas Net*Netbeheer Haarlemmermeer*MGPA
PolandDeep Sea Container TerminalMGPAMacquarie CountryWide
PortugalTagus Crossings
SpainItevelesa
SwedenArlanda Express
SwitzerlandMGPA
RoadsUtilities
Transport servicesReal Estate CommunicationsAirports
OtherAs at June 2007. *Subject to financial and customary closing arrangements *** Includes wind, hydro and biomass power assets #European Directories also in Sweden, Finland, Austria, Czech Republic, Slovakia, Denmark & France - In some cases, Macquarie or a Macquarie-managed fund has partial interest in an asset ^MPR assets no longer under management following acquisition of MPR by ProLogis in July 2007
AustraliaProspect WaterDampier – BunburyMultinetUnited Energy Distrib.AlintaGas NetworksBroadcast AustraliaMacquarie Regional Radioworks
Southern Cross BroadcastingTranstollSydney AirportWestlink M7EastlinkRetirement Care AustraliaRVG Sydney
Retirement Services AustraliaZig IngeMacquarie OfficeMacquarie CountryWide Macquarie Leisure MREEFMacquarie Direct Property
MalaysiaMGPA
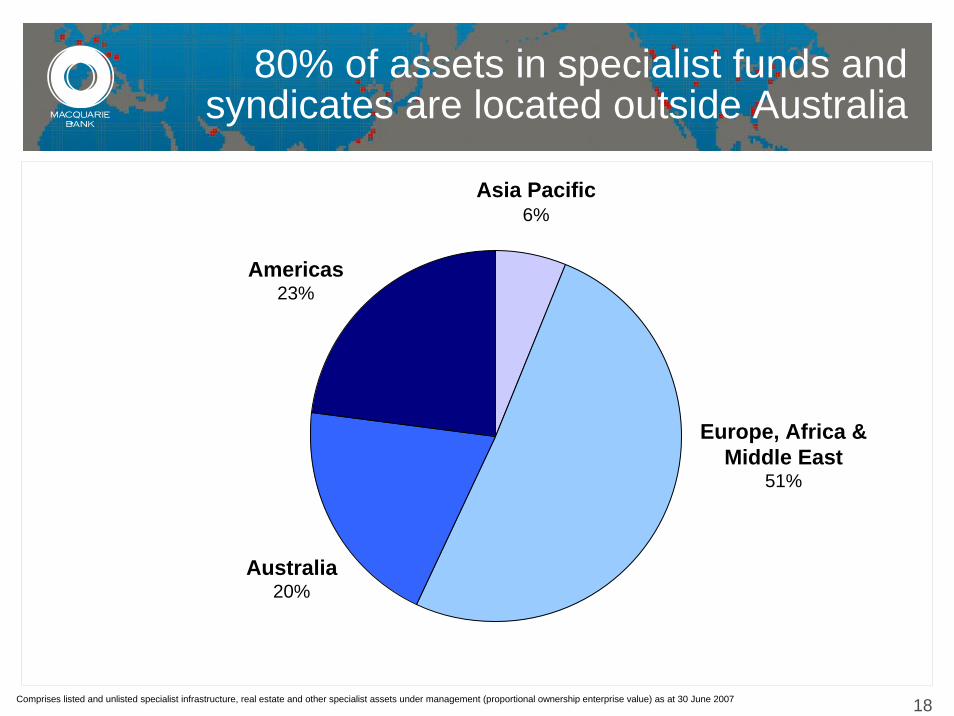
80% of assets in specialist funds and syndicates are located outside Australia
18
Americas23%
Asia Pacific6%
Europe, Africa & Middle East
51%
Australia20%
80% of assets in specialist funds and syndicates are located outside Australia
Comprises listed and unlisted specialist infrastructure, real estate and other specialist assets under management (proportional ownership enterprise value) as at 30 June 2007
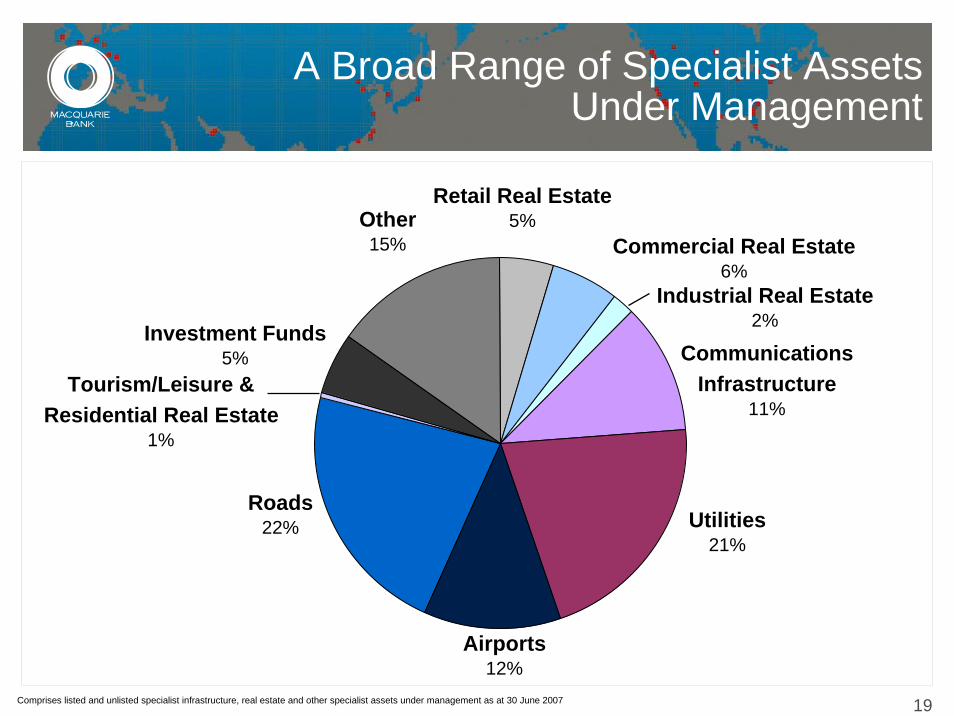
19Comprises listed and unlisted specialist infrastructure, real estate and other specialist assets under management as at 30 June 2007
Tourism/Leisure & Residential Real Estate
1%
A Broad Range of Specialist Assets Under Management
Commercial Real Estate6%
Industrial Real Estate2%
Communications Infrastructure
11%
Utilities 21%
Airports 12%
Roads 22%
Other 15%
Investment Funds5%
Retail Real Estate5%
20
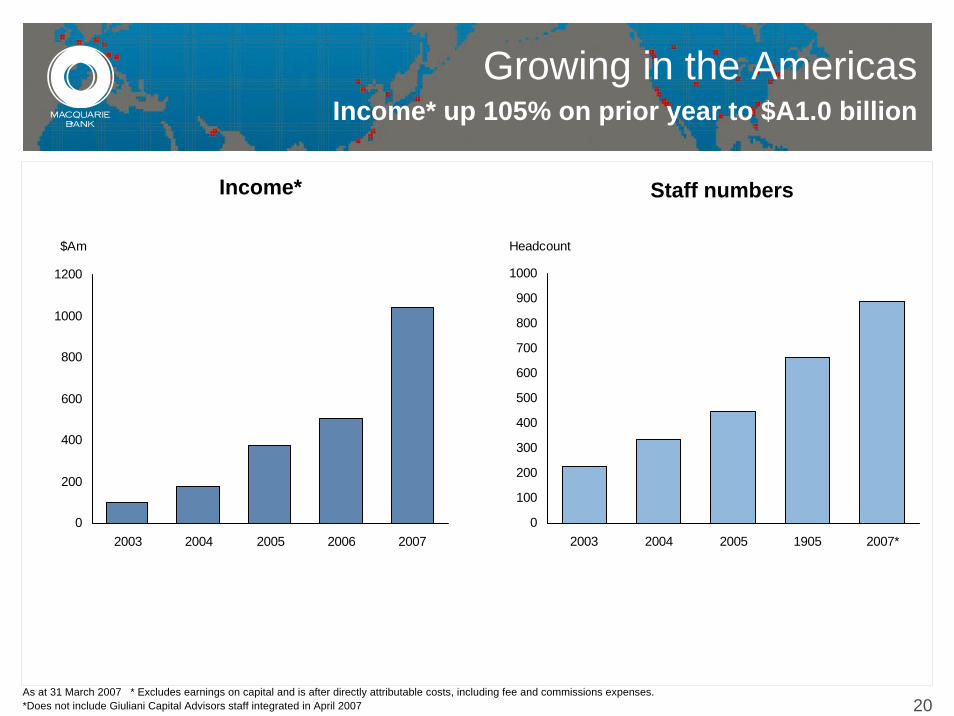
Income* Staff numbers
As at 31 March 2007 * Excludes earnings on capital and is after directly attributable costs, including fee and commissions expenses. *Does not include Giuliani Capital Advisors staff integrated in April 2007
Growing in the AmericasIncome* up 105% on prior year to $A1.0 billion
0
200
400
600
800
1000
1200
2003 2004 2005 2006 2007
$Am
0
100
200
300
400
500
600
700
800
900
1000
2003 2004 2005 1905 2007*
Headcount
21
Sao Paulo
Toronto
Houston
San Francisco
SeattleVancouver
Miami
WinnipegMontreal
Carlsbad Savannah
Denver
Calgary
Chicago
Los Angeles
San Diego Jacksonville
San JoseNew York
Boston
Irvine
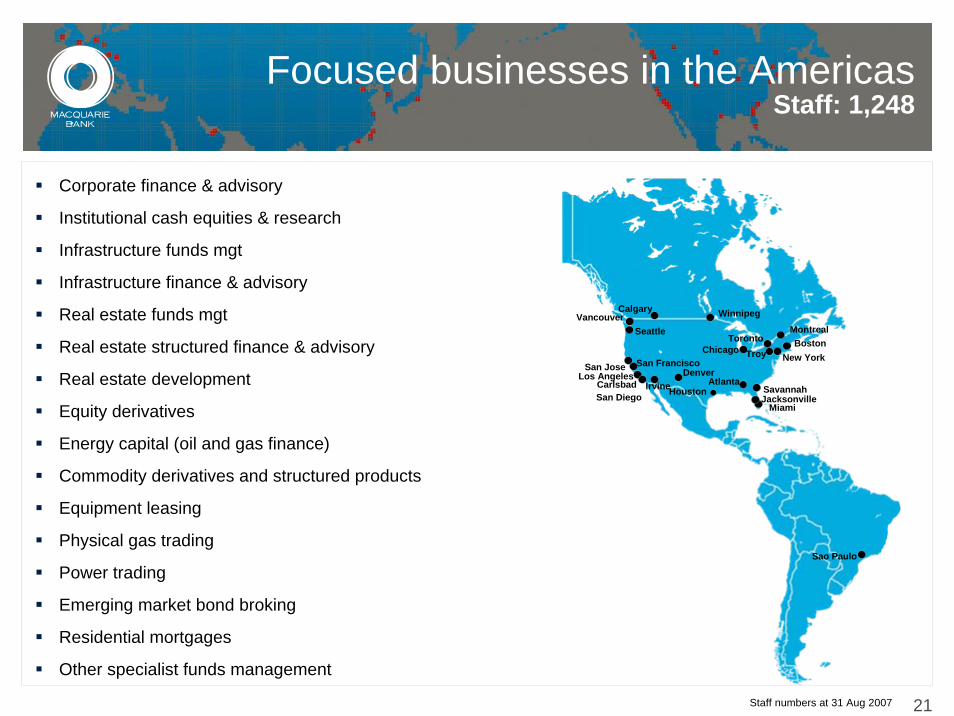
Focused businesses in the AmericasStaff: 1,248
Corporate finance & advisory
Institutional cash equities & research
Infrastructure funds mgt
Infrastructure finance & advisory
Real estate funds mgt
Real estate structured finance & advisory
Real estate development
Equity derivatives
Energy capital (oil and gas finance)
Commodity derivatives and structured products
Equipment leasing
Physical gas trading
Power trading
Emerging market bond broking
Residential mortgages
Other specialist funds management
Atlanta
Troy
Staff numbers at 31 Aug 2007
22
Income* Staff numbers
0
200
400
600
800
1000
1200
1400
1600
2003 2004 2005 2006 2007
$Am
0
100
200
300
400
500
600
700
800
900
1000
2003 2004 2005 2006 2007
Headcount
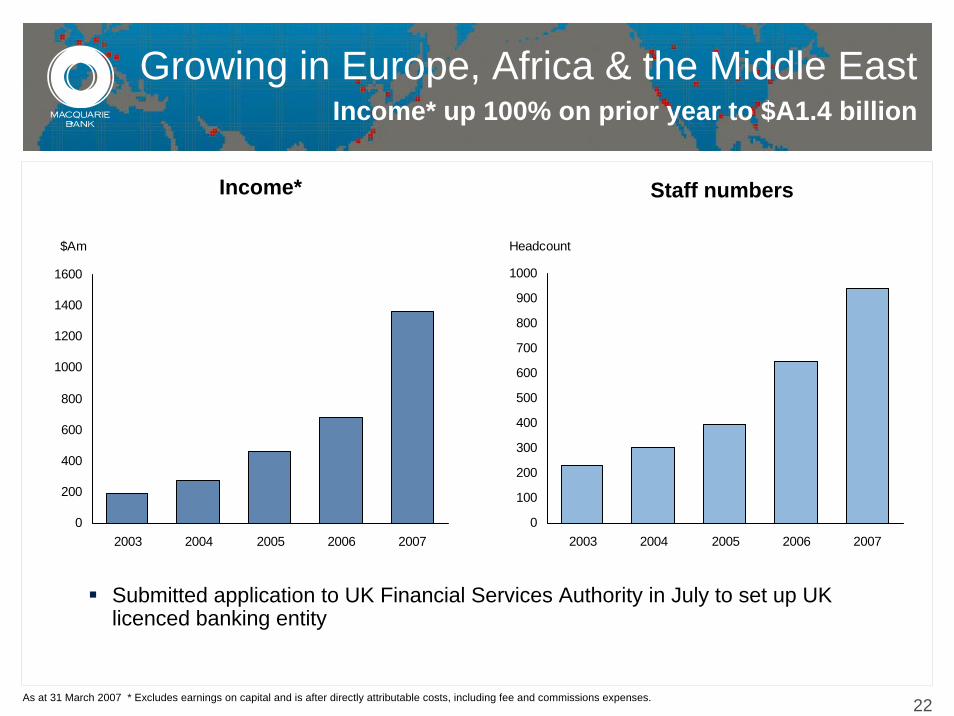
Growing in Europe, Africa & the Middle EastIncome* up 100% on prior year to $A1.4 billion
Submitted application to UK Financial Services Authority in July to set up UK licenced banking entity
As at 31 March 2007 * Excludes earnings on capital and is after directly attributable costs, including fee and commissions expenses.
23
Abu Dhabi
Milan
Dublin AmsterdamLondon
ParisGeneva
Cape Town
Frankfurt
Dubai
Munich
Johannesburg
Rome
ZurichVienna
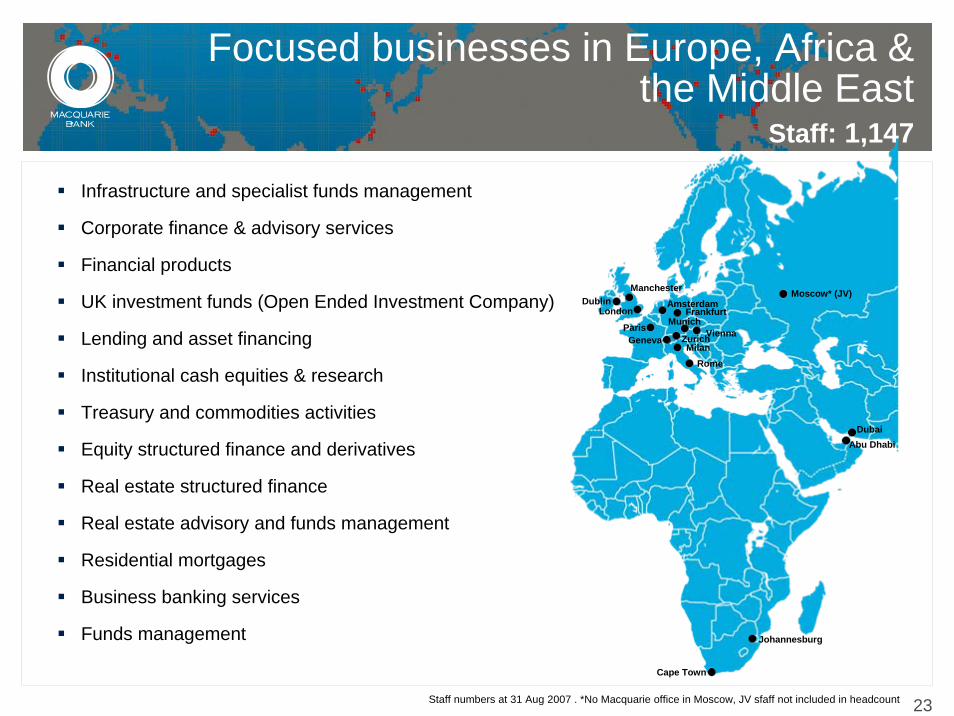
Focused businesses in Europe, Africa & the Middle East
Staff: 1,147
Staff numbers at 31 Aug 2007 . *No Macquarie office in Moscow, JV sfaff not included in headcount
Infrastructure and specialist funds management
Corporate finance & advisory services
Financial products
UK investment funds (Open Ended Investment Company)
Lending and asset financing
Institutional cash equities & research
Treasury and commodities activities
Equity structured finance and derivatives
Real estate structured finance
Real estate advisory and funds management
Residential mortgages
Business banking services
Funds management
Manchester Moscow* (JV)
24
Income* Staff numbers
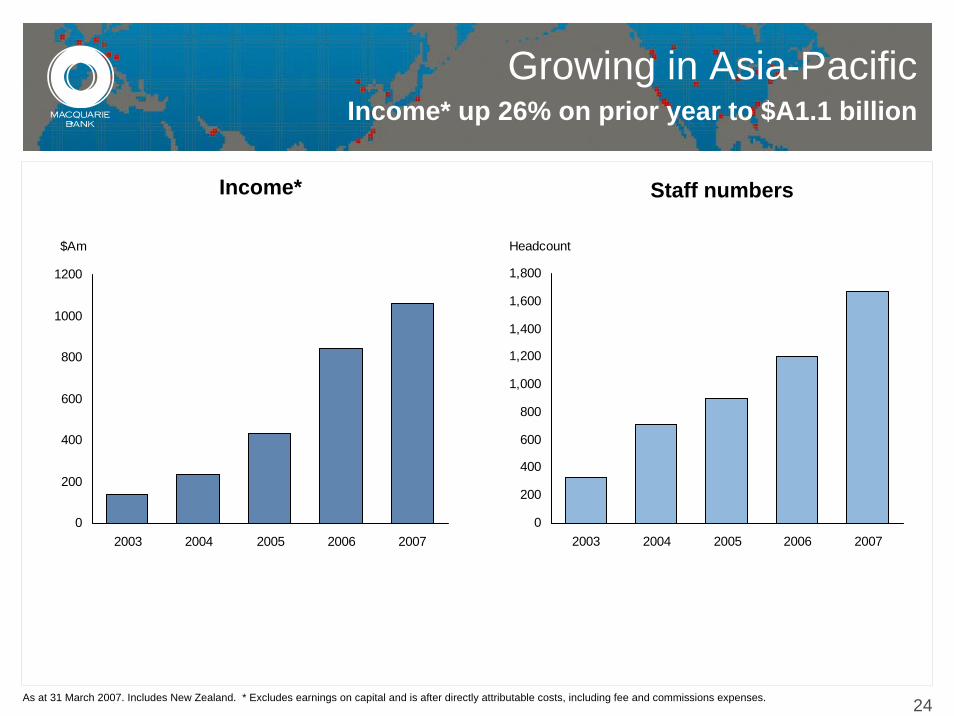
Growing in Asia-PacificIncome* up 26% on prior year to $A1.1 billion
0
200
400
600
800
1000
1200
2003 2004 2005 2006 2007
$Am
0
200
400
600
800
1,000
1,200
1,400
1,600
1,800
2003 2004 2005 2006 2007
Headcount
As at 31 March 2007. Includes New Zealand. * Excludes earnings on capital and is after directly attributable costs, including fee and commissions expenses.
25
Hsinchu
BeijingTianjin Seoul
ShanghaiTokyo
Manila
Hong Kong
Bangkok
LabuanKuala Lumpur
Singapore
Jakarta
Mumbai
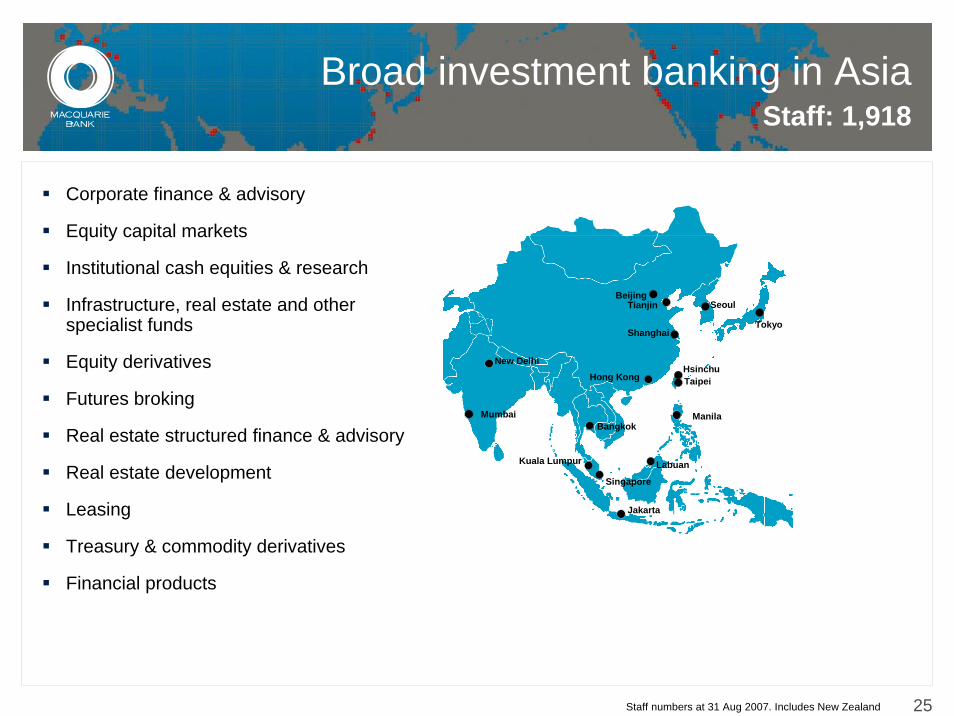
Broad investment banking in AsiaStaff: 1,918
Corporate finance & advisory
Equity capital markets
Institutional cash equities & research
Infrastructure, real estate and other specialist funds
Equity derivatives
Futures broking
Real estate structured finance & advisory
Real estate development
Leasing
Treasury & commodity derivatives
Financial products
Taipei
Staff numbers at 31 Aug 2007. Includes New Zealand
New Delhi
26
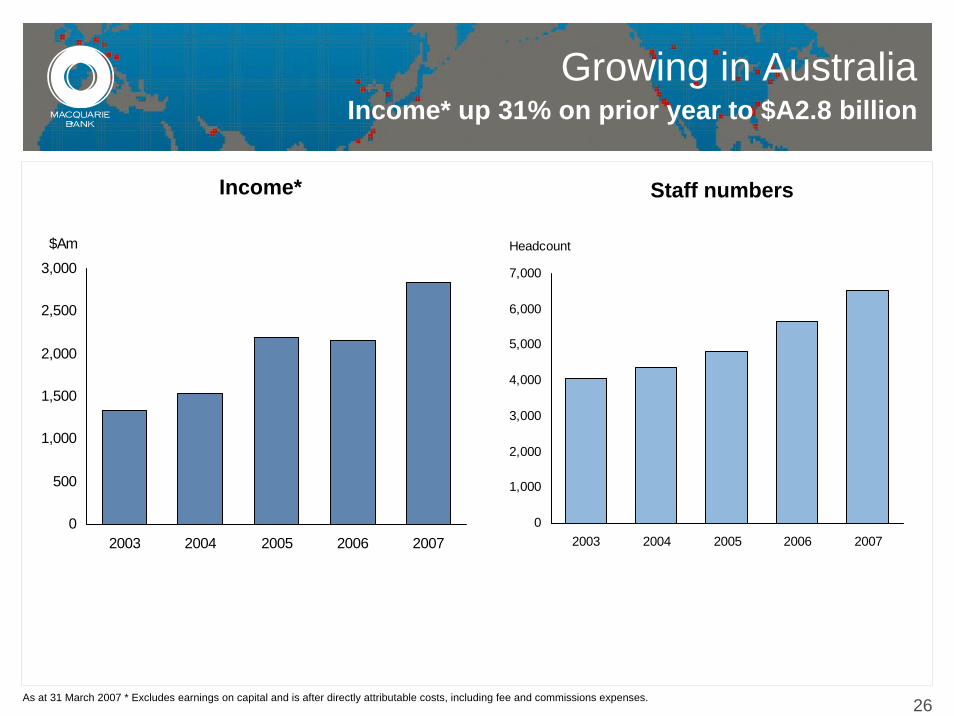
Income* Staff numbers
Growing in Australia Income* up 31% on prior year to $A2.8 billion
0
500
1,000
1,500
2,000
2,500
3,000
2003 2004 2005 2006 2007
$Am
0
1,000
2,000
3,000
4,000
5,000
6,000
7,000
2003 2004 2005 2006 2007
Headcount
As at 31 March 2007 * Excludes earnings on capital and is after directly attributable costs, including fee and commissions expenses.
27
Agenda
Overview
Financial performance
Growing internationally
Proposed restructure
General update and outlook
Appendices
— Earnings drivers
— Analysis by business segment
— Restructure – further detail
28
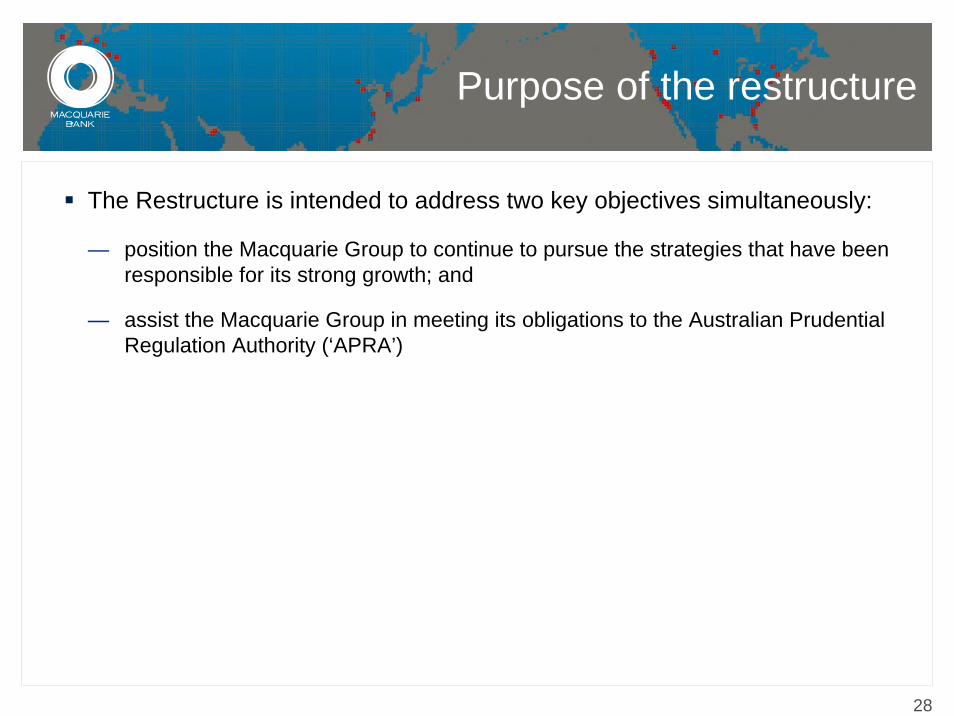
Purpose of the restructure
The Restructure is intended to address two key objectives simultaneously:
— position the Macquarie Group to continue to pursue the strategies that have been responsible for its strong growth; and
— assist the Macquarie Group in meeting its obligations to the Australian Prudential Regulation Authority (‘APRA’)
29
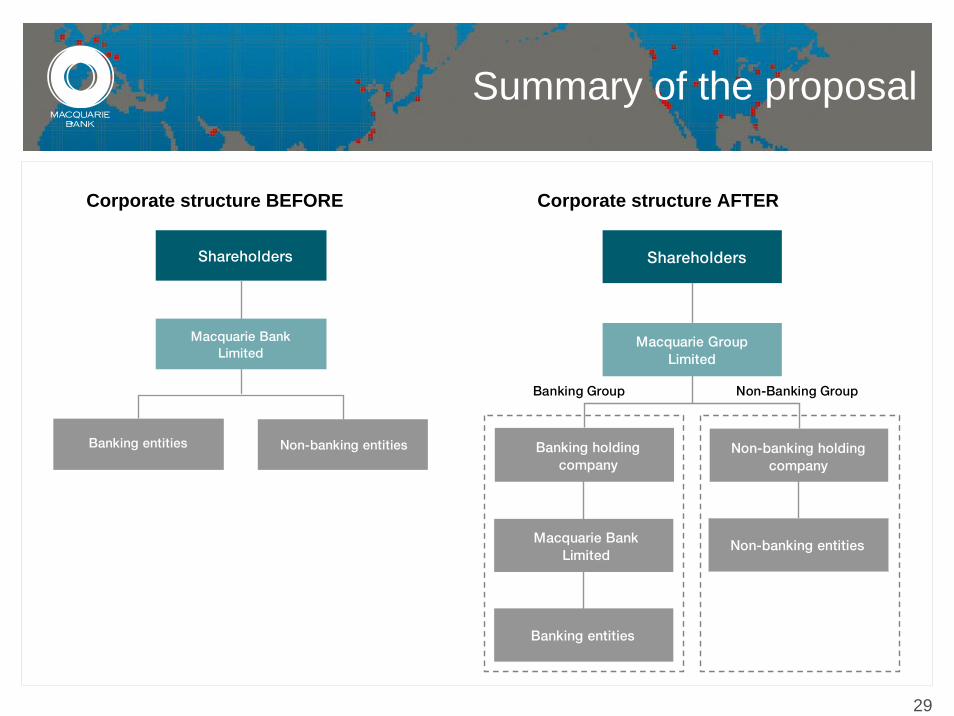
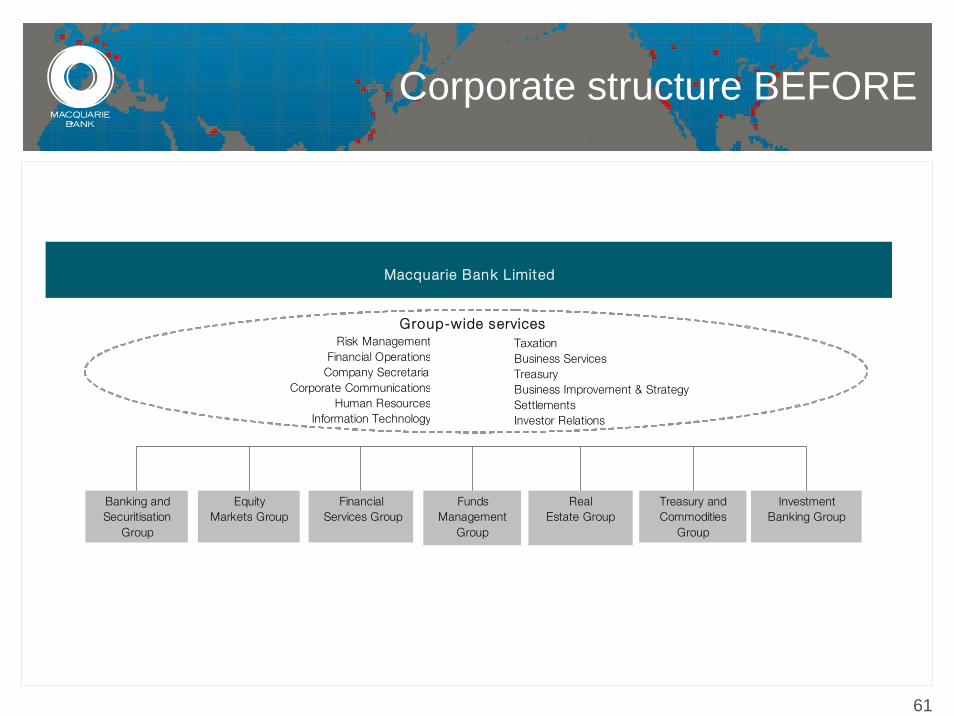
Summary of the proposal
pÜ~êÉÜçäÇÉêë
j~Åèì~êáÉ=_~åâ=iáãáíÉÇ=
_~åâáåÖ=ÉåíáíáÉë kçåJÄ~åâáåÖ=ÉåíáíáÉë
pÜ~êÉÜçäÇÉêë
j~Åèì~êáÉ=dêçìé=iáãáíÉÇ=
_~åâáåÖ=dêçìé kçåJ_~åâáåÖ=dêçìé
_~åâáåÖ=ÜçäÇáåÖ=Åçãé~åó
kçåJÄ~åâáåÖ=ÜçäÇáåÖ=Åçãé~åó=
j~Åèì~êáÉ=_~åâ=iáãáíÉÇ=
_~åâáåÖ=ÉåíáíáÉë
kçåJÄ~åâáåÖ=ÉåíáíáÉë=
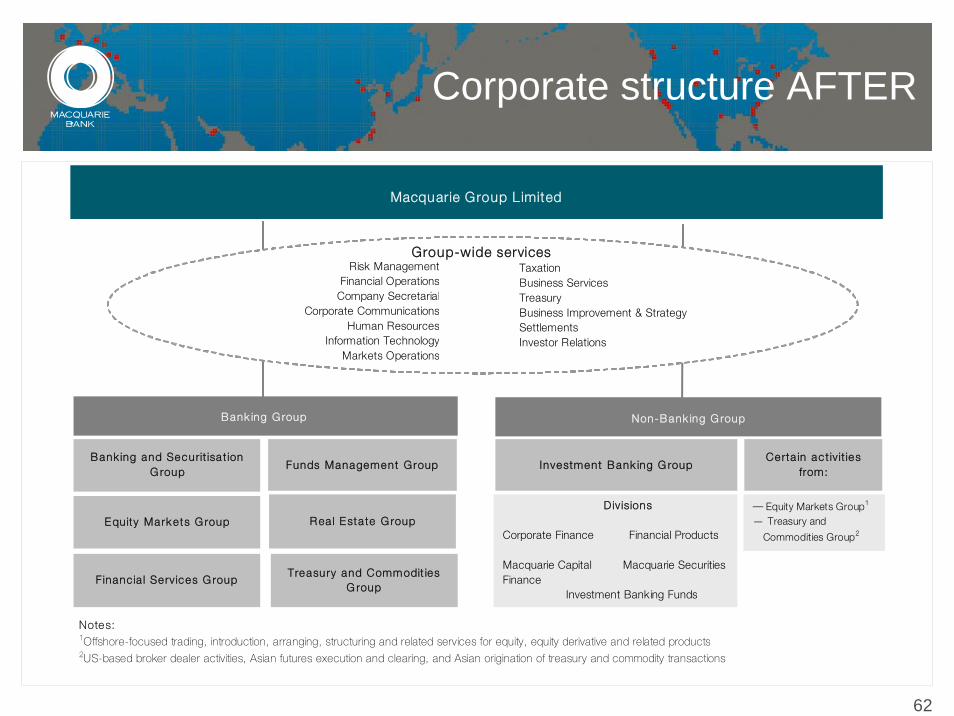
Corporate structure BEFORE Corporate structure AFTER
30
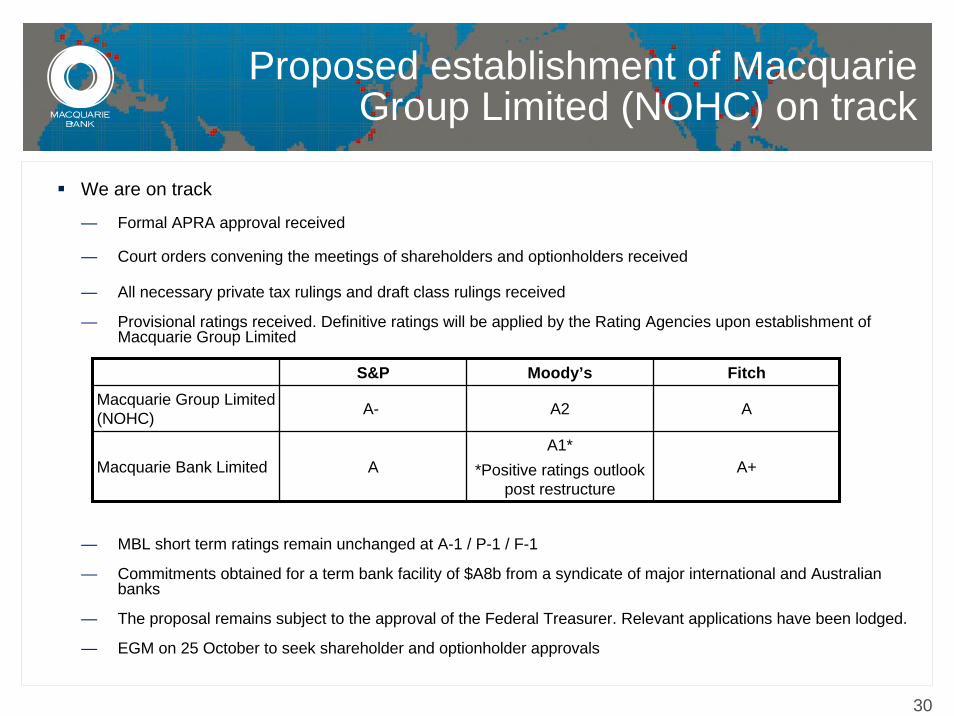
Proposed establishment of Macquarie Group Limited (NOHC) on track
We are on track
— Formal APRA approval received
— Court orders convening the meetings of shareholders and optionholders received
— All necessary private tax rulings and draft class rulings received
— Provisional ratings received. Definitive ratings will be applied by the Rating Agencies upon establishment of Macquarie Group Limited
— MBL short term ratings remain unchanged at A-1 / P-1 / F-1
— Commitments obtained for a term bank facility of $A8b from a syndicate of major international and Australian banks
— The proposal remains subject to the approval of the Federal Treasurer. Relevant applications have been lodged.
— EGM on 25 October to seek shareholder and optionholder approvals
S&P Moody’s FitchMacquarie Group Limited (NOHC) A- A2 A
Macquarie Bank Limited AA1*
*Positive ratings outlook post restructure
A+
31
Proposed establishment of Macquarie Group Limited (NOHC) on track
Macquarie’s strong emphasis on risk management to continue to apply throughout the Group
Macquarie Group Limited will be regulated by APRA as a NOHC
As previously advised:
— No major change to senior management or business strategy
— No significant release of capital anticipated
Further details to be contained in Explanatory Memorandum to be sent to shareholders in late September
32
Agenda
Overview
Financial performance
Growing internationally
Proposed restructure
General update and outlook
Appendices
— Earnings drivers
— Analysis by business segment
— Restructure – further detail
33
Comment on global market conditions
Credit markets
— Significant deterioration in global debt capital markets’ ability to transact and fund structured debt
— Funds managers and other intermediaries are preserving liquidity – sharply reduced appetite for financial intermediary term investments
— Banks are now funding much of what used to be placed in the non-bank sector
— Transaction levels are lower
— Credit spreads have widened and cost of funds has increased
— Credit markets are distinguishing much more between regulated and non-regulated financial intermediaries
— Quality funding transactions are still taking place on satisfactory terms
Equity markets
— High volatility in equity markets globally
— Very high trading volumes in Asia and Australia (retail and institutional)
— Future impact of credit market disruption is uncertain
34
Industry transaction flow
— M&A cautious
— ECM subdued
— Reduced private equity activity
Global real estate
— US residential prices have suffered and volumes have fallen
— Rising spreads affecting mortgage rates generally
— Investor interest remains strong across all non-residential sectors
— Upturn in Australian east coast residential ‘inner ring’
— Significant funds available for appropriate investment
Volatility positive for most global financial markets activities except in debt capital markets where transaction volumes, liquidity and debt book positions have been impacted by broader market turmoil
Australia and Asia much less affected than US or Europe
Continuing competitive environment for staff
Comment on global market conditions
35
Conservatively capitalised and operating very profitably
Conservatively capitalised
— Tier 1 capital ratio at 31 August in excess of 15%
Well funded
All Groups are operating profitably
No unusual provisions or write downs
Businesses are diversified by product and geography
Continuing to grow staff – currently approximately 11,000*
Held For Sale assets on balance sheet: $A628m at 31 August 2007 ($A1,370m at 30 September 2006)
— Expect to realise for greater than book value
Risk-weighted asset growth slower
Expect strategic opportunities in the current environment
* At 31 August 2007
36
No unusual trading exposures
Main business focus is making returns by providing services to clients rather than by principal trading
No material exposures not already known to investors
No problem trading exposures
No material problem credit exposures
No exposure to Structured Investment Vehicles (SIVs)
Only modest holdings of AAA and AA rated CLOs and CDOs ($US300m approx)
No problems with debt underwritings
No underwriting of leveraged loans
Very little underwriting of corporate loans
Only modest credit exposures to the hedge fund industry
37
All Groups operating profitably
Investment Banking Group
— M&A and ECM pipelines reasonable
— Very strong M&A completion in first quarter (to June)
— Australian ECM activity lower than first quarter - partly seasonal
— Solid pipeline in Asia
— Cash equities – excellent volumes in Australia and Asia
— Profitable asset sales in progress
— Continued growth in Investment Banking Funds and assets performing well (See slides 40-41)
Equity Markets Group
— Benefiting from current volatility
— Generally high trading volumes in Australia and Asia
38
All Groups operating profitably
Treasury and Commodities
— Benefiting from current volatility
— Increased volumes across most businesses except Debt Markets
Real Estate Group
— All major businesses continue to perform well
— Some profitable disposals completed
— Continued growth in Real Estate Funds and assets performing well (See slides 40-41)
— Well positioned to capitalise on counter-cyclical opportunities associated with stress in some market sectors
39
All Groups operating profitably
Financial Services Group
— Record retail broking volumes
— Large June quarter inflows into Wrap and Cash Management Trust due to superannuation reforms ($A17b)
— Seasonal outflows post June 30 as expected
— CMT up 26% from $A14.1b (31 Mar 2007) to $A17.7b (31 Aug 2007); Wrap up 13% from 23.2b (31 Mar 2007) to $A26.2b (31 Aug 2007)
Funds Management Group
— Good fund performance relative to benchmarks
— Credit funds performed especially well relative to market
Banking and Securitisation
— Record volumes in margin lending but expecting more subdued growth for remainder of the year
— Launch of credit card business in April 2007
— Deposit volumes well up
— Challenging funding markets for mortgages but high quality assets
40
Continued growth of specialist funds
Asset Performance
— Assets continue to perform well
Refinancings
— Still being achieved on reasonable terms
— Investment Banking Funds: approximately 2% of total asset debt due for refinancing over next 12 months
— Real Estate Funds: approximately 3% of total asset debt due for refinancing over next 12 months
Acquisition Pipeline
— Track record and experience position funds well to pursue opportunities
— Deep expertise in debt markets
— Strong investment discipline
— Significant capital available for investment
41
Continued growth of specialist funds
Capital raised from investors
— $A12.4b total funds raised April to August 2007 (77% international, 77% unlisted)
— $A4.0b for Investment Banking Funds* (72% international, 35% unlisted)
— $A2.8b for Real Estate Funds^ (88% international, 91% unlisted)
— $A5.6b of other specialist funds (including Financial Products)
— Other fund raisings in progress
Significant capital available for investment
— Investment Banking Funds $A9.6b**
— Real Estate Funds approx $A3.7b^
New funds being developed across existing and new markets
As at 31 August 2007. * Capital raised by Macquarie and joint venture fund manager partners, including approx. A$1b of Exchangeable Convertible Bonds (ECBs) issued by MCG. **Listed funds - cash available for investment; unlisted funds-investor commitments less capital invested or committed to investments. For jointly managed funds the amount is representative of Macquarie's share in the JV manager. ^Macquarie and associates
42
Outlook – expect record half year result for the six months ending 30 September 2007
Expect record first half, up approximately 40% on pcp
Expect second quarter to be up on pcp; as in most years, down on very strong first quarter
Investors should exercise caution in drawing inferences from the expected first half result for the full year result especially because of difficulty in predicting market conditions for the remainder of the financial year
Planning for strategic initiatives:
— Group level management and central strategy unit tasked to identify opportunities
— Slower risk-weighted asset growth
— Continuing to hire quality staff especially in areas where we see special opportunities
— Possible boutique acquisitions
Appendix
44
Agenda
Overview
Financial performance
Growing internationally
Proposed restructure
General update and outlook
Appendices
— Earnings drivers
— Analysis by business segment
— Restructure – further detail
45
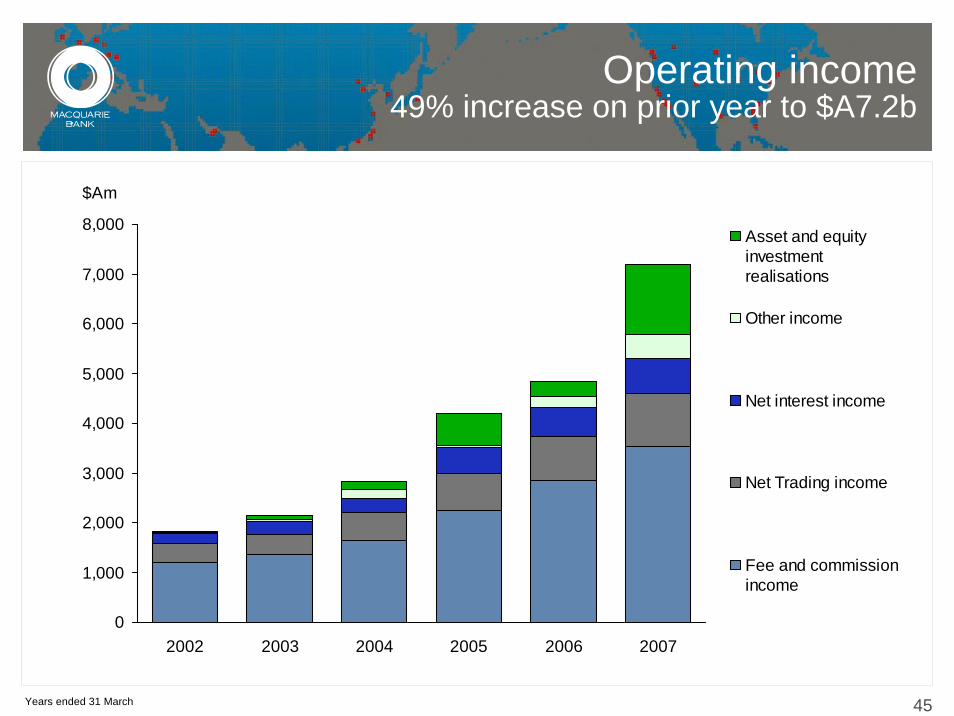
Operating income49% increase on prior year to $A7.2b
0
1,000
2,000
3,000
4,000
5,000
6,000
7,000
8,000
2002 2003 2004 2005 2006 2007
$Am
Asset and equityinvestmentrealisations
Other income
Net interest income
Net Trading income
Fee and commissionincome
Years ended 31 March
46
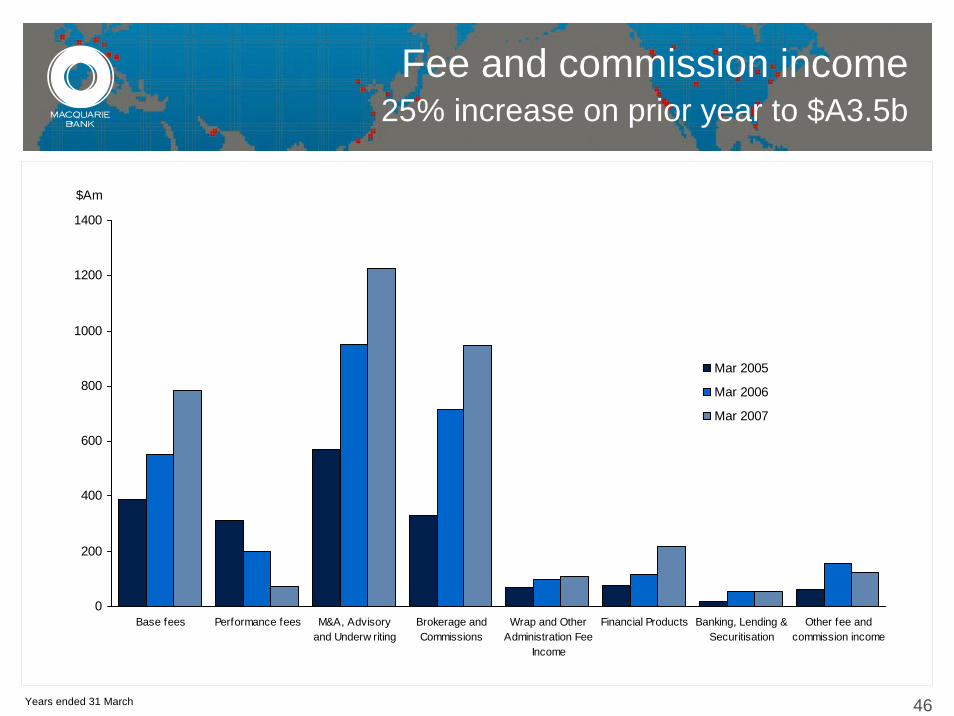
Fee and commission income25% increase on prior year to $A3.5b
0
200
400
600
800
1000
1200
1400
Base fees Performance fees M&A, Advisoryand Underw riting
Brokerage andCommissions
Wrap and OtherAdministration Fee
Income
Financial Products Banking, Lending &Securitisation
Other fee andcommission income
$Am
Mar 2005
Mar 2006
Mar 2007
Years ended 31 March
47
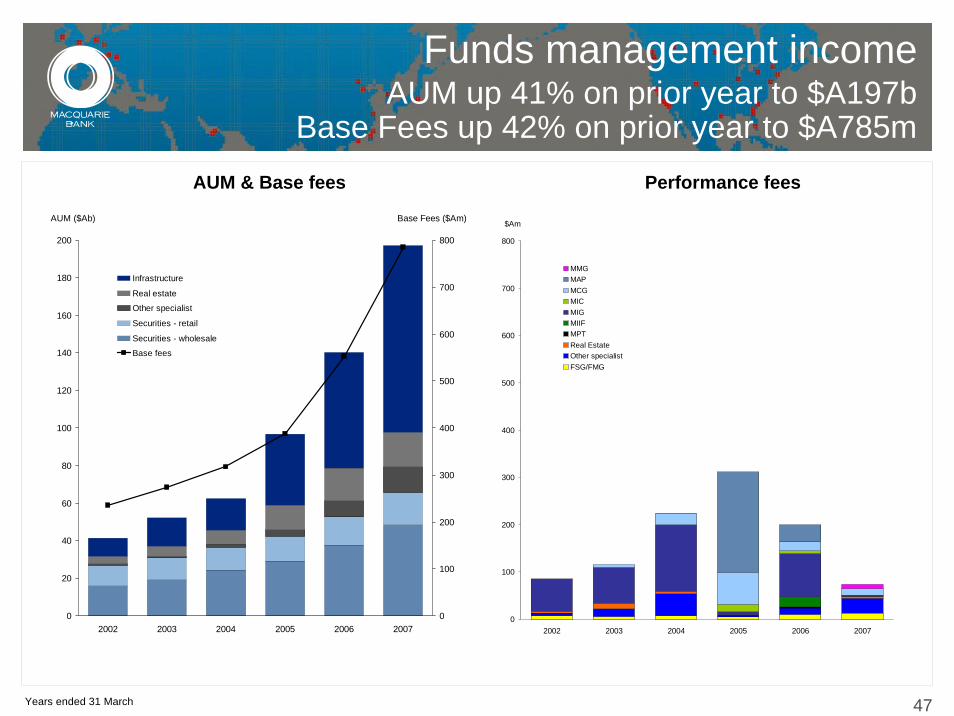
Performance fees
Funds management incomeAUM up 41% on prior year to $A197b
Base Fees up 42% on prior year to $A785m
0
20
40
60
80
100
120
140
160
180
200
2002 2003 2004 2005 2006 2007
AUM ($Ab)
0
100
200
300
400
500
600
700
800
Base Fees ($Am)
Infrastructure
Real estate
Other specialist
Securities - retail
Securities - wholesale
Base fees
AUM & Base fees
Years ended 31 March
0
100
200
300
400
500
600
700
800
2002 2003 2004 2005 2006 2007
$Am
MMGMAPMCGMICMIGMIIFMPTReal EstateOther specialistFSG/FMG
48
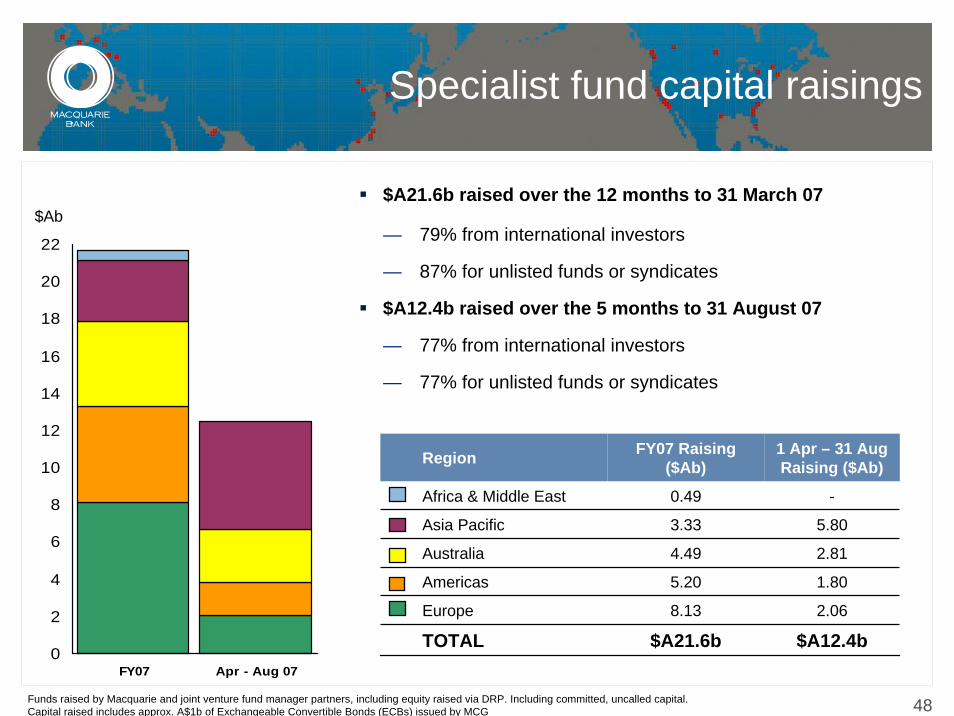
Specialist fund capital raisings
$Ab
0
2
4
6
8
10
12
14
16
18
20
22
FY07 Apr - Aug 07
Region FY07 Raising ($Ab)
Africa & Middle East 0.49
3.33
4.49
5.20
8.13
$A21.6b
-
1 Apr – 31 Aug Raising ($Ab)
Asia Pacific 5.80
Australia 2.81
TOTAL $A12.4b
Americas 1.80
Europe 2.06
Funds raised by Macquarie and joint venture fund manager partners, including equity raised via DRP. Including committed, uncalled capital. Capital raised includes approx. A$1b of Exchangeable Convertible Bonds (ECBs) issued by MCG
$A21.6b raised over the 12 months to 31 March 07
— 79% from international investors
— 87% for unlisted funds or syndicates
$A12.4b raised over the 5 months to 31 August 07
— 77% from international investors
— 77% for unlisted funds or syndicates
49
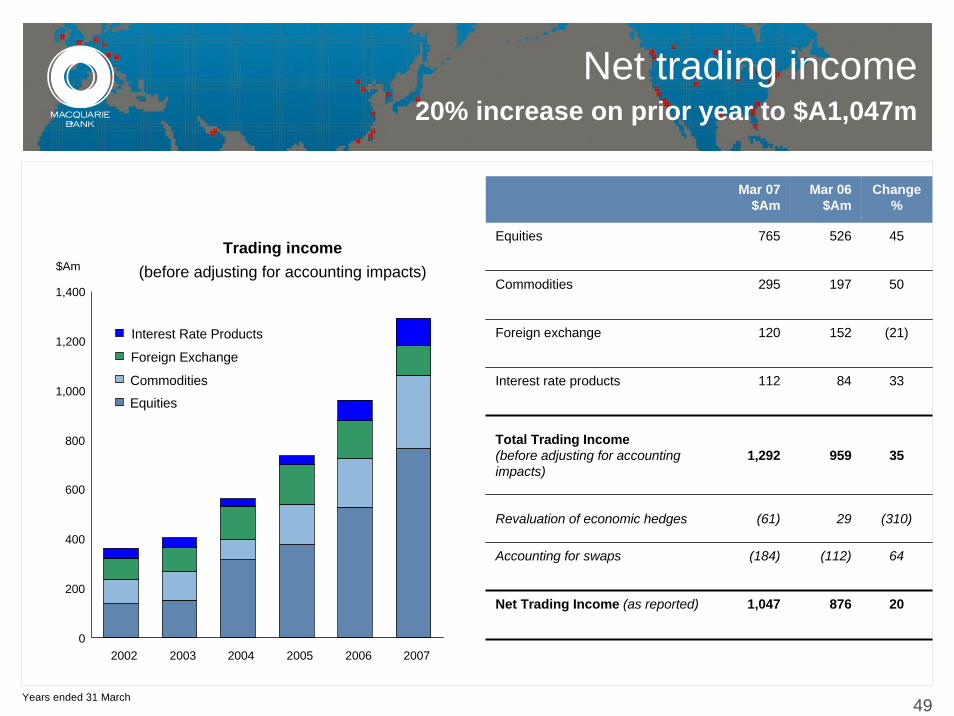
Net trading income20% increase on prior year to $A1,047m
Years ended 31 March
Mar 07 $Am
Mar 06 $Am
Change %
Equities 765
295
120
112
1,292
(61)
(184)
1,047
526 45
Commodities 197 50
Foreign exchange 152 (21)
Interest rate products 84 33
Total Trading Income(before adjusting for accounting impacts)
959 35
Revaluation of economic hedges 29 (310)
Accounting for swaps (112) 64
Net Trading Income (as reported) 876 20
Trading income (before adjusting for accounting impacts)
0
200
400
600
800
1,000
1,200
1,400
2002 2003 2004 2005 2006 2007
$Am
Interest Rate Products
Foreign Exchange
Commodities
Equities
50
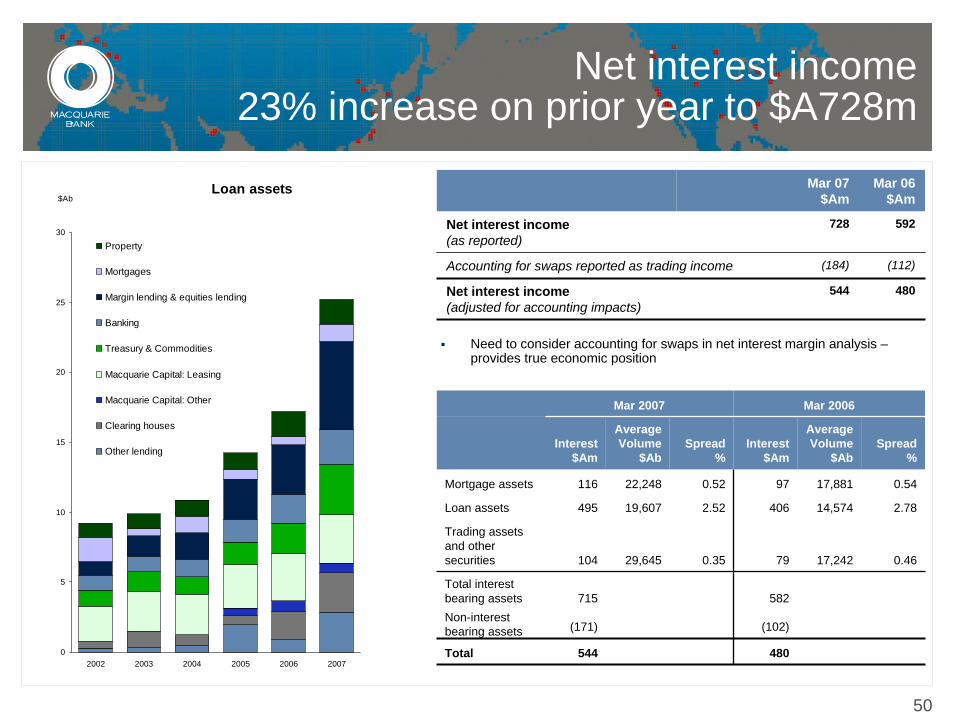
Net interest income23% increase on prior year to $A728m
Loan assets
0
5
10
15
20
25
30
2002 2003 2004 2005 2006 2007
$Ab
Property
Mortgages
Margin lending & equities lending
Banking
Treasury & Commodities
Macquarie Capital: Leasing
Macquarie Capital: Other
Clearing houses
Other lending
Mar 2007 Mar 2006
Loan assets 495 19,607 2.52 406 14,574 2.78
Interest $Am
Average Volume
$AbSpread
%
116 0.52
0.35
Total interest bearing assets 715 582
104
(171)
Interest $Am
Average Volume
$AbSpread
%
Mortgage assets
544
22,248
29,645
97
79
(102)
480
Trading assets and other securities
0.5417,881
Non-interest bearing assets
0.4617,242
Total
544
(184)
728
Mar 07$Am
Accounting for swaps reported as trading income (112)
Mar 06$Am
592Net interest income(as reported)
480Net interest income(adjusted for accounting impacts)
Need to consider accounting for swaps in net interest margin analysis –provides true economic position
51
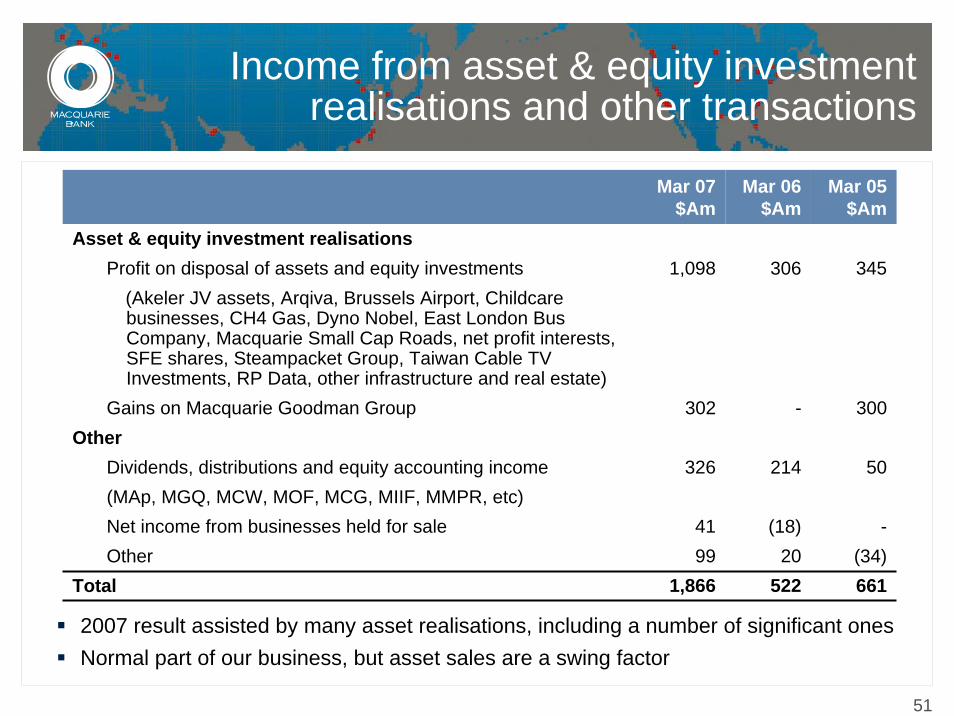
Mar 07 $Am
Mar 06 $Am
306(Akeler JV assets, Arqiva, Brussels Airport, Childcare businesses, CH4 Gas, Dyno Nobel, East London Bus Company, Macquarie Small Cap Roads, net profit interests, SFE shares, Steampacket Group, Taiwan Cable TV Investments, RP Data, other infrastructure and real estate)
Other
Other
Gains on Macquarie Goodman Group 302 - 300
214
(18)20
522
Profit on disposal of assets and equity investments 1,098 345
Net income from businesses held for sale 41 -
Dividends, distributions and equity accounting income 326 50(MAp, MGQ, MCW, MOF, MCG, MIIF, MMPR, etc)
991,866
Mar 05 $Am
(34)Total 661
Asset & equity investment realisations
Income from asset & equity investmentrealisations and other transactions
2007 result assisted by many asset realisations, including a number of significant onesNormal part of our business, but asset sales are a swing factor
52
Agenda
Overview
Financial performance
Growing internationally
Proposed restructure
General update and outlook
Appendices
— Earnings drivers
— Analysis by business segment
— Restructure – further detail
53
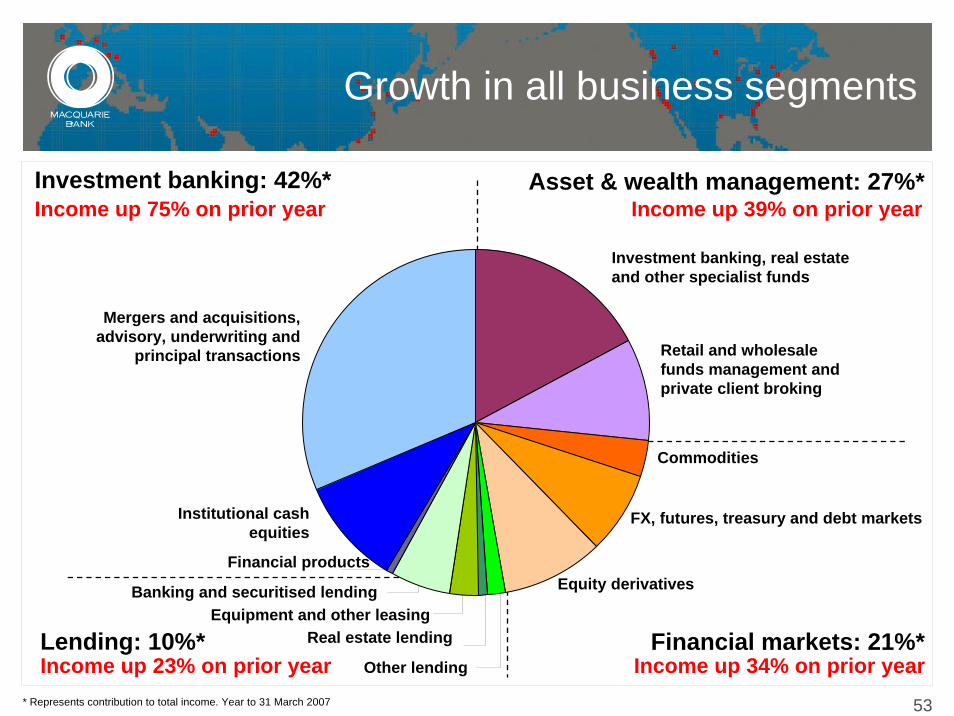
Growth in all business segments
Asset & wealth management: 27%*Investment banking: 42%*Income up 75% on prior year Income up 39% on prior year
Financial markets: 21%*Income up 34% on prior year
Lending: 10%*Income up 23% on prior year
Commodities
FX, futures, treasury and debt markets
Mergers and acquisitions, advisory, underwriting and
principal transactions
Financial products
Equipment and other leasing
Other lending
Investment banking, real estate and other specialist funds
Equity derivatives
Institutional cash equities
Banking and securitised lending
Retail and wholesale funds management and private client broking
Real estate lending
* Represents contribution to total income. Year to 31 March 2007
54
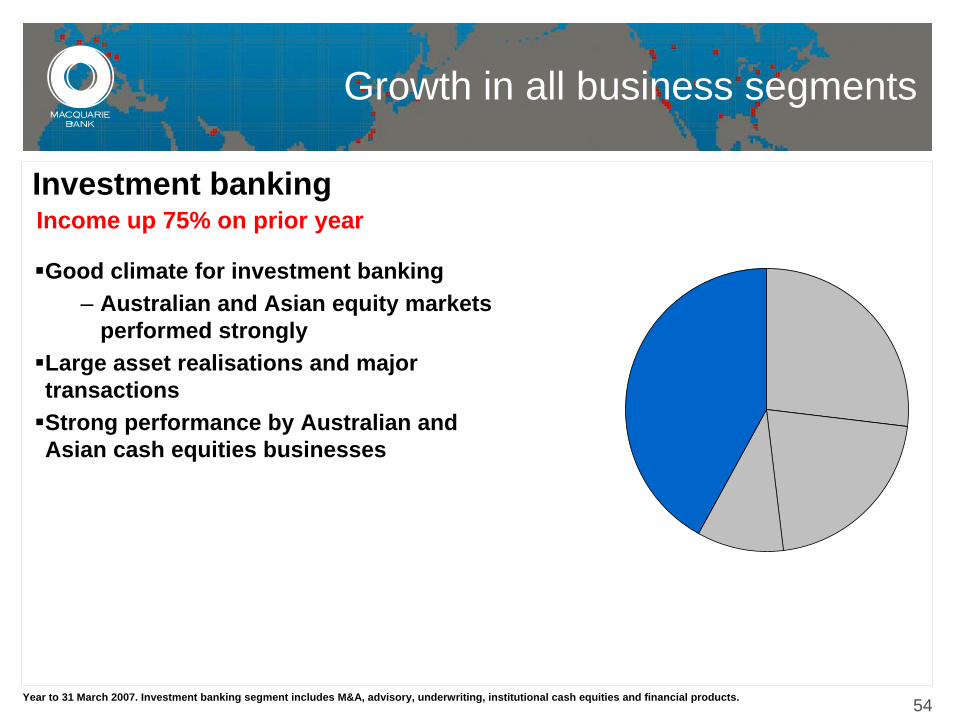
Good climate for investment banking‒ Australian and Asian equity markets
performed stronglyLarge asset realisations and major transactionsStrong performance by Australian and Asian cash equities businesses
Investment bankingIncome up 75% on prior year
Year to 31 March 2007. Investment banking segment includes M&A, advisory, underwriting, institutional cash equities and financial products.
Growth in all business segments
55
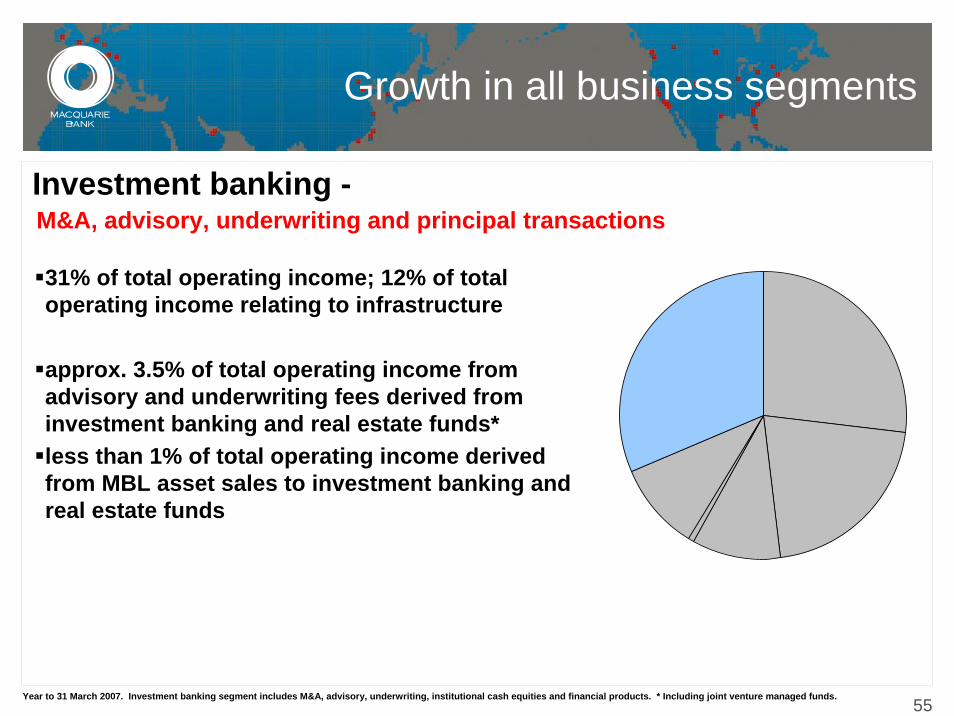
31% of total operating income; 12% of total operating income relating to infrastructure
approx. 3.5% of total operating income from advisory and underwriting fees derived from investment banking and real estate funds* less than 1% of total operating income derived from MBL asset sales to investment banking and real estate funds
Year to 31 March 2007. Investment banking segment includes M&A, advisory, underwriting, institutional cash equities and financial products. * Including joint venture managed funds.
Investment banking -M&A, advisory, underwriting and principal transactions
Growth in all business segments
56
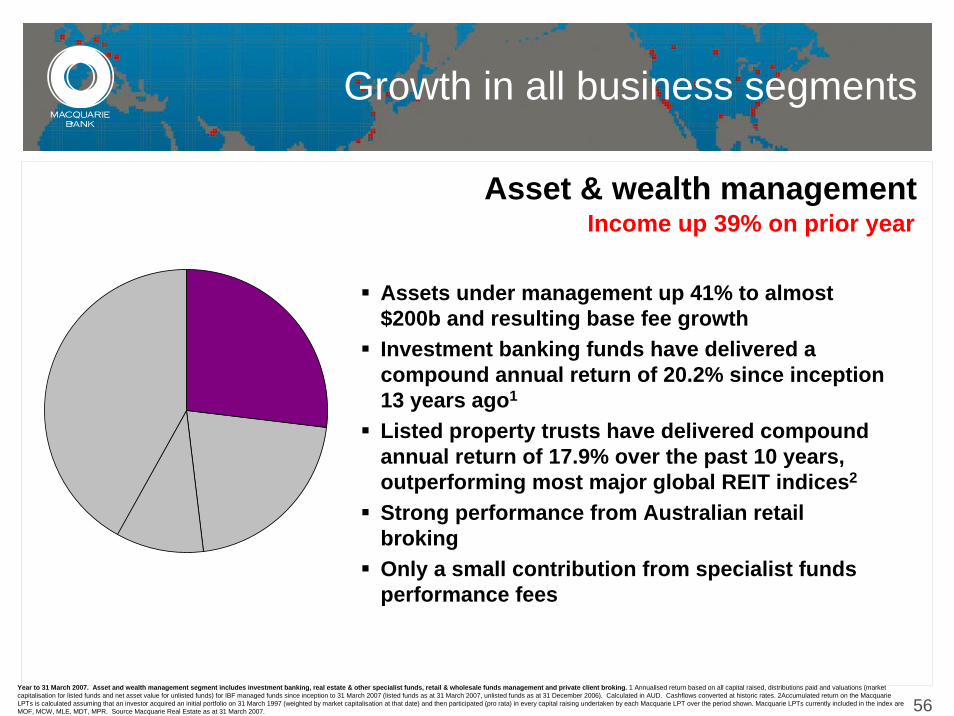
Asset & wealth managementIncome up 39% on prior year
Year to 31 March 2007. Asset and wealth management segment includes investment banking, real estate & other specialist funds, retail & wholesale funds management and private client broking. 1 Annualised return based on all capital raised, distributions paid and valuations (market capitalisation for listed funds and net asset value for unlisted funds) for IBF managed funds since inception to 31 March 2007 (listed funds as at 31 March 2007, unlisted funds as at 31 December 2006). Calculated in AUD. Cashflows converted at historic rates. 2Accumulated return on the Macquarie LPTs is calculated assuming that an investor acquired an initial portfolio on 31 March 1997 (weighted by market capitalisation at that date) and then participated (pro rata) in every capital raising undertaken by each Macquarie LPT over the period shown. Macquarie LPTs currently included in the index are MOF, MCW, MLE, MDT, MPR. Source Macquarie Real Estate as at 31 March 2007.
Growth in all business segments
Assets under management up 41% to almost $200b and resulting base fee growthInvestment banking funds have delivered a compound annual return of 20.2% since inception 13 years ago1
Listed property trusts have delivered compound annual return of 17.9% over the past 10 years, outperforming most major global REIT indices2
Strong performance from Australian retail brokingOnly a small contribution from specialist funds performance fees
57
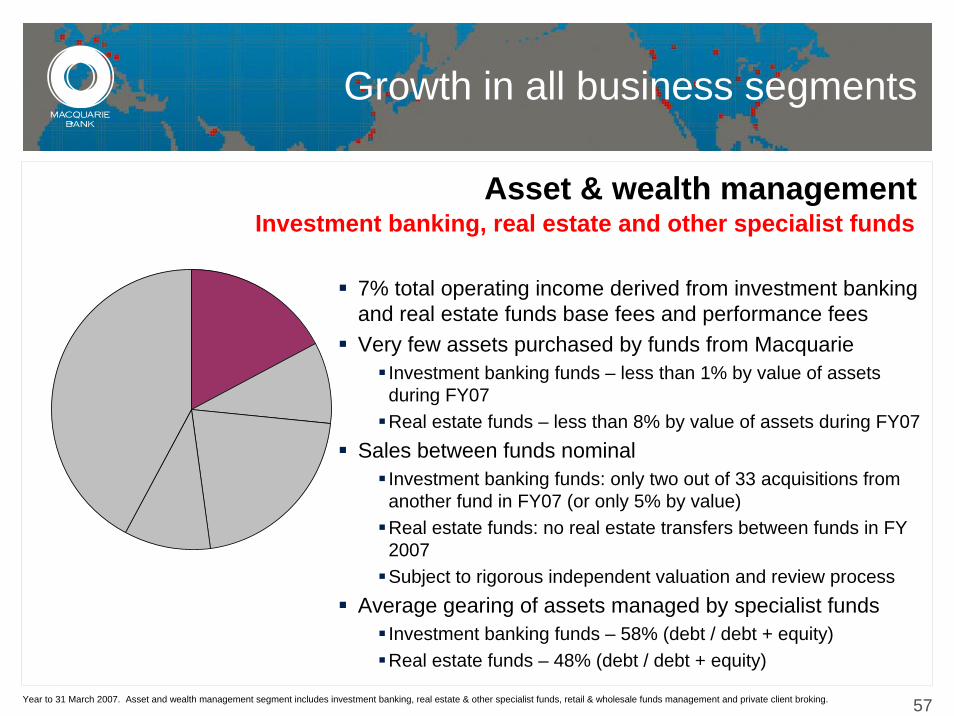
Asset & wealth managementInvestment banking, real estate and other specialist funds
7% total operating income derived from investment banking and real estate funds base fees and performance feesVery few assets purchased by funds from Macquarie
Investment banking funds – less than 1% by value of assets during FY07Real estate funds – less than 8% by value of assets during FY07
Sales between funds nominalInvestment banking funds: only two out of 33 acquisitions from another fund in FY07 (or only 5% by value)Real estate funds: no real estate transfers between funds in FY 2007Subject to rigorous independent valuation and review process
Average gearing of assets managed by specialist fundsInvestment banking funds – 58% (debt / debt + equity)Real estate funds – 48% (debt / debt + equity)
Year to 31 March 2007. Asset and wealth management segment includes investment banking, real estate & other specialist funds, retail & wholesale funds management and private client broking.
Growth in all business segments
58
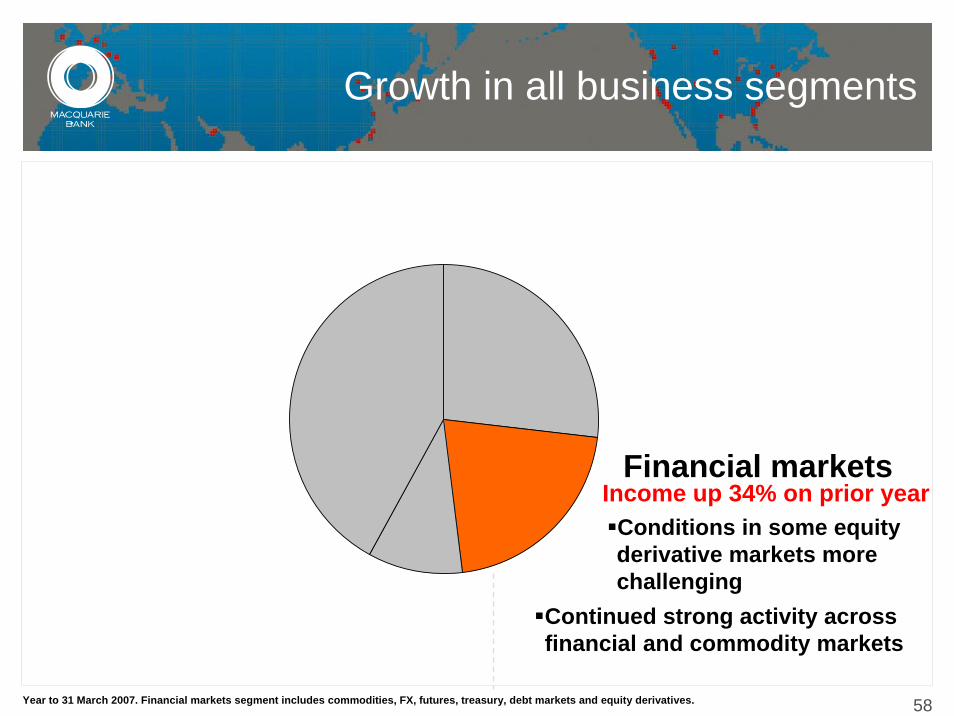
Financial marketsIncome up 34% on prior year
Continued strong activity across financial and commodity markets
Year to 31 March 2007. Financial markets segment includes commodities, FX, futures, treasury, debt markets and equity derivatives.
Growth in all business segments
Conditions in some equity derivative markets more challenging
59
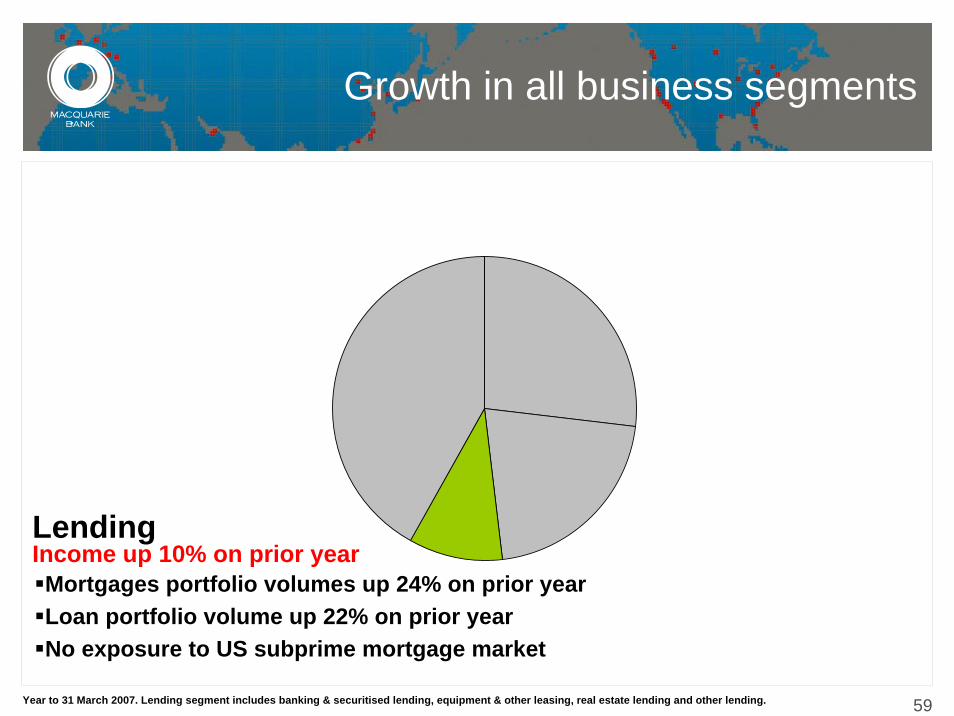
Mortgages portfolio volumes up 24% on prior yearLoan portfolio volume up 22% on prior yearNo exposure to US subprime mortgage market
Year to 31 March 2007. Lending segment includes banking & securitised lending, equipment & other leasing, real estate lending and other lending.
Growth in all business segments
LendingIncome up 10% on prior year
60
Agenda
Overview
Financial performance
Growing internationally
Proposed restructure
General update and outlook
Appendices
— Earnings drivers
— Analysis by business segment
— Restructure – further detail
61
Corporate structure BEFORE
j~Åèì~êáÉ=_~åâ=iáãáíÉÇ
oáëâ=j~å~ÖÉãÉåícáå~åÅá~ä=léÉê~íáçåë`çãé~åó=pÉÅêÉí~êá~ä
`çêéçê~íÉ=`çããìåáÅ~íáçåëeìã~å=oÉëçìêÅÉë
fåÑçêã~íáçå=qÉÅÜåçäçÖó
q~ñ~íáçå_ìëáåÉëë=pÉêîáÅÉëqêÉ~ëìêó_ìëáåÉëë=fãéêçîÉãÉåí=C=píê~íÉÖópÉííäÉãÉåíëfåîÉëíçê=oÉä~íáçåë
_~åâáåÖ=~åÇ=pÉÅìêáíáë~íáçå=
dêçìé
bèìáíó=j~êâÉíë=dêçìé
cìåÇë=j~å~ÖÉãÉåí=
dêçìé
oÉ~ä=bëí~íÉ=dêçìé
qêÉ~ëìêó=~åÇ=`çããçÇáíáÉë=
dêçìé
cáå~åÅá~ä=pÉêîáÅÉë=dêçìé
fåîÉëíãÉåí=_~åâáåÖ=dêçìé
dêçìéJïáÇÉ=ëÉêîáÅÉë
62
Corporate structure AFTER
kçíÉëWNlÑÑëÜçêÉJÑçÅìëÉÇ=íê~ÇáåÖI=áåíêçÇìÅíáçåI=~êê~åÖáåÖI=ëíêìÅíìêáåÖ=~åÇ=êÉä~íÉÇ=ëÉêîáÅÉë=Ñçê=ÉèìáíóI=Éèìáíó=ÇÉêáî~íáîÉ=~åÇ=êÉä~íÉÇ=éêçÇìÅíëOrpJÄ~ëÉÇ=ÄêçâÉê=ÇÉ~äÉê=~ÅíáîáíáÉëI=^ëá~å=ÑìíìêÉë=ÉñÉÅìíáçå=~åÇ=ÅäÉ~êáåÖI=~åÇ=^ëá~å=çêáÖáå~íáçå=çÑ=íêÉ~ëìêó=~åÇ=ÅçããçÇáíó=íê~åë~Åíáçåë
j~Åèì~êáÉ=dêçìé=iáãáíÉÇ
oáëâ=j~å~ÖÉãÉåícáå~åÅá~ä=léÉê~íáçåë`çãé~åó=pÉÅêÉí~êá~ä
`çêéçê~íÉ=`çããìåáÅ~íáçåëeìã~å=oÉëçìêÅÉë
fåÑçêã~íáçå=qÉÅÜåçäçÖój~êâÉíë=léÉê~íáçåë
q~ñ~íáçå_ìëáåÉëë=pÉêîáÅÉëqêÉ~ëìêó_ìëáåÉëë=fãéêçîÉãÉåí=C=píê~íÉÖópÉííäÉãÉåíëfåîÉëíçê=oÉä~íáçåë
kçåJ_~åâ áåÖ=dêçìé_~åâ áåÖ=dêçìé
= = = = = = = = = = = = = = = = = = = = = = =aáîáëáçåë
`çêéçê~íÉ=cáå~åÅÉ==========cáå~åÅá~ä=mêçÇìÅíë
j~Åèì~êáÉ=`~éáí~ä=========j~Åèì~êáÉ=pÉÅìêáíáÉë=cáå~åÅÉ==================fåîÉëíãÉåí=_~åâáåÖ=cìåÇë
_~åâáåÖ=~åÇ=pÉÅìêáí áë~í áçå=dêçìé
bèìáíó=j~êâÉíë=dêçìé
cáå~åÅá~ ä=pÉêîáÅÉë=dêçìé
cìåÇë=j~å~ÖÉãÉåí=dêçìé
oÉ~ä=bëí~íÉ=dêçìé
qêÉ~ëìêó=~åÇ=`çããçÇáí áÉë=dêçìé
fåîÉëíãÉåí =_~åâ áåÖ=dêçìé`Éêí~ áå=~Åíáîáí áÉë=
ÑêçãW
—=bèìáíó=j~êâÉíë=dêçìéN
Ô=qêÉ~ëìêó=~åÇ======`çããçÇáíáÉë=dêçìéO
dêçìéJïáÇÉ=ëÉêîáÅÉë
63
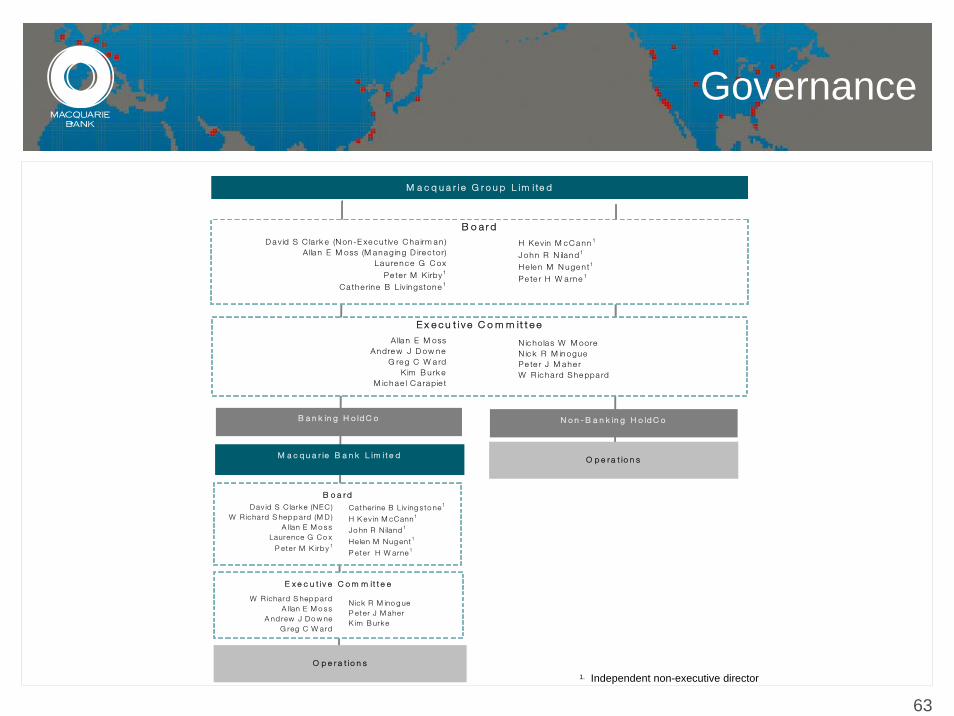
Governance
S h a re d S e r v i c e s(2 878 sta ff )
E x e c u t i v e C o m m i t t e e
B o a r dD a v id S C la rk e (N on-E xe c u tive C ha irm a n )
A lla n E M oss (M a na g ing D ire c tor)La u re nc e G C ox
Pe te r M K irby1
C a th e rine B L iv ingstone 1
A lla n E M ossAndre w J D ow ne
G re g C W a rdK im B u rk e
M ic h a e l C a ra pie t
H Ke v in M c C a nn 1
J ohn R N ila nd1
H e le n M N uge n t1
Pe te r H W a rne 1
N ic ho la s W M ooreN ic k R M in oguePe te r J M a he rW R ic ha rd She ppa rd
E x e c u t iv e C o m m it t e e
N o n - B a n k in g H o ld C oB a n k in g H o ld C o
O p e r a t io n s
O p e r a t io n sM a c q u a r ie B a n k L im i t e d
B o a r d D av id S C larke (NEC )
W R ichard S hep p ard (M D )A llan E M o s s
Laurence G Co x
P eter M K irb y 1
W R ichard S hep p ardA llan E M o s s
A nd rew J D o w neG reg C W ard
Cather ine B Liv ing s to ne1
H K ev in M cCann1
Jo hn R N iland 1
He len M Nug ent1
P eter H W arne 1
N ick R M ino g ueP eter J M aherK im B urk e
M a c q u a r i e G r o u p L im i te d
1. Independent non-executive director
64
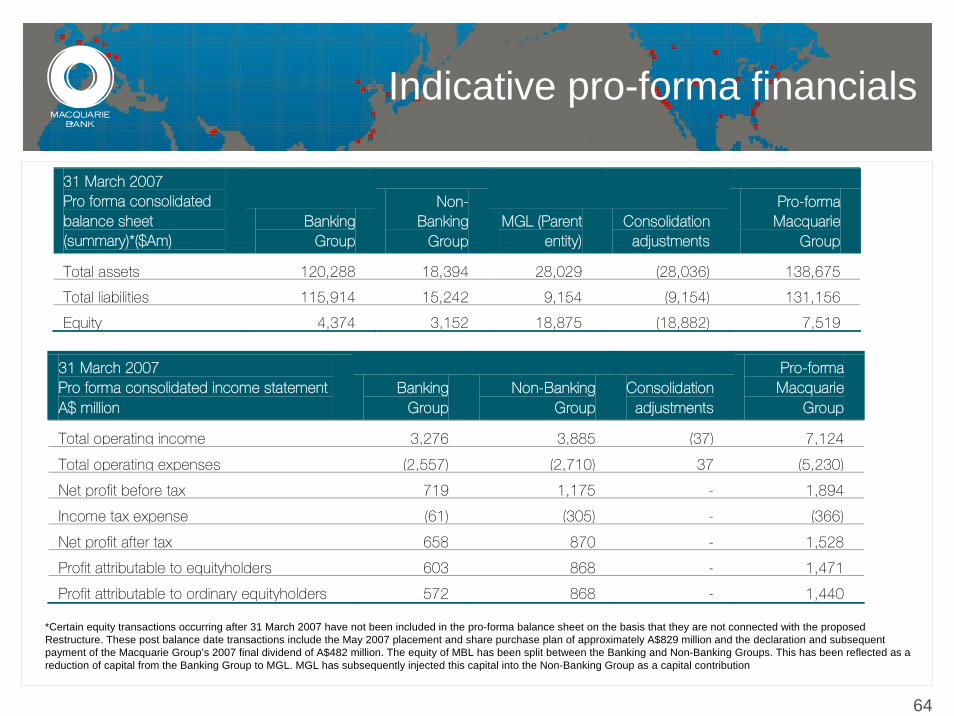
Indicative pro-forma financials
31 March 2007 Pro forma consolidated balance sheet (summary)*($Am)
Banking Group
Non-Banking
Group MGL (Parent
entity) Consolidation
adjustments
Pro-forma Macquarie
Group
Total assets 120,288 18,394 28,029 (28,036) 138,675
Total liabilities 115,914 15,242 9,154 (9,154) 131,156
Equity 4,374 3,152 18,875 (18,882) 7,519
31 March 2007 Pro forma consolidated income statement A$ million
Banking Group
Non-Banking Group
Consolidation adjustments
Pro-forma Macquarie
Group
Total operating income 3,276 3,885 (37) 7,124
Total operating expenses (2,557) (2,710) 37 (5,230)
Net profit before tax 719 1,175 - 1,894
Income tax expense (61) (305) - (366)
Net profit after tax 658 870 - 1,528
Profit attributable to equityholders 603 868 - 1,471
Profit attributable to ordinary equityholders 572 868 - 1,440
*Certain equity transactions occurring after 31 March 2007 have not been included in the pro-forma balance sheet on the basis that they are not connected with the proposed Restructure. These post balance date transactions include the May 2007 placement and share purchase plan of approximately A$829 million and the declaration and subsequent payment of the Macquarie Group’s 2007 final dividend of A$482 million. The equity of MBL has been split between the Banking and Non-Banking Groups. This has been reflected as a reduction of capital from the Banking Group to MGL. MGL has subsequently injected this capital into the Non-Banking Group as a capital contribution
65
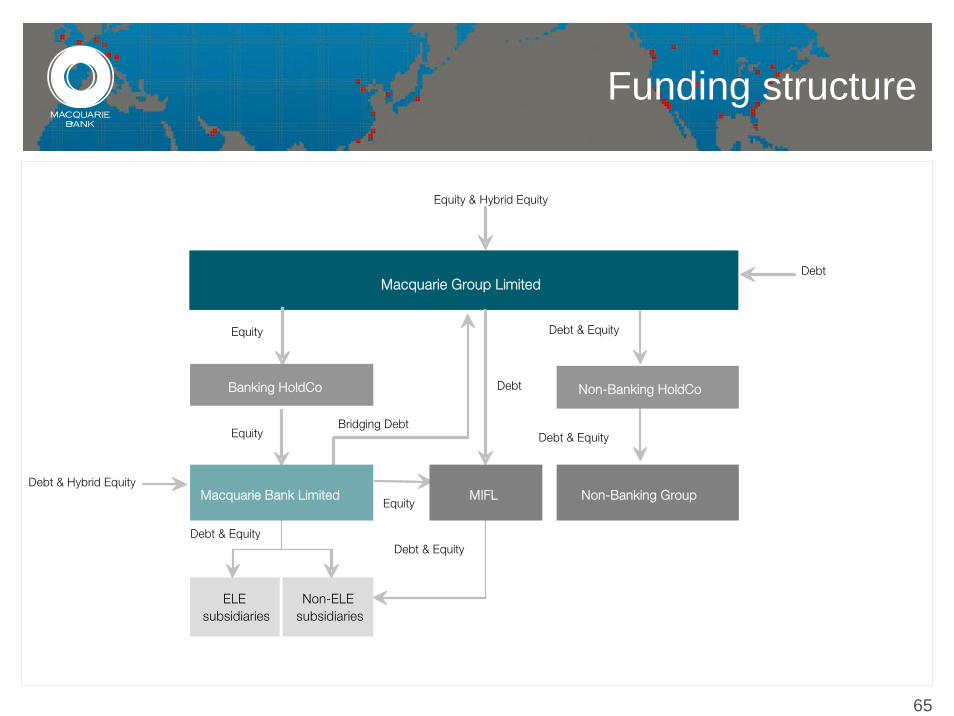
Funding structure
aÉÄí
bèìáíó
bèìáíó=C=eóÄêáÇ=bèìáíó
j~Åèì~êáÉ=dêçìé=iáãáíÉÇ
aÉÄí
aÉÄí=C=bèìáíó
aÉÄí=C=bèìáíó
_~åâáåÖ=eçäÇ`ç kçåJ_~åâáåÖ=eçäÇ`ç
aÉÄí=C=bèìáíó
aÉÄí=C=eóÄêáÇ=bèìáíó
bèìáíó
bibëìÄëáÇá~êáÉë
kçåJbibëìÄëáÇá~êáÉë
kçåJ_~åâáåÖ=dêçìé
aÉÄí=C=bèìáíó
j~Åèì~êáÉ=_~åâ=iáãáíÉÇ jfci
bèìáíó_êáÇÖáåÖ=aÉÄí