Embed Size (px)
Citation preview
Wesfarmers Limited, 11th Floor, “Wesfarmers House”, 40 The Esplanade, Perth, Western Australia, 6000 GPO Box M978, Perth, Western Australia 6843. Telephone: (08) 9327 4211. Facsimile: (08) 9327 4216
www.wesfarmers.com.au
8 March 2010 The Manager Company Announcements Office Australian Securities Exchange Dear Sir, CITIGROUP AND GOLDMAN SACHS JBWERE INVESTMENT CONFERENCES LONDON, 8 – 9 MARCH 2010 AND NEW YORK, 11 – 12 MARCH 2010 Following is a presentation that is to be given at the Citigroup investment conference in London, together with a discussion pack containing supplementary information that will be distributed at the conferences in London and New York. Yours faithfully, L J KENYON COMPANY SECRETARY Encs.

Investment ConferencePhil h P f d Di tiPhilosophy, Performance and Direction
Citigroup, London – 8 & 9 MarchGoldman Sachs JBWere, New York – 11 & 12 March
March 2010

DisclaimerThis presentation has been prepared by Wesfarmers Limited. The information contained in this presentation is for information purposes only and does not constitute an offer to issue or arrange to issue, securities or other financial products, nor is it intended to constitute legal, tax or accounting advice or opinion. The information contained in this presentation is not investment orfinancial product advice and is not intended to be used as the basis for making an investment decision This presentation hasfinancial product advice and is not intended to be used as the basis for making an investment decision. This presentation hasbeen prepared without taking into account the investment objectives, financial situation or particular needs of any particular person.
No representation or warranty, express or implied, is made as to the fairness, accuracy, completeness or correctness of the information opinions and conclusions contained in this presentation To the maximum extent permitted by law none ofinformation, opinions and conclusions contained in this presentation. To the maximum extent permitted by law, none of Wesfarmers Limited, its directors, officers, employees or agents, nor any other person accepts any liability, including, withoutlimitation, any liability arising out of fault or negligence, for any loss arising from the use of the information contained in this presentation. In particular, no representation or warranty, express or implied, is given as to the accuracy, completeness, likelihood of achievement or reasonableness of any forecasts, prospects or returns contained in this presentation and Wesfarmers Limitedof achievement or reasonableness of any forecasts, prospects or returns contained in this presentation and Wesfarmers Limiteddisclaims any liability for any omissions or mistakes in the aforementioned information. Such forecasts, prospects or returns are by their nature subject to significant uncertainties and contingencies, many of which will be outside the control of Wesfarmers Limited.
Before making an investment decision you should conduct your own due diligence and consult with your own legal tax orBefore making an investment decision, you should conduct your own due diligence and consult with your own legal, tax or accounting adviser as to the accuracy and application of the information set forth herein. You should also obtain and rely onprofessional advice from your own tax, legal, accounting and other professional advisers in respect of your particular investment needs, objectives and financial circumstances. Past performance is no guarantee of future performance.
This presentation is not an offer of securities for sale in the United States or any other jurisdiction in which an offer may not beThis presentation is not an offer of securities for sale in the United States or any other jurisdiction in which an offer may not be made under applicable laws. Securities may not be offered or sold in the United States unless the securities have been registered under the U.S. Securities Act of 1933 (“Securities Act”) or an exemption from registration is available.
The financial information contained in this presentation includes non-GAAP financial measures. For a reconciliation of these measures to the most comparable GAAP measure please refer to half and full year financial statements filed with the Australian
2
measures to the most comparable GAAP measure, please refer to half and full year financial statements filed with the Australian Securities Exchange.

Philosophy Based On A Single FocusPhilosophy Based On A Single Focus
Satisfactory Returns To Shareholders Satisfactory Returns To Shareholders
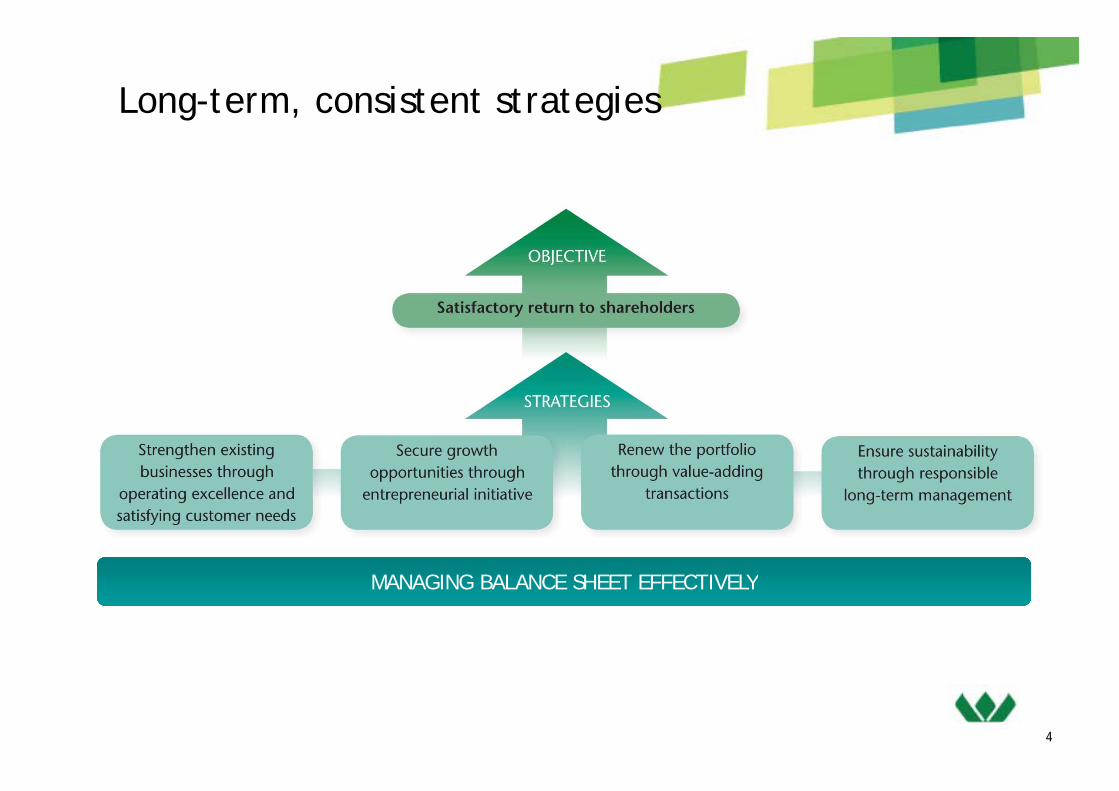
Long-term, consistent strategies
MANAGING BALANCE SHEET EFFECTIVELYMANAGING BALANCE SHEET EFFECTIVELY
4

The Wesfarmers Way…
Portfolio of High Performing Quality AssetsValue creating business model
AutonomyAutonomy
Value creating business model
AutonomyAutonomyStand alone businesses
High calibre leadership teams with operational controlLean corporate office
O t t di g P l A t bilit R ti S t D li i R ltOutstanding People
• Incentives aligned to generate shareholder value
R t i & it lit
Accountability
• Delegation of decision making authority
A t bilit f
Reporting Systems
• Divisional Boards
• Established integrated
Delivering Results
• Set targets & monitor performance
I R t• Retain & recruit quality people
• Cultural values: Integrity, Openness, Accountability &
• Accountability for performance
• Accountability for corporate reputation
management systems
• Argenti process
• Project evaluation h d l
• Improve Returns
• Invest for Growth
5
Openness, Accountability & Boldness
corporate reputationmethodology
5

Portfolio of leading brands
Retail Businesses Industrial Businesses
Ins ranceInsurance
6
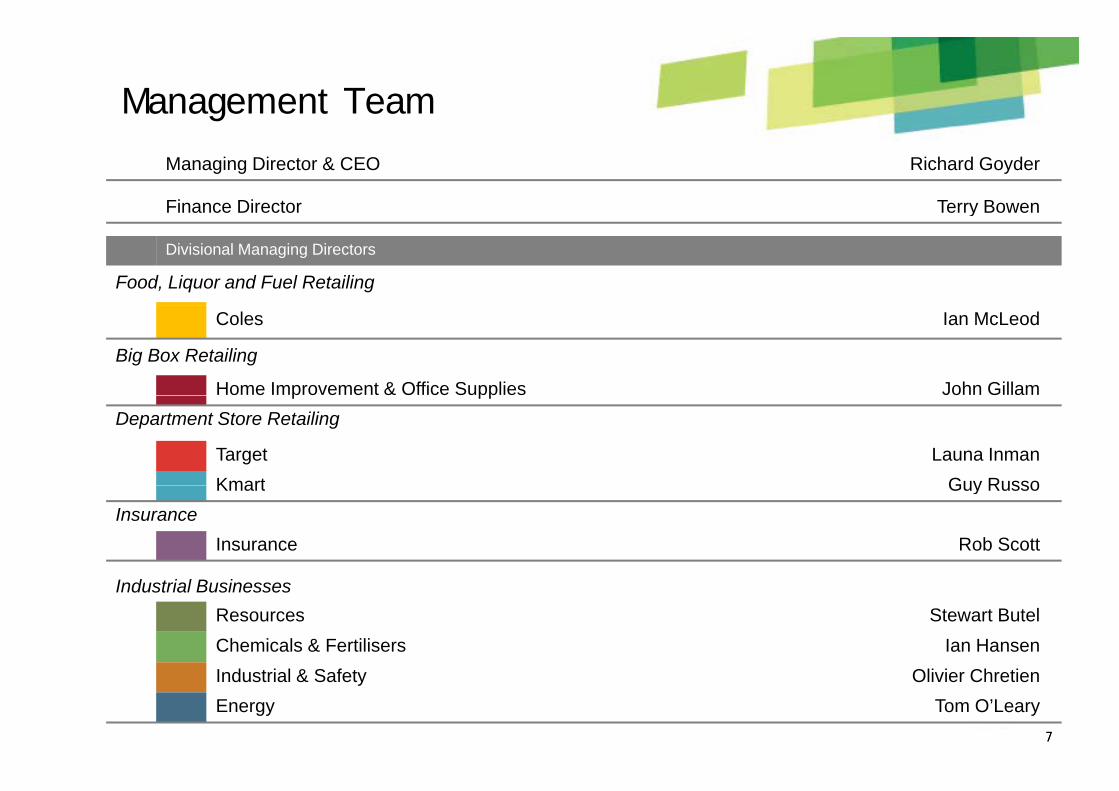
Management Team
Managing Director & CEO Richard Goyder
Finance Director Terry Boweny
Divisional Managing Directors
Food, Liquor and Fuel Retailing
Coles Ian McLeod
Big Box Retailing
Home Improvement & Office Supplies John Gillamp ppDepartment Store Retailing
Target Launa InmanKmart Guy RussoKmart Guy Russo
Insurance `
Insurance Rob Scott
Industrial BusinessesResources Stewart ButelChemicals & Fertilisers Ian Hansen
77
Industrial & Safety Olivier ChretienEnergy Tom O’Leary
Group Results

Group Performance Highlights
• Group profit after tax of $879 million, up 1% despite the foreshadowed fall in Resources earnings
• Operating revenue of $26.5 billion
• Group EBIT of $1.5 billion, down 11%
– Excl. Resources, Group EBIT up 44% with EBIT from Retail businesses up 23%
• Operating cash flow of $2.1 billion, up 18%
• Earnings per share of 76.3 cents, down 26%
– Reflecting 2009 equity issueReflecting 2009 equity issue
• 10% increase in interim dividend to 55 cents per share (fully franked)
99

Group Performance Highlights (cont )Group Performance Highlights (cont.)
• Results reflect the strength of having diversity of earnings
• Coles turnaround on track with EBIT increasing 13%
– Focus on quality, service and value driving positive volume growthFocus on quality, service and value driving positive volume growth
• Resources affected by lower export coal prices as foreshadowed
C d i f C h lid YTD d i ll ll d– Commenced expansion of Curragh, solid YTD production, costs well controlled
• Very strong performances from Bunnings, Target and Kmart
• Industrial businesses and Insurance recovering from negative external
factors and slow economyy
• Turnaround of former Coles Group businesses on track and pleasing
Si ifi t k i t t t f th l
10
– Significant work remains to extract further value

Group Performance Summary
Half Year ended 31 December ($m) 2009 2008 %
Operating revenue 26,533 26,363 0.6
EBITDA* 1,996 2,160 (7.6), , ( )
EBIT* 1,547 1,737 (10.9)
Net profit after tax* 879 871 0.9
Operating cash flow 2,083 1,770 17.7
Earnings per share (excl. employee res. shares) * 76.3 103.6 (26.4)
Earnings per share (incl. employee res. shares) * 76.0 102.9 (26.1)
Cash flow per share (incl. employee res. shares) 180.0 219.7 (18.1)
Dividends per share 55 50 10 0Dividends per share 55 50 10.0
Return on shareholders' funds (R12) (%) 6.5 7.4 (0.9)pt
1111
^ 2008 restated for 2009 rights issues in accordance with AIFRS* 2008 restated for change in accounting policy for Stanwell rebate payments

Divisional EBIT
Half Year ended 31 December ($m) 2009 2008 %
Coles 486 431 12.8
Home Improvement 422 370 14.1
Office Supplies 27 25 9.0pp
Target 279 215 29.8
Kmart 154 75 105.3
Resources* 2 664 (99 7)Resources 2 664 (99.7)
Insurance 58 67 (13.4)
Industrial & Safety 51 68 (25.0)
Ch i l & F ili 4 575 0Chemicals & Fertilisers 27 4 575.0
Energy 56 30 86.7
Other^ 31 (138) n.m.
Divisional EBIT 1,593 1,811 (12.0)
Corporate overheads (46) (74) 37.8
Group EBIT 1,547 1,737 (10.9)
12
^ Includes $39m (2008:$148m) (pre tax) of non-trading costs* 2008 restated for change in accounting policy for Stanwell rebate payments
p , , ( )

Creating Value from the Coles AcquisitionCreating Value from the Coles Acquisition
Achievements to Date
Business
Centralised structure replaced with autonomous divisionsNew, strengthened management teams at Coles, Kmart and Offi kBusiness
restructure OfficeworksLeaner and more efficient divisional head officesDecision to keep Kmart
Positive cultural change underway (store and customer focus)Significant change occurring in merchandising offersImproving promotional programs and in-store executionBusiness
improvements andV l ti
Improving promotional programs and in store executionImproved store standards and serviceReinvestment in network underway through prudent capex plansExiting of underperforming storesValue creation Exiting of underperforming storesSupply chain restructuring progressing wellImproved supplier arrangementsSignificant working capital release with more to come
13
g g p

Operating Divisions

Coles
• Turnaround on track1. Building a solid foundation
• Transforming the product offer
• Comprehensive renewal Strategies 2. Delivering consistently well
3. Driving the Coles difference
underway
• Significant work remains to extract further value 1H10
• Food & Liquor comp sales growth of 6.0% (5.9% in 2Q10); 1H10 deflation 0.9%
• Focus on quality, service and value drove t t thextract further value 1H10
Trading Update
strong customer growth• Easy Ordering in 40+ stores, targeting 200 by
June 2010• Continued investment in store standards• Renewal development continuing with 40+
stores trading at Dec 09
• Turnaround on track
Outlook• Signs of improving economic climate
• Customers remain value focused
• Changing business environment
T iti t t h f t d
15
• Transition to next phase of turnaround

Coles – 1H10 Sales Performance
• Five consecutive quarters of F&L Comp Volume Growth
7.0%
8.0%
improved volume growth for Food & Liquor
Good transaction growth
5.0%
6.0%• Good transaction growth
• Strong supermarket sales
• Solid liquor sales
2.0%
3.0%
4.0%
New supermarket at Flemington (Vic)
• Solid liquor sales
• Strong underlying volume growth
(1 0)%
0.0%
1.0%
Q109 Q209 Q309 Q409 Q110 Q210
p g ( )
(2.0)%
(1.0)%
16

Coles – Strategy5 years – 3 phases of recovery
Building a Solid F d ti
Delivering C i t tl W ll
Driving the Coles Diff
PerformanceFoundation Consistently Well Difference
• Embed the new culture• Culture of continuous improvement
• Create a strong top team
• Cultural change
• Availability & store standards
• Team member development
• Improved customer service
• Improved efficiency
• Strong customer trust and loyalty
• Strong operational efficiencyAvailability & store standards
• Value and customer trust
• Renewal store development
• Improved efficiency
• Appealing Fresh food offer
• Stronger delivery of value
Strong operational efficiency
• Innovative & Improved offer
• New stores, new categories
• IT & supply chain infrastructure
• Liquor renewal
• Efficient use of capital
• Scale rollout of new format
• Auto replenishment completed
17Year 1 - 2 Year 2 - 4 Year 4 - 5+
Efficient use of capital

Coles – StrategyPhase 1 ProgressPhase 1 Progress
Create a strong top team Further executive appointments, creating strength and depth of top team Appointed over 150 new regional and store managersTalent mapping to identify & promote future leaders
Cultural change Improved incentives for store managementLabour turnover down, absenteeism falling
Availability & store standards Improvement in on-shelf availability continuing On-going investment in store standardsContinued focus on customer service
Value and customer trust Improvements in range and quality of Coles brand productsValue and customer trust Improvements in range and quality of Coles brand products Strong reinvestment in prices
Renewal store development Renewal progress continuing with 40+ stores trading at Dec 09.
IT & l h i i f t t Ph i l h i l h i b dl l tIT & supply chain infrastructure Physical change in supply chain broadly complete Delivery times fallingEasy Order in 40+ stores, targeting 200 stores by June 2010
Liquor renewal Distinctive multi-brand strategyLiquor renewal gyIncreased volumes across all brands through improved value positioningProgressive store renewal
Efficient use of capital Improved working capital Disciplined approach to capital expenditure
18
Disciplined approach to capital expenditure
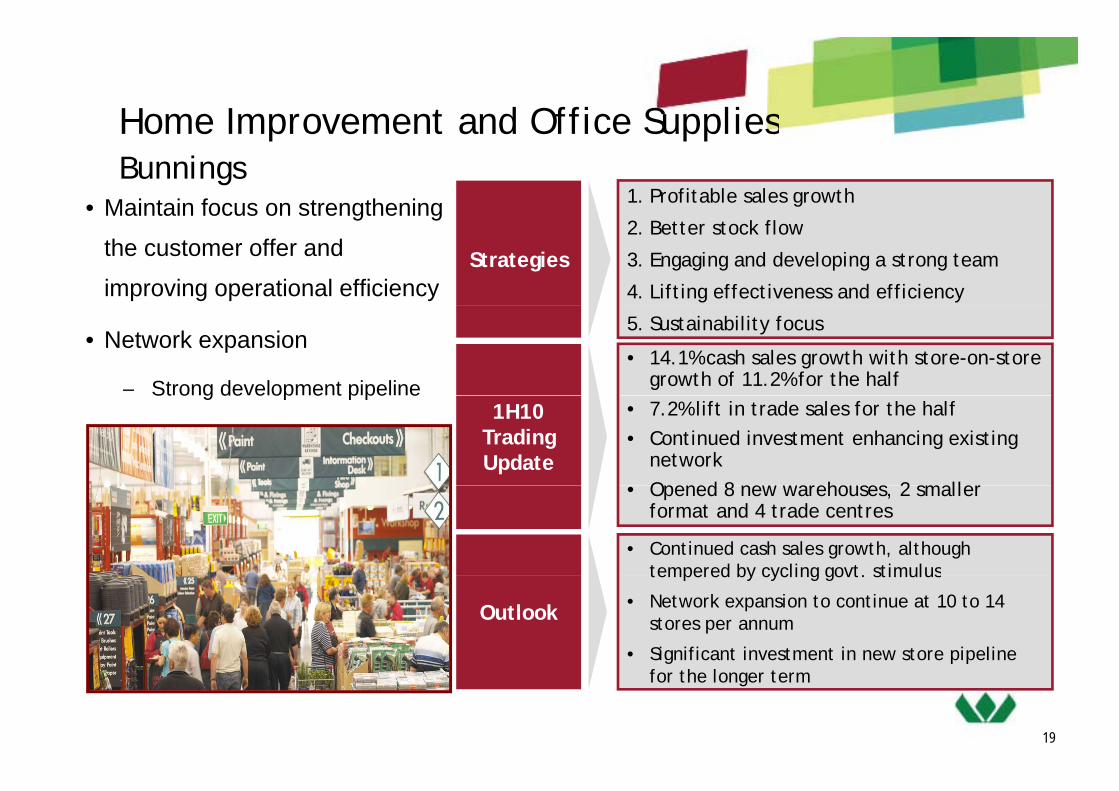
Home Improvement and Office SuppliesHome Improvement and Office Supplies
• Maintain focus on strengthening 1. Profitable sales growthBunnings
g g
the customer offer and
improving operational efficiencyStrategies
2. Better stock flow
3. Engaging and developing a strong team
4. Lifting effectiveness and efficiency
• Network expansion
– Strong development pipeline• 14.1% cash sales growth with store-on-store
growth of 11.2% for the half
5. Sustainability focus
St o g de e op e t p pe e1H10
Trading Update
• 7.2% lift in trade sales for the half• Continued investment enhancing existing
networkOpened 8 ne areho ses 2 smaller • Opened 8 new warehouses, 2 smaller format and 4 trade centres
• Continued cash sales growth, although tempered by cycling govt. stimulus
Outlook
tempered by cycling govt. stimulus
• Network expansion to continue at 10 to 14 stores per annum
• Significant investment in new store pipeline
19
for the longer term

Home Improvement and Office SuppliesHome Improvement and Office Supplies
G d i i1. Improving the customer offer
Officeworks
• Good progress on improving
operational effectiveness Strategies
2. Improve customer service
3. Team development & engagement
4. Make things simple & reduce costs
• Continued focus on
delivering strategic agenda
5. Drive sales & profitability
• Officeworks retail store sales growth of 12.7%; strong transaction growth
1H10 Trading Update
strong transaction growth• Challenging market conditions for small-to-
medium size business customers• Pressures on margin and costs
Update • Ongoing store network expansion & re-investment
• 4 new stores & 7 full store upgrades
Outlook
• Focus on delivering strategic agenda
• Continued sales growth, but competitive
pressures on margins
20
pressures on margins

Target
• Continued to gain 1. Focus on fundamentals2 B d i fmarket share
• Absolute focus on the Strategies
2. Brand reinforcement3. Differentiation4. Store network development5 C t i
customer and offer5. Customer service6. Team member development7. Business improvements
1H10 Trading U d t
• Comp sales growth of 1.7% (1.6% in 2Q10)• EBIT margin strengthened to 12.8%• Improvements in CODB and supply chain
Update • Focus on inventory management • 6 new stores & 13 refurbishments
• Cautious due to cycling of further stimulus
Outlook
payments up to June
• New product development and sourcing strategy to be implemented
21
• 1 new store & 15 refurbishments in 2H10

Kmart
• Improved underlying 1. Outstanding customer experience
profitability as a result of implemented turnaround initiatives
Strategies
2. Ranges customers want
3. Great value everyday
4. Clear communicationinitiatives
• Continue to re-set Kmart for renewal and growth • Comp sales decline of 1 6% (-1 1% in 2Q10)
5. Every site a success
6. Best people, great company
g
1H10 Trading Update
• Comp sales decline of 1.6% ( 1.1% in 2Q10)
• Improved margins from exit of unprofitable product and promotions, reduction in costs
• Inventory well controlled and below last yearUpdate
• 2 new stores and over 30 floor and fitting room upgrades completed
• Results thus far are pleasing, however, t d ill t k ti
Outlook
turnaround will take time
• Growth phase commenced, renewal phase still active
M d l h i h
22
• Moderate sales growth in short term

Resources
• Forecast Curragh 1. Maximise export sales and optimise sales mix
metallurgical sales increased to 6.3 – 6.8mt in FY10
Strategies
mix2. Cost reduction programs3. Expansion opportunities4. Extend product and market reachFY10
• Global steel production recovery and increased
5. Sustainability
• Earnings impacted by price reductions, Stanwell royalty and locked in FX losses
metallurgical coal demand 1H10 Trading Update
y y
• A$286m Curragh expansion to 8.0 -8.5mtpa export capacity approved; completion late CY2011Bl k t C k di i l t d • Blackwater Creek diversion completed
• Curragh cost reduction programs on track
Outlook• JFY10 price negotiations underway• Improved earnings performance in 2H10• Curragh cost reduction programs ongoing
23
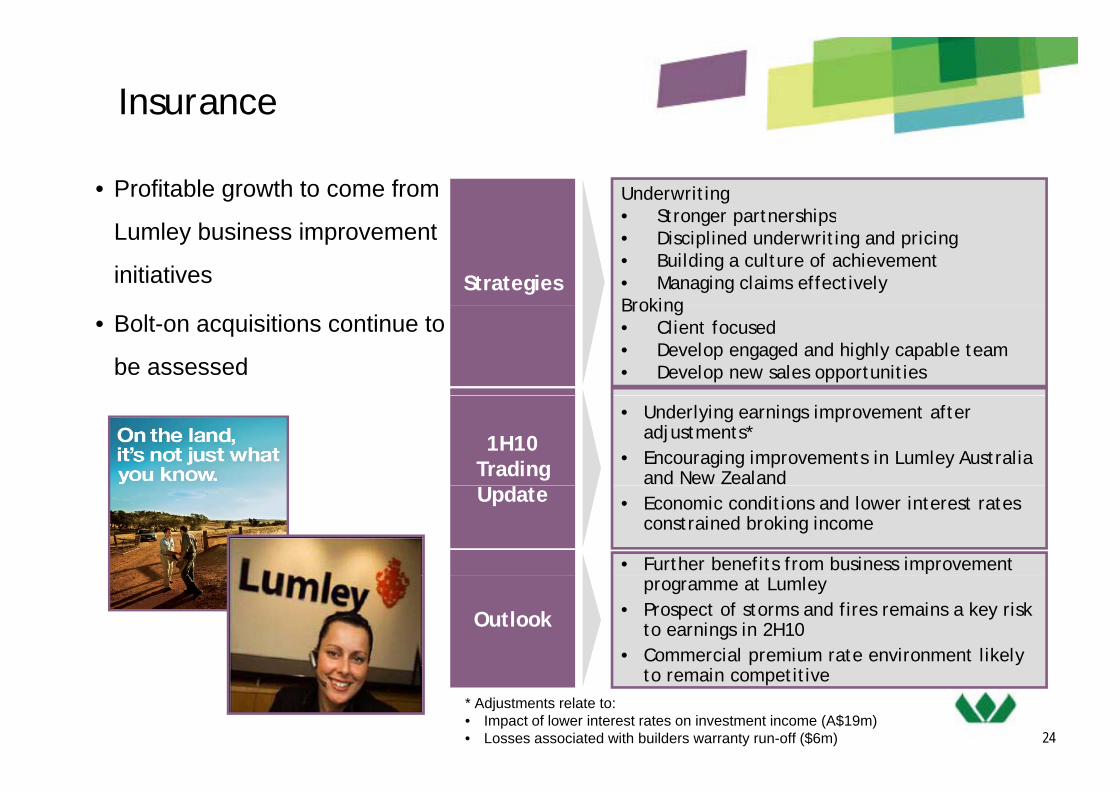
Insurance
• Profitable growth to come from Underwriting• Stronger partnerships
Lumley business improvement
initiatives Strategies
• Stronger partnerships• Disciplined underwriting and pricing• Building a culture of achievement• Managing claims effectivelyBroking
• Bolt-on acquisitions continue to
be assessed
Broking• Client focused• Develop engaged and highly capable team• Develop new sales opportunities
1H10 Trading
• Underlying earnings improvement after adjustments*
• Encouraging improvements in Lumley Australia and New Zealand
Update • Economic conditions and lower interest rates constrained broking income
• Further benefits from business improvement
Outlook
programme at Lumley• Prospect of storms and fires remains a key risk
to earnings in 2H10• Commercial premium rate environment likely
24
p yto remain competitive
* Adjustments relate to:• Impact of lower interest rates on investment income (A$19m)• Losses associated with builders warranty run-off ($6m)

Chemicals & Fertilisers
• Solid return to earnings from 1. Growth through expansions g
Chemicals in 1H10
• Lower domestic fertiliser
Strategies2. Optimise cost and capital
3. Sustainability
4. Improve capabilities and people developmentLower domestic fertiliser
prices & $A25m inventory
write-down impacting 1H10
p p p p p
• Ammonia production returned to historical levels; gas supply restored from 1 July 2009
• Strong demand for ammonium nitrate and p g
fertiliser earnings in 1H10Trading Update
• Strong demand for ammonium nitrate and sodium cyanide
• Fertiliser volumes up 17 per cent, market share maintained, however lower margins
• Reasonable growth in demand for mining chemicals expected
• Commissioning of sodium cyanide expansion
Outlook • Ammonium nitrate feasibility study progressing
• Recent strengthening of global and domestic fertiliser prices
25
• Seasonal break critical for fertilisers
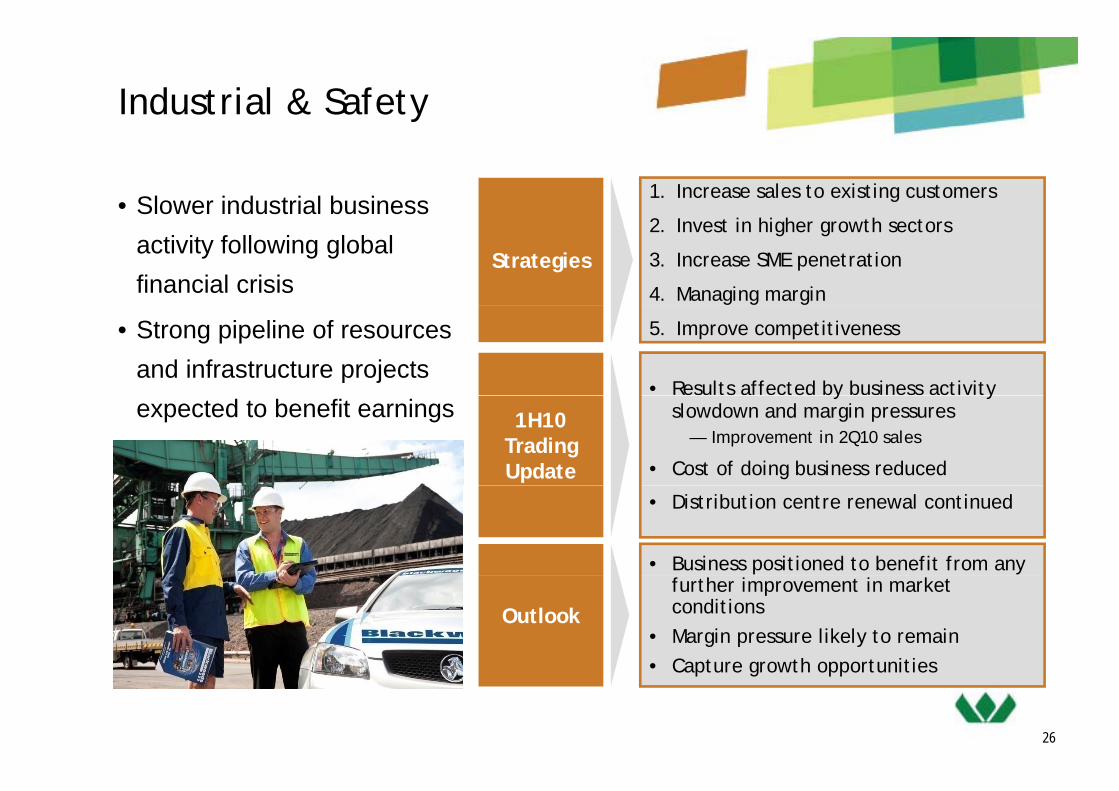
Industrial & Safety
• Slower industrial business 1. Increase sales to existing customers
activity following global financial crisis
Strategies
2. Invest in higher growth sectors
3. Increase SME penetration
4. Managing margin
• Strong pipeline of resources and infrastructure projects
5. Improve competitiveness
• Results affected by business activity expected to benefit earnings 1H10
Trading Update
y yslowdown and margin pressures
— Improvement in 2Q10 sales
• Cost of doing business reduced
• Distribution centre renewal continued
• Business positioned to benefit from any
Outlookfurther improvement in market conditions
• Margin pressure likely to remain• Capture growth opportunities
26
• Capture growth opportunities
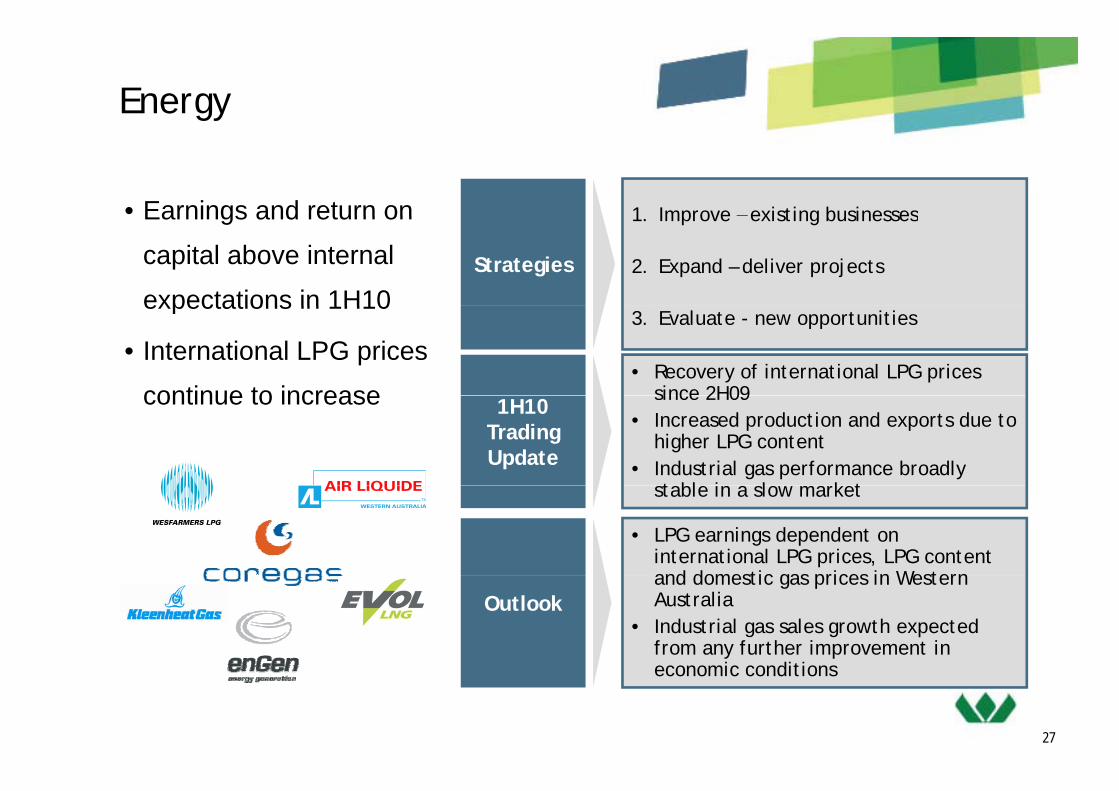
Energy
• Earnings and return on 1 Improve – existing businessesEarnings and return on
capital above internal
expectations in 1H10Strategies
1. Improve existing businesses
2. Expand – deliver projects
expectations in 1H10
• International LPG prices
continue to increase
3. Evaluate - new opportunities
• Recovery of international LPG prices since 2H09continue to increase 1H10
Trading Update
since 2H09• Increased production and exports due to
higher LPG content• Industrial gas performance broadly
t bl i l k tstable in a slow market
• LPG earnings dependent on international LPG prices, LPG content and domestic gas prices in Western
Outlookand domestic gas prices in Western Australia
• Industrial gas sales growth expected from any further improvement in
i diti
27
economic conditions

Capital Management
Capital Management
• Balance sheet strengthened further through strong cash generation
• Net Debt to Equity of 15.5% at 31 December 2009
• Cash Interest Cover Ratio of 6.6 times (R12 basis)
• Net debt to R12 operating cash flow of 1 1 times at 31 December 2009• Net debt to R12 operating cash flow of 1.1 times at 31 December 2009
• Interim dividend increased to $0.55 per share (fully-franked)
– DIP to be neutralised with shares purchased on market
2929
Debt Finance
• Gross debt of $5.7bn, net debt of $3.8bn
– Cash at bank & on deposit $1.8bn
– Committed undrawn facilities of $1.4bn
• 1H10 all in cost of debt, including margins and fees, of ~8.7% after adjusting
for one off costsfor one-off costs
• 75% hedged for 2H10
• Ongoing review of financing opportunities and requirements as market liquidity
improves
• 5-year A$500m domestic corporate bond issued in September 2009
• $972m of facilities repaid during the period
3030
$972m of facilities repaid during the period

Debt Maturity Profile Analysis(as at 31 December)
3,000
($m)
2,000
1,000
0 Current FY10 FY11 FY12 FY13 FY14 FY15
(2 000)
(1,000)
Capital Markets Wholesale Syndicated Cash at bank and on deposit
3131
(2,000)
Cash Flow(6 months to 31 December)
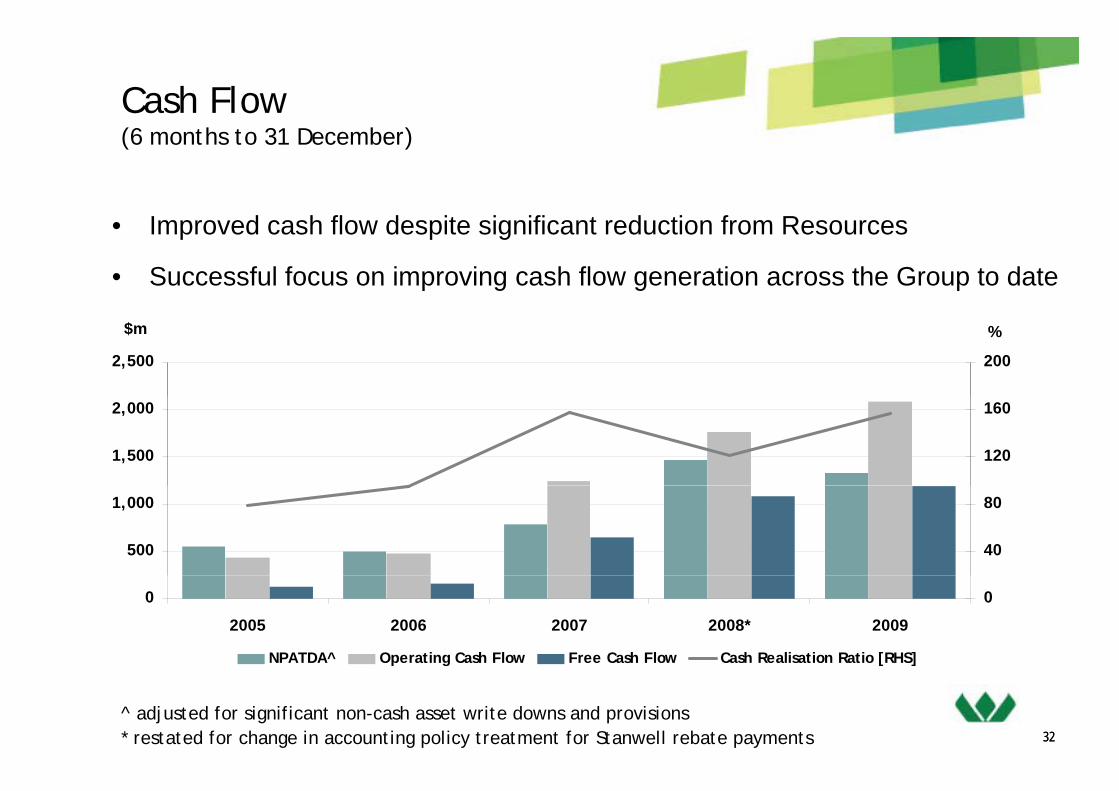
I d h fl d it i ifi t d ti f R• Improved cash flow despite significant reduction from Resources
• Successful focus on improving cash flow generation across the Group to date
2,500
$m
200
%
1,500
2,000
120
160
500
1,000
40
80
0
2005 2006 2007 2008* 2009
0
NPATDA^ Operating Cash Flow Free Cash Flow Cash Realisation Ratio [RHS]
32
p g [ ]
32^ adjusted for significant non-cash asset write downs and provisions* restated for change in accounting policy treatment for Stanwell rebate payments
Working Capital Cash Flows
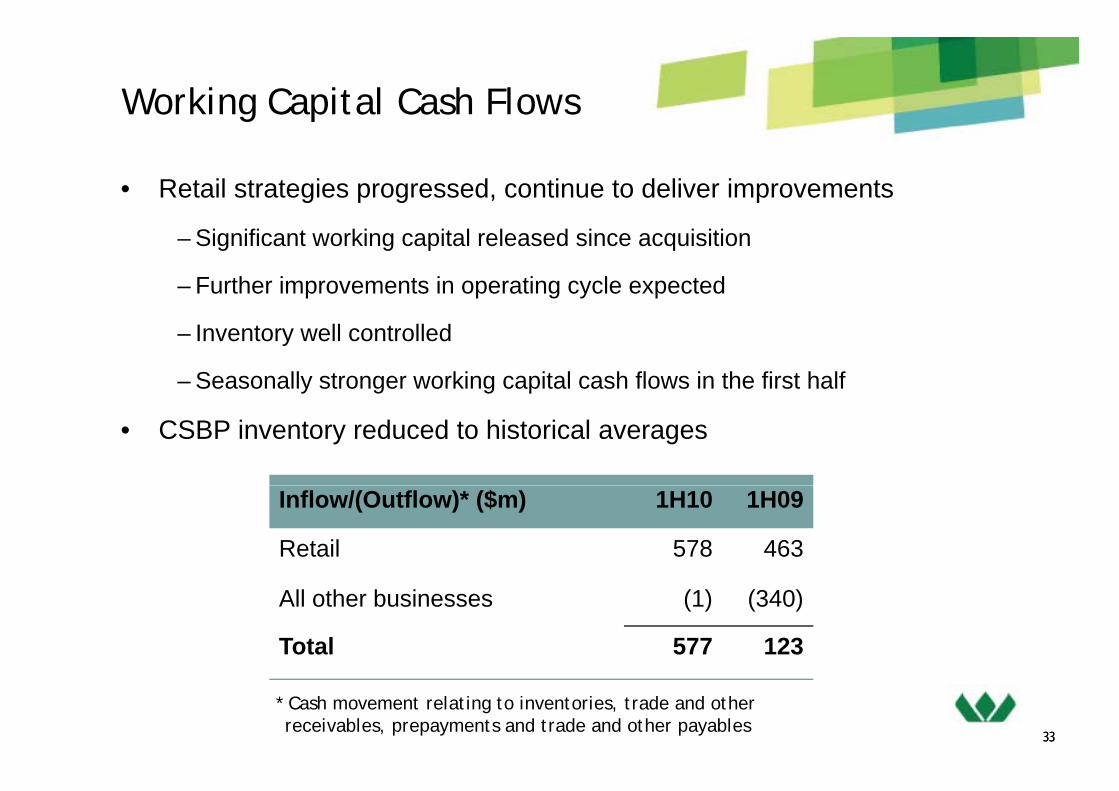
• Retail strategies progressed, continue to deliver improvements
– Significant working capital released since acquisition
– Further improvements in operating cycle expected
– Inventory well controlled
– Seasonally stronger working capital cash flows in the first half
• CSBP inventory reduced to historical averages
Inflow/(Outflow)* ($m) 1H10 1H09
Retail 578 463
All other businesses (1) (340)
Total 577 123
3333
* Cash movement relating to inventories, trade and other receivables, prepayments and trade and other payables
Capital Expenditure
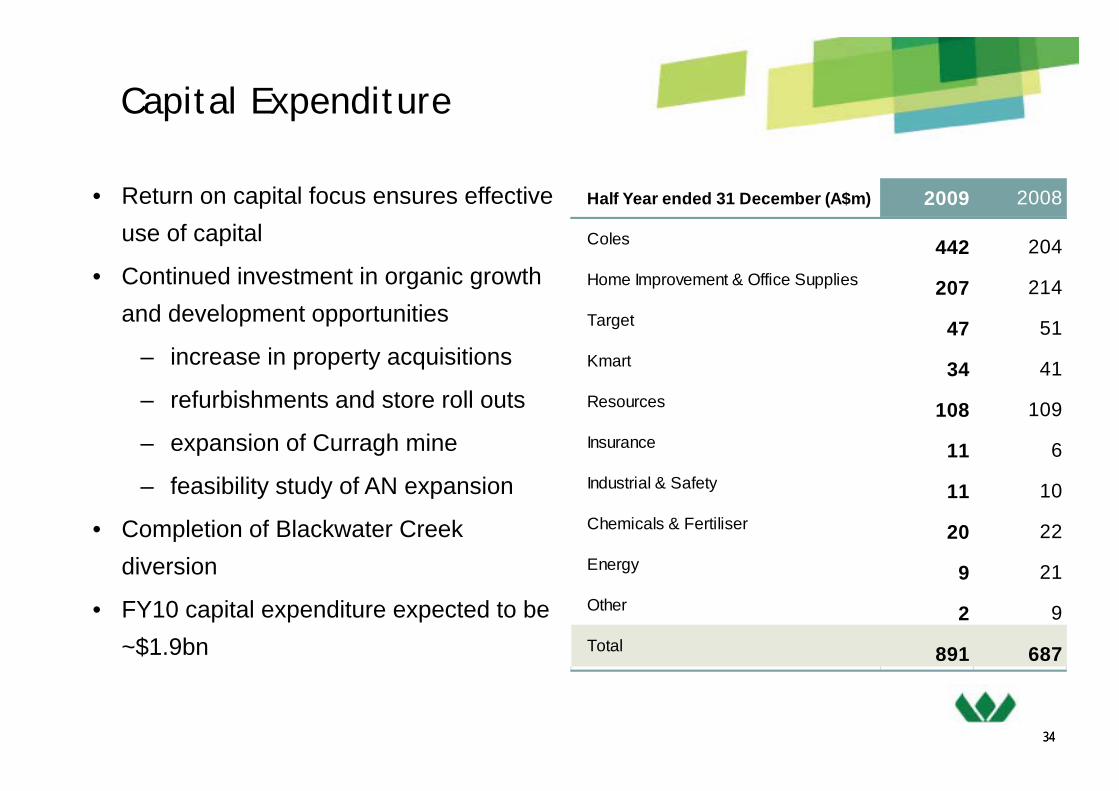
• Return on capital focus ensures effective Half Year ended 31 December (A$m) 2009 2008
use of capital
• Continued investment in organic growth d d l t t iti
Coles 442 204Home Improvement & Office Supplies 207 214
and development opportunities
– increase in property acquisitions
refurbishments and store roll outs
Target 47 51Kmart 34 41R– refurbishments and store roll outs
– expansion of Curragh mine
feasibility study of AN expansion
Resources 108 109Insurance 11 6Industrial & Safety 11 10– feasibility study of AN expansion
• Completion of Blackwater Creek diversion
Industrial & Safety 11 10Chemicals & Fertiliser 20 22Energy 9 21
• FY10 capital expenditure expected to be ~$1.9bn
9 21Other 2 9Total 891 687
3434
Outlook
• Group is well-positioned to benefit from any further upturn in the economy
• Outlook for export coal is positive
– if realised, will result in an increase in Resource earnings from 4Q10, g
• Recovery in Insurance and Industrial businesses
Optimistic about the future performance of the retail businesses• Optimistic about the future performance of the retail businesses
• Remain cautious of the Australian retail environment in 2H10 given:
– the potential impact of any further interest rate rises; and
– retailers will trade without the assistance of the prior year government stimulus
3535

For all the latest news visitFor all the latest news visit
www.wesfarmers.com.au
36

Investment ConferenceInvestment ConferencePhilosophy, Performance and Direction
Citigroup, London – 8 & 9 MarchG ld S h JBW N Y k 11 & 12 M hGoldman Sachs JBWere, New York – 11 & 12 March
Discussion PackMarch 2010
DisclaimerThis presentation has been prepared by Wesfarmers Limited. The information contained in this presentation is for information purposes only and does not constitute an offer to issue or arrange to issue, securities or other financial products, nor is it intended to constitute legal, tax or accounting advice or opinion. The information contained in this presentation is not investment orfinancial product advice and is not intended to be used as the basis for making an investment decision This presentation hasfinancial product advice and is not intended to be used as the basis for making an investment decision. This presentation hasbeen prepared without taking into account the investment objectives, financial situation or particular needs of any particular person.
No representation or warranty, express or implied, is made as to the fairness, accuracy, completeness or correctness of the information opinions and conclusions contained in this presentation To the maximum extent permitted by law none ofinformation, opinions and conclusions contained in this presentation. To the maximum extent permitted by law, none of Wesfarmers Limited, its directors, officers, employees or agents, nor any other person accepts any liability, including, withoutlimitation, any liability arising out of fault or negligence, for any loss arising from the use of the information contained in this presentation. In particular, no representation or warranty, express or implied, is given as to the accuracy, completeness, likelihood of achievement or reasonableness of any forecasts, prospects or returns contained in this presentation and Wesfarmers Limitedof achievement or reasonableness of any forecasts, prospects or returns contained in this presentation and Wesfarmers Limiteddisclaims any liability for any omissions or mistakes in the aforementioned information. Such forecasts, prospects or returns are by their nature subject to significant uncertainties and contingencies, many of which will be outside the control of Wesfarmers Limited.
Before making an investment decision you should conduct your own due diligence and consult with your own legal tax orBefore making an investment decision, you should conduct your own due diligence and consult with your own legal, tax or accounting adviser as to the accuracy and application of the information set forth herein. You should also obtain and rely onprofessional advice from your own tax, legal, accounting and other professional advisers in respect of your particular investment needs, objectives and financial circumstances. Past performance is no guarantee of future performance.
This presentation is not an offer of securities for sale in the United States or any other jurisdiction in which an offer may not beThis presentation is not an offer of securities for sale in the United States or any other jurisdiction in which an offer may not be made under applicable laws. Securities may not be offered or sold in the United States unless the securities have been registered under the U.S. Securities Act of 1933 (“Securities Act”) or an exemption from registration is available.
The financial information contained in this presentation includes non-GAAP financial measures. For a reconciliation of these measures to the most comparable GAAP measure please refer to half and full year financial statements filed with the Australian
2
measures to the most comparable GAAP measure, please refer to half and full year financial statements filed with the Australian Securities Exchange.
Index
1 Philosophy, Performance and Direction 4
2 Sustainability 9
3 Group Overview 13
4 2010 Half Year Results 180 0 a ea esu s 8
5 Operating Divisions 31
6 Capital Management 67
7 Outlook 737 Outlook 73
8 Investor Relations Contacts and Information 75
3
Philosophy, Performance and DirectionPhilosophy, Performance and Direction

Long-term, consistent strategies
MANAGING BALANCE SHEET EFFECTIVELY
5

Key Attributes
Growth Quality Earnings
• Improving retail basics;
Net ork in estment;
• National store networks;
Strong brands; Strength &
• 5 year turnaround on track;
1H10 comp sales of 6 0%; EBIT
Opportunities Assets Improvement
Network investment;
Performance turnaround
Strong brands; Strength &
depth of management
1H10 comp sales of 6.0%; EBIT
up 12.8%
• Network expansion & • National store networks; • Bunnings 1H10 cash sales
Coles
Network expansion &
improvement; Enhanced
merchandising; Officeworks
turnaround
National store networks;
Leading market position
in sectors
gcomp of 11.2%; EBIT* up 16.5%
• Officeworks 1H10 retail store sales up 12.7%; EBIT up 9.0%
Home Improvement & Office Supplies
• Merchandising and product
development; Store roll-out
programme; Supply chain
• 291 store network; Strong
brand;
• EBIT margin strengthened to
12.8%; 1H10 sales comp of
1.7%Target
efficiencies
• Performance turnaround;
Reset the foundations;
• Aust. and NZ store
network; Strong brands
• 1H10 EBIT up 105%; EBIT
margin strengthened; exit of Kmart
6
Network investment unprofitable sales
* Trading EBIT: excludes property

Key Attributes
Growth Opportunities
QualityAssets
EarningsImprovement
• Long term demand; Curragh
expansion 8.0-8.5mt p.a.;
Bengalla feasibility studies
• Sizeable production
capacity; Consistent
quality, low costs
• Maintaining lowest quartile
cash cost production of
export coalResources
• Broker consolidation;
Expansion into related areas
• Diverse mix of businesses;
200,000 direct customer
relationships
• Lumley improvement
initiatives; Interest rate
increases positive impactInsurance
• Targeted sales to existing
customers & new customer
segments & sectors; Strong
pipeline of resources projects
• #1 or #2 in most markets;
Blackwoods extensive
branch network
• Margin & expense control;
Sourcing, pricing and
contract managementIndustrial & Safety
pipeline of resources projects
• AN feasibility study
commenced; Sodium Cyanide
expansion; New market
• Sole WA producer of AN;
65% WA fertiliser market,
unmatched infrastructure
• Improved AN contribution;
Increase in demand for
mining chemicals
Chemicals & Fertilisers expansion; New market
expansion
unmatched infrastructure mining chemicals
• East coast LNG opportunities;
Alternative fuels and
• LPG vertical integration;
Industrial gas, LNG and
• Industrial gases sales
growth; Recovery of
Fertilisers
Energy
7
renewables
g
power production facilities
g y
international LPG pricesgy

A History of Strong Returns
48300
WESShare Price ($A)
EPS(cents per share)
24
32
40
150
200
250
0
8
16
24
0
50
100
150
0000 01 02 03 04 05 06 07 08 09 1H10
ARG EPS EPS (AIFRS) Landmark EPS Girrah EPS EPS (AGAAP) Wesfarmers Share Price
* Adj t d f it l t ti* Adjusted for capital reconstructions
Feb-00 Feb-01 Feb-02 Feb-03 Feb-04 Feb-05 Feb-06 Feb-07 Feb-08 Feb-09 Feb-10
8
Feb-00 Feb-01 Feb-02 Feb-03 Feb-04 Feb-05 Feb-06 Feb-07 Feb-08 Feb-09 Feb-10
Wesfarmers TSR Index All Ordinaries Accumulation Index

SustainabilitySustainability

Sustainability
Financial performance• All our actions are directed towards satisfying our corporate objective of providing a
ti f t t t h h ld T b t i bl W f t ti tsatisfactory return to shareholders. To be sustainable, Wesfarmers must continue toachieve high standards of financial performance thereby allowing us to make the mostmeaningful contribution possible to the community through wealth generation andemployment creation
Safe and rewarding workplaces• Wesfarmers is one of Australia’s largest private sector employers. Attraction and
retention of skilled and committed employees is one of our key priorities. We have anobligation to provide safe workplaces, to treat our people with decency and respectand provide them with opportunities for interesting and rewarding career paths. Eachbusiness unit is set a target of reducing its lost time injury frequency rate by 50 percent a year on the path to zero. Remuneration of some senior staff is linked toachievement of safety targets
Good value products and services• Central to our business success is to maintain a reputation for quality and value across the range of our diversified suite
of operations. We seek to apply the same principles and standards to delivering export coal as we would to dealing withclients in the insurance businesses or catering to the needs of our retail customer baseclients in the insurance businesses or catering to the needs of our retail customer base.
Respect for customers and suppliers• Retention of high levels of satisfaction in both these groups is essential if we are to continue to succeed. Extensive
customer feedback systems are maintained in the retail operations.
1010
Sustainability
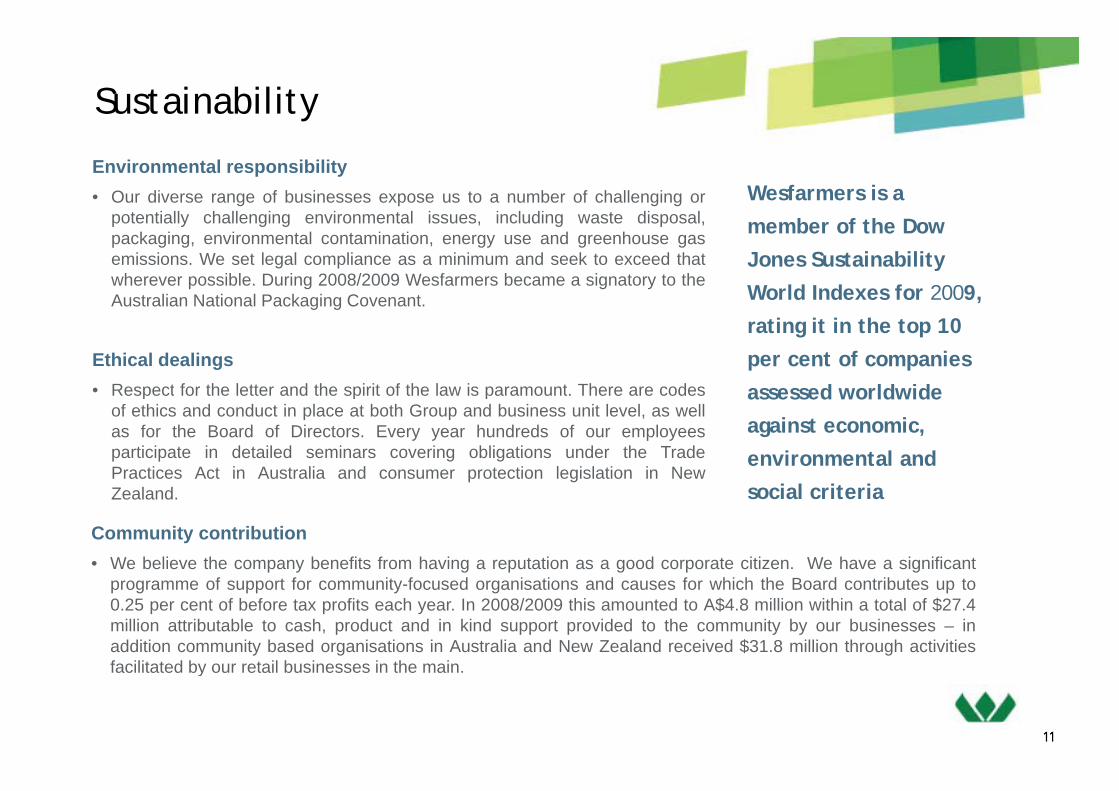
Environmental responsibility• Our diverse range of businesses expose us to a number of challenging or
potentially challenging environmental issues including waste disposalWesfarmers is a
potentially challenging environmental issues, including waste disposal,packaging, environmental contamination, energy use and greenhouse gasemissions. We set legal compliance as a minimum and seek to exceed thatwherever possible. During 2008/2009 Wesfarmers became a signatory to theAustralian National Packaging Covenant.
member of the Dow Jones Sustainability World Indexes for 2009, Australian National Packaging Covenant.
Ethical dealings• Respect for the letter and the spirit of the law is paramount. There are codes
rating it in the top 10 per cent of companies assessed worldwide Respect for the letter and the spirit of the law is paramount. There are codes
of ethics and conduct in place at both Group and business unit level, as wellas for the Board of Directors. Every year hundreds of our employeesparticipate in detailed seminars covering obligations under the TradePractices Act in Australia and consumer protection legislation in New
assessed worldwide against economic, environmental and
i l it iZealand.
Community contribution• We believe the company benefits from having a reputation as a good corporate citizen. We have a significant
social criteria
programme of support for community-focused organisations and causes for which the Board contributes up to0.25 per cent of before tax profits each year. In 2008/2009 this amounted to A$4.8 million within a total of $27.4million attributable to cash, product and in kind support provided to the community by our businesses – inaddition community based organisations in Australia and New Zealand received $31.8 million through activitiesfacilitated by our retail businesses in the main
1111
facilitated by our retail businesses in the main.

SustainabilitySustainability reporting• Voluntarily publicly reporting on sustainability issues since 1998/99. The stand-alone Sustainability Report is published to
coincide with the company's Annual General Meeting. The 2008 report runs to more than 70 pages of very detailed information i t l h lth d f t d it t f d i d d tl ifi d i thon our environmental, health and safety and community engagement performance and was independently verified using the
AA1000 Assurance Standard. The report can be accessed on-line at www.wesfarmers.com.au. Further information in relation to division specific sustainability initiatives is also available on-line.
Climate change• Greenhouse gas emissions from wholly owned business units or those where we have management responsibility are disclosed• Greenhouse gas emissions from wholly-owned business units or those where we have management responsibility are disclosed
in the Sustainability Report . Our 08/09 emissions were approximately 6.53m tonnes CO2e, and we used approximately 29 petajoules of energy.
• Wesfarmers was again a respondent to the Carbon Disclosure Project in 2008, which provides full disclosure on greenhouse emissions and our overall approach to climate change issues. Our 2008 report can be accessed at www.cdproject.net. During
/ f f f2008/2009, Wesfarmers has continued to review the issue of carbon emission targets in the context of Australian and NZ carbonemissions policies, whilst focusing on energy efficiency initiatives.
• Our coal operations continued to contribute to the Coal21 Fund established by the Australian coal industry to demonstrate promising technologies to reduce greenhouse emissions from coal-fired power stations. The Fund is expected to raise up to $1 billion over 10 years with Wesfarmers putting in around $30 million.y p g
• We support the development of a global emissions trading framework and the establishment of the Australian national carbon emissions trading laws ahead of a global agreement- we believe while such a scheme will provide an effective platform for reducing emissions it must also carefully factor in economic conditions and hence allow for flexibility in implementation. The Australian Federal Government commenced the National Greenhouse and Energy Reporting scheme on 1 July 2008. The scheme will record the majority of Australia’s greenhouse emissions and energy use Wesfarmers has registered to participate inscheme will record the majority of Australia s greenhouse emissions and energy use. Wesfarmers has registered to participate inthe scheme and has developed a management information system to comply with the complex requirements of these laws.
Energy efficiency• We have registered under the Australian government's Energy Efficiency Operations (EEO) programme which requires
companies using more than 0.5 petajoules in any year to conduct assessments and report on implementation of measures
1212
companies using more than 0.5 petajoules in any year to conduct assessments and report on implementation of measures designed to increase energy efficiency. We believe there are financial as well as environmental benefits to be obtained fromadopting a positive approach to this legislative requirement and made our first Public Report in December 2008.

Group OverviewGroup Overview

Financial Summary
FY09 1H09 1H10
Operating Results
% Change pcp
Revenue A$m 50,982 26,363 26,533 0.6
EBITDA^ A$m 3,803 2,160 1,996 7.6
Earnings before interest and tax^ A$m 2,948 1,737 1,547 10.9
Net profit after tax^ A$m 1 523 871 879 0 9Net profit after tax^ A$m 1,523 871 879 0.9
Operating Cash flows A$m 3,044 1,770 2,083 17.7
Financial Position
Total assets^ A$m 39,062 38,506 39,889 3.6
Net borrowings A$m 4,435 9,312 3,824 58.9
Shareholders' equity^ A$m 24,248 19,043 24,626 29.3
Capital expenditure on PPE (cash basis) A$m 1,503 687 891 29.7
Depreciation and amortisation A$m 855 423 449 6 1 Depreciation and amortisation A$m 855 423 449 6.1
Financial Performance
Basic earnings per share #^ cents 158.7 103.6 76.3 26.4
Dividends per share cents 110 50 55 10.0
Operating Cash flow per share* A$ 3.25 2.20 1.80 18.1
Return on average shareholders' equity (R12) % 7.3 7.4 6.5 0.9pt
Gearing (net debt to equity) % 18.3 48.9 15.5 33.4pt
Net interest cover (cash basis) times 5 0 4 8 6 6 37 5
14
# adjusted for rights issue in accordance with AIFRS^ FY09 and 1H09 restated for change in Group accounting policy for Stanwell rebate payments* includes employee reserved shares
Net interest cover (cash basis) times 5.0 4.8 6.6 37.5

Divisional Summary – 1H10
Activities 1H10 1H10 EBIT^
1H10 Activities Revenue
1H10 EBITEBIT
(A$m) (A$m) Contribution
Coles The division comprises one of Australia's largest supermarketb i li t ili tl t f l d i tl t 15,161 486 30%Coles businesses, liquor retailing outlets, fuel and convenience outlets. 15,161 486 30%
Home Improvement & Office Supplies
Australia and New Zealand's leading supplier of home improvementand outdoor living products, office products, and a major supplier ofbuilding materials
4,064 449 28%Office Supplies building materials.
Target Australian department store offering on-trend, fashionable appareland soft homewares. 2,182 279 18%
Kmart Australian and New Zealand discount department store retaileroffering a wide variety of quality and great value generalmerchandise and apparel.
2,226 154 10%
15^ before corporate overheads

Divisional Summary – 1H10 (cont.)
Activities 1H10 Revenue
1H10 EBIT^1H10EBITRevenue EBIT
(A$m) (A$m) Contribution
Resources* Mining of metallurgical and steaming coal to domestic and exportmarkets. 624 2 0%
Insurance Provider of underwriting, broking, premium funding and financialservices activities in Australia, New Zealand and the UK. 868 58 4%
Industrial & Safety Australia and New Zealand's market leaders in the supply ofmaintenance, repair and operating products and safety products. 637 51 3%
Chemicals & FertilisersManufacture and marketing of industrial chemicals and fertilisersused in the mining mineral processing industrial and agricultural 433 27 2%Chemicals & Fertilisers used in the mining, mineral processing, industrial and agriculturalsectors.
433 27 2%
Energy Production,marketing and distributionof LPG and LNG; manufactureand marketing of industrial gases; and power generation 304 56 3%
Other Businesses 50% interest in Gresham Partners; Gresham Private Equityinvestments; 50% interest in Wespine; and 23% interest in BWPT 34 31 2%
16* EBIT was affected by locked-in exchange rate losses of $65 million and Stanwell rebate expense of $106m^ before corporate overheads

Creating Value from the Coles AcquisitionCreating Value from the Coles Acquisition
Achievements to Date
Business
Centralised structure replaced with autonomous divisionsNew, strengthened management teams at Coles, Kmart and Offi kBusiness
restructure OfficeworksLeaner and more efficient divisional head officesDecision to keep Kmart
Positive cultural change underway (store and customer focus)Significant change occurring in merchandising offersImproving promotional programs and in-store executionBusiness
improvements andV l ti
Improving promotional programs and in store executionImproved store standards and serviceReinvestment in network underway through prudent capex plansExiting of underperforming storesValue creation g p gSupply chain restructuring progressing wellImproved supplier arrangementsSignificant working capital release with more to come
1717
g g p

2010 Half Year Results2010 Half Year Results

2010 Half Year Results Performance Highlights
G NPAT f $879 illi 1%
Half Year ended 31 December (A$m) 2009 2008 %
Operating revenue 26,533 26,363 0.6
Group Performance Highlights
• Group NPAT of $879 million, up 1%
– Despite the foreshadowed significant fall in
Resources’ earnings
EBITDA* 1,996 2,160 (7.6)
EBIT* 1,547 1,737 (10.9)
Net profit after tax* 879 871 0.9
Operating cash flow 2 083 1 770 17.7
• Operating revenue of $26.5 billion
• Group EBIT of $1.5 billion, down 11%
Operating cash flow 2,083 1,770 17.7
Earnings per share (excl. employee res. shares) * 76.3 103.6 (26.4)
Earnings per share (incl. employee res. shares) * 76.0 102.9 (26.1)
Cash flow per share (incl. employee res. shares) 180.0 219.7 (18.1)
Di id d h 55 50 10 0– Group EBIT increased 44% excluding Resources
– Earnings from retail businesses up 23%
Dividends per share 55 50 10.0
Return on shareholders' funds (R12) (%) 6.5 7.4 (0.9)pt
*2008 restated for change in accounting policy for Stanwell rebate payments
2 500$m
• Operating cash flow of $2.1 billion, up 18%
• Earnings per share of 76.3 cents, down 26%
1 000
1,500
2,000
2,500
– reflecting 2009 equity issue
• 10% increase in interim dividend to 55 cents per
share (fully franked)0
500
1,000
2005 2006 2007 2008 2009
19
share (fully franked)
Excludes sale of ARG in 2006
Operating Cash Flow Free Cash Flow

2010 Half Year Results Performance Highlights
• Results reflect the strength of having
Divisional Performance Overview Half Year ended 31 December (A$m) 2009 2008 %
Coles 486 431 12.8g gdiversity of earnings
• Coles turnaround on track with EBIT increasing 13%
Home Improvement 422 370 14.1
Office Supplies 27 25 9.0
Target 279 215 29.8
Kmart 154 75 105.3
– Focus on quality, service and value driving positive volume growth
• Resources affected by lower export coal prices as foreshadowed
Resources* 2 664 (99.7)
Insurance 58 67 (13.4)
Industrial & Safety 51 68 (25.0)
Chemicals & Fertilisers 27 4 575.0
Energy 56 30 86 7prices as foreshadowed– Commenced expansion of Curragh, solid
YTD production, costs well controlled
• Very strong performances from
Energy 56 30 86.7
Other^ 31 (138) n.m.
Divisional EBIT 1,593 1,811 (12.0)
Corporate overheads (46) (74) 37.8
Group EBIT 1,547 1,737 (10.9)y g pBunnings, Target and Kmart
• Industrial businesses and Insurance recovering from negative external factors and slow economy
* 2008 restated for change in accounting policy for Stanwell rebate payments^ Includes $39m (2008: $148m) of non trading costsn.m. = not meaningful
Group EBIT 1,547 1,737 ( )
factors and slow economy
• Turnaround of former Coles Group businesses on track and pleasing
– Significant work remains to extract
20
Significant work remains to extract further value
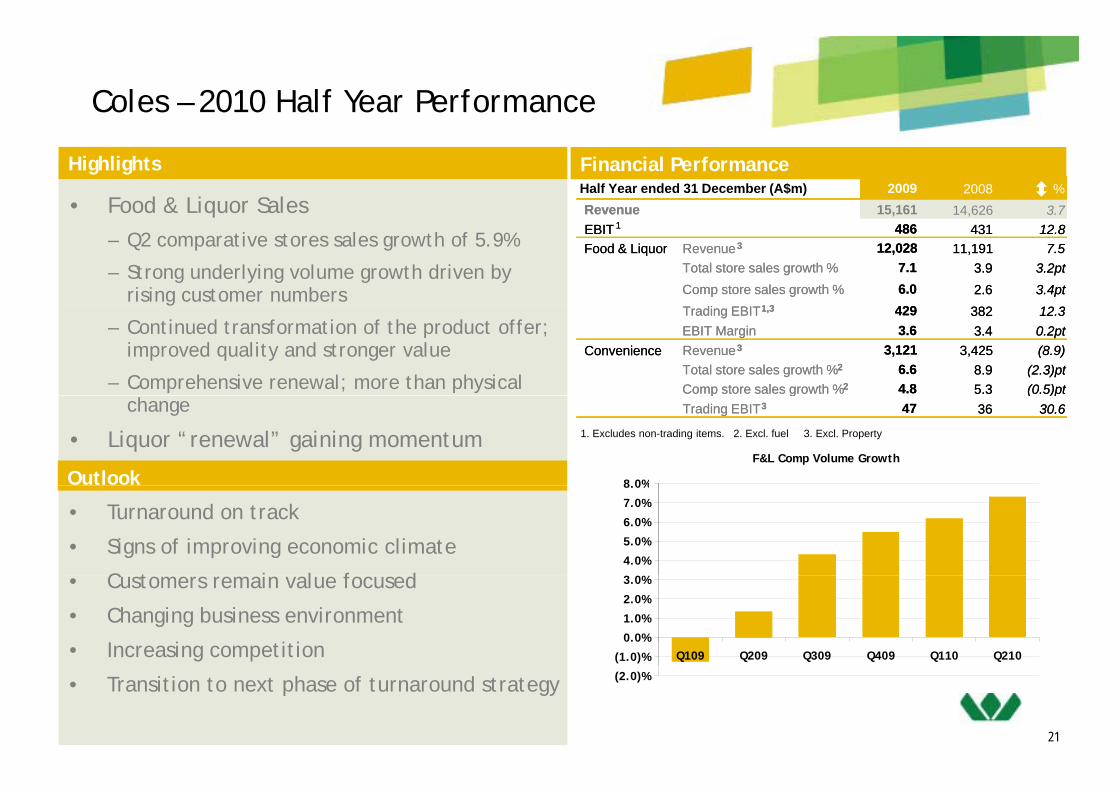
Coles – 2010 Half Year Performance
Highlights Financial Performance
• Food & Liquor SalesHalf Year ended 31 December (A$m) 2009 2008 %Revenue 15,161 14,626 3.7
2009 2008 %Revenue 15,161 14,626 3.7q
– Q2 comparative stores sales growth of 5.9%
– Strong underlying volume growth driven by rising customer numbers
, ,EBIT 1 486 431 12.8Food & Liquor Revenue 3 12,028 11,191 7.5
Total store sales growth % 7.1 3.9 3.2ptComp store sales growth % 6.0 2.6 3.4pt
1 3 429
, ,EBIT 1 486 431 12.8Food & Liquor Revenue 3 12,028 11,191 7.5
Total store sales growth % 7.1 3.9 3.2ptComp store sales growth % 6.0 2.6 3.4pt
1 3 429– Continued transformation of the product offer;
improved quality and stronger value
– Comprehensive renewal; more than physical
Trading EBIT 1,3 429 382 12.3EBIT Margin 3.6 3.4 0.2pt
Convenience Revenue 3 3,121 3,425 (8.9)Total store sales growth % 2 6.6 8.9 (2.3)ptComp store sales growth % 2 4.8 5.3 (0.5)pt
Trading EBIT 1,3 429 382 12.3EBIT Margin 3.6 3.4 0.2pt
Convenience Revenue 3 3,121 3,425 (8.9)Total store sales growth % 2 6.6 8.9 (2.3)ptComp store sales growth % 2 4.8 5.3 (0.5)pt
Outlook
change
• Liquor “renewal” gaining momentum 1. Excludes non-trading items. 2. Excl. fuel 3. Excl. Property
F&L Comp Volume Growth
8 0%
p g ( )pTrading EBIT 3 47 36 30.6
p g ( )pTrading EBIT 3 47 36 30.6
• Turnaround on track
• Signs of improving economic climate
C t i l f d4.0%
5.0%
6.0%
7.0%
8.0%
• Customers remain value focused
• Changing business environment
• Increasing competition (1.0)%
0.0%
1.0%
2.0%
3.0%
Q109 Q209 Q309 Q409 Q110 Q210
2121
• Transition to next phase of turnaround strategy (2.0)%

Home Improvement & Office Supplies2010 Half Year Performance2010 Half Year Performance
Highlights Financial PerformanceHome Improvement Half Year ended 31 December (A$m) 2009 2008 %
R H I t 3 402 3 009 13 1
2009 2008 %
R H I t 3 402 3 009 13 1• 14.1 % cash sales growth
• 11.2% store-on-store growth (Q210: 7.9%)
• 7.2% lift in trade sales
Revenue Home Improvement 3,402 3,009 13.1
Office Supplies 662 602 10.0
4,064 3,611 12.5
Revenue Home Improvement 3,402 3,009 13.1
Office Supplies 662 602 10.0
4,064 3,611 12.5
• Opened 8 warehouses, 2 smaller formats & 4 trade centres
• Continued investment enhancing existing network
EBIT Home Improvement 422 370 14.1
Office Supplies 27 25 9.0
449 395 13.7
Home Improvement 422 370 14.1
Office Supplies 27 25 9.0
449 395 13.7• Continued investment, enhancing existing network
• Ongoing strategic commitment
Office Supplies Home Improvement
Outlook
pp
• Officeworks retail store sales growth 12.7%
• Strong transaction growth
OW Business sales gaining momentum
• Continued cash sales growth– Cycling against Australian government stimulus in pcp
• Positive trade contribution as housing construction market recovers• OW Business sales gaining momentum
• Ongoing Officeworks store network expansion & re-investment
• Maintain focus on customer offer and operational efficiency
• Network expansion 10 to 14 stores p.a., strong pipeline
22
• Opened 4 stores and completed full upgrades on 7 stores
• Good progress on improving operational effectiveness
Office Supplies
• Focused on delivering strategic agenda• Sales growth, but competitive pressures on margin 22
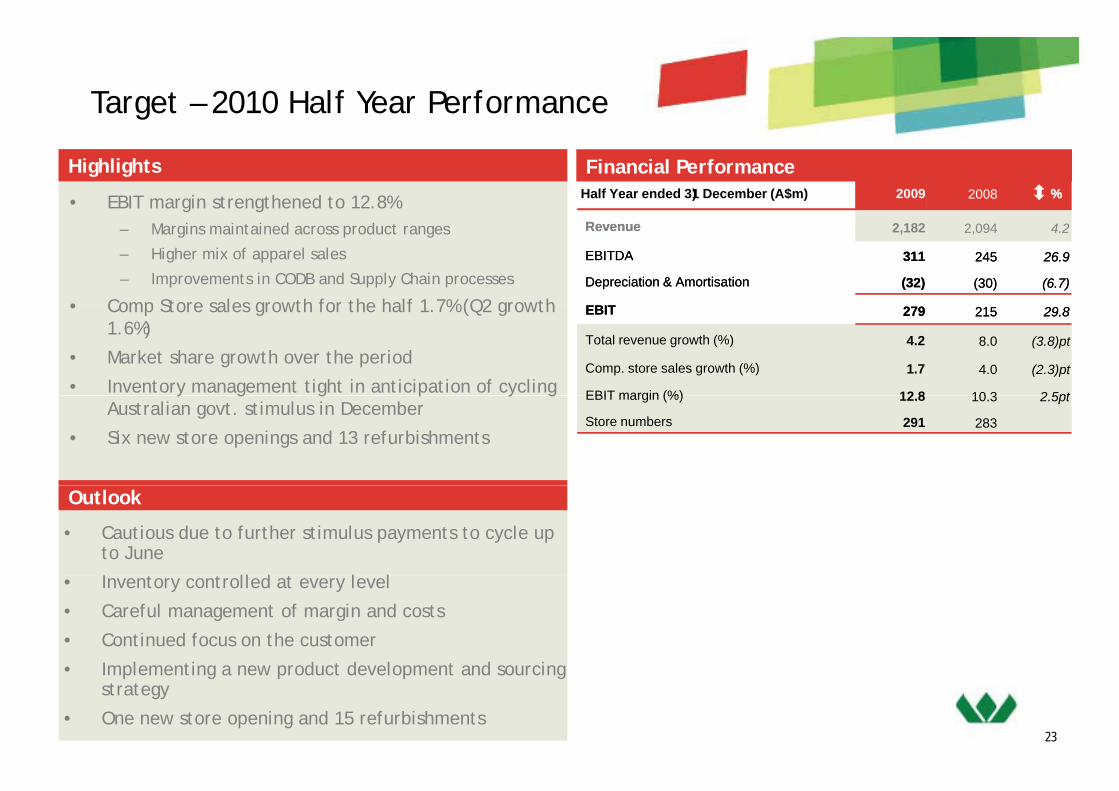
Target – 2010 Half Year Performance
Highlights Financial Performance
• EBIT margin strengthened to 12.8% Half Year ended 31 December (A$m) 2009 2008) 2009 2008 %%
– Margins maintained across product ranges
– Higher mix of apparel sales
– Improvements in CODB and Supply Chain processes
• Comp Store sales growth for the half 1 7% (Q2 growth
Revenue 2,182 2,094 4.2
EBITDA 311 245 26.9
Depreciation & Amortisation (32) (30) (6.7)
EBIT
Revenue 2,182 2,094 4.2
EBITDA 311 245 26.9
Depreciation & Amortisation (32) (30) (6.7)
EBIT• Comp Store sales growth for the half 1.7% (Q2 growth 1.6%)
• Market share growth over the period
• Inventory management tight in anticipation of cycling
EBIT 279 215 29.8
Total revenue growth (%) 4.2 8.0 (3.8)pt
Comp. store sales growth (%) 1.7 4.0 (2.3)pt
EBIT margin (%) 12 8 10 3 2 5pt
EBIT 279 215 29.8
Total revenue growth (%) 4.2 8.0 (3.8)pt
Comp. store sales growth (%) 1.7 4.0 (2.3)pt
EBIT margin (%) 12 8 10 3 2 5pty g g p y gAustralian govt. stimulus in December
• Six new store openings and 13 refurbishments
EBIT margin (%) 12.8 10.3 2.5pt
Store numbers 291 283
EBIT margin (%) 12.8 10.3 2.5pt
Store numbers 291 283
Outlook
• Cautious due to further stimulus payments to cycle up to June
I ll d l l• Inventory controlled at every level
• Careful management of margin and costs
• Continued focus on the customer
I l ti g d t d l t d i g
2323
• Implementing a new product development and sourcing strategy
• One new store opening and 15 refurbishments

Kmart – 2010 Half Year Performance
Highlights Financial Performance
• Improved underlying profitability Half Year ended 31 December (A$m) 2009 20082009 2008 %%
– Improved margins from exit of unprofitable product and promotions
– Reduction in supply chain and non-store costs
• Comparative sales decline of 1.6% (Q2 decline 1.1%)
Revenue 2,226 2,249 (1.0)
EBITDA 182 100 82.0
Depreciation & Amortisation (28) (25) (12.0)
EBIT^
Revenue 2,226 2,249 (1.0)
EBITDA 182 100 82.0
Depreciation & Amortisation (28) (25) (12.0)
EBIT^Comparative sales decline of 1.6% (Q2 decline 1.1%)
• Inventory well controlled and remains below last year
• Two new stores opened, over 30 stores received floor and fitting room upgrades
EBIT^ 154 75 105.3
Total revenue growth (%) (1.0) 0.8 (1.8)pt
Comp. store sales growth (%) (1.6) 0.4 (2.0)pt
EBIT margin (%) 6 9 3 3 3 6pt
EBIT^ 154 75 105.3
Total revenue growth (%) (1.0) 0.8 (1.8)pt
Comp. store sales growth (%) (1.6) 0.4 (2.0)pt
EBIT margin (%) 6 9 3 3 3 6pt
O l k
g pg
• Pleasing sales and profit growth at Kmart Tyre and Auto
^Excludes non-trading items.
EBIT margin (%) 6.9 3.3 3.6pt
Store numbers (incl. Kmart Tyre & Auto) 438 446
EBIT margin (%) 6.9 3.3 3.6pt
Store numbers (incl. Kmart Tyre & Auto) 438 446
Outlook
• Continue to reset the foundations– Renewal remains active
O i i t t i fi i th t i f th b i – Ongoing investment in fixing the core metrics of the business model
• Next phase of Growth commenced– Inviting customers to reconsider Kmart – “Expect Change”
2424
• Moderate sales growth in short term– Continued impact of business reset and cycling of Australian
government stimulus

Resources – 2010 Half Year Performance
Highlights Financial Performance• Continued improvement in safety performance Half Year ended 31 December (A$m) 2009 2008
Revenue 624 1 427 (56 3)
2009 2008
Revenue 624 1 427 (56 3)
%%
• $286m Curragh expansion to 8.0 - 8.5mtpa export capacity approved
• Blackwater Creek achieved practical completion
Revenue 624 1,427 (56.3)
EBITDA 61 715 (91.5)
Depreciation & Amortisation* (59) (51) (15.7)
EBIT# * 2 664 (99.7)
Revenue 624 1,427 (56.3)
EBITDA 61 715 (91.5)
Depreciation & Amortisation* (59) (51) (15.7)
EBIT# * 2 664 (99.7)
Outlook
• Curragh cost reduction programmes on track
– Mine cash costs (A$/t) reduced 8% in 1H10 v 1H09
2 664 (99.7)
ROC (R12 %)* 20.6 92.6 (72.0)pt
Coal Production (‘000 tonnes) 7,278 7,938 (8.3)
Safety (R12 LTIFR)^ 2.3 5.0
2 664 (99.7)
ROC (R12 %)* 20.6 92.6 (72.0)pt
Coal Production (‘000 tonnes) 7,278 7,938 (8.3)
Safety (R12 LTIFR)^ 2.3 5.0Outlook
*Restated in 2008 following Stanwell royalty accounting change; Stanwell royalty now appears in EBITDA# 2009 incl. carried-forward locked-in exchange rate losses of $65m (2008: nil) and Stanwell royalty expense of $106m (2008: $66m)^ Curragh and Premier only
• Strong signs of recovery from global financial crisis
– Global steel production recovery and increased t ll gi l l d dmetallurgical coal demand
– Cost pressures likely to re-emerge
• Forecast Curragh metallurgical sales increased to 6 3 6 8 t i FY10
Forecast Curragh Metallurgical Coal Sales
Hard47%
Semi Hard22%Hard
47%
Semi Hard22%
6.3 – 6.8mt in FY10
– Estimated sales mix (Hard 47%; Semi-Hard 22%; PCI 31%)
• Awaiting JFY 2010 price negotiation outcomes
FY2010 estimate
6.3 – 6.8 million tonnes
25
PCI31%PCI31%
• Improved earnings performance in 2H10
• Curragh cost reduction programmes ongoing

Insurance – 2010 Half Year PerformanceHighlights Financial Performance
• Underlying earnings improvement after adjusting for:
– Impact of lower interest rates on investment income (A$19m)
Half Year ended 31 December (A$m) 2009 2008^
Revenue 868 864 0.5
2009 2008^
Revenue 868 864 0.5
%%
Impact of lower interest rates on investment income (A$19m)
– Losses associated with builders warranty run-off (A$6m)
• Strong improvements in Lumley Australia and New Zealand
EBITA Underwriting 38 47 (19.1)
EBITA Broking 25 28 (10.7)
EBITA Other* - - -
EBITA Insurance Division 63 75 (16.0)
EBITA Underwriting 38 47 (19.1)
EBITA Broking 25 28 (10.7)
EBITA Other* - - -
EBITA Insurance Division 63 75 (16.0)
– Improved risk selection, premium rate increases and benign weather conditions
• Progress on growth opportunities
EBITA Insurance Division 63 75 (16.0)
EBIT Insurance Division 58 67 (13.4)
Net Earned Loss Ratio (%) 64.2 68.9 4.7 pt
Combined Operating Ratio (%) 97.0 98.7 1.7 pt
EBITA Margin (Broking) (%) 25 2 27 2 (2 0) pt
EBITA Insurance Division 63 75 (16.0)
EBIT Insurance Division 58 67 (13.4)
Net Earned Loss Ratio (%) 64.2 68.9 4.7 pt
Combined Operating Ratio (%) 97.0 98.7 1.7 pt
EBITA Margin (Broking) (%) 25 2 27 2 (2 0) pt
Outlook
*Other includes other activities and corporate costs^ Restated as a result of reallocation of corporate costs to Other
• Economic conditions and lower interest rates constrained broking income
EBITA Comparison
EBITA Margin (Broking) (%) 25.2 27.2 (2.0) ptEBITA Margin (Broking) (%) 25.2 27.2 (2.0) pt
A$m• Further benefits expected from Lumley business
improvement initiatives
• Move from La Nina to El Nino cycle potentially beneficial to claims
A$m
to claims
• Commercial premium rate environment likely to remain competitive
• Any interest rate increase to have a positive impact on
26
Any interest rate increase to have a positive impact on investment income
• Recent management appointments in Broking to leverage capabilities
1. Impact of lower interest rates on fixed income investments (excludes hedge on OCR)
2. Impact of weakening GBP/AUD and NZD/AUD exchange rates and other items
21

Chemicals & Fertilisers – 2010 Half Year PerformanceChemicals & Fertilisers 2010 Half Year PerformanceHighlights Financial Performance
• Ammonia production returned to historical levels Half Year ended 31 December (A$m) 2009 20082009 2008 %%
following restoration of full gas supply from 1 July 2009
• Strong demand for ammonium nitrate and sodium cyanide
Revenue Chemicals 292 291 0.3
Fertilisers 141 167 (15.6)
433 458 (5.5)
EBITDA 57 34 67.6
Revenue Chemicals 292 291 0.3
Fertilisers 141 167 (15.6)
433 458 (5.5)
EBITDA 57 34 67.6
• Fertiliser volumes up 17 per cent indicating return to traditional levels of nutrient application
• A$25 million 1H10 fertiliser inventory write-down
Depreciation & Amortisation (30) (30) -
EBIT 27 4 575.0
Sales Volume (‘000t): Chemicals 385.3 334.4 15.2
Fertilisers 263 8 225 7 16 9
Depreciation & Amortisation (30) (30) -
EBIT 27 4 575.0
Sales Volume (‘000t): Chemicals 385.3 334.4 15.2
Fertilisers 263 8 225 7 16 9A$25 million 1H10 fertiliser inventory write down
• A$4 million profit on sale of Mt Weld phosphate rock assets
O tl k
Fertilisers 263.8 225.7 16.9
ROC (R12 %) 6.2 7.3 (1.1)pt
Safety (R12 LTIFR) 2.6 2.2
Fertilisers 263.8 225.7 16.9
ROC (R12 %) 6.2 7.3 (1.1)pt
Safety (R12 LTIFR) 2.6 2.2
Outlook• Reasonable growth in demand for mining chemicals
expected
C i i i f di id i d l d • Commissioning of sodium cyanide expansion delayed until 2H10 due to equipment issues
• FEED study to expand ammonium nitrate production at K i i
27
Kwinana progressing
• Customer “terms of trade” and seasonal break critical for fertilisers
Industrial & Safety – 2010 Half Year PerformanceIndustrial & Safety 2010 Half Year Performance
Highlights Financial Performance
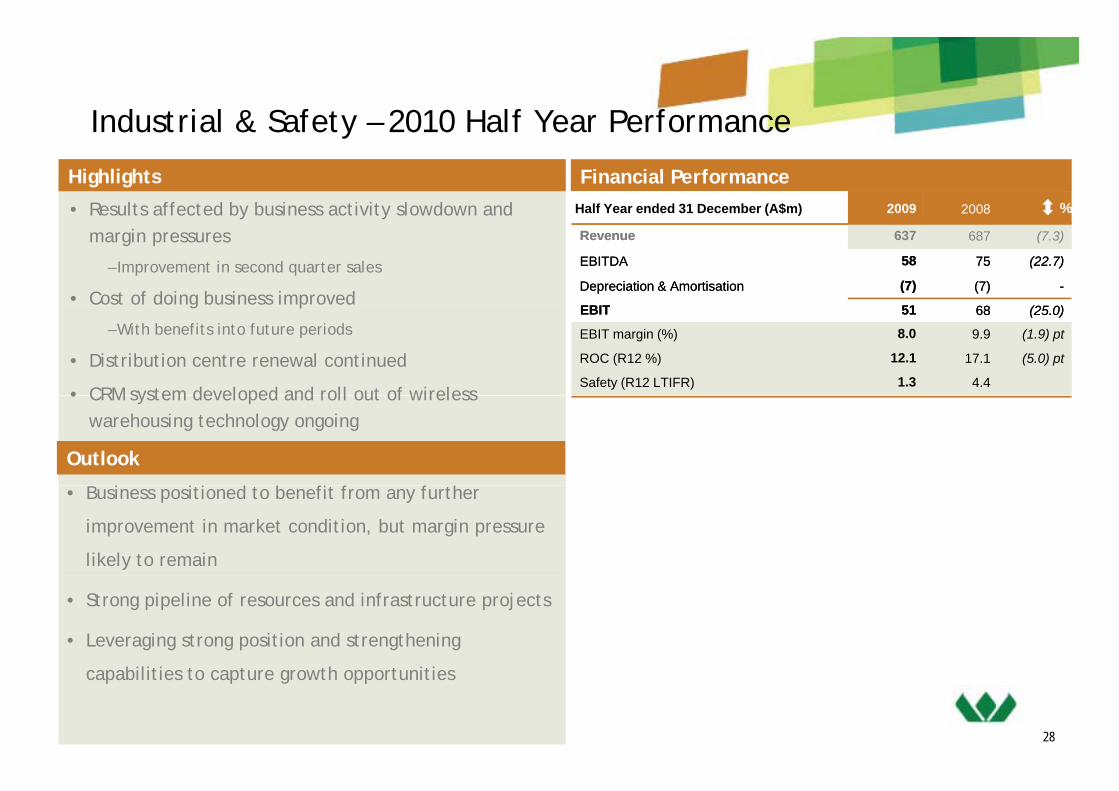
• Results affected by business activity slowdown and Half Year ended 31 December ($m) 2009 2008Half Year ended 31 December (A$m) 2009 2008 %%y ymargin pressures
– Improvement in second quarter sales
• Cost of doing business improved
Revenue 637 687 (7.3)
EBITDA 58 75 (22.7)
Depreciation & Amortisation (7) (7) -
EBIT 51 68 (25 0)
Revenue 637 687 (7.3)
EBITDA 58 75 (22.7)
Depreciation & Amortisation (7) (7) -
EBIT 51 68 (25 0)g p
– With benefits into future periods
• Distribution centre renewal continued
• CRM system developed and roll out of wireless
EBIT 51 68 (25.0)
EBIT margin (%) 8.0 9.9 (1.9) pt
ROC (R12 %) 12.1 17.1 (5.0) pt
Safety (R12 LTIFR) 1.3 4.4
EBIT 51 68 (25.0)
EBIT margin (%) 8.0 9.9 (1.9) pt
ROC (R12 %) 12.1 17.1 (5.0) pt
Safety (R12 LTIFR) 1.3 4.4
Outlook
• CRM system developed and roll out of wireless warehousing technology ongoing
d b f f f h• Business positioned to benefit from any further
improvement in market condition, but margin pressure
likely to remain
• Strong pipeline of resources and infrastructure projects
• Leveraging strong position and strengthening
28
capabilities to capture growth opportunities
Energy – 2010 Half Year Performance
Highlights
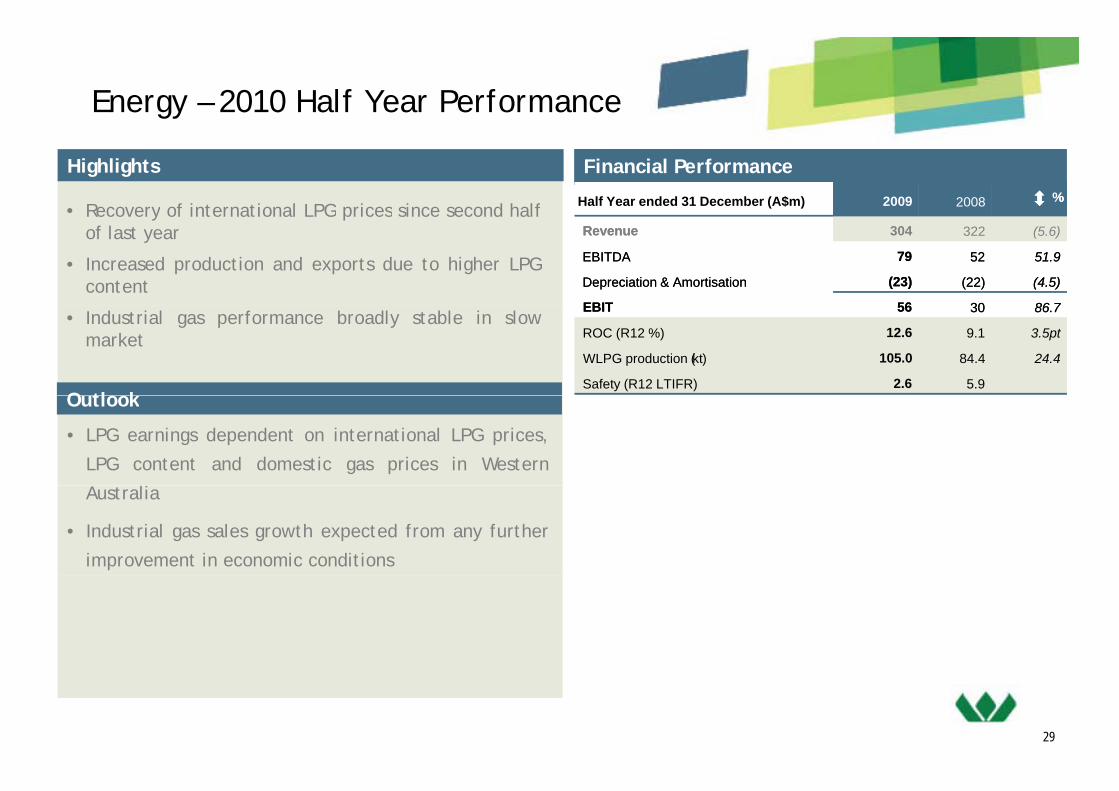
• Recovery of international LPG prices since second half
Financial Performance
Half Year ended 31 December ($m) 2009 2008Half Year ended 31 December (A$m) 2009 2008 %%Recovery of international LPG prices since second halfof last year
• Increased production and exports due to higher LPGcontent
Revenue 304 322 (5.6)
EBITDA 79 52 51.9
Depreciation & Amortisation (23) (22) (4.5)
EBIT 56 30 86 7
Revenue 304 322 (5.6)
EBITDA 79 52 51.9
Depreciation & Amortisation (23) (22) (4.5)
EBIT 56 30 86 7• Industrial gas performance broadly stable in slow
market
O tl k
EBIT 56 30 86.7
ROC (R12 %) 12.6 9.1 3.5pt
WLPG production (kt) 105.0 84.4 24.4
Safety (R12 LTIFR) 2.6 5.9
EBIT 56 30 86.7
ROC (R12 %) 12.6 9.1 3.5pt
WLPG production (kt) 105.0 84.4 24.4
Safety (R12 LTIFR) 2.6 5.9Outlook
• LPG earnings dependent on international LPG prices,
LPG content and domestic gas prices in Western
Australia
• Industrial gas sales growth expected from any further
improvement in economic conditions
29

Other Businesses – 2010 Half Year PerformanceOt e us esses 0 0 al ea e o a ceHighlights Financial Performance
Gresham Private EquityHalf Year ended 31 December (A$m) Holding
% 2009 2008
Gresham Private Equity
• Carrying value of investment in Gresham Private Equity Funds A$166m
Associates share of profit/(loss):
Gresham Private Equity Funds Various 29 (1)
Gresham Partners 50 2 1
Wespine 50 4 4
Bunnings Warehouse Property Trust 23 10 (5)• Investments held in diverse range of industries
• Quarterly revaluations of remaining investments are to Wesfarmers’ earnings and are non-cash in
Bunnings Warehouse Property Trust 23 10 (5)
Sub-total 45 (2)
Interest revenue 29 22
Non-trading items^ (39) (79)
Other* (4) (79)
^ Kmart DC closure and restructure costs A$33m (2008: A$14m), Coles property write downs A$6m (2008: A$64m)
* Includes Bunnings Property Management Limited, self insurance and other investments
nature Total 31 (138)
Interest Revenue
• Reflects increased level of funds on deposit
Other
• Change in discount rate last year increased the level of self insurance provisions required
Last year also included write downs in carrying
30
• Last year also included write-downs in carrying value of other smaller investments

Operating DivisionsOperating Divisions

Coles
32
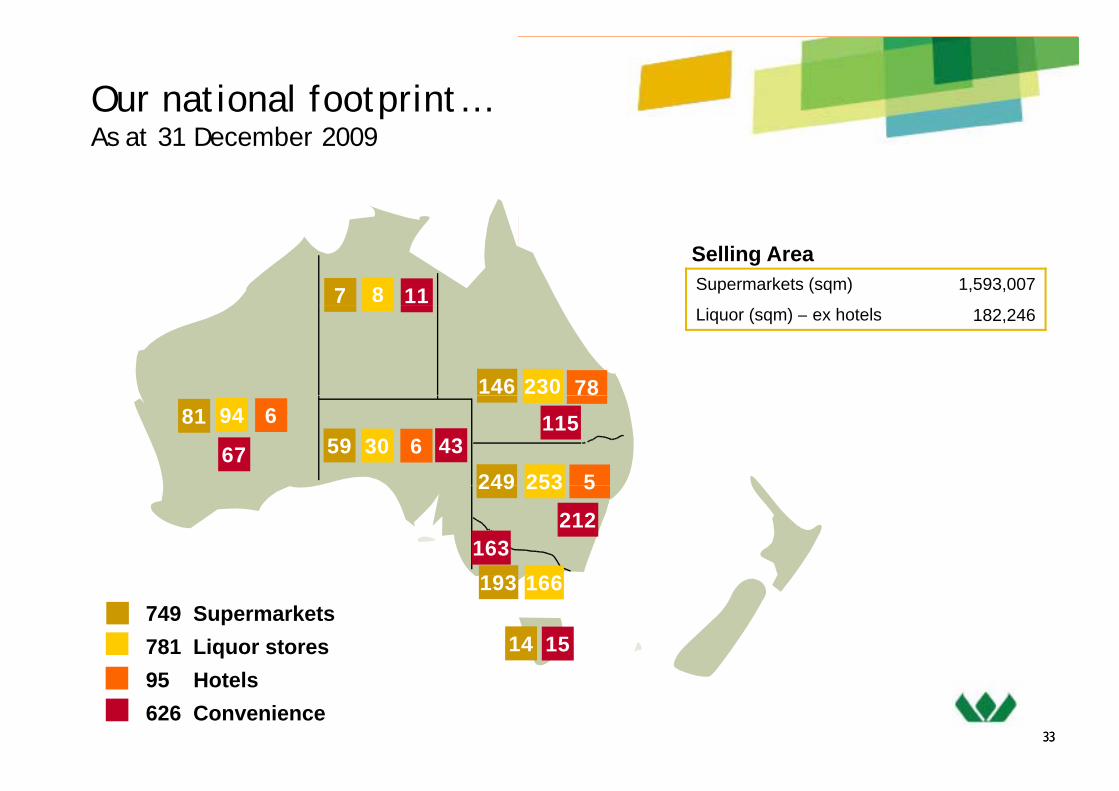
Our national footprint…bAs at 31 December 2009
Supermarkets (sqm) 1,593,007Selling Area
7 8 11Liquor (sqm) – ex hotels 182,246
146 78230
249 5253
59 63081 694
67 43115
249 5253
193 166
212163
749 Supermarkets781 Liquor stores
193 166
14 15
3333
95 Hotels626 Convenience

Coles – Strategy5 years – 3 phases of recovery
Building a Solid F d ti
Delivering C i t tl W ll
Driving the Coles Diff
PerformanceFoundation Consistently Well Difference
• Embed the new culture• Culture of continuous improvement
• Create a strong top team
• Cultural change
• Availability & store standards
• Team member development
• Improved customer service
• Improved efficiency
• Strong customer trust and loyalty
• Strong operational efficiencyAvailability & store standards
• Value and customer trust
• Renewal store development
• Improved efficiency
• Appealing Fresh food offer
• Stronger delivery of value
Strong operational efficiency
• Innovative & Improved offer
• New stores, new categories
• IT & supply chain infrastructure
• Liquor renewal
• Efficient use of capital
• Scale rollout of new format
• Auto replenishment completed
34Year 1 - 2 Year 2 - 4 Year 4 - 5+
Efficient use of capital

Coles – StrategyPh 1 PPhase 1 ProgressCreate a strong top team Further executive appointments, creating strength and depth of top team
Appointed over 150 new regional and store managersTalent mapping to identify & promote future leaders
Cultural change Improved incentives for store managementLabour turnover down, absenteeism falling
Availability & store standards Improvement in on-shelf availability continuing On-going investment in store standardsContinued focus on customer service
V l d t t t Improvements in range and quality of Coles brand productsValue and customer trust Improvements in range and quality of Coles brand products Strong reinvestment in prices
Renewal store development Renewal progress continuing with 40+ stores trading at Dec 09.
IT & supply chain infrastructure Physical change in supply chain broadly complete Delivery times fallingEasy Order in 40+ stores, targeting 200 stores by June 2010
Liquor renewal Distinctive multi-brand strategyLiquor renewal Distinctive multi brand strategyIncreased volumes across all brands through improved value positioningProgressive store renewal
Efficient use of capital Improved working capital Disciplined approach to capital expenditure
35
Disciplined approach to capital expenditure

Home Improvement & Office Supplies
36

Bunnings Networkat 31 December 2009
181 Warehouse stores181 Warehouse stores
58 Small format stores
25 Trade Centres2
29 6 823
9
297
3
6 8
23
55
44
13
16
25
6
5
44
2 14
6
1
37

Bunnings sales & EBIT growth
Sales ($m) EBIT ($m)
Acquisition of BBC
1st Warehouse
38

Home Improvement Performance
Growth Strategies 700EBIT A$m
35ROC %
H I S i
400
500
600
20
25
30Home Improvement StrategiesProfitable sales growth Lifting customer service
Enhanced merchandising
Network expansion & enhancement
Better stock flow Improving the end to end supply chain to lift in-stock levels, reduce costs
and increase productivity
100
200
300
5
10
15Engaging and developing a strong team
Focus on reducing the cost of doing business through the continued
development of systems and other business improvement and productivity
projects
Lifting effectiveness and efficiency
and increase productivity
Effective delivery of safety, training and other team development
programmes
0
2006 2007 2008 2009 2010
0
First HY EBIT Full Year EBIT Return on Capital (R12)
Sustainability focus
Improving affordability of sustainability projects for customers
Continued commitment to reducing water, energy consumption and
wastage
(A$m) 2006 2007 2008 2009 1H10
Revenue 4,276 4,939 5,359 5,845 3,402
EBIT 421 528 589 659 422
EBIT/Revenue Ratio 9.8% 10.7% 11.0% 11.3% 12.4%
39

Office Supplies
Officeworks & Harris Technology Networkas at 31 December 2009Officeworks Strategies
Growth Strategies
Enhance and expand the range (products & services)
Provide more useful customer information
Eco friendly products & services
Special orders service rollout
New point of sale system
Improving the customer offer
Improving customer
118
251
1 11
New point of sale system
Driving stronger customer focus
Provide team with tools & training
New labour scheduling system
Investing process efficiencies back in to customer service
Improving customer service
Retail Stores
42
39
2
1 1
1 2
1
Strong focus on team members; investment in training
Significant lift in 'cultural engagement'
Reward & recognition
Developing, attracting & retaining the best
Stock management improvements
Team development & engagement
Reduced costs and 127 Officeworks5 Harris Technology
4 Fulfilment CentresBusiness
2
Stock management improvements
Supply chain productivity & CODB gains
Reduction in store support cost base
Processes & procedures simplified, complexity removed
Open 8 to 10 new Officeworks stores p.a.Drive sales and
Reduced costs and complexity
4 Fulfilment Centres3 Service CentresUpgrade 8 to 10 existing stores p.a.
Further website enhancements
Attracting new business customers
profitability
40

Target
41
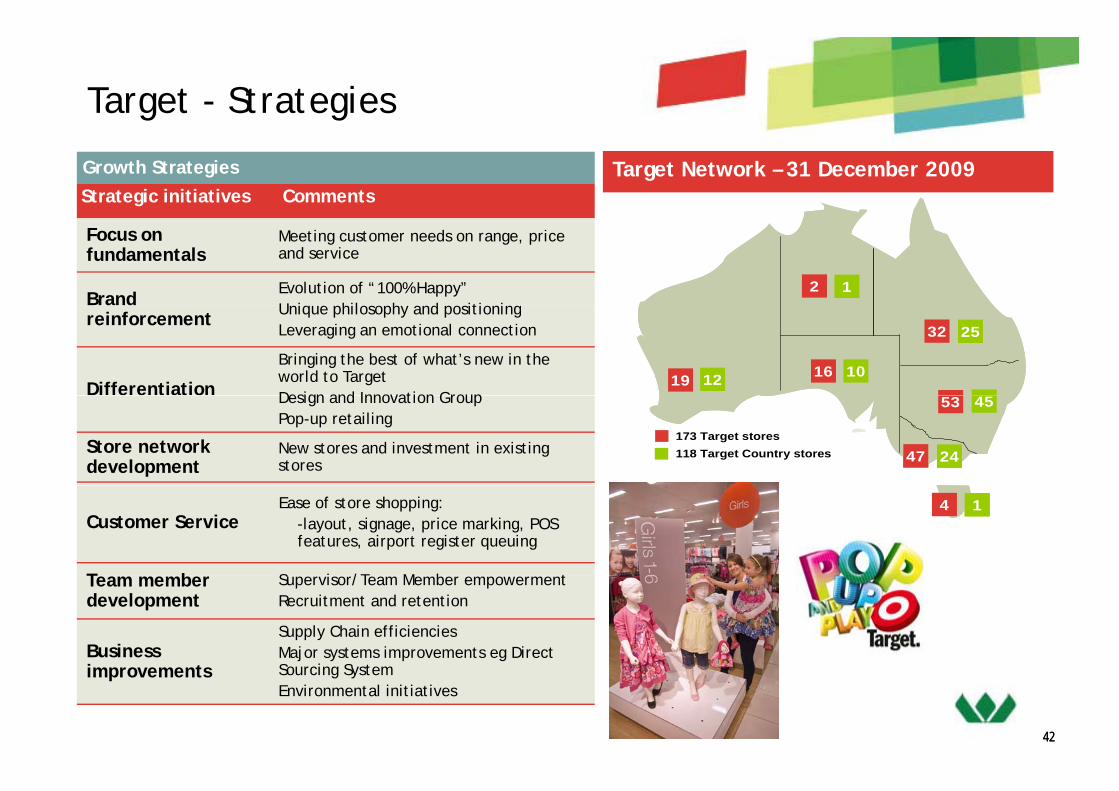
Target - Strategies
Strategic initiatives CommentsTarget Network – 31 December 2009Growth Strategies
Focus on fundamentals
Meeting customer needs on range, price and service
Brand Evolution of “100% Happy”Uniq e philosoph and positioning
2 12 1
reinforcement Unique philosophy and positioningLeveraging an emotional connection
Differentiation
Bringing the best of what’s new in the world to TargetDesign and Innovation Group
19 16
32
12 10
25
19 16
32
12 10
25
Design and Innovation GroupPop-up retailing
Store network development
New stores and investment in existing stores 47
53 45
2447
53 45
24173 Target stores118 Target Country stores
Customer ServiceEase of store shopping:
-layout, signage, price marking, POS features, airport register queuing
T b S i /T M b t
4 14 1
Team member development
Supervisor/Team Member empowermentRecruitment and retention
Business i t
Supply Chain efficiencies Major systems improvements eg Direct S i S t
4242
improvements Sourcing SystemEnvironmental initiatives

Kmart
43

Kmart Store Networkat 31 December 2009
186 Kmart stores252 KTAS centres
2
36 52
3
21 28
36 52
13 1913 19
51 71
43 73
5 6
12
4444
5 6 3
44
Kmart Strategies
Growth Strategies
Customer
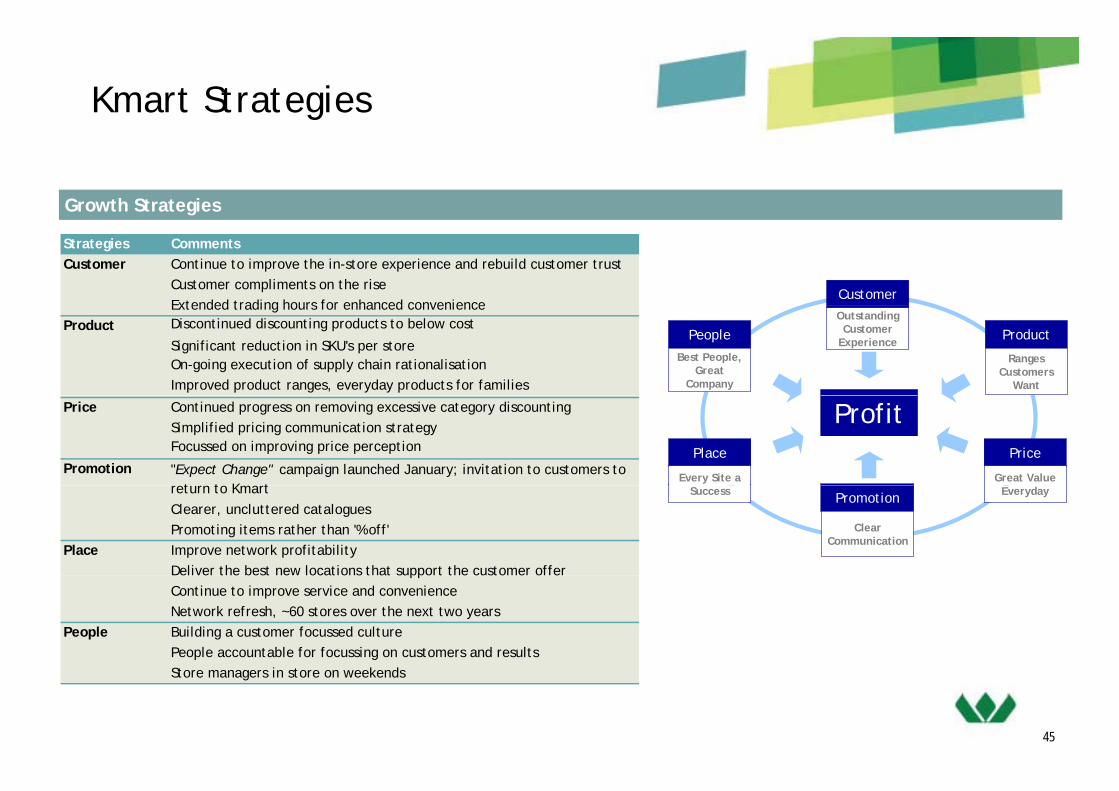
Strategies CommentsCustomer Continue to improve the in-store experience and rebuild customer trust
Customer compliments on the riseExtended trading hours for enhanced convenience
People
Best People, Great
Company
Product
Ranges Customers
Want
Outstanding Customer
Experience
Extended trading hours for enhanced convenienceProduct Discontinued discounting products to below cost
Significant reduction in SKU's per storeOn-going execution of supply chain rationalisationImproved product ranges, everyday products for families
Place
Every Site a
Price
Great Value
ProfitPrice Continued progress on removing excessive category discountingSimplified pricing communication strategyFocussed on improving price perception
Promotion "Expect Change" campaign launched January; invitation to customers to t t K t Success EverydayPromotion
Clear Communication
Clearer, uncluttered cataloguesPromoting items rather than '% off'
Place Improve network profitabilityDeliver the best new locations that support the customer offer
return to Kmart
Deliver the best new locations that support the customer offerContinue to improve service and convenienceNetwork refresh, ~60 stores over the next two years
People Building a customer focussed culturePeople accountable for focussing on customers and results
4545454545
Store managers in store on weekends

Resources
46

Resources - Locations
Coal
Premier Coal
Curragh
47
Bengalla (40%)
Resources - Performance
Growth Strategies1,000EBIT A$m
90ROC %
Opportunities Strategies
600
700
800
900
0
60
70
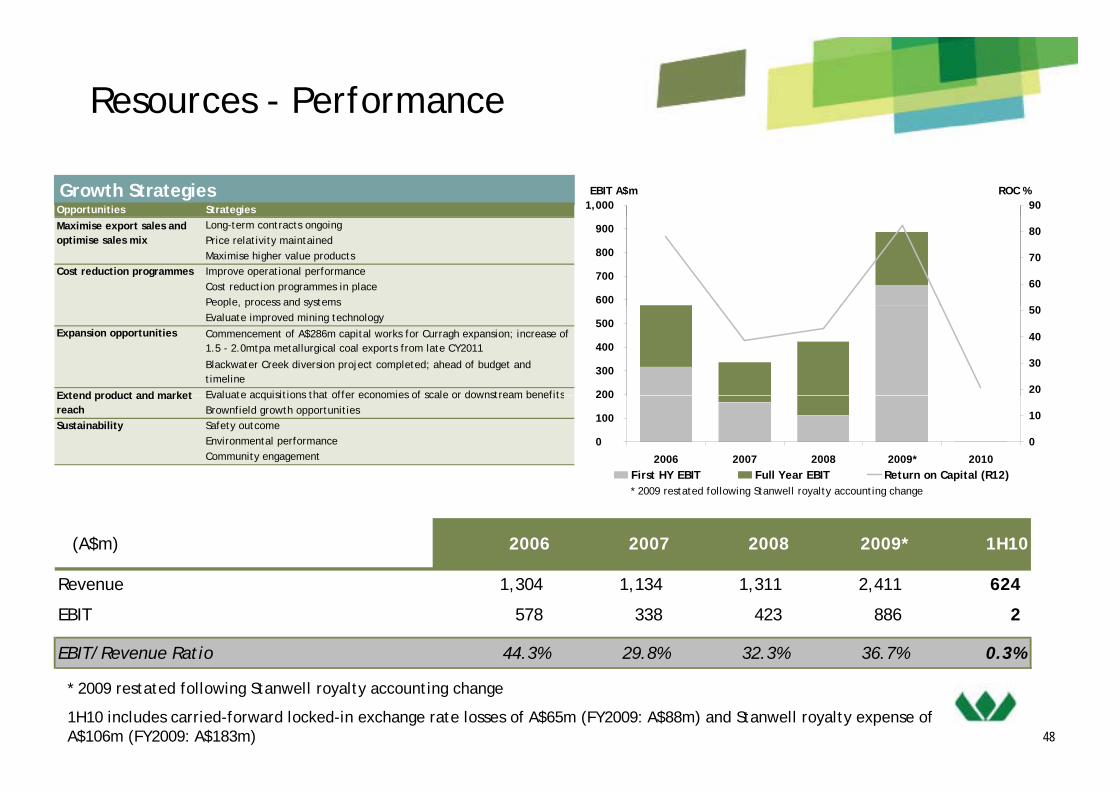
80Long-term contracts ongoingPrice relativity maintainedMaximise higher value products
Cost reduction programmes Improve operational performanceCost reduction programmes in placePeople, process and systems
Maximise export sales and optimise sales mix
200
300
400
500
20
30
40
50p , p y
Evaluate improved mining technologyExpansion opportunities
Evaluate acquisitions that offer economies of scale or downstream benefits
Blackwater Creek diversion project completed; ahead of budget and timeline
Commencement of A$286m capital works for Curragh expansion; increase of 1.5 - 2.0mtpa metallurgical coal exports from late CY2011
Extend product and market
0
100
200
2006 2007 2008 2009* 2010
0
10
First HY EBIT Full Year EBIT Return on Capital (R12)
Evaluate acquisitions that offer economies of scale or downstream benefitsBrownfield growth opportunities
Sustainability Safety outcomeEnvironmental performanceCommunity engagement
Extend product and market reach
* 2009 restated following Stanwell royalty accounting change
(A$m) 2006 2007 2008 2009* 1H10
Revenue 1,304 1,134 1,311 2,411 624
EBIT 578 338 423 886 2
EBIT/Revenue Ratio 44.3% 29.8% 32.3% 36.7% 0.3%
48
* 2009 restated following Stanwell royalty accounting change
1H10 includes carried-forward locked-in exchange rate losses of A$65m (FY2009: A$88m) and Stanwell royalty expense of A$106m (FY2009: A$183m)

Resources - SalesHard Coking Coal Prices (US$/t FOB Australia)
300
350
400
Coal Sales Volumes by Mine (FY09)
Mine
(mtpa)Total
Domestic Steaming
Export Steaming
Export Metallurgical
100
150
200
250
300
Curragh, QLD 3.3^ n.a. 6.5 9.8
Premier, WA 3.4 n.a. n.a. 3.4
B ll * NSW 0 2 1 8 2 1
Spot Price Annual Reference Price
0
50
2003 2004 2005 2006 2007 2008 2009 2010
Bengalla*, NSW 0.2 1.8 n.a. 2.1
Total 6.9 1.8 6.5 15.2
* Wesfarmers interest of 40% Includes 935kt of export steaming sales of which 400kt was diverted to metallurgical coal (PCI)
Historic Coal Sales Volumes by Mine
Source: Barlow Jonker, Tex Report, Macquarie Research, CRU Includes 935kt of export steaming sales of which 400kt was diverted to metallurgical coal (PCI)n.a. = not applicable to this site
mt
9121518
0369
49
0
2006 2007 2008 2009 1H10Curragh (Met) Curragh (Steam) Bengalla 40% (Steam) Premier (Steam)

Hedging profile as at 31 December 2009
Curragh – Open Contracts Bengalla – Open Contracts
Year end 30 Jun
Current US$ sold forward
(US$m)
AverageA$ / US$
hedge rate
Year end 30 Jun
Current US$ sold forward
(US$m)
AverageA$ / US$
hedge rate
Curragh Open Contracts Bengalla Open Contracts
(US$m) hedge rate
2010* 220 0.81
(US$m) hedge rate
2010* 42 0.80
2011 330 0.79
2012 62 0.80
2011 73 0.80
2012 34 0.77
2013 24 0.76
* Represents six month period ending 30 June 2010
2013 10 0.78
* Represents six month period ending 30 June 2010 Represents six month period ending 30 June 2010 Represents six month period ending 30 June 2010
Cl d t t A i l d i d i N b 2008 f d h t t ‘ l d t’
50
Closed contracts: As previously advised, in November 2008 some forward exchange contracts were ‘closed-out’.
A$20m locked-in losses remain and will be booked in 2H10.

Insurance
51
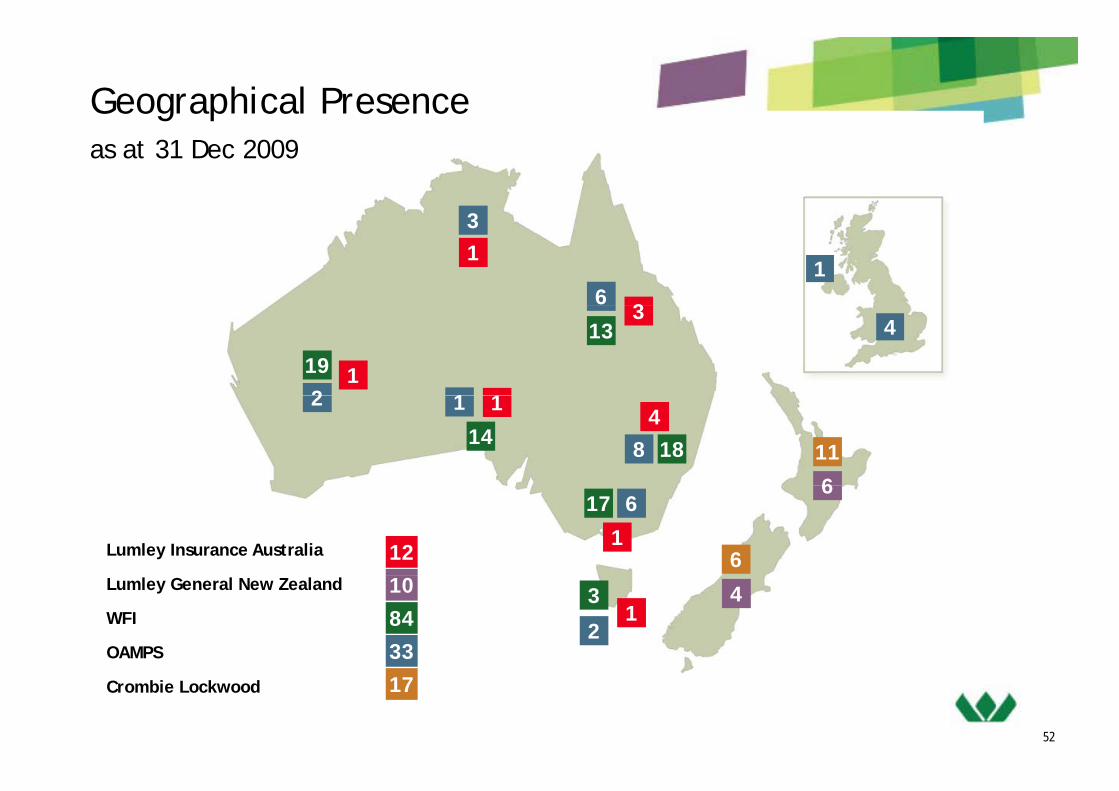
Geographical Presence
3
as at 31 Dec 2009
3
6
1
3
1
4
19
13
2 11
1
3
14 18
2
8
1
11
6
14
17 6
6
6
1Lumley Insurance Australia 12
3
2
41
Lumley General New Zealand
WFI
OAMPS
8433
10
52
Crombie Lockwood 17
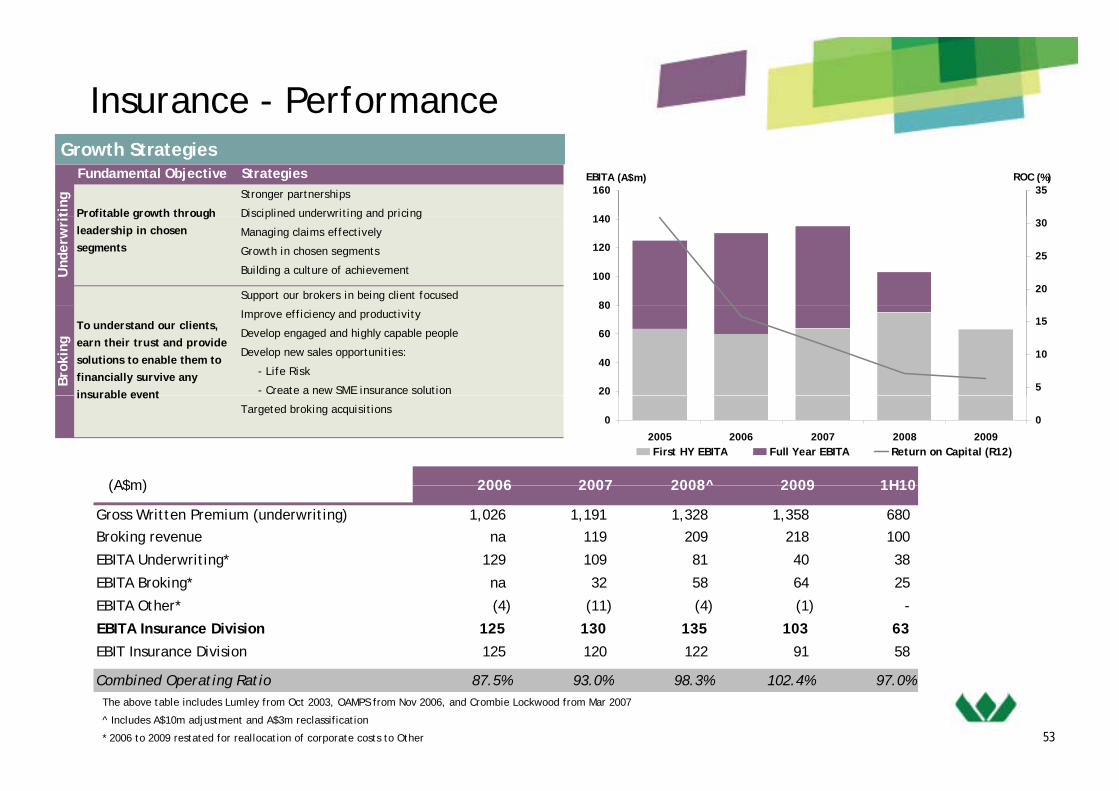
Insurance - PerformanceGrowth Strategies
140
160EBITA (A$m)
35ROC (%)Fundamental Objective Strategies
Stronger partnerships
Disciplined underwriting and pricingProfitable growth through ting
80
100
120
140
20
25
30Disciplined underwriting and pricing
Managing claims effectively
Growth in chosen segments
Building a culture of achievement
Support our brokers in being client focused
Profitable growth through leadership in chosen segments
Und
erw
rit
20
40
60
80
5
10
15Improve efficiency and productivity
Develop engaged and highly capable people
Develop new sales opportunities:
- Life Risk
- Create a new SME insurance solution
Brok
ing
To understand our clients, earn their trust and provide solutions to enable them to financially survive any insurable event
0
2005 2006 2007 2008 2009
0
First HY EBITA Full Year EBITA Return on Capital (R12)
Targeted broking acquisitionsinsurable event
(A$m) 2006 2007 2008^ 2009 1H10(A$m) 2006 2007 2008 2009 1H10
Gross Written Premium (underwriting) 1,026 1,191 1,328 1,358 680 Broking revenue na 119 209 218 100
EBITA Underwriting* 129 109 81 40 38
EBITA Broking* na 32 58 64 25
EBITA Other* (4) (11) (4) (1) -
EBITA Insurance Division 125 130 135 103 63
EBIT Insurance Division 125 120 122 91 58
53
The above table includes Lumley from Oct 2003, OAMPS from Nov 2006, and Crombie Lockwood from Mar 2007
^ Includes A$10m adjustment and A$3m reclassification
* 2006 to 2009 restated for reallocation of corporate costs to Other
Combined Operating Ratio 87.5% 93.0% 98.3% 102.4% 97.0%

Insurance – Underwriting PerformanceInsurance Underwriting Performance
Key Performance Indicators 1H10 Gross Written Premium by Class of BusinessKey Performance Indicators
Liability Personal
Total $680m
Liability Personal
Total $680mTotal $680mHalf Year ended 31 December (%) 2009 2008^
Gross Earned Loss Ratio 66.3 68.0 1.7
Net Earned Loss Ratio 64 2 68 9 4 7
Half Year ended 31 December (%) 2009 2008^
Gross Earned Loss Ratio 66.3 68.0 1.7
Net Earned Loss Ratio 64 2 68 9 4 7
%pt%pt
1H10 Gross Written Premium by Class of Business
y$139m
Marine $31m
E i iCommercial
$125my
$139m
Marine $31m
E i iCommercial
$125mNet Earned Loss Ratio 64.2 68.9 4.7
Reinsurance Expenses (% GEP) 23.4 21.9 (1.5)
Exchange Commission (% RI excl XOL) 23.3 24.1 (0.8)
Commission Expense (% GWP) 13.8 13.9 0.1
Net Earned Loss Ratio 64.2 68.9 4.7
Reinsurance Expenses (% GEP) 23.4 21.9 (1.5)
Exchange Commission (% RI excl XOL) 23.3 24.1 (0.8)
Commission Expense (% GWP) 13.8 13.9 0.1Engineering
$35m
AMO $25m
Crop $22mCommercial Motor $155m
Commercial $148m
Engineering $35m
AMO $25m
Crop $22mCommercial Motor $155m
Commercial $148mTotal Earned Expenses (% GEP) 29.4 27.3 (2.1)
Combined Operating Ratio (% NEP) 97.0 98.7 1.7
Insurance Margin (% NEP) 5.7 6.9 (1.2)
Total Earned Expenses (% GEP) 29.4 27.3 (2.1)
Combined Operating Ratio (% NEP) 97.0 98.7 1.7
Insurance Margin (% NEP) 5.7 6.9 (1.2)
Motor $155mMotor $155m^ Restated as a result of reallocation of corporate costs to Other
54

Chemicals & Fertilisers
5555

Chemicals & Fertilisers - LocationsChemicals & Fertilisers Locations
■ CSBP fertilisers■ CSBP fertilisersManufacturing plant 5
Import and distribution centres 5
Depots 6p
Regional Sales Representatives 27
Sales agents 135
■ CSBP chemicalsManufacturing plants 10
■ AV Manufacturing plants 2
■ QNP (50%)f i lManufacturing plants 4
56
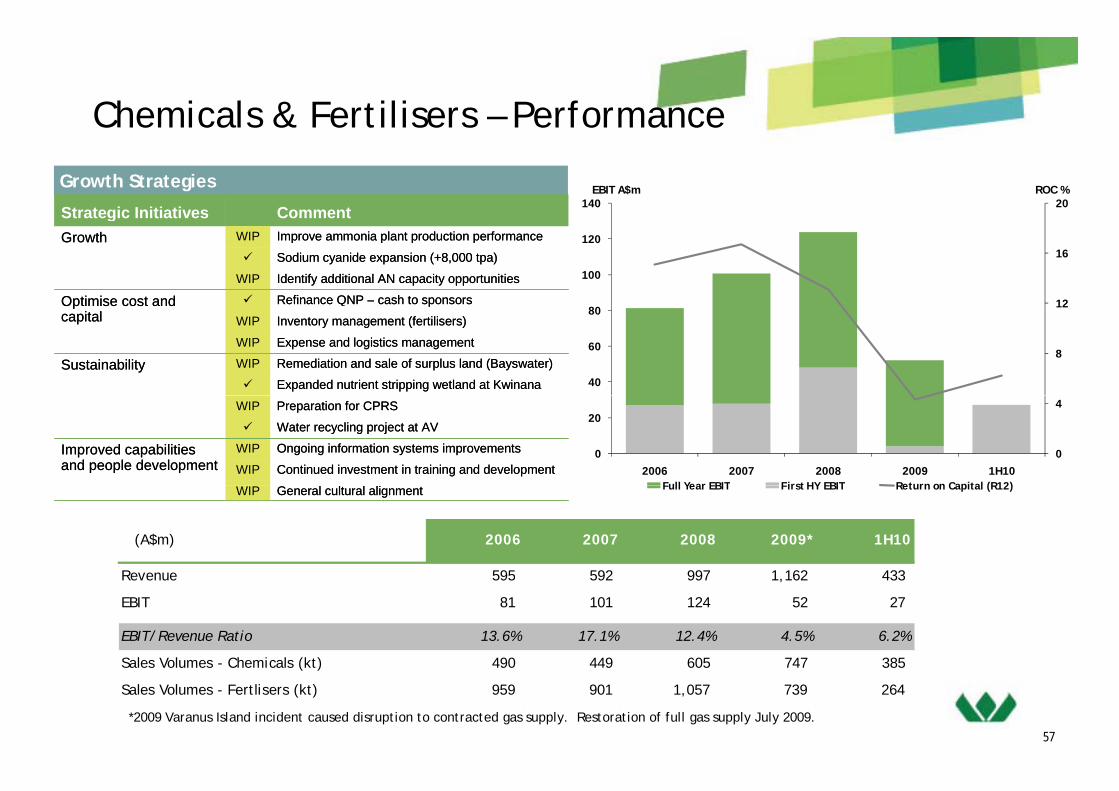
Chemicals & Fertilisers – PerformanceChemicals & Fertilisers Performance
Growth Strategies
Strategic Initiatives CommentStrategic Initiatives Comment 20140ROC %EBIT A$m
Strategic Initiatives CommentGrowth WIP Improve ammonia plant production performance
Sodium cyanide expansion (+8,000 tpa)
WIP Identify additional AN capacity opportunities
Optimise cost and Refinance QNP – cash to sponsors
Strategic Initiatives CommentGrowth WIP Improve ammonia plant production performance
Sodium cyanide expansion (+8,000 tpa)
WIP Identify additional AN capacity opportunities
Optimise cost and Refinance QNP – cash to sponsors 12
16
100
120
Optimise cost and capital
p
WIP Inventory management (fertilisers)
WIP Expense and logistics management
Sustainability WIP Remediation and sale of surplus land (Bayswater)
Expanded nutrient stripping wetland at Kwinana
Optimise cost and capital
p
WIP Inventory management (fertilisers)
WIP Expense and logistics management
Sustainability WIP Remediation and sale of surplus land (Bayswater)
Expanded nutrient stripping wetland at Kwinana
8
12
40
60
80
WIP Preparation for CPRS
Water recycling project at AV
Improved capabilities and people development
WIP Ongoing information systems improvements
WIP Continued investment in training and development
WIP Preparation for CPRS
Water recycling project at AV
Improved capabilities and people development
WIP Ongoing information systems improvements
WIP Continued investment in training and development0
4
0
20
2006 2007 2008 2009 1H10Full Year EBIT First HY EBIT Return on Capital (R12)
(A$m) 2006 2007 2008 2009* 1H10
Revenue 595 592 997 1 162 433
WIP General cultural alignmentWIP General cultural alignment Full Year EBIT First HY EBIT Return on Capital (R12)
Revenue 595 592 997 1,162 433
EBIT 81 101 124 52 27
EBIT/Revenue Ratio 13.6% 17.1% 12.4% 4.5% 6.2%
Sales Volumes - Chemicals (kt) 490 449 605 747 385
57
Sales Volumes Chemicals (kt) 490 449 605 747 385
Sales Volumes - Fertlisers (kt) 959 901 1,057 739 264
*2009 Varanus Island incident caused disruption to contracted gas supply. Restoration of full gas supply July 2009.

Industrial & Safety Business Portfolio
Australia New Zealand
Industrial Specialists
“All your workplace needs”
Safety Specialist
(1)
58(1) Manufacturing and services
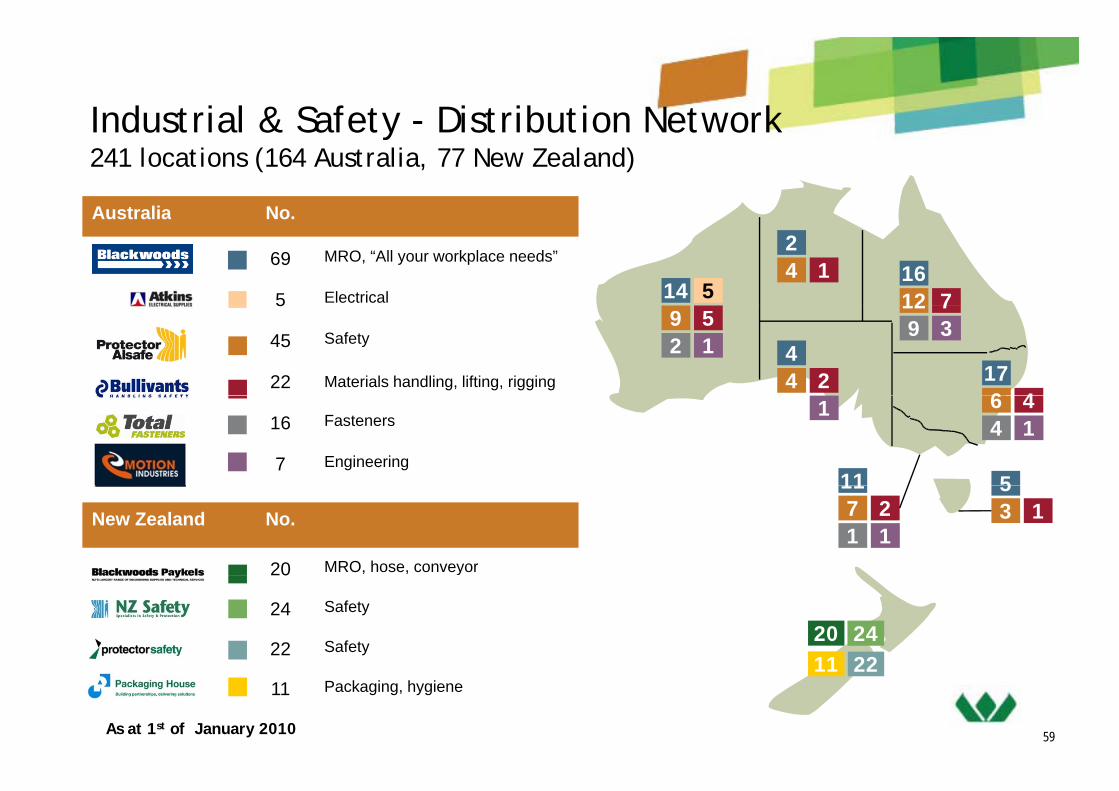
Industrial & Safety - Distribution Network
Australia No
Industrial & Safety Distribution Network241 locations (164 Australia, 77 New Zealand)
Australia No.
69 MRO, “All your workplace needs”
5 Electrical 14 5
24 1 16
12 75
45 Safety
22 Materials handling, lifting, rigging5
92 1
5
44 2 17
6 4
129 3
7
16 Fasteners
7 Engineering
1
11
64 1
4
5
New Zealand No.
20 MRO, hose, conveyor
1171 1
253 1
20 y
24 Safety
22 Safety20
221124
59
11 Packaging, hygiene2211
As at 1st of January 2010
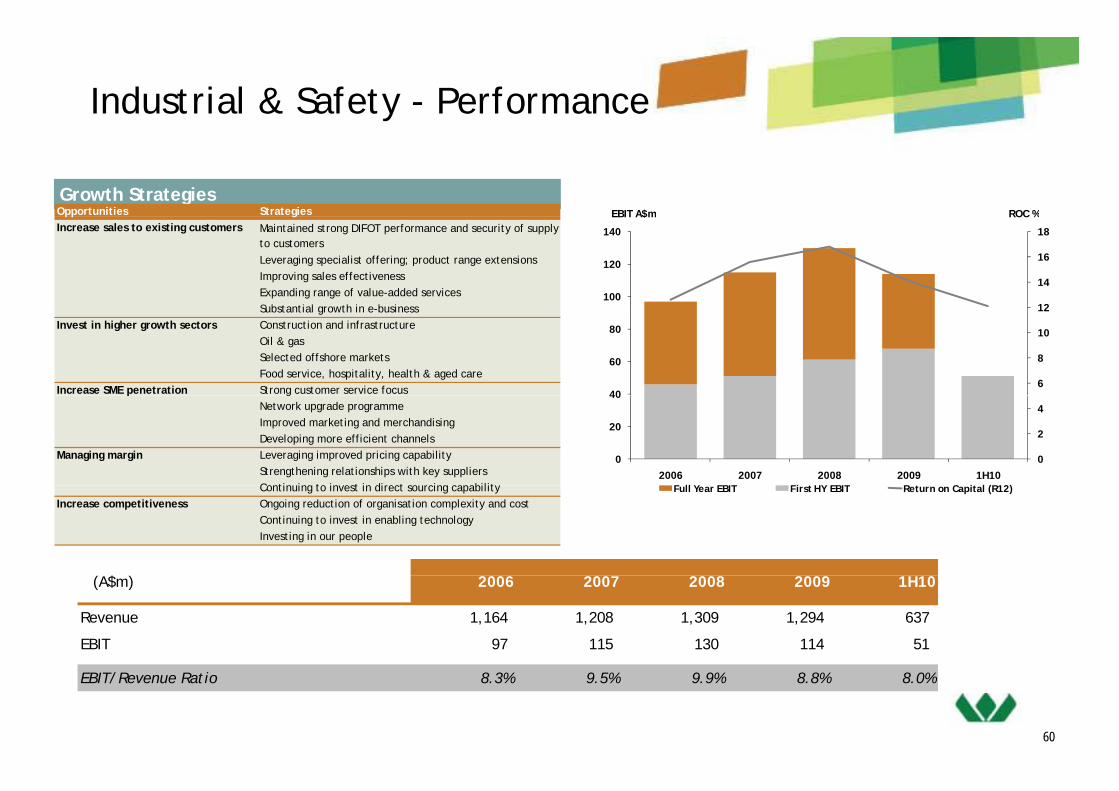
Industrial & Safety - Performance
Growth StrategiesROC %EBIT A$mOpportunities Strategies
12
14
16
18
100
120
140
ROC %EBIT A$mpp gIncrease sales to existing customers
Leveraging specialist offering; product range extensionsImproving sales effectivenessExpanding range of value-added servicesS b t ti l th i b i
Maintained strong DIFOT performance and security of supply to customers
6
8
10
12
40
60
80
Substantial growth in e-businessInvest in higher growth sectors Construction and infrastructure
Oil & gasSelected offshore marketsFood service, hospitality, health & aged care
Increase SME penetration Strong customer service focus
0
2
4
0
20
40
2006 2007 2008 2009 1H10F ll Y EBIT Fi t HY EBIT R t C it l (R12)
p gNetwork upgrade programmeImproved marketing and merchandisingDeveloping more efficient channels
Managing margin Leveraging improved pricing capabilityStrengthening relationships with key suppliersContinuing to invest in direct sourcing capability Full Year EBIT First HY EBIT Return on Capital (R12)Continuing to invest in direct sourcing capability
Increase competitiveness Ongoing reduction of organisation complexity and costContinuing to invest in enabling technologyInvesting in our people
$(A$m) 2006 2007 2008 2009 1H10
Revenue 1,164 1,208 1,309 1,294 637
EBIT 97 115 130 114 51
60
EBIT/Revenue Ratio 8.3% 9.5% 9.9% 8.8% 8.0%
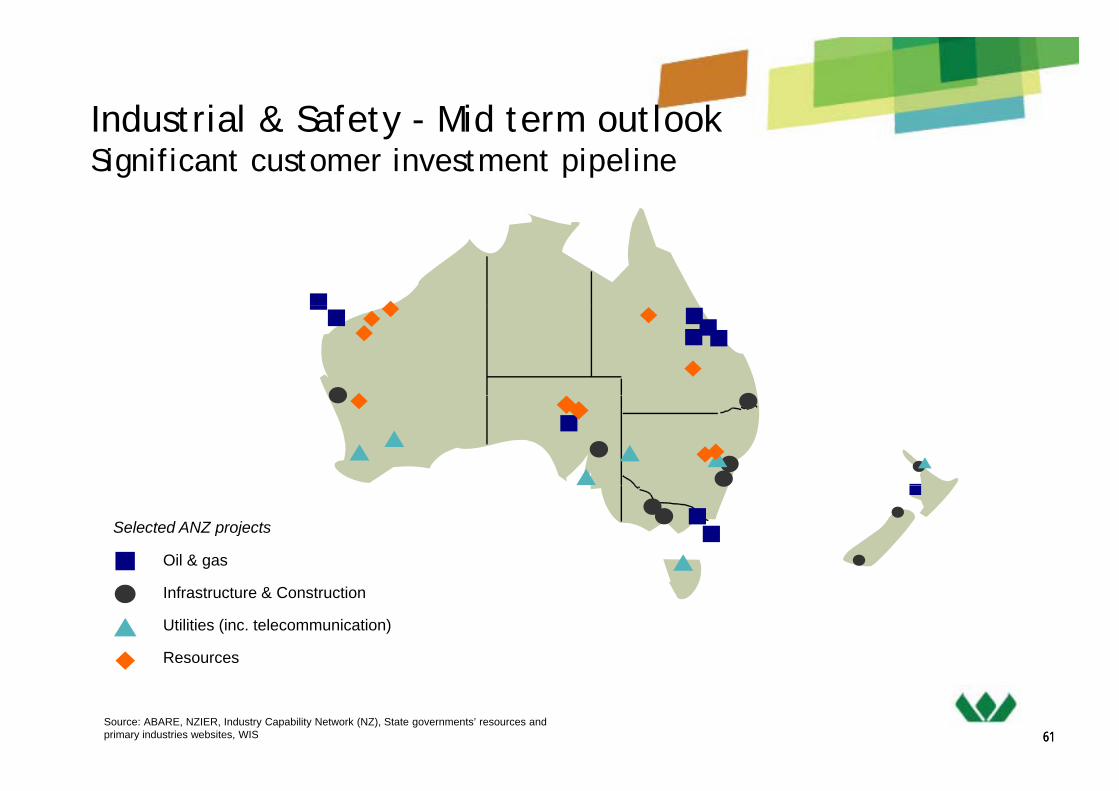
Industrial & Safety - Mid term outlookIndustrial & Safety Mid term outlookSignificant customer investment pipeline
5
Oil & gas
Selected ANZ projects
Infrastructure & Construction
Utilities (inc. telecommunication)
Resources
6161Source: ABARE, NZIER, Industry Capability Network (NZ), State governments’ resources and primary industries websites, WIS

Energy
62

Energy - locations
I d i l di l d i l Industrial, medical and specialty gasesAir separation units (ALWA)
Air separation units (Coregas)
Acetylene plant (ALWA)Acetylene plant (ALWA)
Hydrogen/acetylene plants (Coregas)
Industrial gas depots/branches (ALWA)
Industrial gas depots/branches (Coregas)1 1
121 11
LPG & LNGLPG depots/branches
LPG extraction facility2
514
195
1
111 4
LNG production facility
Power generationPower stations owned and/or operated
2 1
9 39 3
2
63

Energy - Performance
90
100EBIT A$m
30ROC %Growth Strategies
Business Strategies Update on StrategiesTargeted marketing and sales effort with Focus business on increasing
60
70
80
90
20
Renewed focus on effectiveness of sales force
Implementing supply chain improvements
D l WA h d t hi l B d i g h d t hi l t b
expanded product portfolio
Improving DIFOT, cylinder scanning performance and billing processes
market share
Improve customer experience
20
30
40
50
10
Develop WA heavy duty vehicle market to sell remaining production capacity
Broadening heavy duty vehicle customer base and progressing with refueller rollout
Raise awareness on east coast and evaluate expansion opportunities
Identified target fleets, aggregating customer information, seeking government involvement to accelerate growth and take up
0
10
2006 2007 2008 2009 1H10
0
First HY EBIT Full Year EBIT Return on Capital (R12)
Diversifying and optimising supply sources Improve distribution marketing efficiencies
Grow market share Improve marketing efficiencies
G d
Improve East Coast Supply Chain
Identify and evaluate other power generation opportunities
Evaluating power generation opportunities with enGen
Maximise LPG production
Evaluating minor investment in plant to improve operating efficiency
Negotiating most suitable gas supply for ongoing operation
(A$m) 2006 2007 2008 2009* 1H10
Revenue 372 463 565 598 304
EBIT 49 75 90 75 56
64
EBIT/Revenue Ratio 13.2% 16.2% 15.9% 12.5% 18.4%
*2009 Varanus Island incident, causing disruption to gas supply until June 2009.

Energy – Businesses
Activitiesdistributor and marketer of LPG and LNG and
Activities
MW installed: 90
Activities
Operations
design, construction, operatation andmaintenance of both company-owned andcustomer-owned power stations
Port Kembla Air Capacity:Separation Unit: 1 350 TPD Oxygen
Production, distribution and marketing ofindustrial and medical gases on Australia’s eastcoast.
Operations
124 078T LPG
distributor and marketer of LPG and LNG andgas appliances to a broad range of domestic,commercial, autogas and industrial customers
Sales Volumes
GWh generated per annum: 376Power stations: 20Customers: 6 Acetylene plant 200 m3/hr
Cylinder filling operations: 5Specialty gas laboratory 20 cylinders/dayCustomers: 9,500
Separation Unit: 1,350 TPD OxygenHydrogen Plant: 1000 m3/hr1H10 Actual:
124,078T LPG 22,327T LNG
Depots 36Branches 16Commission agents 29
Sites
ActivitiesAir Liquide WA is a joint venture betweenWesfarmers (40%) and Air Liquide Australiamanufacturing and supplying a range ofi d t i l di l d i lt
Franchisees 11Dealers 592
Customers 258,000
Air Separation Plants: Kwinana: Capacity 285 TPD Oxygen Hismelt: Capacity 880 TPD OxygenCarbon Dioxide Plants: CSBP C i 130 TPD
Operations
industrial medical and specialty gasesActivities
owns and operates LPG and LNG extractionfacilities in Western Australia supplyingKleenheat Gas domestically and exportmarkets
Production Volume CSBP: Capacity 130 TPDCylinder Filling Operations: 3Branches: 3 in Western Australia
1 in Northern TerritoryAgents: 60Customers: 12,450
1H10 Actual: 105,036kT
1H10 Actual: Export: 35.6kT Domestic: 69.6kT
Customers 2
Sales Volumes
Production Volume
65
Customers 2

Other Businesses
Half year ended 31 December (A$m): 2010 2009
Gresham:50% interest in Gresham Partners, an independent investmentb k f d fi i l d i i i t it
y ( $ ) 2010 2009
Share of associates profit/(loss): Gresham Partners 2 1 Gresham Private Equity 29 (1)
bank focused on financial advisory services, private equityinvestment and property investment funds. Wesfarmers alsoholds significant investments in Gresham's Private Equity Funds.
Half year ended 31 December (A$m): 2010 2009
Wespine (50%):50:50 joint venture between Wesfarmers and Fletcher BuildingLi i d W i i f d ill i li i i h Half year ended 31 December (A$m): 2010 2009
Share of associates profit/(loss): 4 4
Limited. Wespine is a softwood sawmiller, specialising in theproduction of premium quality plantation timber for use inhousing construction and furniture manufacturing.
Half year ended 31 December (A$m): 2010 2009
Share of associates profit/(loss): 10 (5)
Bunnings Warehouse Property Trust (23%):listed property trust, established in 1998 with a focus on warehouseretailing properties and, in particular, Bunnings Warehouses p ( ) ( )leased to Bunnings Pty Ltd, a wholly-owned subsidiary ofWesfarmers Limited.
66

Capital ManagementCapital Management
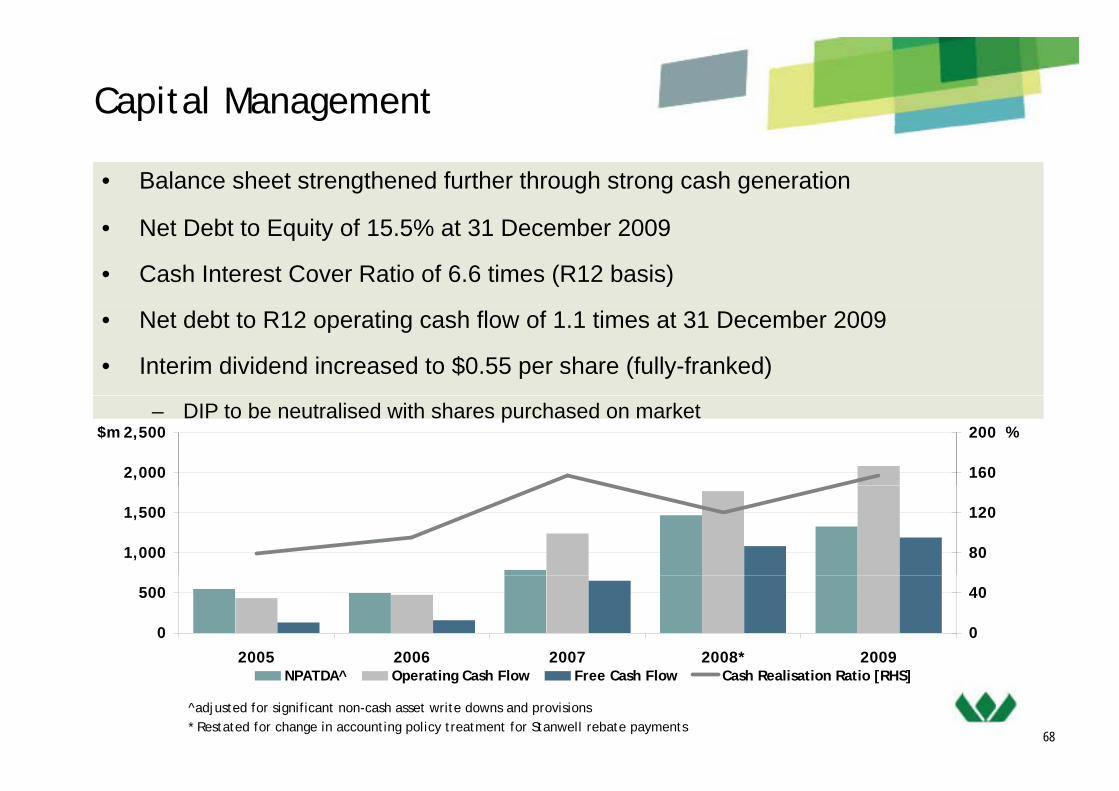
Capital Management
• Balance sheet strengthened further through strong cash generation
• Net Debt to Equity of 15.5% at 31 December 2009
• Cash Interest Cover Ratio of 6.6 times (R12 basis)
• Net debt to R12 operating cash flow of 1.1 times at 31 December 2009
• Interim dividend increased to $0.55 per share (fully-franked)
2,000
2,500$m
160
200 %– DIP to be neutralised with shares purchased on market
1,000
1,500
80
120
0
500
2005 2006 2007 2008* 2009
0
40
68
NPATDA^ Operating Cash Flow Free Cash Flow Cash Realisation Ratio [RHS]
^adjusted for significant non-cash asset write downs and provisions* Restated for change in accounting policy treatment for Stanwell rebate payments

Maturity Profile Analysis(as at 31 December 2009)
3,000
($m)
2,000
1,000
0 Current FY10 FY11 FY12 FY13 FY14 FY15
(2 000)
(1,000)
Capital Markets Wholesale Syndicated Cash at bank and on deposit
69
(2,000)

Debt Finance
• Gross debt of $5.7bn, net debt of $3.8bn
– Cash at bank & on deposit $1.8bn
– Committed undrawn facilities of $1.4bn
• 1H10 all in cost of debt, including margins and fees, of ~8.7% after adjusting
for one off costsfor one-off costs
• 75% hedged for 2H10
• Ongoing review of financing opportunities and requirements as market
liquidity improves
• 5-year A$500m domestic corporate bond issued in September 2009
• $972m of facilities repaid during the period
70
$972m of facilities repaid during the period

Working Capital Cash Flows
• Retail strategies progressed, continue to deliver improvements
– Significant working capital released since acquisition
– Further improvements in operating cycle expectedu t e p o e e ts ope at g cyc e e pected
– Inventory well controlled
– Seasonally stronger working capital cash flows in the first halfSeasonally stronger working capital cash flows in the first half
• CSBP inventory reduced to historical averages
Inflow/(Outflow)* ($m) 1H10 1H09
Retail 578 463
All other businesses (1) (340)
Total 577 123
71
* Cash movement relating to inventories, trade and other receivables, prepayments and trade and other payables

Capital Expenditure
• Return on capital focus ensures effective Half Year ended 31 December (A$m) 2009 2008Return on capital focus ensures effective use of capital
• Continued investment in organic growth
Half Year ended 31 December (A$m) 2009 2008
Coles 442 204Home Improvement & Office Supplies 207 214
and development opportunities
– increase in property acquisitions
207 214Target 47 51Kmart 34 41
– refurbishments and store roll outs
– expansion of Curragh mine
Resources 108 109Insurance 11 6
– feasibility study of AN expansion
• Completion of Blackwater Creek diversion
Industrial & Safety 11 10Chemicals & Fertiliser 20 22Energydiversion
• FY10 capital expenditure expected to be ~$1.9bn
Energy 9 21Other 2 9Total 891 687
72
$1.9bn 891 687

OutlookOutlook
73

Outlook
• Group is well-positioned to benefit from any further upturn in the economy
• Outlook for export coal is positive
if realised will result in an increase in Resource earnings from 4Q10– if realised, will result in an increase in Resource earnings from 4Q10
• Recovery in Insurance and Industrial businesses
• Optimistic about the future performance of the retail businesses
• Remain cautious of the Australian retail environment in 2H10 given:
– the potential impact of any further interest rate rises; and
– retailers will trade without the assistance of the prior year government stimulusretailers will trade without the assistance of the prior year government stimulus
74

Investor Relations ContactInvestor Relations ContactWesfarmer’s Public Affairs and Investor Relations For further information on Wesfarmers including:
A l tAlan Carpenter 61 8 9327 4267(media) [email protected]
Annual reports
Financial results announcements
Presentations and webcastsTanya Rybarczyk 61 8 9327 4323(investors) [email protected]
Presentations and webcasts
Corporate policies
Address:
Wesfarmers House
40 The EsplanadePlease visit our website
p
Perth WA 6000
Fax: 61 8 9327 4320
www.wesfarmers.com.au
Important Notice and Disclaimer
• The material contained in this presentation is intended to be general background information on Wesfarmers Limited and its activities
• The information is supplied in summary form and is therefore not necessarily complete. Also, it is not intended that it be relied upon as advice to investors or potential investors, who should consider seeking independent professional advice depending upon their specific investment objectives, financial situation or particular needs
75
particular needs
• The financial information contained in this presentation includes non-GAAP financial measures. For a reconciliation of these measures to the most comparable GAAP measure, please refer to half and full year financial statements filed with the Australian Stock Exchange
• Nothing in this release should be construed as either an offer to sell or a solicitation of an offer to buy or sell shares in any jurisdiction