Embed Size (px)
Citation preview

i
Declaration
I, Teofilus Shiimi, declare that the dissertation hereby submitted for the qualification of Master’s
Degree in Agricultural Economics at the University of the Free State is my own independent
work and that I have not previously submitted the same work for a qualification at/in another
university/faculty
ii
Dedication
“Beginning today I will take a moment to step off the beaten path and to revel in the mysteries
I encounter. I will face challenges placed before me with courage and determination. I will
overcome what barriers there may be which hinder my quest for growth and self-improvement”
Penny Jacqueline White
This work is dedicated to:
My dearest father, mother and siblings
iii
Acknowledgments
My sincerest appreciation goes first and foremost to my supervisor, Dr P.R. Taljaard, for his
educative and knowledgeable guidance and his frank and critical advice throughout the course of
this study.
Secondly, I would like to express my genuine gratitude towards my co-supervisor, Mr H.
Jordaan, for his practical inputs, especially in the analytical stages – without his enthusiasm and
encouragement, this study would not have been possible.
I would also like to thank Ms M. Engelbrecht for her loyalty and kindness, mostly during the
data-collection stages and the editing process. Equally, I would like to sincerely thank the
University of the Free State, particularly the Faculty of Natural and Agricultural Sciences, for
giving me the opportunity to fortify my knowledge at this institution. Special thanks go to the
staff of the Department of Agricultural Economics and the Centre for Agricultural Management
for making me feel at home during my study – their assistance and support were the main
contributors to my success.
The financial assistance of the SADC (ICART), in collaboration with the European Union, is
hereby acknowledged. Additional financial assistance from the Meat Board of Namibia, and the
use of the photocopying facilities of the Meat Board of Namibia and the Ministry of Agriculture,
Water and Forestry, also made a significant contribution to the success of this study.
I owe a debt of gratitude to all cattle producers and referenced authors for providing much-
needed information, since without their informative inputs, this study would not have been
possible.
I would like to thank my family, colleagues and friends for their outstanding assistance and
unwavering support throughout the duration of this study. Their presence, loyalty and friendship
have contributed much towards the success of this study and I thank them all from the bottom of
my heart.
iv
Above all, I would like to thank the Lord of all Lords for making everything possible. His care,
protection and love accompanied me through all the challenges encountered in the course of this
study. Thank you, Lord, for leading me to this point.
Teofilus Shiimi
Bloemfontein
2009
v
Table of Contents
DECLARATION..……………………………………………………………………………….. i
DEDICATION…………………………………………………………………………...……… ii
ACKNOWLEDGMENT..………………………………………………………………………. iii
UITTREKSEL………………………………………………………………………………..... viii
ABSTRACT................................................................................................................................... x
LIST OF ACRONYMS……………………………………………………….……...……….... xii
LIST OF TABLES……………………………..……………………………………………..… xv
LIST OF FIGURES…………………………..…………………………………..……………. xvi
CHAPTER 1: INTRODUCTION………………………………………………………………... 1
1.1 Background ............................................................................................................................... 1
1.2 Problem statement ..................................................................................................................... 2
1.3 Objectives of the study.............................................................................................................. 4
1.4 Motivation ................................................................................................................................. 5
1.5 Outline of the study ................................................................................................................... 6
CHAPTER 2: LITERATURE REVIEW………………………………………………………….7
2.1 Introduction ............................................................................................................................... 7
2.2 Overview of the study area ....................................................................................................... 7
2.2.1 Background ................................................................................................................... 7
2.2.2 Brief historical background to NCR ........................................................................... 10
2.2.3 Household economies ................................................................................................. 11
2.2.4 Farming ....................................................................................................................... 12
2.2.5 Livestock diseases and the control thereof ................................................................. 13
2.2.6 Land and governance .................................................................................................. 13
2.3 Livestock production and marketing in Namibia.................................................................... 14
2.3.1 Livestock production in Namibia ................................................................................ 14
vi
2.3.2 Cattle production in Namibia ...................................................................................... 15
2.3.3 Marketing of cattle in Namibia ................................................................................... 16
2.3.4 Marketing of cattle in the Northern Communal Areas (NCA) ................................... 18
2.4 Theoretical framework for analysing cattle marketing in the NCR ........................................ 20
2.4.1 Introduction ................................................................................................................. 20
2.4.2 Transaction cost economics and communal livestock production .............................. 20
2.4.3 Definition of transaction costs .................................................................................... 22
2.4.4 Transaction cost theory ............................................................................................... 23
2.4.5 Sources of transaction costs ........................................................................................ 25
2.4.5.1 Information costs .................................................................................................. 26
2.4.5.2 Negotiation costs ................................................................................................... 27
2.4.5.3 Monitoring costs ................................................................................................... 28
2.4.5.4 Product nature costs .............................................................................................. 28
2.4.6 Measuring transaction costs ........................................................................................ 29
2.4.7 Reducing high transaction costs.................................................................................. 30
2.4.7.1 Transaction costs and information technology ..................................................... 31
2.4.7.2 Trust ...................................................................................................................... 32
2.4.7.3 Provision of education .......................................................................................... 32
2.5 Related research ...................................................................................................................... 32
CHAPTER 3: DATA AND METHODOLOGY………………………………………………...36
3.1 Introduction ............................................................................................................................. 36
3.1.1 Questionnaire design ................................................................................................... 36
3.1.2 Sampling procedure .................................................................................................... 37
3.1.3 Survey ......................................................................................................................... 37
3.2 Characteristics of respondents ................................................................................................ 37
3.2.1 Simplicity of dependent variables in the regression of the cattle-marketing decision 37
3.2.2 Simplicity of explanatory variables in the regression of the cattle-marketing decision 38
3.2.3 Hypothesised explanatory variables ........................................................................... 39
3.2.3.1 Socio-economic characteristics ............................................................................. 41
3.2.4 Transaction cost variables ........................................................................................... 42
vii
3.2.4.1 Information costs .................................................................................................. 43
3.2.4.2 Negotiation costs ................................................................................................... 47
3.2.4.3 Monitoring costs ................................................................................................... 51
3.2.4.4 Productivity uncertainty ........................................................................................ 54
3.3 Methodology ........................................................................................................................... 57
3.3.1 Introduction ................................................................................................................. 57
3.3.2 Principal component regression .................................................................................. 57
3.3.2 Factors affecting the decision of whether or not to sell through the formal market ... 62
3.3.3 Factors affecting the decision on the proportion of cattle to be sold through the formal market in cases where the producer has decided to make use of the formal market to sell his/her cattle ......................................................................................................... 66
3.3.4 Is marketing behaviour a single decision or are there other factors influencing adoption and quantity decisions? ................................................................................ 69
3.3.5 Underlying structure of factors causing transaction costs .......................................... 70
CHAPTER 4: RESULTS AND DISCUSSION………………………………………………….74
4.1 Introduction ............................................................................................................................. 75
4.2 Factors influencing the producer’s choice of whether or not to sell through the formal market 75
4.3 Factors influencing the proportion of cattle sold through the formal market in cases where the producer has decided to make use of that market ................................................................... 81
4.4 Formal testing of whether it is sufficient to model the analysis as a one-decision-making model or as a two-decision-making model ............................................................................. 85
4.5 Investigation into the underlying structure of factors causing transaction costs .................... 89
CHAPTER 5: CONCLUSIONS AND RECOMMENDATION………………………………...97
5.1 Introduction ............................................................................................................................. 97
5.2 Conclusions on the findings .................................................................................................... 97
5.3 Recommendations ................................................................................................................. 100
References ................................................................................................................................... 105
viii
Transaksiekoste en beesboerdery se besluit van bemarkingskanaal in Noord-sentraal Namibië
Deur:
Teofilus Shiimi
Graad: MSc. Landbou-ekonomie Department: Landbou-ekonomie Studieleier: Dr. P.R. Taljaard Mede-studieleier: Mnr. H. Jordaan
Uittreksel
Ongeveer 70 % van Namibië se bevolking is afhanklik van landbouproduksie om ’n
lewensbestaan te maak. Bowendien bly landbou ’n belangrike ekonomiese sektor in Namibië,
omdat die nasionale ekonomie regstreeks afhanklik is van landbouproduksie. Twee afsonderlike
grondeienaarskap-gebruikstelsels (kommunaal in die noorde en die kommersiële landbou in die
suide), word geskei deur die “Veterinary Cordon Fence” (VCF), wat die bemarking van
lewendehawe vanaf die noordelike kommunale gebiede bemoeilik. Beesvleisprodusente in die
noordelike kommunale gebiede, het die opsie van ’n formele en informele bemarkingskanaal.
Hoewel verskeie pogings al aangewend is om die produsente aan te moedig om die formele
bemarkingskanaal te gebruik, is daar nie veel verbetering te bespeur nie. In die studie word
verskeie faktore geanaliseer om die invloed daarvan op die bemarkingskeuse van
beesvleisprodusente te bepaal.
Faktore verantwoordelik vir die bemarkingsbesluit om wel die formele bemarkingskanaal te
gebruik, word ge-analiseer met behulp van ’n “Probit-” model. Faktore wat ’n invloed uitoefen
op die verhouding van beeste wat op die formele mark bemark word, in gevalle waar die
produsent besluit het om daardie mark te gebruik om sy/haar beeste te bemark, word met behulp
van ’n “Truncated-” model bepaal. Die toetsing van die “Tobit-” model, teenoor die alternatief

ix
van ’n tweeledige model, word gedoen met behulp van die sogenaamde “Cragg’s-” model.
Faktor-analise is verder gebruik om die onderliggende transaksie-kostestruktuur te ontleed.
Die empiriese resultate dui daarop dat probleme met vervoer van diere na MeatCo, verbeterde
produktiwiteit, toegang tot markinligting en nuwe inligtingstegnologie, van die faktore is wat
verantwoordelik is vir die besluit om wel beeste deur die formele mark te verkoop.
Betalingsooreenkomste tussen produsente en MeatCo, dierehantering, toegang tot nuwe
inligtingstegnologie, die ouderdom van respondente, asook die tekort aan
bemarkingsvaardigheid, is van die faktore wat die verhouding van beeste deur die formele
bemarkingskanaal beïnvloed.
Die resultate toon dat aanmerklik meer inligting verkry word deur die bemarkingsbesluite van
beesvleisprodusente as ’n tweeledige, eerder as ’n enkelvoudige besluit te modelleer. Faktor-
analise het diskontofaktore, afleweringsaspekte en markeienskappe geïdentifiseer as die
onderliggende struktuur van die beesvleismark wat transaksiekoste beïnvloed.
Sleutelwoorde: Beesbemarking, besluitneming, formele markte, transaksiekoste
x
Transaction costs and cattle farmers’ choice of marketing channel in North-Central Namibia
By
Teofilus Shiimi
Degree: MSc Agricultural Economics Department: Agricultural Economics Supervisor: Dr P.R. Taljaard Co-Supervisor: Mr H. Jordaan
Abstract
Approximately 70 % of the Namibian population depends on agricultural activities for their
livelihoods. Moreover, agriculture remains an important sector in Namibia, because its national
economy is widely dependent on agricultural production. However, two distinct land tenure
systems (communal and commercial farming sectors) separated by the Veterinary Cordon Fence
(VCF) complicated the marketing of cattle from the Northern Communal Areas (NCA). Cattle
producers in the NCA have the option to market their cattle via the formal or informal market.
Although efforts have been made to encourage producers to market their cattle through the
formal market, limited improvement has been observed. In this study a number of factors were
analysed to determine their influence on the decisions made in respect of cattle marketing.
Factors influencing the decision of whether or not to sell through the formal market were
analysed using the Probit Model. Factors influencing the proportion of cattle sold through the
formal market in cases where the producer has decided to use that market to sell her/his cattle
were analysed using the Truncated Model. Testing the Tobit Model against the alternative of a
two-part model was done by means of Cragg’s Model. Factor analysis was used to study the
underlying structure resulting in transaction costs.
The empirical results revealed that problems related to transport to MeatCo, improved
productivity, accessibility to market-related information and accessibility to information on new
technology are some of the factors significantly affecting the decision of whether or not to sell

xi
through the formal market. Payment arrangements by MeatCo, animal handling, accessibility to
new information technology, age of respondents and lack of access to marketing expertise are
some of the factors influencing the proportion of cattle sold through the formal market.
The results suggest that substantially more information is obtained by modelling cattle-marketing
behaviour as a two-decision-making framework instead of a single-decision-making framework.
Factor analysis identified discounting factors, delivery aspects and market features as the
underlying structure resulting in transaction costs.
Key words: Cattle marketing, decision-making, formal markets, transaction costs
xii
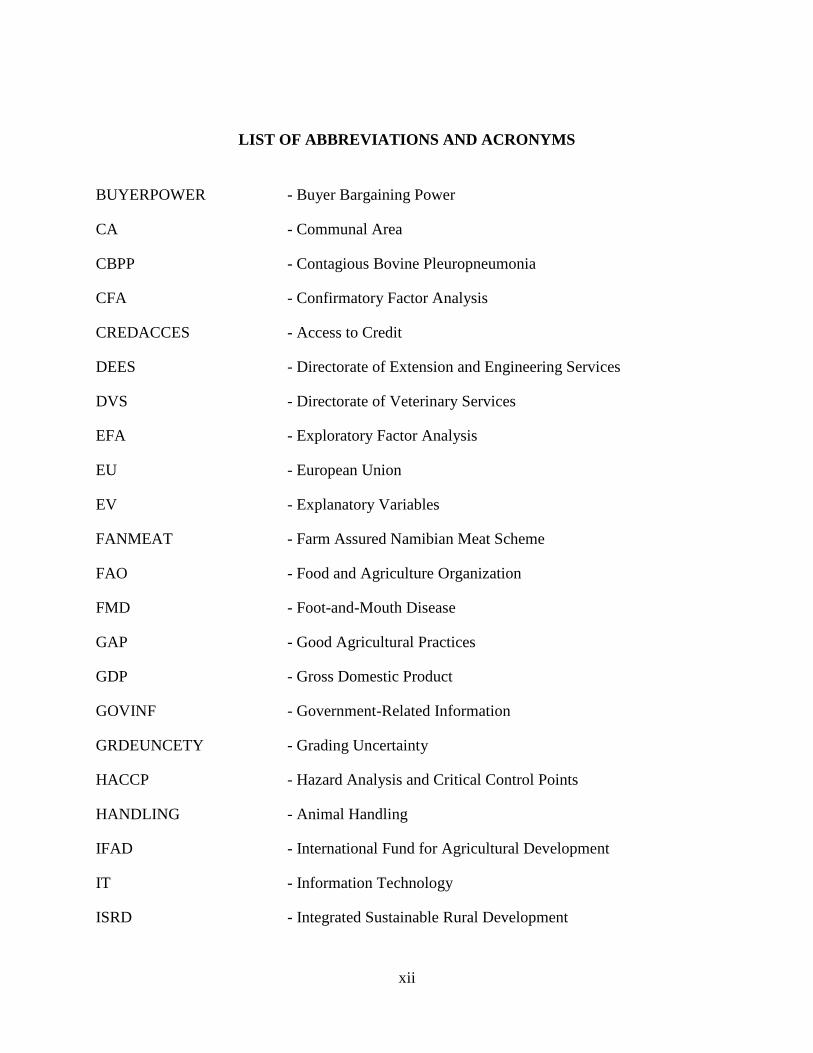
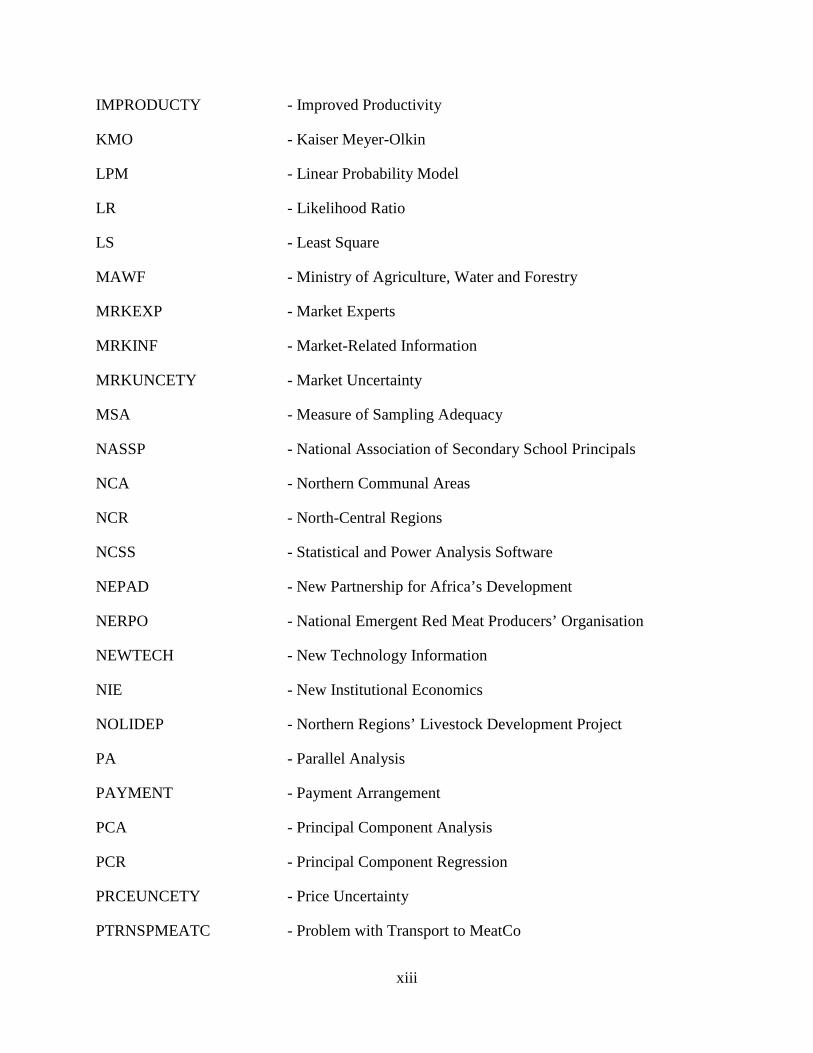
LIST OF ABBREVIATIONS AND ACRONYMS
BUYERPOWER - Buyer Bargaining Power
CA - Communal Area
CBPP - Contagious Bovine Pleuropneumonia
CFA - Confirmatory Factor Analysis
CREDACCES - Access to Credit
DEES - Directorate of Extension and Engineering Services
DVS - Directorate of Veterinary Services
EFA - Exploratory Factor Analysis
EU - European Union
EV - Explanatory Variables
FANMEAT - Farm Assured Namibian Meat Scheme
FAO - Food and Agriculture Organization
FMD - Foot-and-Mouth Disease
GAP - Good Agricultural Practices
GDP - Gross Domestic Product
GOVINF - Government-Related Information
GRDEUNCETY - Grading Uncertainty
HACCP - Hazard Analysis and Critical Control Points
HANDLING - Animal Handling
IFAD - International Fund for Agricultural Development
IT - Information Technology
ISRD - Integrated Sustainable Rural Development
xiii
IMPRODUCTY - Improved Productivity
KMO - Kaiser Meyer-Olkin
LPM - Linear Probability Model
LR - Likelihood Ratio
LS - Least Square
MAWF - Ministry of Agriculture, Water and Forestry
MRKEXP - Market Experts
MRKINF - Market-Related Information
MRKUNCETY - Market Uncertainty
MSA - Measure of Sampling Adequacy
NASSP - National Association of Secondary School Principals
NCA - Northern Communal Areas
NCR - North-Central Regions
NCSS - Statistical and Power Analysis Software
NEPAD - New Partnership for Africa’s Development
NERPO - National Emergent Red Meat Producers’ Organisation
NEWTECH - New Technology Information
NIE - New Institutional Economics
NOLIDEP - Northern Regions’ Livestock Development Project
PA - Parallel Analysis
PAYMENT - Payment Arrangement
PCA - Principal Component Analysis
PCR - Principal Component Regression
PRCEUNCETY - Price Uncertainty
PTRNSPMEATC - Problem with Transport to MeatCo
xiv
RSA - Republic of South Africa
SADC - Southern African Development Community
SACU - Southern African Customs Union
SCA - Southern Communal Areas
SSA - Sub-Saharan Africa
SVCF - South of Veterinary Cordon Fence
TRANSCOST - Transport Cost
UK - United Kingdom
US - United States
VCF - Veterinary Cordon Fence
xv
List of Tables
TABLE 1: LIVESTOCK NUMBERS FOR DIFFERENT SECTORS IN NAMIBIA , FOR THE 2006 CALENDAR
YEAR ............................................................................................................................ 14
TABLE 2: EXPLANATORY VARIABLES HYPOTHESISED TO INFLUENCE THE DECISIONS MADE IN
RESPECT OF CATTLE MARKETING AND THE PROPORTION SOLD IN THE NCR ................. 40
TABLE 3: RESPONDENTS’ PERSONAL INFORMATION ....................................................................... 42
TABLE 4: ACCESSIBILITY OF INFORMATION, RANKING FROM 1 (VERY EASY) TO 5 (VERY DIFFICULT)..................................................................................................................................... 46
TABLE 5: RESPONSES IN RESPECT OF ACCESSIBILITY TO INFORMATION ......................................... 54
TABLE 6: REGRESSION RESULTS OF PROBIT MODEL OF FACTORS INFLUENCING THE PROBABILITY OF
THE PRODUCER DECIDING TO USE THE FORMAL MARKET .............................................. 77
TABLE 7: REGRESSION RESULTS OF TRUNCATED MODEL ON THE PROPORTION OF CATTLE SOLD
THROUGH THE FORMAL MARKET ON CONDITION THAT THE PRODUCER HAS DECIDED TO
USE THAT MARKET ....................................................................................................... 82
TABLE 8: REGRESSION RESULTS FOR ALTERNATIVE MODEL SPECIFICATIONS WHEN MODELLING
CATTLE MARKETING BEHAVIOUR ................................................................................. 87
TABLE 9: RESULTS OF THE KAISER-MEYER-OLKIN MEASURE OF SAMPLING ADEQUACY ............... 89
TABLE 10: FACTOR LOADINGS AND COMMUNALITIES AFTER VARIMAX ROTATION ........................ 92
TABLE 11: COMMUNALITIES AFTER VARIMAX ROTATION .............................................................. 94
xvi
List of Figures
FIGURE 1: MAP OF NAMIBIA SHOWING NCR ................................................................................... 8
FIGURE 2: VETERINARY OFFICES AND QUARANTINE CAMPS IN NCR (STUDY AREA) ........................ 9
FIGURE 3: NATIONAL CATTLE NUMBERS ........................................................................................ 16
FIGURE 4: MARKETING OF TOTAL PRODUCTION OF CATTLE (NUMBERS) ........................................ 20
FIGURE 5: MODE OF TRANSPORT USED TO TRANSPORT LIVESTOCK TO MARKET ............................. 49
FIGURE 6: RESPONSES IN RESPECT OF PAYMENT DELAYS AND BARGAINING POWER TO INFLUENCE
PRICE WITH MEATCO ................................................................................................... 51
FIGURE 7: ACCESSIBILITY OF CREDIT ............................................................................................. 57
FIGURE 8: PERCENTAGE OF OBSERVED VARIANCE BASED ON EIGENVALUE .................................... 93
1
CHAPTER 1
INTRODUCTION
1.1 Background Strengthening agriculture is critical in facing the challenges of rural poverty, food insecurity,
unemployment and sustainability of natural resources. The World Bank (2007) pointed out that
agriculture can work in conjunction with other sectors to produce faster growth, reduce poverty,
and sustain the environment. However, there is a need to promote market participation in order
to increasingly recognise the effort to bring about agricultural transformation in developing
countries (Alene, Manyong, Omanya, Mignouna, Bokanga & Odhiambo, 2007).
Agriculture, along with primary food processing, has been described as the largest job creation
mechanism in the world (Botha, 2007). It remains an extremely important sector in the Southern
African Development Community (SADC) region, employing on average 60-70 % of the total
labour force (Nkonde, 2007). An interesting finding was that policy analyses in the livestock
sector all agree that the demand for animal products will rise in line with population growth,
especially in view of rapid urbanisation (Kamuanga, Somda, Sanon & Kagone, 2008; Upton &
Otter, 2004). This may go hand in hand with an increase in protein consumption, especially in
developing countries, and greater consumer awareness of health in developed countries, thus
presenting prospects for niche marketing (Bahta & Bauer, 2007; Horsthemke, 2009).
Similar to most other SADC countries, Namibia is not exempted from the importance of
agriculture, because its national economy depends widely on agricultural production, which
remains the main source of food and employment of rural people. Namibia’s secondary sector
(industrial processing) is still in an embryonic stage and therefore the country’s economy is
heavily dependent on the earnings generated from primary commodity exports in a few vital
sectors, such as minerals, livestock and fish. Currently, some 70 % of Namibia’s population
derive their livelihoods from agriculture, either directly or indirectly (Horsthemke, 2009). The
development of agriculture throughout the industrialised world has been associated with
2
technological change. The trend in the adoption of new technology in agricultural production
and management has been termed the industrialisation of agriculture (Cuthbert, 2008).
Therefore, for Namibia to progress to a state of greater food security and production for export,
the development of the sector is critical to accelerate the industrialisation of agriculture.
According to Business Namibia (2006) the National Agricultural Policy passed by Parliament in
1995 and recently revised continues to serve as the blueprint for such development. Its aim is to
increase and sustain levels of productivity, real farm incomes, as well as national and household
food security.
As a semi-arid country well endowed with natural pastures, Namibia is suited for extensive
livestock ranching (Ouseb, 2006). Much of the livestock agriculture is subsistence farming, but
there is a growing manufacturing sector that deals with meat and fish processing. Historically,
livestock from the commercial farming sector has dominated agricultural production in Namibia
and this largely still holds true. Cattle, sheep and goats constituted about 80 % of overall
agricultural output in 2006 (Hosthemke, 2009).
1.2 Problem statement Developing countries are generally characterised by the inefficiency of their marketing systems
(Zereyesus, 2003). Consequently, developing countries are faced with a vicious circle: if the
farmer does not obtain an economic return from the sale of his/her surplus production, he/she
will tend to produce at a subsistence level only. On the other hand, a shortage in the supply of a
marketable surplus makes the development of an inefficient marketing system extremely
difficult (Zereyesus, 2003).
In developing countries, especially in communal areas, it has been found that beef supply is
determined only by the cattle marketed (Sartorius von Bach, Van Renen & Kirsten, 1998), with
cattle numbers not being adjusted according to environmental factors. However, according to
the institutional setup, some producers respond to economic variables such as prices, while
others do not. Dovie and Shackleton (2003) argued that communal producers consider their
cattle as a store of wealth and they are only sold to meet immediate cash needs. Limited access
of communal producers to the high-priced markets means that the problem with low off-take
3
rate lies not with price responsiveness, but rather with the market (Sartorius von Bach et al,
1998).
Düvel (2001) found that livestock producers in the Northern Communal Areas (NCA) of
Namibia are particularly disadvantaged as far as livestock marketing is concerned, because of
the Veterinary Cordon Fence (VCF). Meat and livestock cannot pass freely over this VCF into
the southern zone that is free of Foot-and-Mouth Disease (FMD), which complicates the
marketing of livestock. To overcome this shortage, the government of Namibia established
MeatCo in 1992 and built eleven quarantine facilities in the NCA (FAO & NEPAD, 2005).
MeatCo abattoirs in the NCA were established with the aim of creating marketing opportunities
for communal producers in the NCA to benefit from their livestock through the formal market.
Cattle owners in the NCA of Namibia are able to sell their animals to the informal or indigenous
market, or to the government-owned parastatal, MeatCo (De Bruyn, De Bruyn, Vink & Kirsten,
2001). For producers in the NCA to sell their cattle through the formal market (MeatCo), it is a
prerequisite that their cattle are kept in quarantine camps to be inspected for any diseases for at
least 21 days before entering the South African market. A problem associated with this is that
the transaction costs involved in the marketing of cattle are high in the formal market, because
these cattle often lose weight and grade in the camps due to insufficient feed, resulting in lower
prices (Doss, McPeak & Barrett, 2005; FAO & NEPAD, 2005; Kirsten, 2002; NASSP, 2005).
Another problem is the long distances over which producers have to transport their animals to
the quarantine camps (Arbirk & Vigne, 2002; NOLIDEP, 2002; Sartorius von Bach, 1990).
Moreover, many traditional producers regard cattle as a financial buffer mechanism, to be used
only when cash shortages are experienced (Dovie & Shackleton, 2003). This leads to low
prices being received for these animals, subsequently discouraging producers from marketing
their cattle through the formal channels (Mushendami, Biwa & Gaomab, 2006; NASSP, 2005).
Kruger and Lammerts-Imbuwa (2008) argued that the off-take rate of cattle through the formal
market in the NCA remains low at 2 % compared to an estimated 20 % off-take for the rest of
the country. The key issue is that when the meat-processing abattoirs are not operating at their
optimum capacity, they are not minimising their operating costs and are facing a cost
4
disadvantage, which makes them less competitive in the global or regional meat market
(Negassa & Jabbar, 2007).
This problem has been researched, although most researchers have considered the marketing
decision as a single, isolated decision. No studies have thus far considered that different factors
may influence the decision made in respect of cattle marketing, and thus the decision must be
modelled as two separate parts: (i) The decision of whether or not to make use of the formal
market, and (ii) The decision in respect of the proportion of cattle to be sold through the formal
market, given that the decision has been made to make use of the formal market to sell the
cattle. Presuming this to be a single decision while it is actually be two separate decisions may
cause the focus to fall on factors that are not really contributing to the effort to convince
producers to market their cattle through the formal market.
1.3 Objectives of the study
The objectives of the study are based on two hypotheses: (i) The farmer’s decision to market
his/her cattle through the formal market is significantly affected by transaction costs, and (ii)
Marketing behaviour must be analysed within a two-decision-making framework.
The primary aim of this study was to investigate the factors that influence the marketing
behaviour of cattle producers in the study area so as to gain an understanding of the factors
restricting them from using formal marketing channels to market their cattle. In order to achieve
this primary objective, the following secondary objectives were set:
• To determine the factors that influence the cattle producer’s decision on whether or not
to use the formal marketing channel.
• To determine the factors that influence the proportion of cattle marketed through the
formal market in cases where the producer has used the formal market to sell his
cattle.
5
• To formally test whether it is sufficient to model marketing behaviour as a single
decision, as done by other researchers, or whether the marketing decision should be
separated into a two-decision-making framework.
• To investigate the underlying structure of factors causing transaction costs.
1.4 Motivation
Livestock production is the main enterprise of the majority of traditional producers in the NCA.
For producers to maximise the benefits derived from their cattle, proper marketing integration
with appropriate marketing structures and correct pricing of cattle in the sector are crucial.
More than half of all cattle in Namibia are located north of the VCF on about 16 % of the total
land area of the country (MAWF, 2006) which typically results in large-scale degradation of
rangeland and increased vulnerability of livestock producers to periodic dry periods and
recurring drought. Stock numbers have increased over the years, and the current stocking rate
exceeds the carrying capacity of the rangelands (MAWRD, 2004).
The North-Central Regions (NCR) have a large livestock population performing multiple
functions in the economy, but the potential contribution of the sector to the mainstream national
economy is not being fully exploited due to problems related to the choice of marketing
channel. Hence, the aim of this study was to unlock the potential wealth encoded in the
abundant livestock in the area by encouraging producers to sell through the formal market. It is
understood that this will transform producers from the traditional way of keeping cattle for
status, and they must therefore become responsive to factors that influence meat prices, e.g.
drought preparedness and management, consumer preferences and attitudes, commercial
enterprise, and financial management. This will subsequently contribute towards the
achievement of the Millennium Development Goals, Vision 2030, and the objectives of the
National Agriculture Policy. Achieving these objectives will be of significant economic
importance for the historically underprivileged groups in the country.

6
It has long been understood that with increasing economic growth, small farm production
systems could not remain static and would need to gear themselves towards some degree of
commercialisation if they are to survive (Pingali, Khwaja & Meijer, 2005). On the consumer
side, the delivery of livestock products through informal markets tends to serve poor consumers,
creating an even tighter focus on the poor (Rich, Baker, Negassa & Ross, 2009). Thus, the
intention of this study was to address and counteract the factors hindering the effort to
encourage producers in the NCR to market substantial numbers of cattle through the formal
market – an achievement that is envisaged to bring about numerous benefits not only for the
cattle producers and MeatCo, but for the entire country.
This study has identified and proposed further actions essential to bring about improvement to
the existing marketing system. The findings and the recommendations of the study give
guidelines for development in other regions and will consequently be superlatively useful to
policymakers.
1.5 Outline of the study The remaining chapters of the study are organised as follows:
Chapter 2 provides an overview of the study area and a review of the relevant literature in
order to provide a better understanding of the problem. Chapter 3 covers a discussion of the
questionnaire design and data gathering process, as well as a brief description of the
respondents and the methodology used to achieve the objectives of the study. Chapter 4 is
devoted to the results and the discussion thereof. Chapter 5 concludes the study and contains
recommendations for further proposed research topics aimed at making a significant
contribution to the improvement of cattle marketing in North Central Namibia.

7
CHAPTER 2
LITERATURE REVIEW
2.1 Introduction
This chapter provides an overview of the study area in terms of cattle production and marketing
in Namibia. The status of the people of the region and the current situation provide the
foundation for the principles used in approaching the study area. A theoretical framework for
analysing cattle marketing in the North-Central Regions (NCR), as well as related research,
form part of this chapter.
2.2 Overview of the study area 2.2.1 Background
The NCR, as shown in Figure 1 and Figure 2, is a fascinating place: a myriad of landscapes,
home to half the country’s population engaged in a diversity of activities. The people, victims of
a protracted recent war, are also the beneficiaries of a long and rich history that produced a
society of traders, entrepreneurs, political leaders and any number of other dynamic characters
(Mendelsohn, Obeid & Roberts, 2000). This community consists of producers, most of whom
are still using their land to grow crops and keep livestock (Mendelsohn et al., 2000). The
selected study area comprises four regions, namely Omusati, Oshana, Oshikoto and
Ohangwena. The NCR of the country is the most densely populated area, with an average
population density of 26 people per km2, which is more than ten times the national average
(Namibia Tourism Board, 2006). These regions occupy 84,600 km2 or 9.7% of the land surface
(Araki, 2005). The majority of the population of the NCR are transhumant pastoralists, whose
traditional subsistence strategy is based around two principal activities: livestock farming
supported by migratory seasonal grazing, and rain-fed crop production (Tapscott, 1990).

8
Figure 1: Map of Namibia showing NCR
Source: MAWF (2009)
9
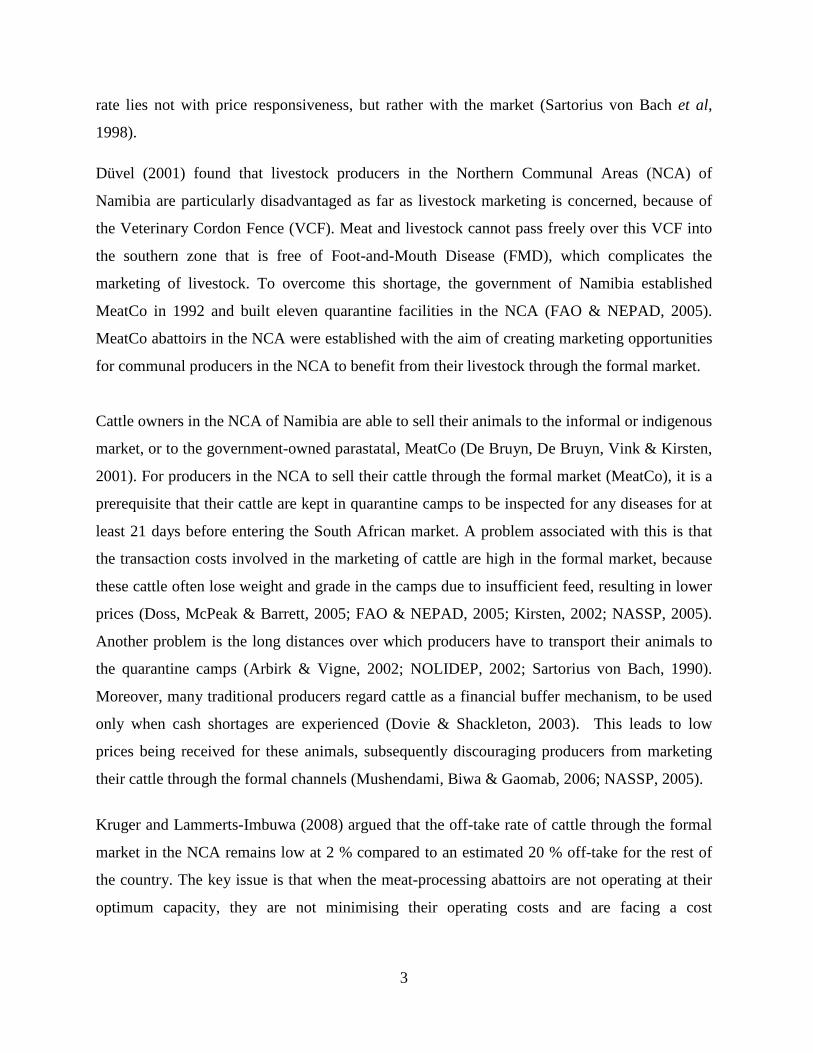
Figure 2: Veterinary offices and quarantine camps in NCR (study area)
Source: Mendelsohn et al. (2000)
Araki (2005) and Mendelsohn et al. (2000) described the area as appearing at first sight to be
topographically very flat and almost featureless, with the exception of two remarkable features:
the Cuvelai Delta and the Etosha Pan. Unlike other river systems, the sprawling Cuvelai
network of draining channels first spreads out across southern Angola and then, on crossing the
10
Namibian border, converges through hundreds of meandering oshanas (shallow depressions)
into the Etosha Pan.
About 70 % of the region is used for agriculture (consisting of 30 % small-scale farming, 20 %
communal grazing, 9 % large farms in the Tsumeb area, 11 % land used by the Mangetti
producers and people who have fenced off large ‘informal’ farms in the NCR), while the
remaining approximately 30 % is used for conservation (Mendelsohn et al., 2000). Common
property resources, such as grazing pastures, are diminishing as a result of increasing
competition and because they are being enclosed within fenced farms. Certain urban areas are
growing rapidly, but most people living in towns in the NCR retain close links and rights to
farming resources in rural areas (Mendelsohn et al., 2000). Land rights are some of the most
important constraints hindering development in animal production, also with regard to land
tenure – in particular the common ownership of grazing land (Orskov, 1993). Many
professionals and businesspeople living in urban areas own animals that are grazed together
with those of their rural relatives. The prevailing perceptions are that the resources of common
land are unlimited and that animals raised there are raised on cheap fodder (Orskov, 1993).
Orskov (1993) argued that the problem with this in the long run is the destructive effect of
overgrazing on the frail and arid ecosystem, leading to desertification – the situation currently
being experienced in the NCR.
2.2.2 Brief historical background to NCR
Perspectives on current conditions in the NCR (previously known as Ovambo) are often
coloured by assumptions that the liberation war had a major effect on settlement patterns,
economic activities, migration and demographic patterns, and environmental conditions. The
war clearly hindered the development of communal farming and the expansion of settlements
into unoccupied areas. According to Mendelsohn et al. (2000) development was slow during
the war, but many development projects have focused their activities there since independence,
with the same being true for the provision of other services.
11
The population of the NCR is divided into seven principal ethnic subgroups, namely the
Ndonga, Kwanyama, Ngandjera, Mbalantu, Kwambi, Kwaludhi and Kolokadhi. In the past
there were significant differences in the culture and customs of these subgroups. However, with
the effects of the war, modernisation, and greater economic and social integration of the regions,
these differences have diminished (Tapscott, 1990). Thus, apart from variances in vernacular
and a number of minor social practices, the Oshiwambo-speaking people can, for development
purposes, be considered to be relatively culturally homogeneous (Tapscott, 1990). Mendelsohn
et al. (2000) indicated that the history of the area goes back to before the 19th century, when
trade arose because the economy had developed to such a degree that surplus commodities were
available for sale.
2.2.3 Household economies
Diversity and vigour are the main features of the region’s economy, now evident in the ever-
increasing number of business, entrepreneurial and trading activities (Mendelsohn et al., 2000).
The outputs and objectives of livestock ownership in communal areas are much more diverse
than in commercial livestock production and include draft power, milk, dung, meat, cash
income and capital storage, as well as socio-cultural factors (Bennison, Silverside & Barton,
1998; Sweet, 1998). Hoffmann (2009) observed that livestock provide security, dowries for
marriages, as well as a means of paying a fine when someone has committed a crime against
another. The herds and flocks accumulate a surplus in good years and provide reserves for use
or sale in drought years.
Although rural financial and insurance markets are not well developed, livestock enable farm
families to smooth variation in income and consumption levels over time and also to accumulate
capital and diversity, thus serving a range of socio-cultural roles related to status and the
obligations of their owners. Most households are now engaged in a variety of economic
activities, with incomes from subsistence, employment and diverse business activities
contributing to most. However, there are major disparities in wealth between households, since
rich household have greater diversity of income, more labour, more livestock, larger fields, and
therefore greater access to cash than poor households (Mendelsohn et al., 2000).
12
2.2.4 Farming
According to NOLIDEP (2002) the environment in the NCR is highly variable and this has led
to people adapting to different activities in order to sustain themselves. Mahangu (pearl millet)
and sorghum (sorghum bicolour) are the most important crops, while livestock numbers are
dominated by cattle followed by goats, donkeys and poultry (Araki, 2005; Mendelsohn et al.,
2000). The production systems in the NCR are based on pastoralism and agro-pastoralism, with
the majority of households practising subsistence-based and labour-intensive agriculture and
having limited use of technology and external inputs. Labour is the most important input to crop
cultivation, especially in terms of having adequate labour during critical periods when fields are
ploughed, planted, weeded and harvested (Mendelsohn et al., 2000). Stock numbers tend to be
less evenly distributed between individuals in communal areas than south of the Veterinary
Cordon Fence (SVCF). There is a tendency for high concentrations of people and livestock to
be located near permanent water sources, while other areas remain underutilised due to a lack of
water. Animal numbers tend to be geared more to the quantity of reliable water than to the
reliable quantity of forage – hence the effects of drought tend to be more severe in communal
than in commercial areas (Sweet, 1998).
Mixed livestock ownership is more common in the NCR than in freehold areas. Mainly
indigenous breeds of cattle (dominated by the Sanga breed) and goats, followed by sheep to a
lesser extent, are the generally preferred livestock species and are widely distributed in the
NCR. The pig and poultry breeds found in the area are also generally indigenous. In the
northern communal areas (NCA), many larger herd owners have "cattle posts" away from the
village and crop lands where they maintain most of their animals, keeping only the milk and
draft animals at the village during the wet season (Sweet & Burke, 2006). Those animals kept at
the village at night are brought into an enclosure at the homestead, where the accumulated dung
serves as manure and domestic fuel. In the wet season, during the day, the animals are often
herded by children, but now that the children are in most cases required by law to attend school,
large groups of animals, belonging to several producers, may be grazed together (Mendelsohn et
al., 2000).
13
2.2.5 Livestock diseases and the control thereof
Livestock diseases occurring in the region have two quite different effects on livestock. The
first and most obvious effect is on the health of the animals, especially by reducing their growth
and reproductive rates and causing death. The second relates to the restrictions placed on the
movement of livestock and people’s ability to market livestock products outside the region.
These limits are largely enforced through the quarantine system: the Veterinary Cordon Fence
(VCF) and the quarantine camps. Foot-and-mouth disease (FMD) and lung sickness must be
kept out of the commercial areas, since Namibia’s ability to export beef relies on the animals
being disease free.
Mendelsohn et al. (2000) explained that in addition to the quarantine measures, the Directorate
of Veterinary Services (DVS) conducts annual vaccination campaigns during which cattle are
vaccinated against FMD, anthrax and lung sickness. Cattle in the NCR are vaccinated against
lung sickness, while anthrax vaccinations are only provided in areas where the disease is most
prevalent. Because FMD is suspected to come from Angola and there have been no outbreaks in
recent years, only cattle in a strip along the northern border are vaccinated. The only major
outbreaks of this disease in the NCR occurred in 1946, 1958, 1962, 1967, 1969 and 1970
(Mendelsohn et al., 2000).
2.2.6 Land and governance
To participate in agricultural markets, secure a livelihood in subsistence farming and compete as
an entrepreneur in the rural non-farm economy, it is a prerequisite that a farmer must have three
core assets, i.e. land, water and human capital (World Bank, 2007). The resource and
environmental components of livestock systems, and local and regional competition for them,
complete the picture of a highly complex setting for development interventions (Rich et al.,
2009). The high value attached to land also means that there are strong demands for land, due
mostly to the growing population, with more and more people needing a place to live and to
produce food for subsistence purposes. Thus, the many different levels of authority and users
complicate the use and control of much of the land. At the tribal level, each area is ruled by a
14
chief, who is served by a number of sub-chiefs and headmen (Araki, 2005; Tapscott, 1990).
Households acquire the right to use arable land in their own tribal areas through the head of the
household who makes a payment to the local headman or chief. Yet the assets of the rural poor
are often squeezed by population growth, environmental degradation, expropriation by
dominant interests, and social biases in policies and in the allocation of land.
2.3 Livestock production and marketing in Namibia
Discussed in this section is livestock production in Namibia in general, and cattle production in
particular. Moreover, the marketing of cattle in Namibia in general and in the NCA in particular
is also discussed in this section.
2.3.1 Livestock production in Namibia
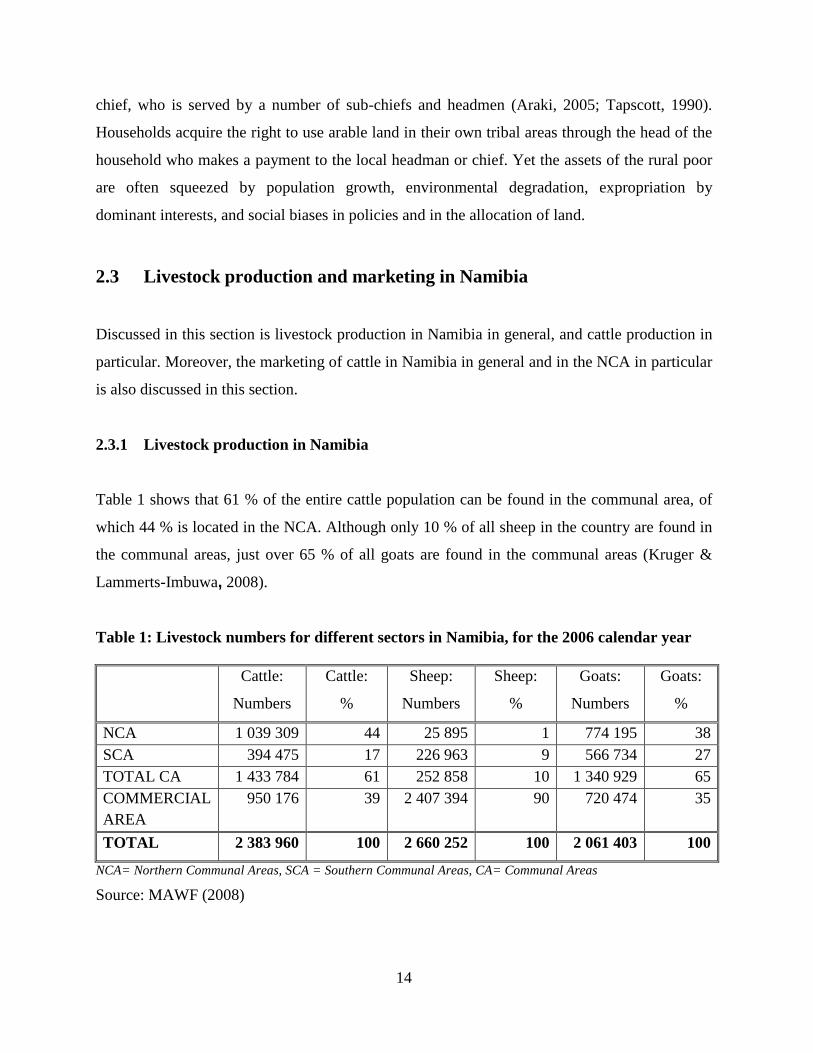
Table 1 shows that 61 % of the entire cattle population can be found in the communal area, of
which 44 % is located in the NCA. Although only 10 % of all sheep in the country are found in
the communal areas, just over 65 % of all goats are found in the communal areas (Kruger &
Lammerts-Imbuwa, 2008).
Table 1: Livestock numbers for different sectors in Namibia, for the 2006 calendar year Cattle:
Numbers
Cattle:
%
Sheep:
Numbers
Sheep:
%
Goats:
Numbers
Goats:
%
NCA 1 039 309 44 25 895 1 774 195 38 SCA 394 475 17 226 963 9 566 734 27 TOTAL CA 1 433 784 61 252 858 10 1 340 929 65 COMMERCIAL AREA
950 176 39 2 407 394 90 720 474 35
TOTAL 2 383 960 100 2 660 252 100 2 061 403 100
NCA= Northern Communal Areas, SCA = Southern Communal Areas, CA= Communal Areas
Source: MAWF (2008)
15
The commercial farming sector, which is almost exclusively based on livestock farming, is the
largest employer in Namibia, providing employment to between 25 000 and 30 000 agricultural
labourers and their dependants (Kruger & Lammerts-Imbuwa, 2008). According to Kirsten
(2002), Ouseb (2006) and Sartorius von Bach (1990), Namibia has been a producer and net
exporter of fine-quality livestock and livestock meat for well over a century and is progressively
operating within a world market where sophisticated clients require sophisticated products and
services. Hoffmann (2009) indicated that Namibia is the largest exporter of lamb and mutton in
Sub-Saharan Africa (SSA). During 2007, meat from as many as 1 277 000 sheep and lambs,
including live animals, was exported mainly to South Africa, while 350 000 goats are exported
to KwaZulu-Natal annually (Hoffmann, 2009).
According to the Ministry of Land and Resettlement (2004/2005), Namibia’s agriculture has
dualistic features that result in two distinct land tenure systems, namely:
• The commercial farming sector (63 million ha) occupying 57 % of agriculturally
usable land. Under this system the land is privately owned, and fenced off. This
sector is capital intensive, well developed and export oriented (Sweet, 1998).
• The communal areas (27 million ha or 43 % of the available agricultural land).
Under this system the land is state owned with common grazing lands, which restrict
the scope for improved management practices.
2.3.2 Cattle production in Namibia
Namibia is an ideal cattle ranching country and its beef products have long been preferred for
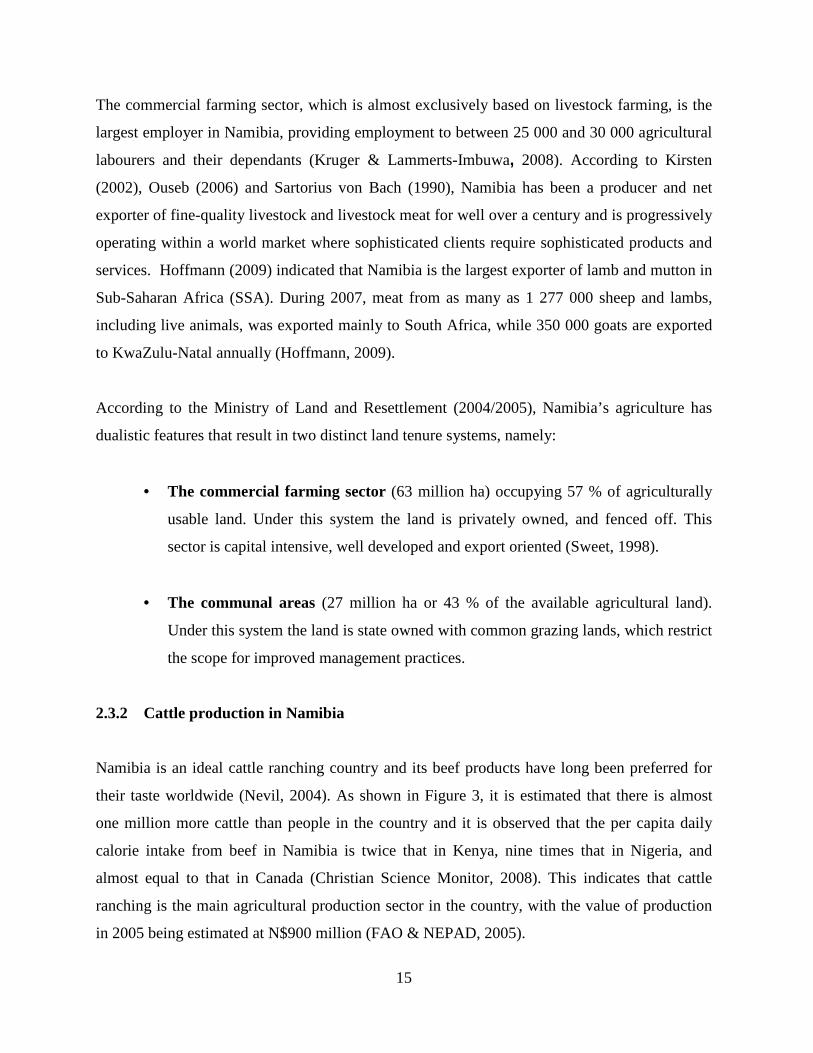
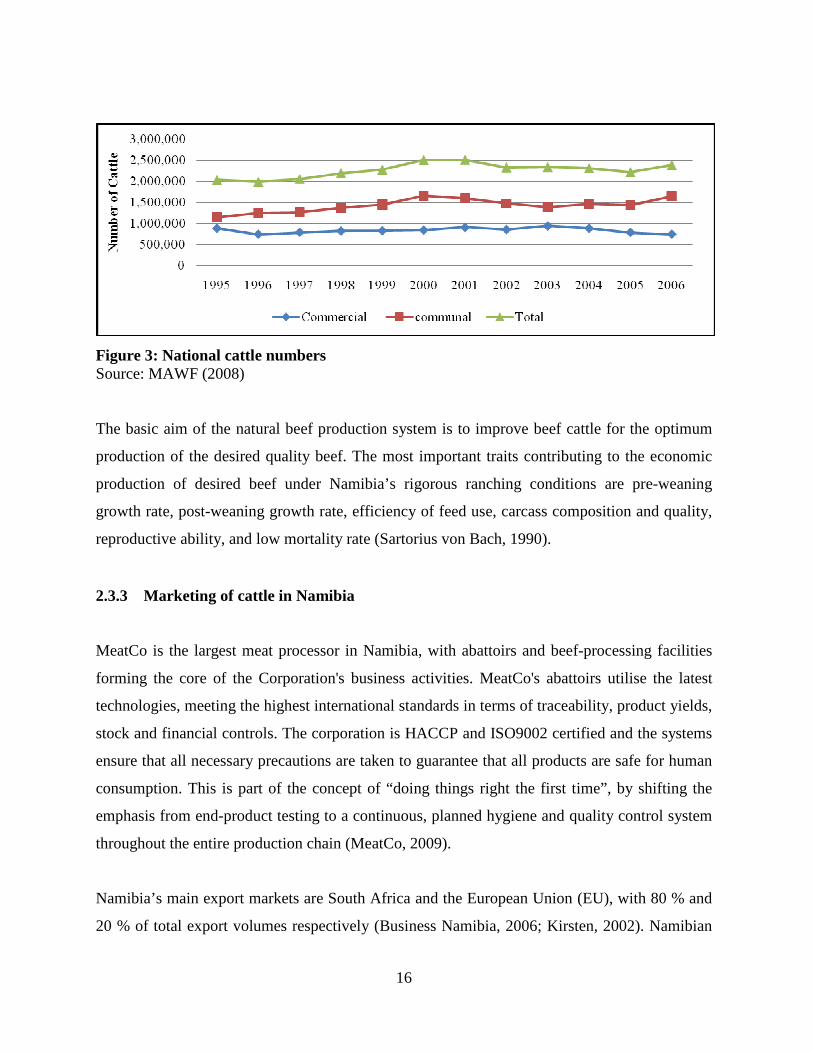
their taste worldwide (Nevil, 2004). As shown in Figure 3, it is estimated that there is almost
one million more cattle than people in the country and it is observed that the per capita daily
calorie intake from beef in Namibia is twice that in Kenya, nine times that in Nigeria, and
almost equal to that in Canada (Christian Science Monitor, 2008). This indicates that cattle
ranching is the main agricultural production sector in the country, with the value of production
in 2005 being estimated at N$900 million (FAO & NEPAD, 2005).
16
Figure 3: National cattle numbers Source: MAWF (2008)
The basic aim of the natural beef production system is to improve beef cattle for the optimum
production of the desired quality beef. The most important traits contributing to the economic
production of desired beef under Namibia’s rigorous ranching conditions are pre-weaning
growth rate, post-weaning growth rate, efficiency of feed use, carcass composition and quality,
reproductive ability, and low mortality rate (Sartorius von Bach, 1990).
2.3.3 Marketing of cattle in Namibia
MeatCo is the largest meat processor in Namibia, with abattoirs and beef-processing facilities
forming the core of the Corporation's business activities. MeatCo's abattoirs utilise the latest
technologies, meeting the highest international standards in terms of traceability, product yields,
stock and financial controls. The corporation is HACCP and ISO9002 certified and the systems
ensure that all necessary precautions are taken to guarantee that all products are safe for human
consumption. This is part of the concept of “doing things right the first time”, by shifting the
emphasis from end-product testing to a continuous, planned hygiene and quality control system
throughout the entire production chain (MeatCo, 2009).
Namibia’s main export markets are South Africa and the European Union (EU), with 80 % and
20 % of total export volumes respectively (Business Namibia, 2006; Kirsten, 2002). Namibian
17
beef is exported primarily to the EU as deboned beef and to South Africa on hoof (mainly
weaners) (Mushendami et al., 2006). The South African market has traditionally been described
as the main destination for Namibian beef due to its proximity, historic political links and the
preferential market access enjoyed by Namibia’s producers under the Southern African
Customs Union (SACU) agreement (Kirsten, 2002).
MeatCo has four abattoirs, two of which are approved for export to the EU. The other two,
namely the Oshakati and Katima Mulilo abattoirs, which are situated in the northern part of the
country, are used for the slaughter of cattle destined for the South African markets. MeatCo also
operates a tannery to maximise local value-adding to its hides. MeatCo is the key player in the
industry and ensures that its viable and internationally accepted operations are major
contributors to the country's economy whilst having a stabilising effect on the industry as a
whole.
The two abattoirs approved for export to the EU are centralised in Okahandja and Windhoek,
since these are the two plants certified to export processed meat products to international
markets. Namibia’s cattle are generally slaughtered at the age of approximately 20 to 30 months
at an average carcass weight of 350 kg (Sartorius von Bach, 1990). Beef producers are
remunerated according to a carcass grading system. A well-established beef carcass grading
system is used whereby beef is classed according to age, fat content and condition. The
classifications A, B and C are indications of age, while the grades 1, 2, 3 and 4 indicate the fat
content or conformation of the beef (Sartorius von Bach, 1990).
According to IFAD (1997), beef is a perishable, relatively high-value luxury product. For such a
product, marketing functions like quality control, hygiene standards, storage and packaging play
an important role, especially in the preference market and the processing of beef. Hence, the
marketing of cattle in Namibia is regulated by three controlling bodies, which ensure that
Namibian meat products are of the highest standard. IFAD (1997) identifies these controlling
bodies as (i) the Meat Board of Namibia, a statutory authority, (ii) MeatCo, a national
corporation involved in livestock slaughter and marketing, and (iii) the DVS within the Ministry
of Agriculture, Water and Forestry (MAWF).
18
These three bodies work together towards the common goal of ensuring the sustainability of the
existing markets and acquiring new ones. IFAD (1997) explained that in commercial areas,
farmers who intend to export livestock, or to supply slaughter stock to MeatCo abattoirs, must
register with the Meat Board and apply for an export permit. The Meat Board of Namibia links
the industry with its customers and is responsible for the development of the industry.
2.3.4 Marketing of cattle in the Northern Communal Areas (NCA)
Cattle purchased by MeatCo from the NCA regions of Kunene North, the NCR and the
Kavango region are slaughtered at the abattoir at Oshakati, while cattle from the Caprivi region
are slaughtered at the Katima Mulilo abattoir. However, the marketing of cattle from the NCA
is restricted by the VCF, as livestock producers north of the VCF are not allowed to freely
market their animals to the SVCF due to FMD and Contagious Bovine Pleuropneumonia
(CBPP) restrictions (Düvel, 2001). These restrictions are in line with requirements on animal
disease control imposed by the major export markets, namely South Africa and the EU. The
relatively lucrative export market for weaners to feedlots in South Africa is therefore not
accessible (due to VCF policy) for northern communal producers (NASSP, 2005). Namibia had
been exporting beef products from the northern communal abattoirs to South Africa after
quarantining cattle for 21 days, up until the last quarter of 2008, when South Africa stopped
importing beef from the north of Namibia due to an FMD outbreak in the Caprivi and North-
Eastern Kavango regions. This prompted the industry to lift the usage of the quarantine system
in the NCR pending negotiations to resume the exportation of meat products to South Africa
from the NCA. Nevertheless, in the meantime, Namibia has negotiated an alternative market in
Angola, to which it sells beef products from the Oshakati abattoirs without quarantining cattle
from the NCR. However, the quarantine system in the North-Eastern Kavango and Caprivi
regions is still in operation.
MeatCo’s procurement of cattle from the NCA for slaughtering purposes started in 1992 with
the purchasing of live animals in the veldt at various collection points, with producers receiving
cash on the spot. The process gradually evolved into a “self-quarantining” system, after a
training and mobilisation process that saw almost 78 % of producers becoming empowered to

19
market through such a self-quarantining process. The remaining cattle were procured through
speculators, which resulted in a decline in animals marketed through formal markets (Kruger &
Lammerts-Imbuwa, 2008).
Communal producers have been known to criticise the way in which MeatCo approaches the
marketing of livestock, namely the low prices paid by MeatCo, the absence of competitors, and
the lack of access to meat markets of the SVCF, which are deemed to be the major constraints
to increasing their livestock sales (Arbirk & Vigne, 2002).
Arbirk and Vigne (2002) acknowledged the generally poor condition of the animals delivered to
the abattoir and the long distances over which producers must transport the animals to the
abattoir. Producers in Oshana and the North-West area of Oshikoto must transport their animals
over distances of more than 200 km to reach the abattoir (NOLIDEP, 2002). Research has
shown that cattle lose 2.5 % of their mass during the first 24 hours of travel and thereafter 0.5 %
every hour (Sartorius von Bach, 1990). With such long travelling distances, loss of beef quality
occurs due to bruising, since stress during transport tends to cause dark-cutting beef, which is
undesirable.
Keeping in mind the brief background above, MeatCo’s abattoir in Oshakati, which is supplied
with cattle from the NCR, where the producers are supposed to slaughter 280 cattle per day,
operates at only 40 % capacity (FAO & NEPAD, 2005). The production process requires meat-
export abattoirs to ensure a consistent and continuous supply of meat in order to meet the
demand of customers in the importing countries (Negassa & Jabbar, 2007). Figure 4 shows the
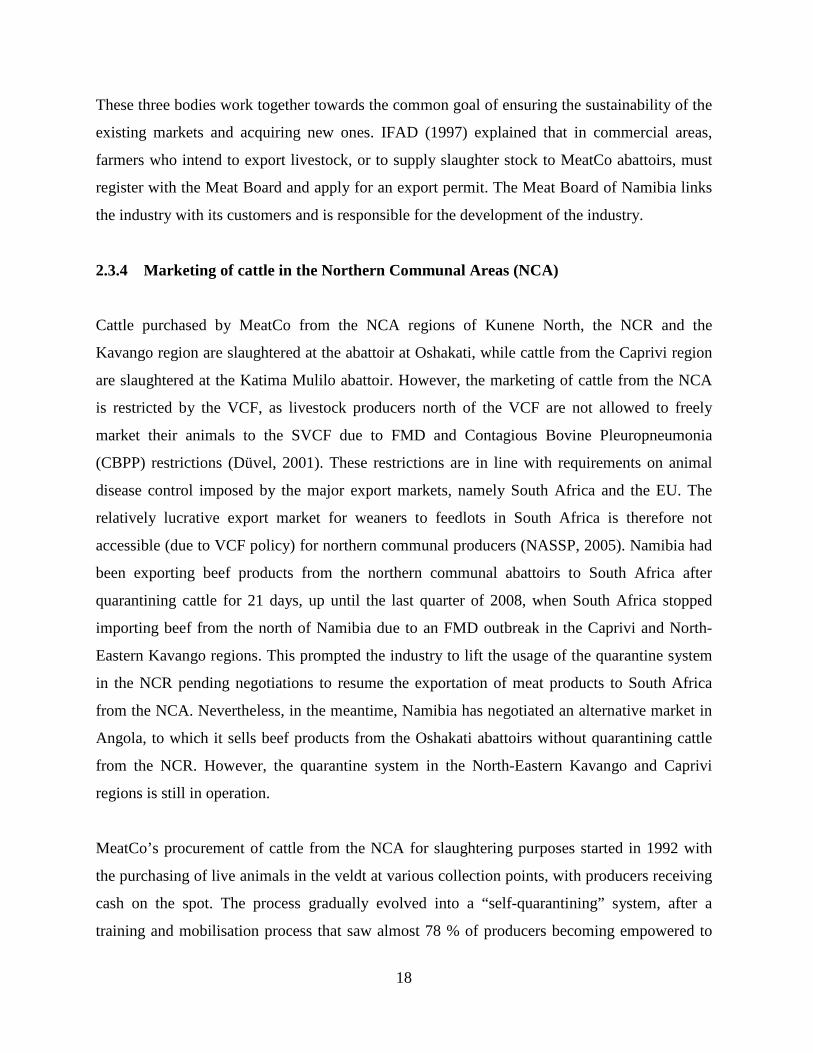
cattle marketing figures applicable to the NCA, export abattoirs, butchers, and South Africa.
The figure also illustrates the low number of cattle marketed from the NCA compared to the
number of cattle in the communal area as shown in Figure 3 above.
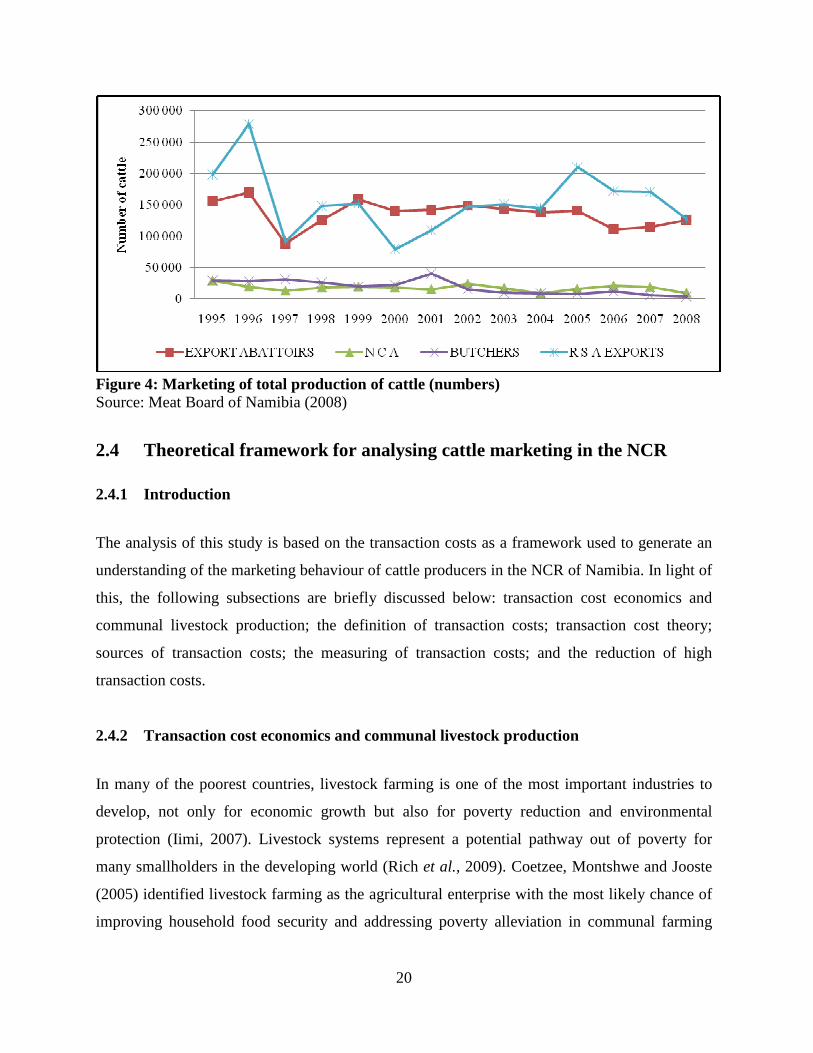
20
Figure 4: Marketing of total production of cattle (numbers) Source: Meat Board of Namibia (2008)
2.4 Theoretical framework for analysing cattle marketing in the NCR 2.4.1 Introduction
The analysis of this study is based on the transaction costs as a framework used to generate an
understanding of the marketing behaviour of cattle producers in the NCR of Namibia. In light of
this, the following subsections are briefly discussed below: transaction cost economics and
communal livestock production; the definition of transaction costs; transaction cost theory;
sources of transaction costs; the measuring of transaction costs; and the reduction of high
transaction costs.
2.4.2 Transaction cost economics and communal livestock production
In many of the poorest countries, livestock farming is one of the most important industries to
develop, not only for economic growth but also for poverty reduction and environmental
protection (Iimi, 2007). Livestock systems represent a potential pathway out of poverty for
many smallholders in the developing world (Rich et al., 2009). Coetzee, Montshwe and Jooste
(2005) identified livestock farming as the agricultural enterprise with the most likely chance of
improving household food security and addressing poverty alleviation in communal farming
21
areas. The so-called livestock revolution has been an important feature of both developed and
developing countries. Furthermore, livestock and meat products have been among the fastest
growing components of the global agriculture and food industry (Morgan & Tallard, 2006;
SARD, 2007). Moreover, livestock systems are characterised by long marketing chains
featuring great distances, numerous phases of weight gain and feeding regimes, multiple levels
of traders and transactions, a multitude of steps and stages of processing, and a variety of
employment-creating services and inputs (Rich et al., 2009).
Southern African countries should have been able to realise their full potential to increase beef
production and exports and thus stimulate economic growth and increase export earnings.
However, several factors have limited their ability to realise this potential. Sartorius von Bach
et al (1998) identified the factors hindering the full production potential of livestock in
communal areas as low off-take rates and a land tenure system that is not conducive to
producers conserving the grazing resources and genetically improving their herds. Furthermore,
Pingali et al. (2005) stated that in the case of small-scale farmers, there are certain difficulties
hindering them from commercialisation, which arise from a lack of public goods, which
hampers market exchange, as well as the new set of transaction costs that emerged from dealing
with the food system. Commercialisation and market expansion are essential for exploiting the
potential of any commodity in the economic development process (Jabbar, Benin, Babre-
Madhin & Paulos, 2006). Many small-scale producers are locked into traditional modes of
production, too far removed to meet the requirements of modern food systems, and transaction
costs have therefore tended to become prohibitive.
Alene et al. (2007) and Matungul, Lyne and Ortmann (2001) explained that smallholders in
Africa often face high transaction costs in the production and marketing of agricultural outputs
owing to the nature of their products and the institutional environment in which they operate. In
the African context, poor road and logistic conditions are a common bottleneck to increased
intra-regional trade. Furthermore, inadequate market information flows and high illiteracy rates
among market operators also hamper livestock marketing (Iimi, 2007). Transaction costs mean
different things to different groups of people, and thus all risks have to be understood within the
larger social, cultural and economic context (Doss et al., 2005). By understanding these
22
subjective perceptions of transaction costs, better policies can be designed that address objective
sources of transaction costs while helping individuals and cattle producers to develop better
methods of coping with such costs.
2.4.3 Definition of transaction costs
There is no standard definition of the term ‘transaction costs’, since the literature contains
various definitions thereof. According to Singh (2004) the term can be broadly interpreted to
include costs associated with market exchange, including the cost of searching for options,
negotiating contracts and enforcing agreements. Hobbs (1997) and Matungul et al. (2001)
defined ‘transaction costs’ as those costs involved in exchange or trade (e.g. marketing costs),
the cost of intangibles (e.g. search for exchange partners), as well as the cost of contract
monitoring and enforcement. Walter and Boeckenstedt (2007) defined transaction costs as
logistic costs, including cash payments and amortised costs associated with post-production
handling, packaging, storage, inventory carrying and transportation. Alene et al. (2007) and
Pingali et al. (2005) defined transaction costs as the embodiment of barriers to market
participation by resource-poor smallholders, which has been used as a definitional characteristic
of smallholders and the factors responsible for significant market failures in developing
countries. Jabbar et al. (2006), Jabbar et al. (2008) and MacInnis (2004) specified physical
marketing costs, e.g. transport and storage and transaction costs, arising from the co-ordination
of the exchange among relevant market agents, including the cost of obtaining and processing
market information, negotiating contracts, monitoring agents, and enforcing contracts.
Nkhori (2004) cited Jaffee (1991) in his definition, separating transaction costs into the
following categories:
• Search costs – These are the costs associated with identifying and contracting
potential buyers and sellers, and the quality of resources in which they have property
rights. Search costs such as information costs and communication costs arise ex ante
from an exchange. Moreover, given livestock systems’ employment and value
addition multipliers, as well as its susceptibility to external shocks such as climatic

23
events and politically motivated trade barriers, the impact of interventions could be
counterintuitive and difficult to determine (Rich et al., 2009).
• Bargaining costs – These are the costs involved in gathering price information on
other transactions and other factors that might influence either party’s willingness to
bargain.
• Monitoring costs – These costs include the costs associated with monitoring the
contract agreement to ensure that its conditions are fulfilled. Monitoring costs occur
ex post to a transaction.
• Enforcement costs – These are the costs of enforcing the exchange agreement.
Enforcement costs occur ex post a transaction and include the costs associated with
default provisions in contracts, i.e. the collection of damages when a partner fails to
observe the contractual obligations.
Nkhori (2004) pointed out that such a list of transaction costs affecting the exchange of
agricultural and livestock products is non-exhaustive. Jaffee and Mortan (1995), cited in Nkhori
(2004), added two categories of transaction costs involved in the marketing of agricultural
products, namely:
• Transfer costs – These refer to the costs of marketing services performed in the
physical handling of the commodity, such as transport, storage, retailing and
wholesaling. Examples of such costs are transport costs, costs associated with the
risk attitude of producers, and administrative costs.
• Screening costs – These are costs that are associated with gathering information
about the reliability or trustworthiness of a particular party and the quality of goods
being transacted.
2.4.4 Transaction cost theory
Transaction cost theory is a powerful and generally theoretical framework that seeks to explain
institutional development and organisational efficiency (Bartle, 2002). Chen, Chang, Huang and
Liao (2006) recommended that transaction cost theory be seen as a viable means of explaining
the acquisition decision in marketing channels. Singh (2004) observed that if transaction costs
24
are high enough, the market does not exist in the sense that the quantity exchanged is zero.
Musemwa, Mushunje, Chimonyo, Frazer, Mapiye and Muchenje (2008) explained that
transaction costs are considered to be barriers to the efficient participation of producers in
different markets. Thus, producers will not use a particular channel when the value of using that
channel is outweighed by the costs of using it (Musemwa et al., 2008). Transaction costs, which
are distinct from physical marketing costs such as those for transport and storage, arise from the
co-ordination of exchange among market actors (Gabre-Madhin, 2001). De Bruyn et al. (2001)
argued that market transactions do not occur in a frictionless environment. Transaction costs are
economically equivalent to frictions in physical systems (MacInnis, 2004). Reflecting frictions
in the economic environment, transaction costs vary in type and magnitude regarding the
characteristics of the market where the transaction occurs. The terms on which transactions take
place are complex and diverse, and may be strongly structured by ideological and social factors
(Matungul et al., 2001). Chen et al. (2006) observed that differences in the character of
exchange levels, such as uncertainty, frequency and asset specificity, can influence the
transaction costs. Uncertainty can arise within a multitude of domains, and can also be
attributable to a number of different causes (Joshi & Stump, 1999). Consequently, Gabre-
Madhin (2001) and Jabbar et al. (2008) explained that transaction costs are unique and specific
to individual agents, and therefore each agent in the market conducts transactions on the basis of
his/her own costs. Some transaction costs are fixed, as they are invariant with quantities of
exchange, while others are variable, as they vary with quantities of exchange. Transaction costs
can explain why some producers participate in markets while others are simply self-sufficient.
Differences in transactions costs, as well as differential access to assets and services to mitigate
these transaction costs, are possible factors underlying heterogeneous market participation
among smallholders (Alene et al., 2007).
Agricultural production and marketing is an expensive venture to undertake, because producers
operate in an environment in which they face a number of transaction costs. In African
economies that are only partly commercialised, communal producers are having greater
difficulty than commercialised producers in adopting and profiting from new opportunities
(Dovie & Shackleton, 2003; Nkhori, 2004). It is a well-known fact that most livestock in
communal areas are grass-fed and are typically slaughtered at lower weights than their grain-fed
25
counterparts due to slower growth rates, and they consequently yield carcasses that are inferior
in terms of marbling and tenderness, as well as taste-panel palatability ratings (Evans, Brown,
Collin, D’Souza, Rayburn & Sperow, 2008). Thus, producers require reliable information on
cattle prices, the optimum selling time (depends on the market cycle in a given area), the
channels available, and the breed, age and condition of the cattle that render the highest returns.
The decentralisation of livestock markets and the wider dissemination of well-updated market
information to the small-scale producers by the government and other stakeholders involved in
agriculture can play a role in improving small-scale producers' access to formal cattle markets.
Musemwa, Chagwiza, Sikuka, Fraser, Chimonyo & Mzileniet (2007) found that the provision of
market information will strengthen producers' negotiating ability during transactions with
individual speculators and consequently prevent the possible exploitation of producers by
better-informed buyers. The principle behind transaction costs is that people prefer to conduct
transactions in a way that minimises their transaction costs. Transaction costs have no value for
either the buyer or the seller (Chen et al., 2006).
2.4.5 Sources of transaction costs
Transaction costs arise from the performance (efficiency) of the marketing system, which
depends on the structure and conduct of the market. Thus, transaction costs result from
information inefficiencies and institutional problems such as the absence of formal markets and
appropriate practices to address certain problems. Jabbar et al. (2008) acknowledged that
contract violations may be common, especially in cases of credit transactions where there is no
established institutional mechanism to easily resolve conflicts arising from contract violations in
the case of credit transactions in the short term, and the risk of default may be considered by
traders as a factor in price negotiations. Thus, the presence of transaction costs is often reflected
by the difference or discrepancy between perceived buying and selling prices (Madola, 2008).
In the market for fruits and vegetables, in particular, transaction costs include costs associated
with complying with phytosanitary procedures, such as treatment, inspection, and storage
during quarantine (Gauthier, 2000). Food safety and environmental regulations in general also
add costs to the process of bringing a product from the point of production to the point of
26
consumption. According to Madola (2008), market failures are caused by, amongst other things,
asymmetric information and high transactional costs. These market deficiencies tend to be
widespread and severe in the poor rural areas of Africa characterised by insufficient hard
(roads) and soft (telecommunications) infrastructure. Discussed further in this section are the
four types of costs that are believed to be the source of transaction costs, namely information
costs, negotiation costs, monitoring costs, and product nature costs.
2.4.5.1 Information costs
Information costs arise prior to a transaction. Before making a decision on how to market a
certain product and to whom that product will be sold, the cattle producer must first determine
the price that he expects to receive. Hobbs (1996) argued that economic agents face costs in the
search for information about products, prices, inputs, and buyers or sellers. The cost of
obtaining price information depends on the extent to which there is readily available
information on market prices (Hobbs, 1997). Crase and Dollery (1999) argued that the
limitations of humans may be such that they lack the skills, knowledge and intelligence to
process information on products even within a bounded rationality framework. Hence, the more
time and energy spent on searching for market information, the higher the information costs
(Gong, Parton, Cox & Zhou, 2007). These informational bottlenecks may be aggravated by an
inadequate or poor rural road network, which hinders the flow of information. Households
living in places where roads are impassable may not have easy access to up-to-date information
about the markets and market prices (Nkhori, 2004). Ayars (2003), Bartle (2002) and Li (2008)
described the important elements of transaction cost economics as being bounded rationality
and opportunism, which are referred to as behavioural assumptions underpinning transaction
cost analysis.
Bounded rationality refers to the fact that individuals are bounded by the limits of their own
knowledge. Human beings are unable to make rational decisions due to their finite capacity to
absorb, process, and obtain information (Ayars, 2003). That is, people might not make a
rational decision based on the information that is available to them, because that information
might be too complex for them. Hobbs (1997) argued that although cattle producers can predict
27
general price trends at an auction sale, they cannot know the actual price that the cattle will
fetch before the auction takes place. Uncertainty exists when decision-makers do not have
enough information to make rational decisions, but individuals may also be bounded in their
rationality when they have too much information (Chen et al., 2006; Li, 2008). High levels of
uncertainty and complexity thus result in higher transaction costs as the exchanging parties try
to minimise bounded rationality (Anding & Hess, 2002).
Opportunism is a consequence of using a situation to one’s best advantage (Li, 2008).
Economists contend that asymmetric information arises when exchanging parties have different
degrees of information, with the more informed party then using his/her position in his/her best
interest (Bartle, 2002). Opportunism with information asymmetry leads to moral hazard and
adverse selection, because it is not possible to determine which parties, if any, will act
opportunistically (Ayars, 2003). Therefore, transaction costs are incurred in exchange under
asymmetric information when the less-informed party tries to reduce the problem of
opportunism. Thus, certain transactions are more risky if the parties involved are not fully
informed about one another’s preferences or capabilities (Katja, 2002).
2.4.5.2 Negotiation costs
Negotiation costs arise from the physical act of the transaction and are influenced by the way in
which the transaction is carried out. As an example, Hobbs (1996) identified the opportunity
cost of the time taken by procurement staff to locate supplies of cattle as being a negotiation
cost. The cost of transporting cattle to the marketplace is often considered in traditional analyses
of marketing costs (Hobbs, 1997). However, such costs can also be transaction costs if they are
specific to that marketing channel. In order to use the formal marketing channel in the NCA, the
cattle must be transported from the farming area (cattle post) to the quarantine camp and from
the quarantine camp to the slaughterhouse. Acharya (2006) observed that if there are long
distances involved in reaching a market, this serves as a disincentive for most producers with a
small surplus to sell. Transport and transportation costs are the most prominent sources of
transaction costs. These costs increase with distance from the market, as well as unavailability
of transport. When the condition of the roads is poor, transporters increase their fees to
28
compensate for the damage to their vehicles emanating from the use of such roads (Dovie &
Shackleton, 2003).
2.4.5.3 Monitoring costs
Monitoring or enforcement costs arise after a transaction. It may be necessary to monitor the
quality of goods from a supplier or to monitor the behaviour of a supplier (or buyer) to ensure
that all pre-agreed terms of the transaction are complied with (Hobbs, 1996). Producers may
accrue monitoring costs in ensuring that the cattle are handled correctly during transportation to
the quarantine camp and to the buyer’s premises. If there is a concern among buyers that the
cattle are highly stressed or have been bruised as a result of additional handling and
transportation, they may discount the prices that they are prepared to pay for the cattle.
2.4.5.4 Product nature costs
Chen et al. (2006) explained that human nature and the environment of exchange can cause
market failure due to unacceptably high transaction costs in transaction processes, while
differences in the character of exchange level – such as uncertainty, frequency and asset
specificity – can also influence the transaction costs. Gong et al. (2007) observed that when
selling live animals directly to processors, cattle producers may face grade uncertainty, which is
determined only after the animal has been slaughtered. Although a price is agreed upon before
the cattle leave the farm, the producer’s return may be lower than expected if the cattle do not
grade as expected.
A farmer may deliver his or her produce to market and discover that it fetches a much lower
price than expected. It may be impossible for a farmer to determine whether the lower price is
due to random shocks to the supply or demand function, and to know what to do differently next
time (Grosh, 1994). This leads to high transaction cost sensitivity, which indicates less
differentiation in that the seller needs to put in higher differentiation costs to reduce the effect of
transaction costs. However, this constitutes a lower seller margin, as both the producer and the
buyer are leaders (Chen et al., 2006).
29
2.4.6 Measuring transaction costs
The effects of transaction costs in the marketing of agricultural products have been thoroughly
studied in transitional and developing economies where markets are thin and fledging, and
where the necessary infrastructure is missing or embryonic (MacInnis, 2004). As described by
Hobbs (1997), transaction cost economics, unlike traditional neoclassical economic theory,
recognises that commercial activity does not occur in a frictionless economic environment.
Transaction costs are not available on financial records and are inherently difficult to measure
or quantify (Jabbar et al., 2006; MacInnis, 2004). The New Institutional Economics (NIE)
approach finds that the unit of analysis is the transaction rather than the price (Gabre-Madhin,
2001).
Despite the measurement difficulties, there have been a number of empirical studies on the
effect of transaction costs on agricultural marketing. Quantifying transaction costs can be
accomplished by ranking the preferences of different observers, in this case cattle owners. De
Bruyn et al. (2001) found that if ceteris paribus a particular type of transaction cost is higher in
situation A than in situation B, and different individuals consistently specify the same ranking
whenever the two situations are observed, then transaction costs are measurable.
Nicholas (1987) contended that the specification of transaction cost functions is not an easy
matter, and the specification of the cost of alternative institutional arrangements has not
progressed by much. Jabbar et al. (2008) observed that most trading practices are observable
and measurable in some form, but some transaction costs may not be observable and
measurable. Despite MacInnis (2004) confirming the difficulty of obtaining data on transaction
costs, Hobbs (1997) applied a two-limit Tobit Model to estimate the relative importance of
various transaction costs and farm characteristics on channel selection.
Vakis, Sadoulet and De Janvry (2003) argued that, although transaction costs are difficult to
measure, understanding their impact on behaviour is crucial, as it can inform policy design
aimed at reducing those costs. Contrary to previous work in this regard, transaction cost analysis
provides a superior theoretical foundation in that it avoids mechanistic processes of increasing
commitment and relies on realistic behavioural assumptions and firm-specific factors (Klein,
30
1989). According to Frauendorf, Gnoth and McCole (2005), transaction cost theory can be
considered as the basic theoretical framework that analyses the relationship between the cattle
producer and the cattle buyer; thus, the theory embeds and governs both sides of the process. It
is an approach with which many marketing theorists are becoming familiar. Chen et al. (2006)
argued that transaction cost theory has been applied to analyse many issues such as the strategic
impact of information systems, as well as resource allocation and outsourcing decisions;
however, little attention has been paid to the structure of the marketing channel. Nicholas
(1987) confirmed that, despite these empirical problems, the transaction cost model has gained
widespread acceptance among economists and business historians interested in international
business. Therefore, transaction cost explanations are increasingly being cited in the marketing
literature, dealing with structural as well as behavioural issues. This theory was used by Jabbar
et al. (2008) to measure the influence of market institutions and transactions on trader
performance in live animal marketing in rural Ethiopian markets; by MacInnis (2004) to
measure the transaction costs involved in the marketing of organic produce in the USA; by
Nicholas (1987) to conduct an empirical test of the transaction cost model in terms of the
evolution of the pre-1939 British manufacturing multinational; by Klein (1989) to explain the
analysis of transaction costs in terms of vertical control in international markets; and by Chen et
al. (2006) to develop a transaction cost linear demand function to investigate channel decision-
making when transaction costs exist (a game-theoretic analysis). Nkhori (2004), in turn,
identified the transaction cost factors and household characteristics that influence the producer’s
choice of cattle marketing channel in the Mahalapye district of Botswana.
2.4.7 Reducing high transaction costs
This section briefly explains the strategies that may be used to reduce transaction costs. It is
important to mention that transaction costs cannot be eliminated completely from the system,
but can only be reduced. This section discusses how transaction costs can be reduced through
the use of information technology; how transaction costs may be reduced by instilling trust
between the two parties involved in the transaction; and how the provision of education can be
used to reduce transaction costs.
31
2.4.7.1 Transaction costs and information technology Although the virtues of Information Technology (IT) have sometimes been exaggerated almost
to the point of mania, one can assert without too much fear of contradiction that IT has a
significant impact on the lives of people in industrialised countries (Singh, 2004). The use of IT
can dramatically increase the ability to share information, which affects the economics of
private and public provision of information, goods and services. Singh (2004) stressed that IT
can improve efficiency, thus making firms in developing countries more globally competitive
and bringing many benefits to their wealthy consumers, whose consumption patterns closely
resemble those of consumers in the developed world. Thus, IT is a tool of the rich, and is of
limited relevance to the poor masses in developing countries where they are deprived of basic
healthcare, sanitation and education. Therefore, Singh (2004) argued that IT can significantly
reduce the high transaction costs faced by poor consumers, which can have a long-lasting
positive impact on economic development. The possibilities for interactivity with IT-based
educational materials illustrate the advantages of IT over older technologies based only on
recording and duplication. Long-distance interactive communication in an educational context
can also be considered as a means of reducing transaction costs, since physical travel is
eliminated or reduced. A study on transaction costs and market efficiency done by Gu and Hitt
(2001) found that as transaction costs decline, individuals increase their use of the market,
which results in an increase in the overall degree of ignorance of the individuals accessing the
markets directly.
A study done in the United States (US) by Tronstad (1994) to compare livestock marketing
alternatives found that electronic marketing methods may hopefully increase the number of
legitimate buyers by decreasing the transaction costs and translating into a higher net price for
the producer and lower costs for the buyer. However, the extent to which transaction costs will
decrease depends greatly on information, volume, location, and trucking costs.
32
2.4.7.2 Trust A lack of trust among vertically related members of the supply chain is one of the underlying
challenges in a commodity system (Lawrence, 2002). Trust and reputation are therefore
essential to a long-term business partnership. However, building trust and reputation is a
gradual and interactive process, as well as time- and resource-consuming (MacInnis, 2004). The
existence of trust has been found to reduce transaction costs by avoiding costly negotiations and
contracting and may also enhance alliance revenues by facilitating a more complete interaction
of the alliance partners’ resources (Madola, 2008). Here parties recognise that they need each
other and rely on this need to maintain the relationship and guide the contract. Trust reduces
transactions costs, because it acts as a counterbalance to opportunistic behaviour (Ayars, 2003).
2.4.7.3 Provision of education
The provision of physical and legal infrastructure, information and education through extension
and agricultural research may further reduce transaction costs. Government policies, education,
knowledge, and access to capital are important factors in market participation by small-scale
producers in Third World countries (Matungul et al., 2001). Better infrastructural development
and effective support services such as research, coupled with more secure access to land, is
essential if transaction costs are to be reduced.
2.5 Related research This section examines the related research conducted on livestock marketing in the Namibian
context. The purpose of this section is to ensure a good understanding of the background to
livestock marketing in Namibia in general, signifying a directional guide to this study.
Due to access difficulties, very little research relating to the marketing of cattle in Namibia was
found for purposes of this study. However, of the few research studies available, the following
proved informative:
33
• Düvel (2001): “Livestock marketing in northern Namibia: Cultural versus economic
incentives”, aimed at analysing the perceptions of livestock producers with regard to the
marketing of cattle, found that decision-making is significantly influenced by numerous
socio-cultural considerations, which in many cases even overshadow the economic
considerations.
• FAO and NEPAD (2005): “Livestock improvement”, which found that although much
has been done to create the necessary marketing infrastructure to overcome marketing
constraints in communal areas, much more still needs to be done. The study revealed
that only 10.2 % of cattle slaughtered at MeatCo (Oshakati) are young (under the age of
36 months), while 51.1 % are adult animals. In addition, it was found that average
carcass weight of cattle slaughtered at Oshakati is 170 kg, approximately 33 % lower
than the 240 kg observed in the commercial areas of Namibia.
• Mushendami et al. (2006): “Unleashing the potential of the agriculture sector in
Namibia”, which acknowledged that the 2004 decline in the number of cattle marketed
could be ascribed to the good rainfall at the time, which resulted in producers holding
their cattle for restocking.
• Nambundunga-Xulu, Shikongo-Kuvare and Masaire (2008): “Improvement of slaughter
data collection and hygiene standards in informal meat markets of Namibia’s communal
area (NCA) North of the Veterinary Cordon Fence (VCF)”, which had the two
independent objectives of improving the capturing of off-take estimates resulting from
livestock slaughtering, and influencing national efforts towards improving meat safety.
• Ouseb (2006): “An investigation into the implementation of the FANMEAT Scheme
among the Grootberg area communal producers of North-Western Namibia”, which
elaborated on FANMEAT being at the forefront of ensuring that the highest animal
welfare standards are maintained and that the production of meat products adheres to
environmentally friendly principles.
34
The Tobit Model developed by Tobin in 1958 has been widely used to deal with censored
observations (dependent variable with data that is partially observed) (Anastasopoulos, Tarko &
Mannering, 2008; Zhang, Huang & Lin, 2006). Gong et al. (2007) used the model to examine
key factors affecting cattle farmers’ selection of marketing channels and to draw implications
for the development of China’s beef supply chain. Hobbs (1997) used the Tobit Model to
measure the importance of transaction costs in cattle marketing in the US, whereas MacInnis
(2004) applied the same model to measure transaction costs in the marketing of organic corn
and soybeans in the US. However, these researchers modelled the marketing decision by
assuming it to be a single-decision framework without considering that this model is highly
restrictive. Lin and Schmidt (1983) detected a problem with the Tobit Model in that it links the
shape of the distribution of the positive observations and the probability of a positive
observation. They further found that the shape of the distribution of the positive observations
would have to resemble the extreme upper tail of a normal, which would imply a continuous
and faster-than-exponential decline in density as one moves away from zero. Conversely, when
zero occurs less than half of the time, the Tobit Model necessarily implies a non-zero mode for
the non-zero observations (Lin & Schmidt, 1983). According to Zhang et al. (2006), the Tobit
Model has been shown to be inadequate in characterising the two processes in market
behaviour.
Bellemare and Barrett (2005) presented an ordered Tobit estimator – a two-stage econometric
model determining marketing behaviour, highlighting the implications of different assumptions
about a household’s (discrete) participation and (continuous) volume decisions, based on
evidence from Kenya and Ethiopia. Ehui, Benin and Paulos (2009) applied a two-step procedure
to provide an empirical basis for identifying options to increase participation and sales of
smallholder producers in livestock markets in Ethiopia. However, these researchers did not test
whether it is sufficient to model the analysis as a double-hurdle model.
Apart from using a double-hurdle model to (i) determine the factors influencing the producer’s
decision on whether or not to use the formal marketing channel, and (ii) determine the factors
influencing the proportion of cattle marketed through the formal market, this study also
encompassed the formal testing of whether it is sufficient to model the analysis as a one-
35
decision-making model or as a two-decision-making model, using Cragg’s Model. Hence, as far
as is known, this study is the first of its kind to focus on livestock marketing behaviour.
This concludes Chapter 2, which extensively explored the background to the study area and also
thoroughly reviewed and incorporated related research on cattle marketing in Namibia, in order
to lay the foundation for the study and impart the necessary understanding. Lastly, a theoretical
framework for the analysis of cattle marketing in the NCR, and the uniqueness of the study in
relation to other such studies, was briefly discussed.

36
CHAPTER 3
DATA AND METHODOLOGY
3.1 Introduction The development of the questionnaire, the data collection method and other procedures used to
meet the objectives of the study are discussed in this chapter. The chapter consists of two
sections: Section one is presented in the form of three sub-sections, namely the questionnaire,
the sampling procedure, and the survey. Section two discusses the characteristics of the
respondents, the simplicity of dependent variables in the regression of the cattle marketing
decision, and the simplicity of explanatory variables in the regression of the cattle marketing
decision.
3.1.1 Questionnaire design
In order to identify the important factors affecting producers’ marketing decisions, a structured
questionnaire was used to gather primary data (see Appendix A). It was designed to capture and
identify factors (such as respondents’ characteristics, monitoring cost variables, negotiating cost
variables, inspection costs and productivity variables) that could influence the producers’
marketing behaviour. The questionnaires of Gong et al. (2007), Hobbs (1997), Laubscher,
Spies, Rich, Taljaard, Jooste, Hoffman, Baker and Bonnet (2009), MacInnis (2004) and Nkhori
(2004) were used as guidelines in structuring the questionnaire used in this study. The
questionnaire was designed to gather information on a wide range of potential transaction cost
variables. However, since not all the variables were used in the analysis, a check was conducted
on the variables considered to have a potential influence on cattle-marketing behaviour in the
study area.

37
3.1.2 Sampling procedure
Four regions (Omusati, Oshana, Ohangwena and Oshikoto) were sampled with an average of
thirty respondents per region. A random sampling method was used, provided that a producer
had sold or purchased cattle at least within the 12 months prior to the survey date. The survey
was conducted with the assistance of extension officers, who were asked to identify suitable
respondents in the various constituencies.
3.1.3 Survey
The survey was conducted between June and August 2009 amongst 121 respondents from the
four selected regions. The questionnaires were completed in the form of personal interviews in
order to ensure adequate responses and accuracy. The majority of the producers were visited
individually on their homesteads or in their production area (cattle post), or at their respective
business areas, with appointments made two days in advance. The remaining respondents were
interviewed during meetings organised by extension officers at their respective gathering points.
Although the questionnaire was designed in English, producers were asked the questions in their
local language (Oshiwambo) and information was directly entered into the questionnaire and
afterwards captured on computer.
3.2 Characteristics of respondents 3.2.1 Simplicity of dependent variables in the regression of the cattle-marketing decision
The general postulation upon which this analysis is based is that a farmer’s choice of cattle
marketing channel is influenced by a number of transaction cost variables, but may also be
influenced by the characteristics of the farmer. The choice to sell through the formal market is
the key variable of interest in this analysis. Cattle producers in the study area have the option to
sell through either the formal market (MeatCo) or an informal market. The choice of marketing
strategy was determined by means of a questionnaire in which respondents were asked to
indicate the number of cattle sold through MeatCo and the number sold through an informal
market. The dependent variable was a binary choice, with a value of 1 given to those
38
respondents choosing to sell their cattle through MeatCo and a value of 0 given to those using
only informal markets. Twenty-two (18 %) respondents indicated that they had never marketed
their cattle through the formal market, while eight (7 %) respondents revealed that they had
never used an informal market, and ninety-one (75 %) respondents claimed to have used a
combination of the two available markets. Marketing through the formal market in the area is
highly monopolised by MeatCo, which slaughters, processes and packs the meat products for
export. Cattle sold through the formal market are paid for according to the grade and weight of
the carcass, which can only be determined after the animal has been slaughtered.
The dependent in the second analysis is the proportion of cattle marketed through the formal
market. The higher the proportion marketed through the formal market, the lower the proportion
marketed through an informal market will be, and vice versa. In this analysis, the dependent
variable is a continuous variable and is the percentages of the cattle sold through the formal
market. The overall average proportion of cattle marketed through the formal market by the
total sample of the interviewed cattle producers in the study area was 39 %. Thus, this analysis
investigates the factors influencing a cattle producer’s decision regarding the proportion of
cattle to be sold through the formal market.
3.2.2 Simplicity of explanatory variables in the regression of the cattle-marketing
decision
The independent variables in this study can be classified into five categories:
• The first part, which involves the socio-economic characteristic of the cattle producer
• The second part, which involves the information cost variables
• The third part, which is related to negotiating costs
• The fourth part, which is devoted to monitoring costs
• The fifth part, which involves productivity uncertainty
The next section presents the variables within the above-mentioned categories in detail.
39
3.2.3 Hypothesised explanatory variables
Table 2 summarises the explanatory variables that are hypothesised to have an influence on the
decision of whether or not to sell through the formal market. A brief description of each
variable and the expected direction of the influence of the hypothesised variable on the
marketing behaviour of the cattle producer is given in Table 2 below. It is further hypothesised
that the same variable is expected to have the same directional influence on both investigations,
i.e. the decision of whether or not to sell through the formal market and the decision on the
proportion of cattle to be sold through that market in cases where the producer has decided to
make use of the formal market to sell his/her cattle.
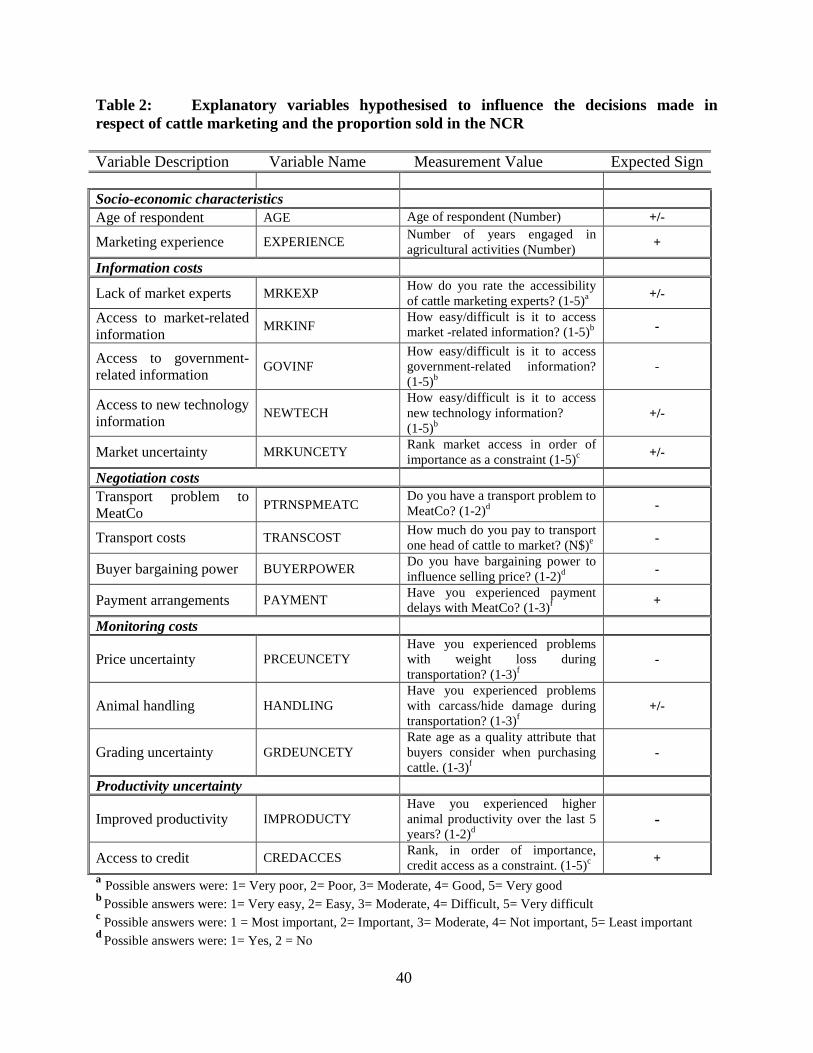
40
Table 2: Explanatory variables hypothesised to influence the decisions made in respect of cattle marketing and the proportion sold in the NCR Variable Description Variable Name Measurement Value Expected Sign
Socio-economic characteristics
Age of respondent AGE Age of respondent (Number) +/-
Marketing experience EXPERIENCE Number of years engaged in agricultural activities (Number) +
Information costs
Lack of market experts MRKEXP How do you rate the accessibility of cattle marketing experts? (1-5)a +/-
Access to market-related information
MRKINF How easy/difficult is it to access market -related information? (1-5)b -
Access to government-related information
GOVINF How easy/difficult is it to access government-related information? (1-5)b
-
Access to new technology information
NEWTECH How easy/difficult is it to access new technology information? (1-5)b
+/-
Market uncertainty MRKUNCETY Rank market access in order of importance as a constraint (1-5)c +/-
Negotiation costs
Transport problem to MeatCo
PTRNSPMEATC Do you have a transport problem to MeatCo? (1-2)d -
Transport costs TRANSCOST How much do you pay to transport one head of cattle to market? (N$)e -
Buyer bargaining power BUYERPOWER Do you have bargaining power to influence selling price? (1-2)d -
Payment arrangements PAYMENT Have you experienced payment delays with MeatCo? (1-3)f +
Monitoring costs
Price uncertainty PRCEUNCETY Have you experienced problems with weight loss during transportation? (1-3)f
-
Animal handling HANDLING Have you experienced problems with carcass/hide damage during transportation? (1-3)f
+/-
Grading uncertainty GRDEUNCETY Rate age as a quality attribute that buyers consider when purchasing cattle. (1-3)f
-
Productivity uncertainty
Improved productivity IMPRODUCTY Have you experienced higher animal productivity over the last 5 years? (1-2)d
-
Access to credit CREDACCES Rank, in order of importance, credit access as a constraint. (1-5)c +
a Possible answers were: 1= Very poor, 2= Poor, 3= Moderate, 4= Good, 5= Very good b Possible answers were: 1= Very easy, 2= Easy, 3= Moderate, 4= Difficult, 5= Very difficult c Possible answers were: 1 = Most important, 2= Important, 3= Moderate, 4= Not important, 5= Least important d Possible answers were: 1= Yes, 2 = No
41
e Possible answers were: In Namibian Dollars f Possible answers were: 1= Never, 2= Sometimes, 3= Always
3.2.3.1 Socio-economic characteristics Personal characteristics such as age (AGE) and marketing experience (EXPERIENCE) have a
direct impact on transaction costs. Older people are perceived to be less educated and thus tend
to face higher transaction costs than younger, educated producers, because the former are unable
to access information that will lower costs (Matungul et al., 2001; Nkhori, 2004).
• Age
Pingali et al. (2005) argued that age can often be indicative of farming experience, which makes
certain informational and search costs easier and cheaper, indicating a positive influence on the
decision to sell through the formal market. However, Musemwa et al. (2007) argued that the
older the farmer, the less likely he will be to sell his cattle through the formal market. Most
older producers are uneducated and lack information on cattle marketing (prices) and are
reluctant to base their decisions on the risk-taking attitude of younger producers (Alene et al.,
2007).
Contrary to the line of argument in the previous paragraph, De Bruyn et al. (2001) hypothesised
that older producers are believed to have larger herds of cattle, thus implying an increase in the
propensity to sell large numbers of cattle at once through the formal market. Therefore, as a
result of the different views hypothesised by different authors, the direction of the impact of age
on the decision of whether or not to sell through the formal market is vague. The same
arguments hold for the proportion of cattle sold through the formal market.
Respondents were asked to indicate their age. As shown in Table 3 below, the average age of
the cattle producers interviewed was 57 years, with the minimum and maximum ages ranging
between 24 and 94 years. On average, the cattle producers interviewed were of a relatively older
age, implying that the interviewed producers were generally retired or about to retire from full-
time jobs and committed to cattle farming.

42
• Marketing experience
Experience can be as critical if not more critical than age in explaining innovativeness or
modernism and is invariably correlated with age (Düvel & Stephanus, 1999). Thus, marketing
experience is proxied by the number of years of experience farming with livestock. A longer
duration of farming experience is hypothesised to increase social standing and lower transaction
costs in informal markets (Fenwick & Lyne, 1999). It also indicates that the more years spent in
agricultural activities, the more this is expected to positively influence the decision to sell
through the formal market. The hypothesis is that this variable will also positively influence the
decision on the proportion of cattle to be sold through the formal market.
To quantify marketing experience, respondents were asked to state the number of years they had
been engaged in agricultural activities. The average number of years spent in agricultural
activities was 27. This may indicate that on average, the producers had been engaged in
agricultural activities over a long period of time, thus having gained marketing experience and
had abundant time to judge the marketing alternatives in their areas.
Table 3: Respondents’ personal information Characteristics n=121 Min Ave Max Age (years) 24 57 94 Years engaged in farming activities 3 27 75
3.2.4 Transaction cost variables
This section exclusively discusses transaction cost variables that are hypothesised to influence
the marketing behaviour of cattle producers in the North-Central Regions (NCR). Table 2,
which can be found earlier in this section, reflects the expected sign and a brief description of
each variable.
43
3.2.4.1 Information costs Smallholder producers in Sub-Saharan Africa face a range of marketing and exchange
problems, amongst which informational constraints are commonly cited (Magingxa, Alemu &
Van Schalkwyk, 2006). Crase and Dollery (1999), Nkhori (2004) and Rich et al. (2009) argued
that transaction costs arise when market information is asymmetric, especially where livestock
are sold directly to processors. Since a producer might sell livestock only once or twice per
year, the information base available to such producers may be significantly lower than that
available to buyers. This is related to the availability of market experts (MRKEXP) and their
accessibility in obtaining the following, which are hypothesised to influence marketing
behaviour:
• Market-related information (MRKINF)
• Government-related information (GOVINF)
• Information on new technology (NEWTECH) and market uncertainty (MRKUNCETY)
• Market experts
Access to market information is an ordinal variable, indicating the degree of difficulty that
small and individual cattle producers face in acquiring market information (Gong et al., 2007).
The availability and accessibility of market experts can influence the marketing behaviour of
cattle producers, depending on the type of information supplied to the producers. However, the
decision on whether or not to sell through the formal market, as well as the decision on the
proportion of cattle to be sold through that market, depend on how the individual perceives the
marketing arrangement through the available marketing choices. Hence, the expected influence
of these variables on the decision of whether or not to sell through the formal market, as well as
the proportion of cattle to be sold through that market, is unresolved at this stage.
Respondents were asked to rate the accessibility of marketing experts (advisors) in their
respective areas. A score of 1 indicates very poor accessibility to cattle-marketing advisors,
while a score of 5 indicates very good accessibility. As shown in Table 4 below, of the

44
interviewed respondents, 26 % rated the accessibility of cattle-marketing advisors to be very
poor and 27 % were satisfied with the accessibility, thus giving this aspect a very good rating.
This means that less than half the respondents had nobody to approach for advice, while the
other half were satisfied with the accessibility of marketing experts through the Directorate of
Extension and Engineering Service (DEES) within the Ministry of Agriculture, Water and
Forestry (MAWF), thus creating information asymmetry.
• Market-related information
Information risk is associated with uncertainty about the quality and quantity (i.e. the grading
and dressing percentage respectively) of saleable beef products from individual live slaughter
cattle (Fausti & Feuz, 1995). When one party in a transaction has more or better information
than the other, the possibility of opportunistic behaviour presents itself (Bartle, 2002).
Information differences between marketing alternatives generate uncertainty, which in turn
affects the behaviour of market participants (Fausti & Feuz, 1995). Parties might incur costs to
gather additional information, or may proceed into the transaction hoping for the best.
Information problems are clearly more acute when the parties involved have little trust for each
other. Fenwick and Lyne (1999) observed that the lower the degree of information uncertainty,
the lower the transaction costs become. De Bruyn et al. (2001) confirmed that the cost of
acquiring price information has an extremely negative effect on the proportion of cattle sold to
formal markets. Therefore, it is hypothesised that inaccessibility of suitable market-related
information would negatively influence the decision to sell through the formal market. The
same applies to the proportion of cattle sold through the formal market.
Respondents were asked to describe how easy/difficult it was for them to obtain market-related
information. A score of 1 indicates that the respondent found it very easy to access information,
while a score of 5 indicates that the respondent found it very difficult to access information. As
shown in Table 4, of the interviewed respondents, 28 % found it very easy to access market-
related information, with only 14 % finding it very difficult.
45
• Government-related information
Producers on communal land generally have no idea of the extent of the grazing resources to
which they have access or the degree to which such resources are utilised. In most cases, these
producers do not have any grazing control methods in place (NERPO, 2009). Smallholders are
often disadvantaged due to poor access to information and market-precipitating services such as
extension visitation and credit assistance, and these impediments often give rise to low rates of
adoption of improved technologies that could potentially increase productivity (Lapar,
Holloway & Ehui, 2003). Entrepreneurial skills, recordkeeping, livestock marketing and
nutrition are regarded as the major areas of assistance that are required from the extension
officers. Unfortunately, the challenge is exacerbated by the fact that the extension officers do
not have adequate farming experience and are not updated on the latest marketing trends and
production technologies that could be employed by the producers (NERPO, 2009). The fact that
extension officers in the study area are in most cases constrained by limited resources in their
efforts to reach producers in their respective areas gave rise to the hypothesis that government-
related information has a negative influence on the decision to sell through the formal market,
as well as the proportion of cattle to be sold through that market.
Respondents were asked to describe how easy/difficult it was for them to obtain government-
related information. A score of 1 indicates that the respondent was finding it very easy to access
such information, while a score of 5 indicates that the respondent was finding it very difficult to
access such information. As shown in Table 4, of the interviewed respondents, 31 % indicated
that they were finding it very easy to access government-related information, while only 13 %
indicated that they were finding it very difficult.
• Information on new technology
The extent of technological intervention in breed improvement can be assessed through the
compositional changes in livestock population over time (Kumar, Staals, Elumalai & Singh,
2007). It has been noted that inadequate technology and extension may result in poor efficiency
in beef cattle (Suppadit, Phumkokrat & Poungsuk, 2006). Accessibility of information on new

46
technology results in producers being able to receive information for the purpose of adopting
new and relevant technologies at the right time (NERPO, 2009). The fact that there are few
livestock research stations in the NCR ignites doubts on the flow of information on new
technology within the NCR. This makes it a complex matter to hypothesise the influence of
information on new technology on the decision of whether or not to sell through the formal
market, as well as the proportion of cattle to be sold through that market.
A score of 1 indicates that the respondent found it very easy to access information on new
technology, while a score of 5 indicates that the respondent found it very difficult. As shown in
Table 4, only 16 % indicated that they found it very easy to access such information, whilst a
total of 34 % indicated that they found it very difficult.
Table 4: Accessibility of information, ranking from 1 (very easy) to 5 (very difficult) Ranking (%)
Constraints 1 2 3 4 5 Market experts 26 24 13 10 27 Market-related information 28 21 27 10 14 Government-related information
31 26 19 11 13
Information on new technology
16 8 12 30 34
• Market uncertainty
Over the years, transaction costs have been applied to analyse numerous issues, such as the
strategic impact of information systems, resource allocation and outsourcing decisions.
However, little attention has been paid to the marketing channel (Chen et al., 2006). Transaction
and information costs also affect access to all markets and play an important role in
discouraging the demand and supply of financial services (Jabbar et al., 2008; Matungul et al.,
2001 Formal markets are perceived to be sophisticated and with investment levels way beyond
the immediate financial and economic capacity of existing participants in the informal markets
(Nambundunga-Xulu et al., 2008). Jabbar et al. (2006) indicated that a well-functioning market

47
facilitates easy conversion of products to cash, which further facilitates other exchanges of
goods and services required for increased production and consumption.
A very interesting reason given by cattle producers in the region regarding choice of market was
that they preferred selling their cattle through the formal market because they did not wish to
see their cattle in the area after having sold them (Düvel, 2001). However, some cattle
producers’ satisfaction with certain selling arrangements is bound to be influenced by the prices
they expect to received. Due to the different views expressed in the literature on transaction
costs, the influence of market uncertainty on the decision of whether or not to sell through the
formal market, as well as the proportion of cattle to be sold through that market, is unresolved at
this stage.
Respondents were asked to rank the constraints to market access in order of importance, with a
score of 1 to be assigned to the most important constraint and a score of 5 to the least important.
Market access was ranked by the majority of respondents (27 %) as the most important
constraint requiring immediate attention, while it was ranked as important by 24 %, as
moderately important by 23 %, as less important by only 12 %, and as the least important
constraint by 14 % of respondents.
3.2.4.2 Negotiation costs Negotiation costs involve problems with transport to MeatCo (PTRNSPMEATC), transport
costs (TRANSCOST), buyer bargaining power (BUYERPOWER), and payment arrangements
(PAYMENT).
• Problems with transport to MeatCo and transport costs
Aklilu (2002) stated that transport remains a critical factor in the profitability of livestock
trading, possibly even constituting between 25 % and 40 % of the total price of a head of cattle.
Acharya (2006) argued that the long travelling distances involved in reaching a marketplace
constitute a disincentive for most producers. The further away the farmer is from the market, the
48
higher the transport costs incurred (Musemwa et al., 2008). Transport costs consist of the
opportunity cost of the producer’s time and effort in organising transportation to the market,
plus the monetary value of the transportation cost (Hobbs, 1997; Montshwe, 2006). In addition,
Musemwa et al. (2008) observed that producers incur extra transport costs in securing
transporting and selling permits from police stations and veterinary offices respectively. Hence,
distance and the cost of transport can be thought of as negative supply shifters in market
penetration (MacInnis, 2004). Therefore, both these variables are hypothesised to negatively
affect the decision to sell through the formal market. The same hypothesis applies to both
variables in respect of the proportion of cattle to be sold through the formal market.
To quantify the first variable, respondents were asked to indicate whether they had ever
experienced problems transporting their cattle to the MeatCo abattoir. A binary score of 1 for
Yes and 2 for No applied in the expression of problems experienced transporting cattle to
MeatCo. Of the interviewed cattle producers, 52 % indicated that they had never experienced
any problems transporting their cattle to the MeatCo abattoir, whereas 48 % indicated that they
had experienced such problems.
Respondents were asked to indicate the cost of transporting one head of cattle to market in
Namibian dollars (N$). The average cost of such transport is N$145.65 per animal. However, as
shown in Figure 5, which reflects different modes of transport used to transport different types
of livestock to market, transport costs differ according to the mode of transport used.
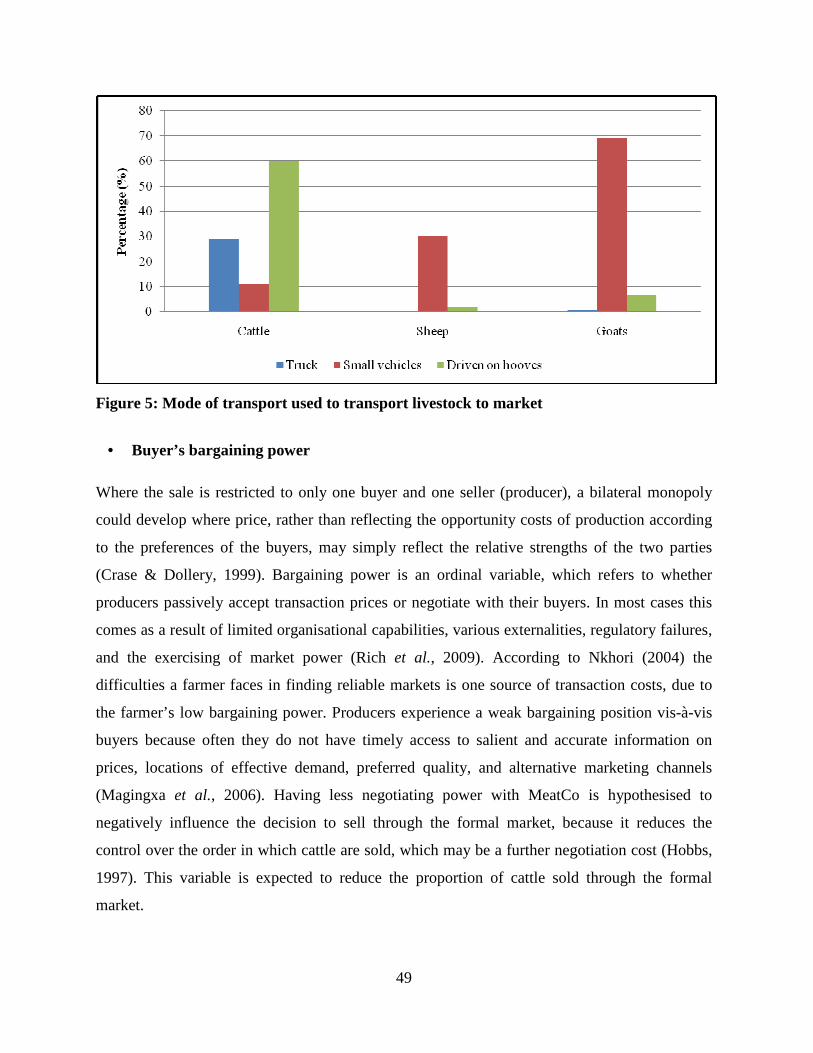
49
Figure 5: Mode of transport used to transport livestock to market
• Buyer’s bargaining power
Where the sale is restricted to only one buyer and one seller (producer), a bilateral monopoly
could develop where price, rather than reflecting the opportunity costs of production according
to the preferences of the buyers, may simply reflect the relative strengths of the two parties
(Crase & Dollery, 1999). Bargaining power is an ordinal variable, which refers to whether
producers passively accept transaction prices or negotiate with their buyers. In most cases this
comes as a result of limited organisational capabilities, various externalities, regulatory failures,
and the exercising of market power (Rich et al., 2009). According to Nkhori (2004) the
difficulties a farmer faces in finding reliable markets is one source of transaction costs, due to
the farmer’s low bargaining power. Producers experience a weak bargaining position vis-à-vis
buyers because often they do not have timely access to salient and accurate information on
prices, locations of effective demand, preferred quality, and alternative marketing channels
(Magingxa et al., 2006). Having less negotiating power with MeatCo is hypothesised to
negatively influence the decision to sell through the formal market, because it reduces the
control over the order in which cattle are sold, which may be a further negotiation cost (Hobbs,
1997). This variable is expected to reduce the proportion of cattle sold through the formal
market.
50
Respondents were asked to indicate whether they had any bargaining power when it came to
influencing the selling price when marketing to MeatCo. A score of 1 indicates that the
respondent had no bargaining power when it came to influencing the selling price, while a score
of 3 indicates that the respondent did have some bargaining power. As shown in Figure 6,
MeatCo does not negotiate selling prices as do the informal markets. Consequently, 72 % of
respondents indicated that they had no bargaining power whatsoever when it came to
influencing the selling price at MeatCo.
• Payment arrangements by MeatCo
The delay between the time when cattle are sold and when payment is received is also a
negotiation cost (Hobbs, 1997). A payment arrangement is also a form of negotiation cost,
which is measured in terms of the number of weeks by which the buyer delays payment to the
producer. Producers are likely to encounter payment delays when selling to a meat processor
with the power to establish prices and determine the time of payment delivery (Gong et al.,
2007). The delay is not expected to be significant in the case of auctions, since producers
usually receive payment within one working day of the sale. The delay in payment is more
important when selling to formal markets. A good relationship with a buyer means that the
producer need not seek alternative buyers when marketing his cattle. However, if producers are
not satisfied with the conduct of the buyer, they must either find alternative outlets or take steps
to avoid using the procurement officer (Hobbs, 1997). Due to MeatCo’s payment arrangements,
according to which payment is usually made the day after the slaughtering date, this variable is
hypothesised to positively influence the decision to sell through the formal market. This
variable is expected to similarly influence the proportion of cattle to be sold through the formal
market.
Respondents were asked to indicate whether they had ever experienced any payment delay with
MeatCo. A score of 1 indicates that the respondent had never experienced any payment delay,
while a score of 3 indicates that the respondent had experienced repeated payment delays. As
shown in Figure 6, of the interviewed respondents, 74 % indicated that they had never
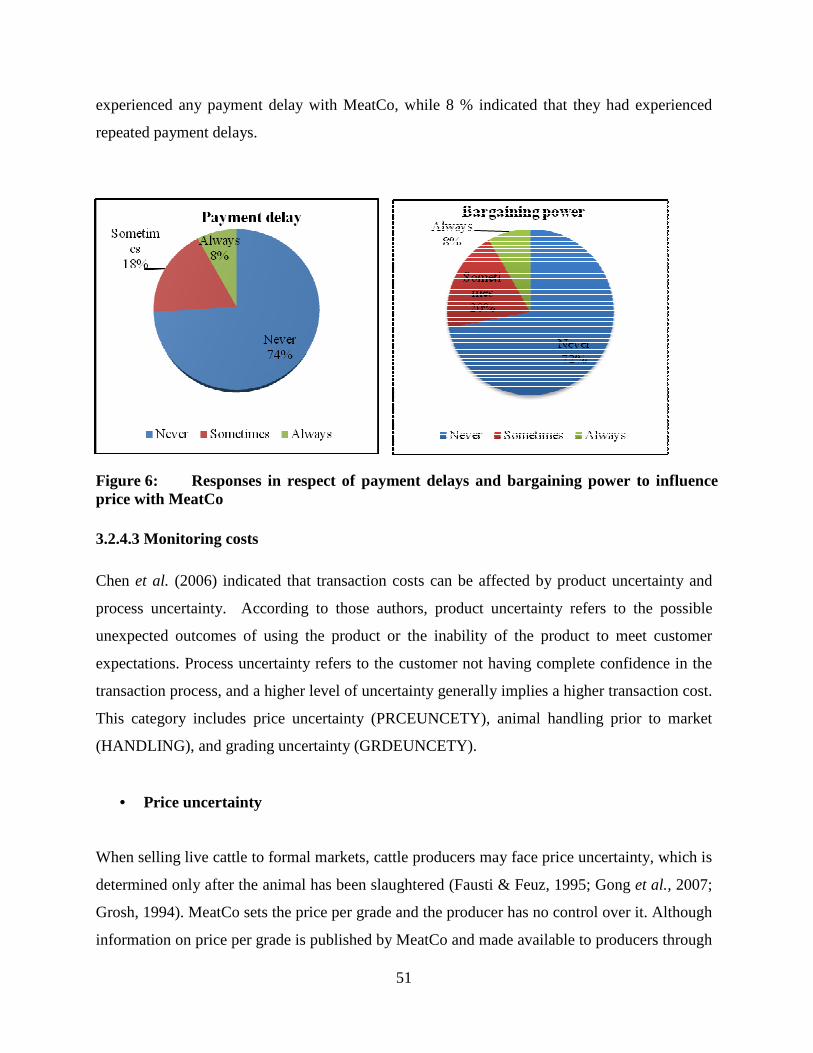
51
experienced any payment delay with MeatCo, while 8 % indicated that they had experienced
repeated payment delays.
Figure 6: Responses in respect of payment delays and bargaining power to influence price with MeatCo 3.2.4.3 Monitoring costs Chen et al. (2006) indicated that transaction costs can be affected by product uncertainty and
process uncertainty. According to those authors, product uncertainty refers to the possible
unexpected outcomes of using the product or the inability of the product to meet customer
expectations. Process uncertainty refers to the customer not having complete confidence in the
transaction process, and a higher level of uncertainty generally implies a higher transaction cost.
This category includes price uncertainty (PRCEUNCETY), animal handling prior to market
(HANDLING), and grading uncertainty (GRDEUNCETY).
• Price uncertainty
When selling live cattle to formal markets, cattle producers may face price uncertainty, which is
determined only after the animal has been slaughtered (Fausti & Feuz, 1995; Gong et al., 2007;
Grosh, 1994). MeatCo sets the price per grade and the producer has no control over it. Although
information on price per grade is published by MeatCo and made available to producers through
52
cattle agencies, extension officers and publications, the producers remain uncertain about the
price they are likely to receive until after the cattle have been slaughtered. Due to the long
travelling distances, weight losses occur and thus reduce the carcass weight, which is what
determines price. Therefore, price uncertainty increases negotiating and decision-making costs,
while demand and supply certainty raises search and information costs (Ayars, 2003). The cost
of obtaining price information has the greatest impact in explaining the proportion of cattle sold
through the formal market and thus the producer’s choice of marketing channel (De Bruyn, et
al., 2001). This means that information differences between marketing alternatives generate
uncertainty, and uncertainty affects the behaviour of the market participants (Fausti & Feuz,
1995). There is also an element of mistrust on the part of the producers, who fear that their
cattle may be mixed with inferior (lower grade/quality/condition) cattle and not priced properly
(Feuz, Fausti & Wagner, 1995). Therefore, this variable is hypothesised to negatively affect the
decision to sell through the formal market. The impact of this variable is expected to take the
same direction with regard to the proportion of cattle sold through the formal market.
To quantify this variable, respondents were asked to indicate whether they had ever experienced
any problems associated with weight loss during the transportation of their cattle. A score of 1
indicates that the respondent had never experienced problems with weight loss during
transportation, while a score of 3 indicates that the respondent had repeatedly experienced such
problems. As shown in Table 5, of the interviewed respondents, 45 % indicated that they had
never experienced any problems with weight loss during transportation, while only 15 %
indicated that they had repeatedly experienced such problems.
• Animal handling prior to market
Hobbs (1997) indicated that producers may incur monitoring costs in ensuring that, from the
time the cattle leave the farm to the time they are slaughtered, problems related to shrinkage and
carcass damage are minimised. The producers lack a commercial mindset and therefore market
their cattle for various other socio-economic reasons. Producers do not always dehorn their
cattle, which further increases the risk of damage during transportation or even while the
animals are kept in the waiting area prior to slaughter. Hence, hide/carcass damage is perceived

53
to have no impact on the decisions made in respect of cattle marketing. Consequently, the
influence of this variable on the decision of whether or not to sell through the formal market, as
well as the proportion of cattle to be sold through that market, is unresolved at this stage.
This variable was quantified by asking the respondents to indicate whether they had ever
experienced any problems with carcass/hide damage due to poor animal handling. A score of 1
indicates that the respondent had never experienced any problems with carcass/hide damage due
to poor animal handling, while a score of 3 indicates that the respondent had repeatedly
experienced such problems. As shown in Table 5, of the interviewed respondents, 54 %
indicated that they had never experienced any problems with carcass/hide damage due to poor
animal handling, while 12 % indicated that they had repeatedly experienced such problems.
However, this does not rule out the possibility of carcass damage caused by stress during the
animals’ long journey to market.
• Grading uncertainty
The production process of beef cattle is typically characterised in terms of a number of distinct
stages starting with genetic selection and breeding, then rearing and weaning, and finally
fattening to market weight (finishing) and slaughter (Hueth & Lawrence, 2002). Moreover, this
involves decisions on the type of stock, the method and timing of sales, as well as price and
payment. Production and marketing policies need to be integrated to maximise the margin
between cost and return (Davies, Eddison, Cullinane, Kirk & Hayne, 1998).
Marketing decisions must take into account the need to produce livestock that yield carcasses of
the weight and quality preferred by buyers. In addition, Düvel (2001) argued that, from the
point of view of an understanding of marketing behaviour, preferences regarding the age at
which animals are sold is even more important. He found that there is a clear preference among
cattle producers in the area to sell cattle only after reaching six years of age. This reduces
tenderness, which is one of the most important attributes affecting consumer preferences for
beef products (Riley, Schroeder, Wheeler, Shackelford & Koohmarais, 2009). Producers selling
cattle directly to packers may incur product information costs if different buyers require cattle
54
with different quality specifications (Hobbs, 1997). The payment received by producers is
based on final grade results, which creates risks for producers (Gong et al., 2007). Grading
uncertainty tends to arise when producers sell only through the formal market, as cattle are
priced according to grade category (age, weight, body conformation and fatness). Furthermore,
stress during transport tends to cause dark-cutting beef, which lowers quality, because the beef
is then perceived to become unattractive, tasteless and unpopular. Therefore, quality uncertainty
is hypothesised to negatively influence the decision to sell through the formal market, as well as
the proportion of cattle to be sold through that market.
Respondents were asked to indicate whether buyers consider the age of the animal as a grading
attribute during purchasing. A score of 1 indicates that the respondent had never had a buyer
who had considered the age of the animal as a grading attribute, while a score of 3 indicates that
the respondent had repeatedly had buyers who had considered the age of the animal. As shown
in Table 5, of the interviewed respondents, 41 % indicated that they had repeatedly had buyers
who had considered the age of the animal as a grading attribute, while 21 % indicated that they
had never had a buyer who had considered the age of the animal. This variable may be
influenced by many factors, as it depends on the type of animal being purchased and the reason
for the purchase.
Table 5: Responses in respect of accessibility to information Information variables Percentage (%) Never Sometimes Always Price uncertainty 45 40 15 Poor animal handling prior to market 54 34 12 Grade uncertainty 21 38 41
3.2.4.4 Productivity uncertainty
The four most important factors, namely livestock diseases, drought, scarcity of livestock
watering points, and lack of money for farming inputs, are all directly concerned with livestock
production (Düvel & Stephanus, 1999). Alene et al. (2007) stated that production shifters are
equally important variables to the extent that increased production promotes output marketing.
55
These authors argued that understanding the effects of transaction costs on input use, which can
increase production itself, should be as important as understanding the effects of transaction
costs on market supply. Transaction cost perceptions are based not only on the objective risks
that individuals face, such as variable rainfall, but also on their subjective assessment of risk.
Thus, their subjective assessments combine their expectations about likely events with their
beliefs about their own ability to deal with future events (Doss et al., 2005). Included in this
category are improved productivity (IMPRODUCTY) and access to credit (CREDACCES).
• Improved productivity
The strong link between rainfall and grass biomass production means that any reduction in the
former brings about a reduction in the productivity of natural pastures (Kamuanga et al., 2008).
Düvel (2001) identified lack of grazing due to overgrazing, scarcity of stock watering points
and drought to be directly concerned with stock production. Increasing farm-level production
and productivity will require more improved animals, improved fodder/feed technology, and
better access to livestock services (Kumar et al., 2007). However, in the communal areas, herds
from different households are allowed to graze together and mate, irrespective of their health
status. This is worsened by the lack of proper disease and parasite control in communal grazing
areas (Mapiye, Chimonyo, Dzama, Raats & Mapekula, 2009). Although government’s focus on
productivity improvement and their associated efforts through numerous different projects are
recognised for bringing about changes to the arena of livestock production in the area, the
objectives are far from being achieved. The communal areas are still dominated by a low bull-
to-cow ratio, a low ratio of extension officers to producers, a lack of water, and inadequate
grazing areas (Mushendami et al., 2006). Therefore, this variable is expected to negatively
influence the decision to sell through the formal market. The same negative influence is
hypothesised to apply in the decision on the proportion of cattle to be sold through the formal
market.
Respondents were asked to indicate whether they had experienced any change in their livestock
business over the past five years. A binary choice of 1 for Yes and 2 for No was given. Of the
56
interviewed producers, 83 % indicated that the productivity of their animals had increased over
the past five years.
• Access to credit
Apart from access to information and institutional innovations, accessibility to production
inputs is extremely important, as this can promote market participation and supply (Alene et al.,
2007). Producers engaged in small-scale agriculture have limited access to factors of
production, credit and information, and markets are often constrained by high transaction costs
(Matungul et al., 2001). Lack of institutional credit is a severe constraint to the development of
livestock production (Kumar et al., 2007). Inappropriate policies and misallocation of
investment resources could skew the distribution of the benefits and opportunities away from
those smallholders who would potentially gain the most from a livestock revolution (Lapar et
al., 2003). The accessibility of credit is therefore expected to have a positive influence on the
decision to sell through the formal market, as inputs and credit access may have a major
influence on the quantity and quality of cattle produced. Therefore, given the accessibility of
credit in the study area, this variable is hypothesised to positively influence the decision to sell
through the formal market. This is also expected to have a similar influence on the proportion of
cattle sold through the formal market, as producers will be obliged to harvest a large number of
cattle at a time in order to repay debt.
Respondents were asked to rank the importance of credit access as a constraint to livestock
production. A score of 1 indicates that the respondent considered credit access to be the most
important constraint, while a score of 5 indicates that the respondent considered credit access to
be the least important constraint. As shown in Figure 7, of the interviewed respondents, 51 %
indicated that access to credit is the most important constraint to productivity, while only 11 %
identified it as being the least important constraint.
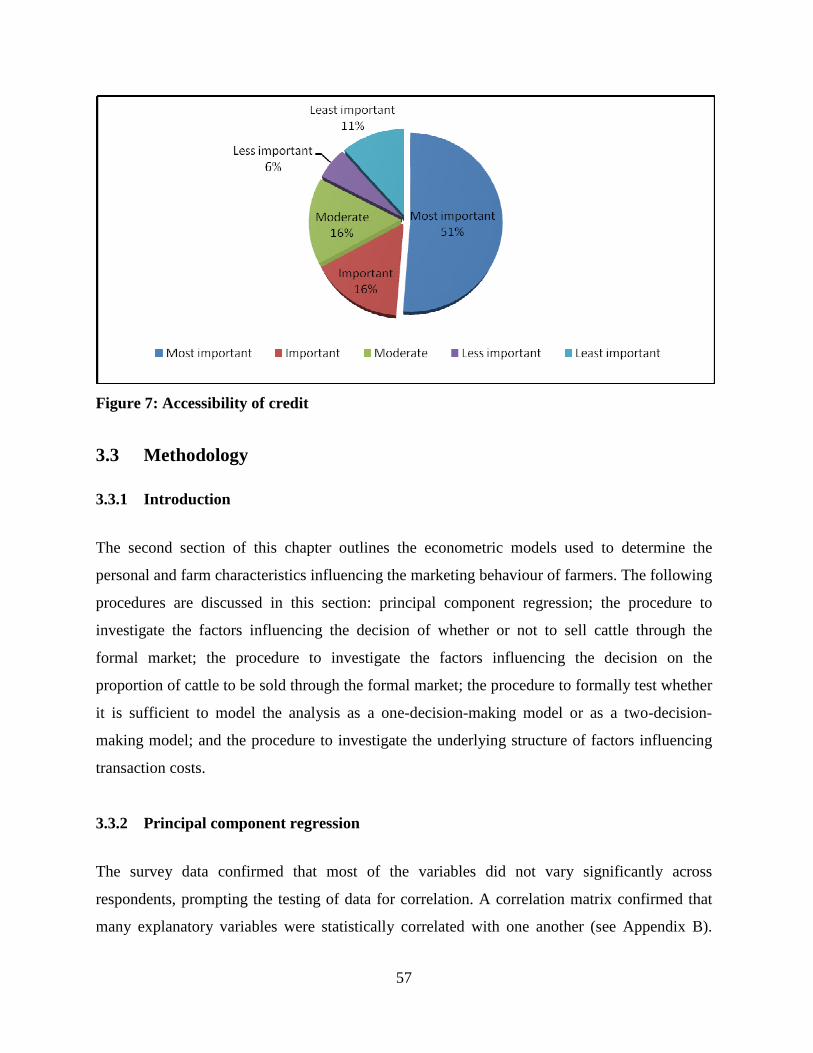
57
Figure 7: Accessibility of credit
3.3 Methodology 3.3.1 Introduction
The second section of this chapter outlines the econometric models used to determine the
personal and farm characteristics influencing the marketing behaviour of farmers. The following
procedures are discussed in this section: principal component regression; the procedure to
investigate the factors influencing the decision of whether or not to sell cattle through the
formal market; the procedure to investigate the factors influencing the decision on the
proportion of cattle to be sold through the formal market; the procedure to formally test whether
it is sufficient to model the analysis as a one-decision-making model or as a two-decision-
making model; and the procedure to investigate the underlying structure of factors influencing
transaction costs.
3.3.2 Principal component regression
The survey data confirmed that most of the variables did not vary significantly across
respondents, prompting the testing of data for correlation. A correlation matrix confirmed that
many explanatory variables were statistically correlated with one another (see Appendix B).
58
Multi-collinearity may cause lack of significance of individual independent variables, while the
overall model may be strongly significant. It may also result in incorrect signs and magnitudes
of regression coefficient estimates, and consequently in inaccurate conclusions about the
relationship between independent variables (Gujarati, 2003). Due to this redundancy, it was
deemed possible to reduce the observed variables into a smaller number of principal
components (artificial variables) that would account for most of the variance in the observed
variables. The first method attempted was Principal Component Analysis (PCA) – a standard
tool in modern data analysis – which is a simple, non-parametric method for extracting relevant
information from confusing data sets. However, due to the nature of the data, PCA was
abandoned due to the complexity of observing the influence of a single variable within a
component. As an alternative, Principle Component Regression (PCR) was selected as a way to
deal with the multi-collinearity problem. This method standardises all variables to a mean of
zero and a standard deviation of one prior to analysis, thereby minimising the problems
associated with scaling. A rule of thumb to determine the number factors at principal
components, known as the Kaiser Criterion, dictates that only factors with eigenvalues greater
than 1.00 are able to explain the observed variance (Ridho, Setyono & Sumi, 2002).
The purpose of PCR is to estimate the values of a response variable at the basis of hypothesised
explanatory variables (EV). Due to the nature of the data used in this study, least square (LS)
regressions and classical PCA are vulnerable with respect to outlying observations, since even a
single massive outlier can heavily influence the parameter estimates of these methods. It is
therefore important to robustify PCR, which in fact means to robustify both PCA and linear
multiple regression (Filzmoser, 2001).
• Application to principal component regression
In PCR, Y is regressed on a subset of the sample principal components. The estimated
regression coefficients for the explanatory variables in the chosen subset are used to obtain
regression coefficients for the original columns of X (Hwang & Nettleton, 2002). Following
Magingxa et al. (2006), PCR is applied within a maximum likelihood estimation framework.
59
The correlation matrix C, using both standardised and non-standardised variables, was used to
calculate the eigenvalues kλλλ ,..., 21 and corresponding eigenvectors iν respectively in
Equations 1 and 2:
|С–λΙ| = 0, |С–λjΙ|Vj = 0 (1)
The eigenvectors Vj were then arranged to give matrix V in Equation 2:
V =
kkkk
k
k
ννν
νννννν
...
......
......
......
...
...
21
22221
11211
(2)
The matrix V is orthogonal, as its columns satisfy the conditions iiνν ' = 1 and ijνν '
= 0 for ji ≠
Z = XS V (3)
Where XS is the n×k matrix of standardised variables, and V is the eigenvector matrix as defined
in Equation 3. There are k explanatory variables, as there are k variables. The new sets of
variables (explanatory variables), unlike the original variables, are orthogonal, i.e. they are
uncorrelated.
After the explanatory variables had been calculated and the explanatory variables with the
smallest eigenvalues eliminated, Equation 4 was fitted to determine the explanatory variables
having a significant impact on the probability of the producer deciding to sell his cattle through
the formal market, as well as the proportion of cattle to be sold through that market:
P = F( εϕα +′Χ+ sss VV0 ) (4)
Once the insignificant explanatory variables from Equation 5 had been identified and
eliminated, Equation 5 was obtained in terms of the retained hypothesised variables.
P= F ( )oεγα +Ζ+s0 (5)
60
where Z = VsΧ and γ = sV ϕ′ . Z is n l× matrix of retained explanatory variables, V is k l×
matrix of the eigenvectors corresponding to the l retained components, and γ is ll× vector of
coefficients associated with l variables. Standard errors of the estimated coefficients γ are
represented by 1×l vector.
Var(γ̂ ) = ( ) 212 ˆˆ δδ =ΖΖ′ −diag( )11
21
1 ,..., −−−lλλλ
(6)
where 2δ̂ is the variance of residuals from Equation 4. Therefore, the standard error of γ may be
given by:
( )l
γγγ ˆ.....ˆ..ˆ.. 21 esesesk s = (7)
The standard error is simply the standard deviation of the dependent values about the estimated
regression and is often used as a summary measure of the goodness of fit of the estimated
regression (Gujarati, 2003). Another conventional way in which to report results is to replace
the standard errors with the t-values that arise when testing H0: β1 = 0 against H1: β1 ≠ 0 and H0:
β2 = 0 against H1: β2 ≠ 0 (Griffiths, Hill & Judge, 1993). In some analyses, both the standard
errors and t- values are reported in parentheses below the coefficients. Griffiths et al. (1993)
recommended that, given the t-statistics, it is useful to report the p-values, which are the
probabilities of exceeding the computed t-value.
Results obtained using Equation 5 may be transformed back to the explanatory variable
estimators of standardised variables as follows:
×
=
lklk
l
l
sEVk
sEV
sEV
VV
VV
VVV
γ
γγ
α
αα
ˆ
.
.
.
ˆ
ˆ
....
......
......
......
....
...
.
.
.2
1
1
221
11211
,
,2
,1
(8)
where iγ̂ is the estimator of iγ in Equation 6 and the constant ys
EV =,oα .
61
The standardised coefficients evaluate the relative importance of the explanatory variables in
determining the marketing decisions of cattle producers. Variance of the explanatory variables
estimators in standardised variables is given by:
Var( sEVα ) = SsΚΨ
l (9)
where sl
Ψ contains the squares of the elements of V sl in Equation 2 and KS contains the squares
of the elements of the matrix of standard errors of the coefficient matrix of γ in Equation 5. The
corresponding standard errors for the estimators of explanatory variables of standardised
variables are given by:
s.e( ) ( )[ ] 21
var sEV
sEV αα = (10)
The transformed standardised coefficients sEVj ,α of standardized variables xjΧ back to EVj ,α
non-standardised coefficients EVj ,α of jΧ
kjSxj
sEVj
EVj ,...,2,1,,, ==
αα
(11)
and
xk
ks
EVk
x
sEV
x
sEVs
EVEV S
x
S
x
S
x ,
2
2,2
1
1,1,, ...
ααααα −−−−=
oo (12)
where xjS is the standard deviation of the thj original variable Xj, and s
EVks
EVsEV
sEV ,,2,1,0 ,,, αααα are
coefficients of the standardised variables.
The partial effects of the continuous explanatory variables on the marketing decision may be
computed by the expression:
)( ijij
i
x
p Ζ=∂∂ φβ
(13)
62
where ij
k
iii xZ ∑
=
+=1
ββo
The “partial” effects of the discrete variables are calculated by taking the difference of the
probabilities estimated when the value of the variable is set to 1 and 0( )1,0 == ii xx
respectively.
3.3.2 Factors affecting the decision of whether or not to sell through the formal market
The regressand in this objective is a binary variable that takes only two values (1, 0) – say 1 if a
cattle producer has at least at one point sold through the formal market and 0 if a producer has
never sold through the formal market. Hence a Probit Model was used to determine the factors
influencing the decision of whether or not to sell through the formal market (secondary
objective 1). Given the fact that the regressand is qualitative in nature, Gujarati (2003)
explained the difference in objectives between quantitative and qualitative regressands as
follows: When a regressand is quantitative, the objective is to estimate its expected or mean
value, given the values of the regressors. Where a regressand is qualitative, the objective is to
find the probability of something happening. Hence, qualitative response regression models are
often known as probability models. Gujarati (2003) and Malhotra (1983) specified three
alternative approaches to estimating a probability model for a binary response variable, namely
the Linear Probability Model (LPM), the Logit Model, and the Probit Model.
• Linear Probability Model
The Linear Probability Model is given by:
Y i = β1 + β2X i + µi (14)
where Yi is 1 if the ith decision-maker selects the first alternative (selling through the formal
market) and 0 if the ith decision-maker selects the second alternative (not selling through the
formal market). Xi is the ith row of the n p× matrix of regressors, i = 1, 2, . . . , n (n refers to
the sample size and p to the number of coefficients); β is the p × 1 vector of parameter
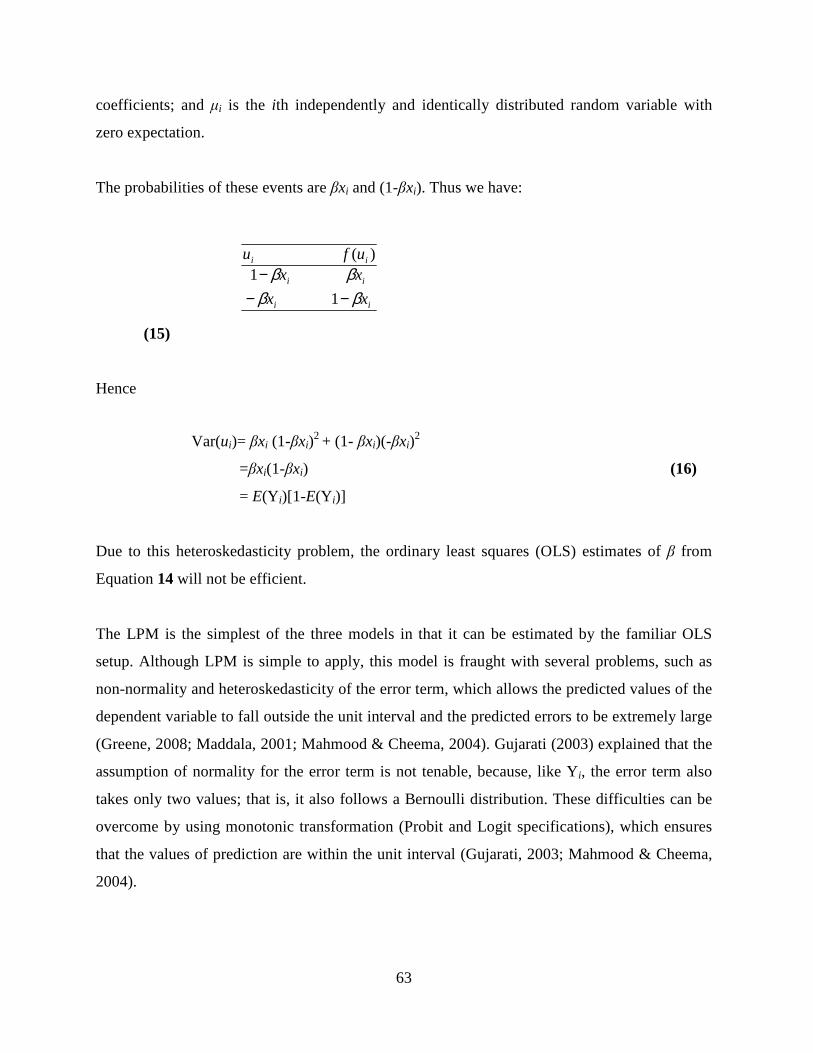
63
coefficients; and µi is the ith independently and identically distributed random variable with
zero expectation.
The probabilities of these events are βxi and (1-βxi). Thus we have:
ii
ii
ii
xx
xxufu
ββββ
−−−
1
1)(
(15)
Hence
Var(ui)= βxi (1-βxi)
2 + (1- βxi)(-βxi)2
=βxi(1-βxi) (16)
= E(Y i)[1-E(Y i)]
Due to this heteroskedasticity problem, the ordinary least squares (OLS) estimates of β from
Equation 14 will not be efficient.
The LPM is the simplest of the three models in that it can be estimated by the familiar OLS
setup. Although LPM is simple to apply, this model is fraught with several problems, such as
non-normality and heteroskedasticity of the error term, which allows the predicted values of the
dependent variable to fall outside the unit interval and the predicted errors to be extremely large
(Greene, 2008; Maddala, 2001; Mahmood & Cheema, 2004). Gujarati (2003) explained that the
assumption of normality for the error term is not tenable, because, like Yi, the error term also
takes only two values; that is, it also follows a Bernoulli distribution. These difficulties can be
overcome by using monotonic transformation (Probit and Logit specifications), which ensures
that the values of prediction are within the unit interval (Gujarati, 2003; Mahmood & Cheema,
2004).
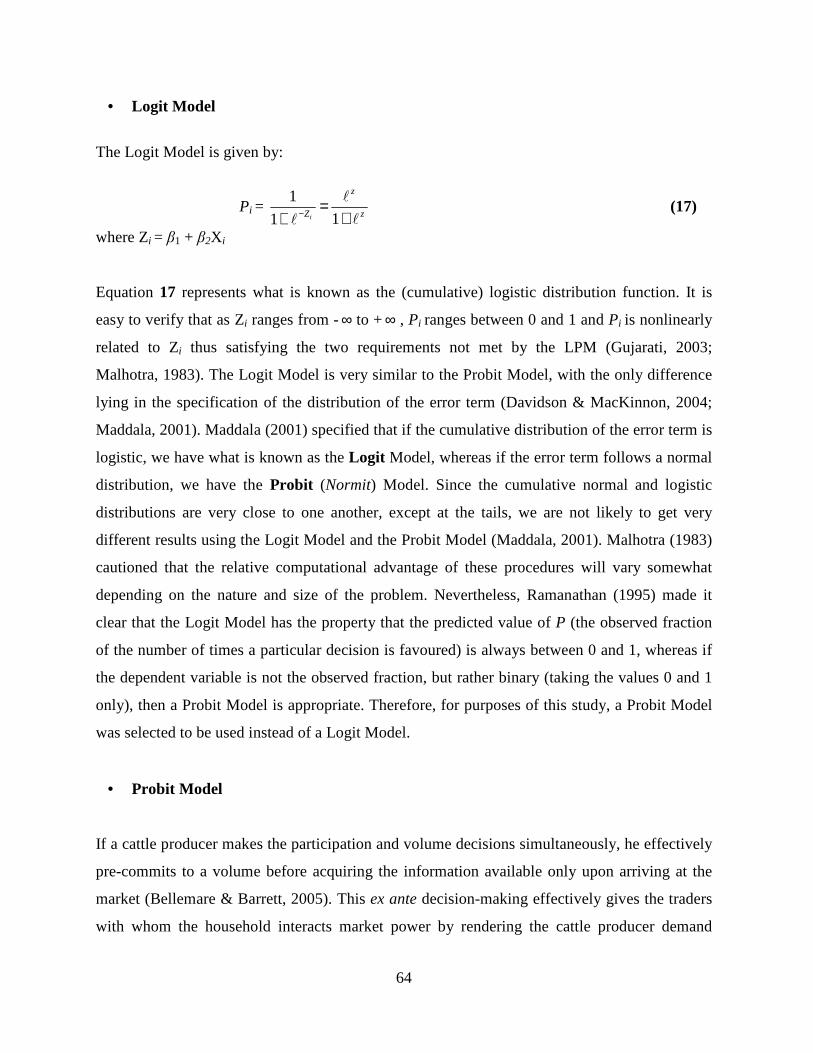
64
• Logit Model
The Logit Model is given by:
Pi = z
z
Zi l
l
l +=
+ − 11
1
(17)
where Zi = β1 + β2X i
Equation 17 represents what is known as the (cumulative) logistic distribution function. It is
easy to verify that as Zi ranges from -∞ to +∞ , Pi ranges between 0 and 1 and Pi is nonlinearly
related to Zi thus satisfying the two requirements not met by the LPM (Gujarati, 2003;
Malhotra, 1983). The Logit Model is very similar to the Probit Model, with the only difference
lying in the specification of the distribution of the error term (Davidson & MacKinnon, 2004;
Maddala, 2001). Maddala (2001) specified that if the cumulative distribution of the error term is
logistic, we have what is known as the Logit Model, whereas if the error term follows a normal
distribution, we have the Probit (Normit) Model. Since the cumulative normal and logistic
distributions are very close to one another, except at the tails, we are not likely to get very
different results using the Logit Model and the Probit Model (Maddala, 2001). Malhotra (1983)
cautioned that the relative computational advantage of these procedures will vary somewhat
depending on the nature and size of the problem. Nevertheless, Ramanathan (1995) made it
clear that the Logit Model has the property that the predicted value of P (the observed fraction
of the number of times a particular decision is favoured) is always between 0 and 1, whereas if
the dependent variable is not the observed fraction, but rather binary (taking the values 0 and 1
only), then a Probit Model is appropriate. Therefore, for purposes of this study, a Probit Model
was selected to be used instead of a Logit Model.
• Probit Model
If a cattle producer makes the participation and volume decisions simultaneously, he effectively
pre-commits to a volume before acquiring the information available only upon arriving at the
market (Bellemare & Barrett, 2005). This ex ante decision-making effectively gives the traders
with whom the household interacts market power by rendering the cattle producer demand
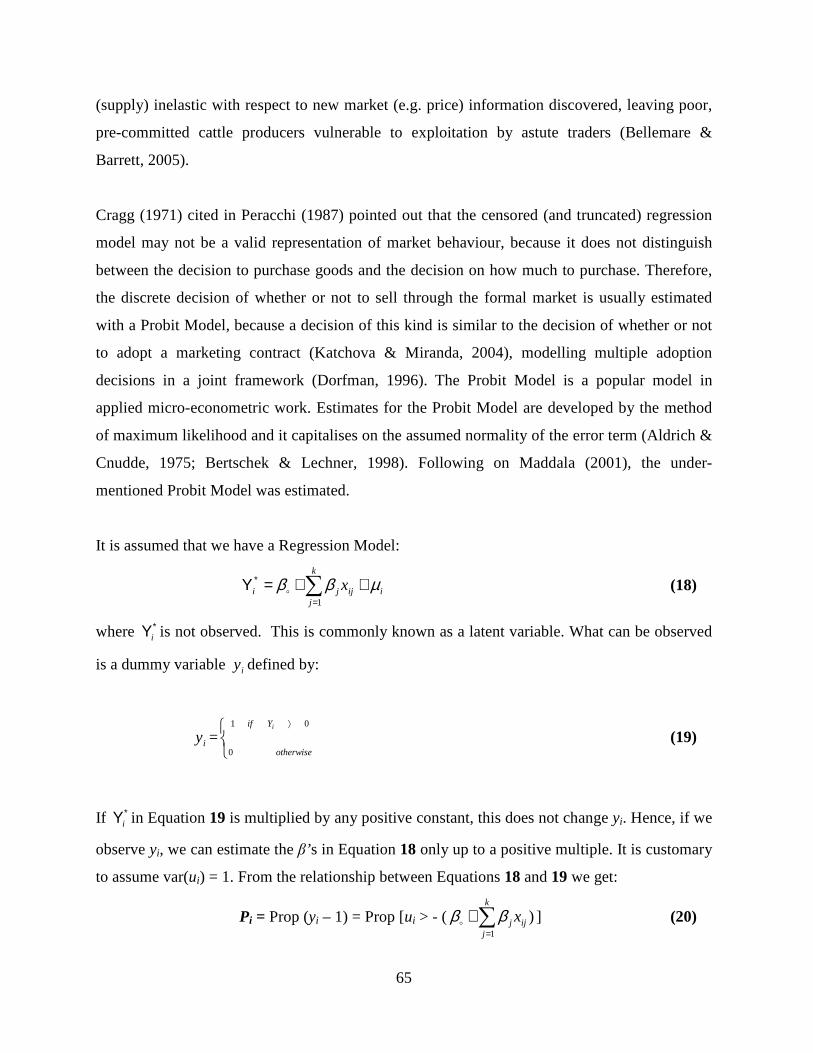
65
(supply) inelastic with respect to new market (e.g. price) information discovered, leaving poor,
pre-committed cattle producers vulnerable to exploitation by astute traders (Bellemare &
Barrett, 2005).
Cragg (1971) cited in Peracchi (1987) pointed out that the censored (and truncated) regression
model may not be a valid representation of market behaviour, because it does not distinguish
between the decision to purchase goods and the decision on how much to purchase. Therefore,
the discrete decision of whether or not to sell through the formal market is usually estimated
with a Probit Model, because a decision of this kind is similar to the decision of whether or not
to adopt a marketing contract (Katchova & Miranda, 2004), modelling multiple adoption
decisions in a joint framework (Dorfman, 1996). The Probit Model is a popular model in
applied micro-econometric work. Estimates for the Probit Model are developed by the method
of maximum likelihood and it capitalises on the assumed normality of the error term (Aldrich &
Cnudde, 1975; Bertschek & Lechner, 1998). Following on Maddala (2001), the under-
mentioned Probit Model was estimated.
It is assumed that we have a Regression Model:
iij
k
jji x µββ ++=Υ ∑
=
∗
1o
(18)
where ∗Υi is not observed. This is commonly known as a latent variable. What can be observed
is a dummy variable iy defined by:
iy = ⟩ 01
0
iYif
otherwise
(19)
If ∗Υi in Equation 19 is multiplied by any positive constant, this does not change yi. Hence, if we
observe yi, we can estimate the β’s in Equation 18 only up to a positive multiple. It is customary
to assume var(ui) = 1. From the relationship between Equations 18 and 19 we get:
Pi = Prop (yi – 1) = Prop [ui > - ( ∑=
+k
jijj x
1
)ββo
] (20)

66
= 1-F
+− ∑
=
k
jijj x
1
ββo
where F is the cumulative distribution function of u if the distribution of u is symmetric, since
1-F(-Z) = F(Z). The observed yi are just realisations of a binomial process, with probabilities
given by:
Pi = F
+∑
=
k
jijj x
1
ββo
(21)
Varying from trial to trial (depending on xij), we can write the likelihood function as:
L = ( )∏∏==
−01
1ii y
iy
i PP
(22)
We can write Equation 21 differently, as given by Katchova and Miranda (2004):
P(ci = 1) = Φ(γ′zi) (23)
where ci is the formal marketing decision, Φ is the standard normal cumulative density function,
zi is an R× 1 vector of personal and farm characteristics for farmer i, and γ′ is a vector of
coefficients. It is assumed that the density of ci, conditional on being a non-limit (positive)
observation, is that of N (Xtβ2, σ2).
3.3.3 Factors affecting the decision on the proportion of cattle to be sold through the
formal market in cases where the producer has decided to make use of the formal
market to sell his/her cattle
This specification relies on the potentially strong assumption that the cattle producer’s discrete
choice to participate in the formal market is made simultaneously with the continuous choice as
to the number of animals to sell, conditional on having chosen to go through the formal market.
Bellemare and Barrett (2005) indicated that the distinction between whether a cattle producer
makes his decisions on market participation and purchase or sales volume sequentially or
simultaneously has significant implications for several relationships of interest in market
participation studies.
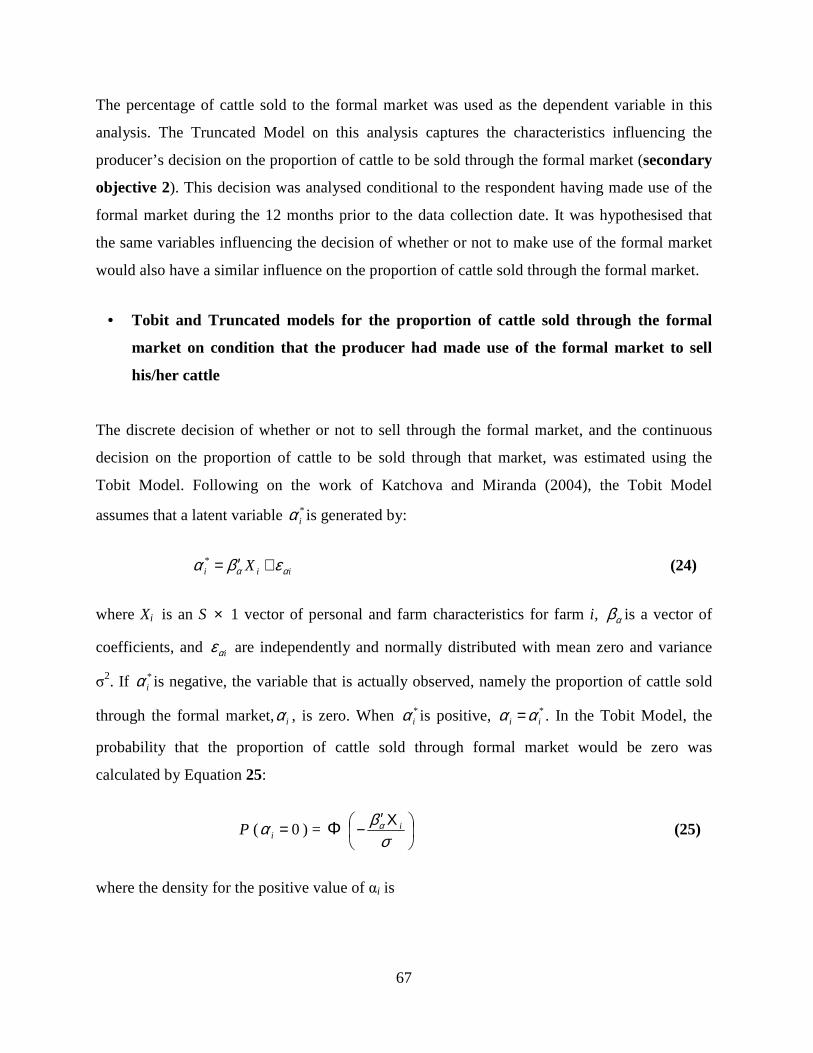
67
The percentage of cattle sold to the formal market was used as the dependent variable in this
analysis. The Truncated Model on this analysis captures the characteristics influencing the
producer’s decision on the proportion of cattle to be sold through the formal market (secondary
objective 2). This decision was analysed conditional to the respondent having made use of the
formal market during the 12 months prior to the data collection date. It was hypothesised that
the same variables influencing the decision of whether or not to make use of the formal market
would also have a similar influence on the proportion of cattle sold through the formal market.
• Tobit and Truncated models for the proportion of cattle sold through the formal
market on condition that the producer had made use of the formal market to sell
his/her cattle
The discrete decision of whether or not to sell through the formal market, and the continuous
decision on the proportion of cattle to be sold through that market, was estimated using the
Tobit Model. Following on the work of Katchova and Miranda (2004), the Tobit Model
assumes that a latent variable *iα is generated by:
iii X αα εβα +′=*
(24)
where Xi is an S × 1 vector of personal and farm characteristics for farm i, αβ is a vector of
coefficients, and iαε are independently and normally distributed with mean zero and variance
σ2. If *iα is negative, the variable that is actually observed, namely the proportion of cattle sold
through the formal market,iα , is zero. When *iα is positive, *
ii αα = . In the Tobit Model, the
probability that the proportion of cattle sold through formal market would be zero was
calculated by Equation 25:
P ( 0=iα ) = Φ
Χ′−
σβα i
(25)
where the density for the positive value of αi is

68
f (αi | αi > 0) = ( )
( )
Χ′Φ
Χ′−
=>
σβ
σβαφ
αα
αα
α
i
ii
i
i
P
f1
0 (26)
and where ( )•φ is the standard normal probability density function. Equation 25 represents the
adoption decision, and is a valid Probit Model if considered separately from Equation 26.
Equation 26 represents a Truncated regression for the positive values of the continuous decision
on the proportion of cattle to be sold through the formal market( )0>iα , as indicated by
Peracchi (1987). The Tobit Model arises when the decision represented by the Probit Model in
Equation 26, and the decision on the proportion of cattle to be sold through the formal market,
represented by the Truncated Regression Model in Equation 26, have the same variables Xi and
the same parameter vectorαβ . In the Tobit Model, a variable that increases the probability of the
producer deciding to sell through the formal market will also increase the mean number of cattle
marketed through the formal market (Katchova & Miranda, 2004).
Using Equation 26, a Truncated Regression Model was used to determine the proportion of
cattle sold through the formal market on condition that the producer had made use of the
formal market to sell his/her cattle. The data used for this analysis was obtained from the
matrix V in Equation 2, and the same procedures were followed as specified from Equations 5
to 12. Only those cattle producers who claimed to have made use of the formal market were
included in this analysis. The use of a two-step model allows different variables to influence the
decision of whether or not to use the formal market, as well as the proportion of cattle sold
through that market. A variable can also influence these decisions in the same or the opposite
direction (Katchova & Miranda, 2004).
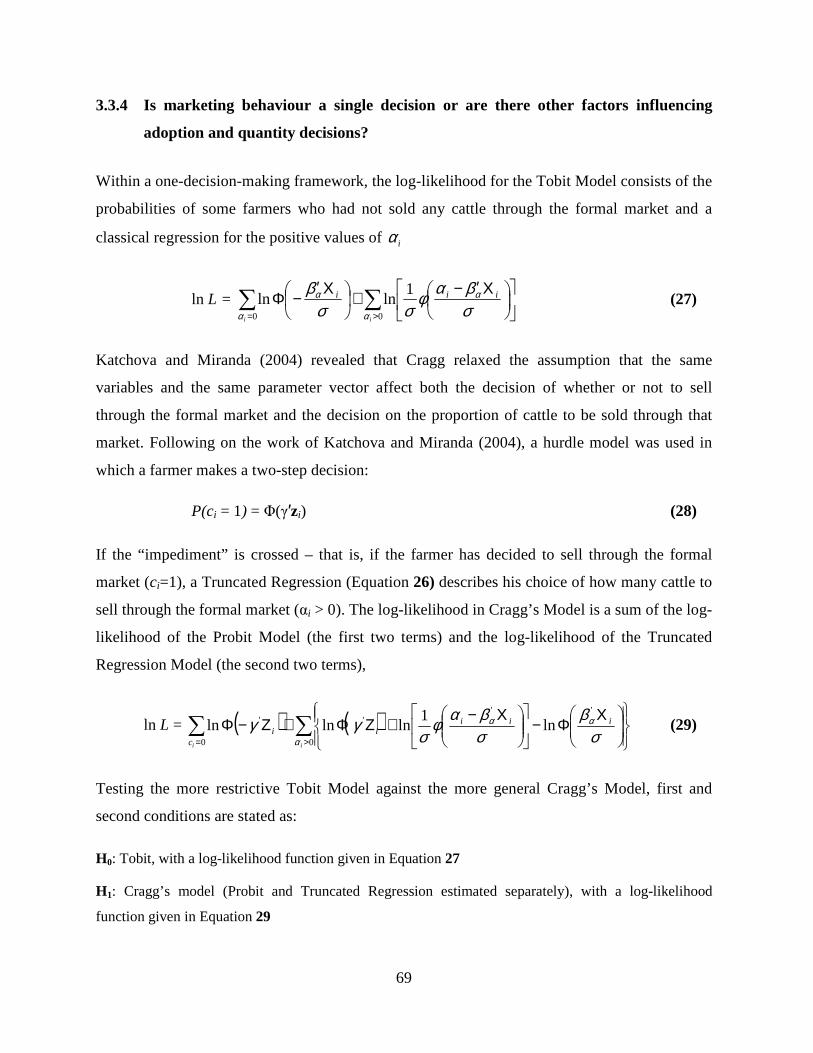
69
3.3.4 Is marketing behaviour a single decision or are there other factors influencing
adoption and quantity decisions?
Within a one-decision-making framework, the log-likelihood for the Tobit Model consists of the
probabilities of some farmers who had not sold any cattle through the formal market and a
classical regression for the positive values of iα
ln L =
Χ′−+
Χ′−Φ ∑∑
>= σβαφ
σσβ α
αα
α iii
ii
1lnln
00 (27)
Katchova and Miranda (2004) revealed that Cragg relaxed the assumption that the same
variables and the same parameter vector affect both the decision of whether or not to sell
through the formal market and the decision on the proportion of cattle to be sold through that
market. Following on the work of Katchova and Miranda (2004), a hurdle model was used in
which a farmer makes a two-step decision:
P(ci = 1) = Φ(γ′zi) (28)
If the “impediment” is crossed – that is, if the farmer has decided to sell through the formal
market (ci=1), a Truncated Regression (Equation 26) describes his choice of how many cattle to
sell through the formal market (αi > 0). The log-likelihood in Cragg’s Model is a sum of the log-
likelihood of the Probit Model (the first two terms) and the log-likelihood of the Truncated
Regression Model (the second two terms),
ln L = ( ) ( )∑∑>=
ΧΦ−
Χ−+ΖΦ+Ζ−Φ0
'''
0
' ln1
lnlnlnii
iiii
ci
α
αα
σβ
σβαφ
σγγ
(29)
Testing the more restrictive Tobit Model against the more general Cragg’s Model, first and
second conditions are stated as:
H0: Tobit, with a log-likelihood function given in Equation 27
H1: Cragg’s model (Probit and Truncated Regression estimated separately), with a log-likelihood
function given in Equation 29
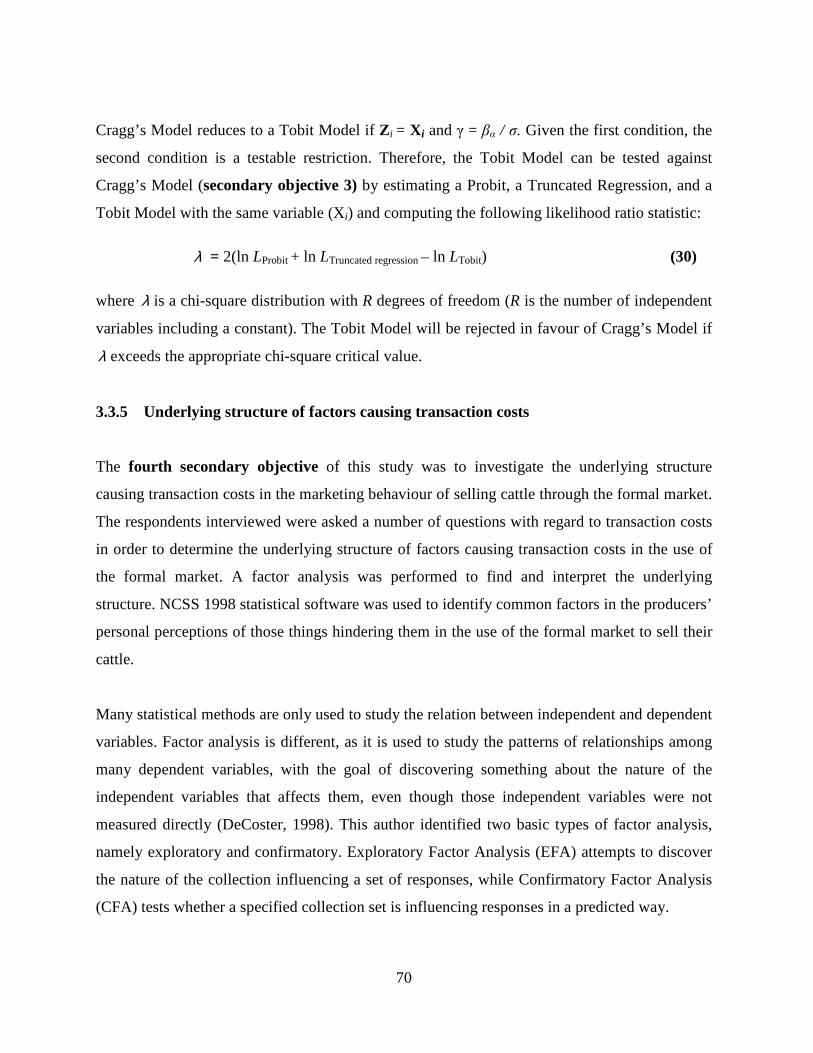
70
Cragg’s Model reduces to a Tobit Model if Z i = Xi and γ = βα / σ. Given the first condition, the
second condition is a testable restriction. Therefore, the Tobit Model can be tested against
Cragg’s Model (secondary objective 3) by estimating a Probit, a Truncated Regression, and a
Tobit Model with the same variable (Xi) and computing the following likelihood ratio statistic:
λ = 2(ln LProbit + ln LTruncated regression – ln LTobit) (30)
where λ is a chi-square distribution with R degrees of freedom (R is the number of independent
variables including a constant). The Tobit Model will be rejected in favour of Cragg’s Model if
λ exceeds the appropriate chi-square critical value.
3.3.5 Underlying structure of factors causing transaction costs
The fourth secondary objective of this study was to investigate the underlying structure
causing transaction costs in the marketing behaviour of selling cattle through the formal market.
The respondents interviewed were asked a number of questions with regard to transaction costs
in order to determine the underlying structure of factors causing transaction costs in the use of
the formal market. A factor analysis was performed to find and interpret the underlying
structure. NCSS 1998 statistical software was used to identify common factors in the producers’
personal perceptions of those things hindering them in the use of the formal market to sell their
cattle.
Many statistical methods are only used to study the relation between independent and dependent
variables. Factor analysis is different, as it is used to study the patterns of relationships among
many dependent variables, with the goal of discovering something about the nature of the
independent variables that affects them, even though those independent variables were not
measured directly (DeCoster, 1998). This author identified two basic types of factor analysis,
namely exploratory and confirmatory. Exploratory Factor Analysis (EFA) attempts to discover
the nature of the collection influencing a set of responses, while Confirmatory Factor Analysis
(CFA) tests whether a specified collection set is influencing responses in a predicted way.
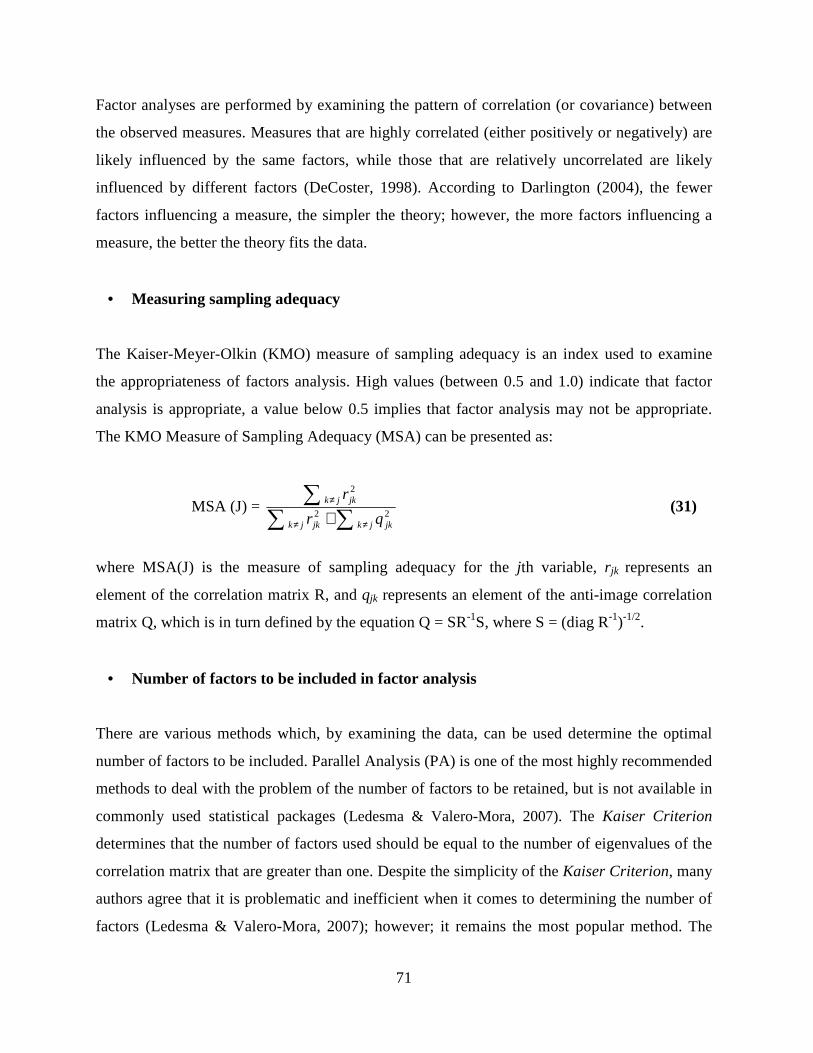
71
Factor analyses are performed by examining the pattern of correlation (or covariance) between
the observed measures. Measures that are highly correlated (either positively or negatively) are
likely influenced by the same factors, while those that are relatively uncorrelated are likely
influenced by different factors (DeCoster, 1998). According to Darlington (2004), the fewer
factors influencing a measure, the simpler the theory; however, the more factors influencing a
measure, the better the theory fits the data.
• Measuring sampling adequacy
The Kaiser-Meyer-Olkin (KMO) measure of sampling adequacy is an index used to examine
the appropriateness of factors analysis. High values (between 0.5 and 1.0) indicate that factor
analysis is appropriate, a value below 0.5 implies that factor analysis may not be appropriate.
The KMO Measure of Sampling Adequacy (MSA) can be presented as:
MSA (J) = ∑ ∑
∑≠≠
≠
+ 22
2
jkjkjkjk
jkjk
qr
r
(31)
where MSA(J) is the measure of sampling adequacy for the jth variable, r jk represents an
element of the correlation matrix R, and qjk represents an element of the anti-image correlation
matrix Q, which is in turn defined by the equation Q = SR-1S, where S = (diag R-1)-1/2.
• Number of factors to be included in factor analysis
There are various methods which, by examining the data, can be used determine the optimal
number of factors to be included. Parallel Analysis (PA) is one of the most highly recommended
methods to deal with the problem of the number of factors to be retained, but is not available in
commonly used statistical packages (Ledesma & Valero-Mora, 2007). The Kaiser Criterion
determines that the number of factors used should be equal to the number of eigenvalues of the
correlation matrix that are greater than one. Despite the simplicity of the Kaiser Criterion, many
authors agree that it is problematic and inefficient when it comes to determining the number of
factors (Ledesma & Valero-Mora, 2007); however; it remains the most popular method. The
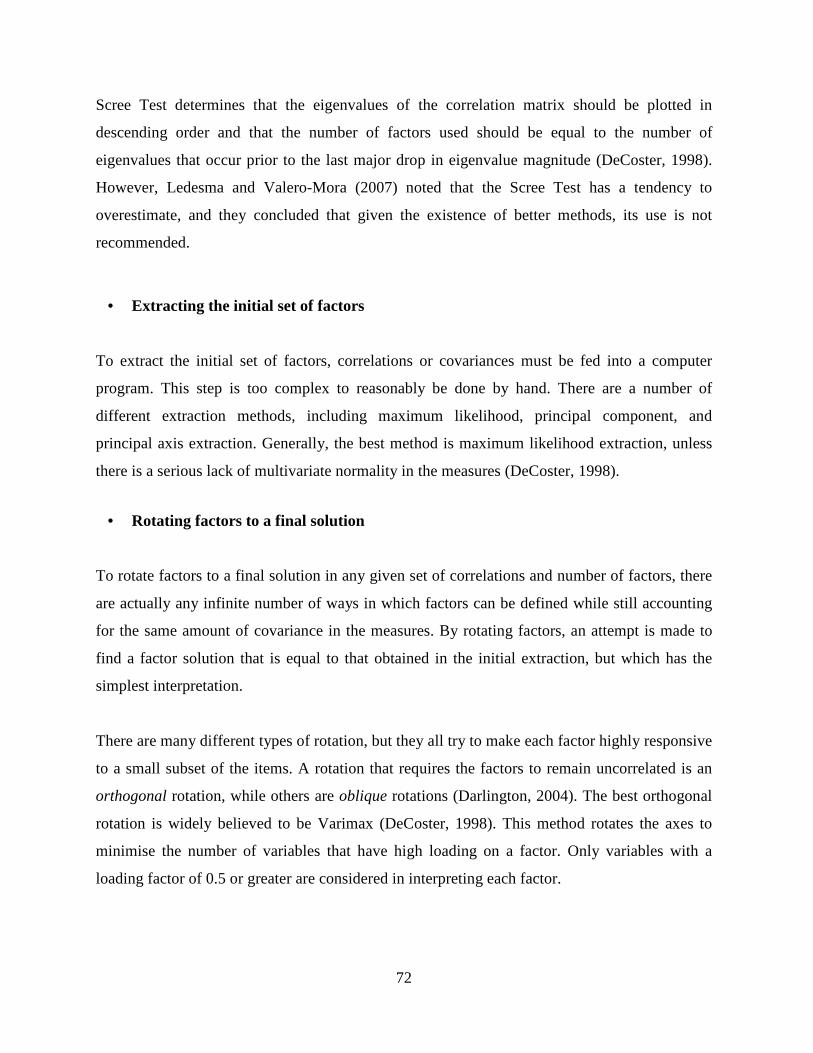
72
Scree Test determines that the eigenvalues of the correlation matrix should be plotted in
descending order and that the number of factors used should be equal to the number of
eigenvalues that occur prior to the last major drop in eigenvalue magnitude (DeCoster, 1998).
However, Ledesma and Valero-Mora (2007) noted that the Scree Test has a tendency to
overestimate, and they concluded that given the existence of better methods, its use is not
recommended.
• Extracting the initial set of factors
To extract the initial set of factors, correlations or covariances must be fed into a computer
program. This step is too complex to reasonably be done by hand. There are a number of
different extraction methods, including maximum likelihood, principal component, and
principal axis extraction. Generally, the best method is maximum likelihood extraction, unless
there is a serious lack of multivariate normality in the measures (DeCoster, 1998).
• Rotating factors to a final solution
To rotate factors to a final solution in any given set of correlations and number of factors, there
are actually any infinite number of ways in which factors can be defined while still accounting
for the same amount of covariance in the measures. By rotating factors, an attempt is made to
find a factor solution that is equal to that obtained in the initial extraction, but which has the
simplest interpretation.
There are many different types of rotation, but they all try to make each factor highly responsive
to a small subset of the items. A rotation that requires the factors to remain uncorrelated is an
orthogonal rotation, while others are oblique rotations (Darlington, 2004). The best orthogonal
rotation is widely believed to be Varimax (DeCoster, 1998). This method rotates the axes to
minimise the number of variables that have high loading on a factor. Only variables with a
loading factor of 0.5 or greater are considered in interpreting each factor.
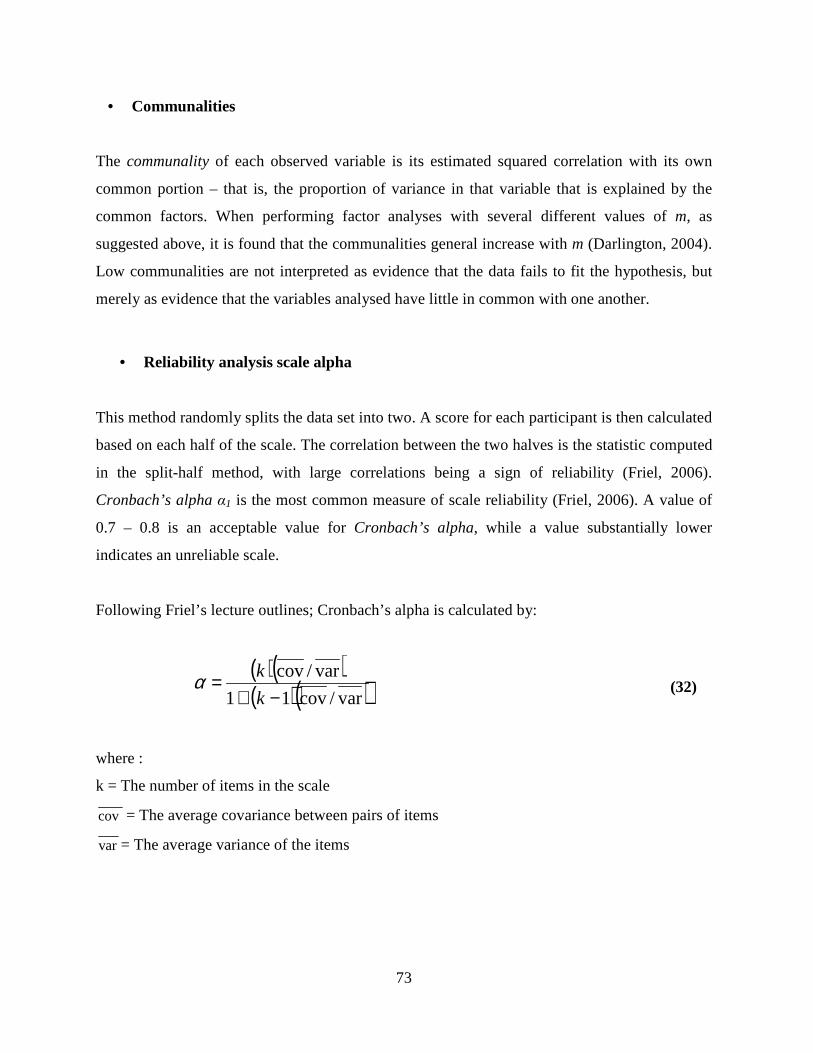
73
• Communalities
The communality of each observed variable is its estimated squared correlation with its own
common portion – that is, the proportion of variance in that variable that is explained by the
common factors. When performing factor analyses with several different values of m, as
suggested above, it is found that the communalities general increase with m (Darlington, 2004).
Low communalities are not interpreted as evidence that the data fails to fit the hypothesis, but
merely as evidence that the variables analysed have little in common with one another.
• Reliability analysis scale alpha
This method randomly splits the data set into two. A score for each participant is then calculated
based on each half of the scale. The correlation between the two halves is the statistic computed
in the split-half method, with large correlations being a sign of reliability (Friel, 2006).
Cronbach’s alpha α1 is the most common measure of scale reliability (Friel, 2006). A value of
0.7 – 0.8 is an acceptable value for Cronbach’s alpha, while a value substantially lower
indicates an unreliable scale.
Following Friel’s lecture outlines; Cronbach’s alpha is calculated by:
( )( )( )( )var/cov11
var/cov
−+=
k
kα
(32)
where :
k = The number of items in the scale
cov = The average covariance between pairs of items
var = The average variance of the items

74
If the scale items have been standardised:
( )( )[ ] ( )( )[ ]rkrk 11/ −+=α (33)
• Interpretation of factor structure
Each of the measures will be linearly related to each factor. The strength of this relationship is
contained in the respective factor loading, produced by rotation. This loading can be interpreted
as a standardised regression coefficient, regressing the factor on the measures.
This concludes the data and methodology chapter. Amongst the issues discussed in this chapter
were questionnaire design and data collection procedures. In addition, this chapter included a
description of hypothesised explanatory variables and the procedures and methods used to
achieve the objectives of the study. The next chapter will discuss the results of the data
gathered, using the methodologies described above.
75
CHAPTER 4
RESULTS AND DISCUSSION
4.1 Introduction
Chapter 4 is devoted to the research results and the discussion of the research findings. It is
presented in four sections, namely findings on the factors influencing the producer’s choice of
whether or not to sell through the formal market; findings on the factors influencing the
proportion of cattle marketed through the formal market in cases where the producer has
decided to use such a market; results of the formal testing of whether it is sufficient to consider
the analysis as a one-decision-making model or a two-decision-making model; and discussion
of the investigation of the underlying structure of factors causing transaction costs.
4.2 Factors influencing the producer’s choice of whether or not to sell through the formal market
A binary Probit Regression Model was used to determine the factors influencing the decision of
whether or not to sell through the formal market (secondary objective 1). Due to the low
number of cattle producers indicating that they had never sold their cattle through the formal
market, a decision was subsequently made to assign a value of zero to those producers selling
less than 20 % of their cattle through the formal market, and a value of one to those producers
selling more than 20 % of their cattle through the formal market. Table 6 shows the results of
the standardised coefficient of the Probit Model (Eviews 6) used to quantify the variables
hypothesised to influence the decision of whether or not to sell through the formal market. It
should be noted that the interpretation of the Probit coefficients differs from that of typical
linear regressions (Bahta & Bauer, 2007). Greater manipulation is thus required in order to
calculate the impact of the independent variables on the probability of the producer deciding to
sell through the formal market (Bahta & Bauer, 2007). For purposes of this study, coefficients
76
were only interpreted according to the direction of their influence on the marketing behaviour of
the cattle producers. The partial effects of individual variables were thus not calculated.
Table 6 can be interpreted as follows: (i) Firstly, we consider the probability value, which
indicates the significance of the factor’s influence on the marketing behaviour of cattle
producers; (ii) Secondly, we consider the coefficient magnitude, which indicates the impact of
the variable on the marketing behaviour of cattle producers, from the largest magnitude to the
smallest; and (iii) Finally, we consider the coefficient and T-value sign, indicating the direction
of the variable’s influence on the marketing behaviour of cattle producers. Hence, the variables
are interpreted in the following order: Firstly, problems transporting cattle to MeatCo,
followed by improved productivity , then accessibility of market-related information , and
accessibility to information on new technology. The remaining variables are interpreted in the
same way. This means that if a variable is not significant up to 15 %, then it has no influence on
the marketing behaviour of cattle producers in the NCR.
The model correctly predicted 84 % of the observations, which implies that the model is a good
fit. The McFadden R-Squared value of 0.2790 indicates that the explanatory variables included
in this study explains only about 28 % of the variation in the probability of the producer
deciding to market at least 20 % of his cattle through the formal market. The small McFadden
R-Squared value indicates that there are some other factors not considered in this model, which
have a major influence on the decision of whether or not to sell through the formal market. The
model Chi-Square statistic was also used as a measure of goodness of fit. The model chi-square
statistic is the difference in the values of the two log-likelihood functions (i.e. the null model-2
log-likelihood and the full model-2 log-likelihood), which is 32.017. If the p-value for the
overall model fit statistic is less than the conventional 0.05, then there is evidence that at least
one of the independent variables contributes to the prediction of the outcome (Bahta & Bauer,
2007). The latter is true for the fitted model. The overall chi-square statistic is significant
(p<0.05), indicating that at least one of the parameters in the equation is non-zero.
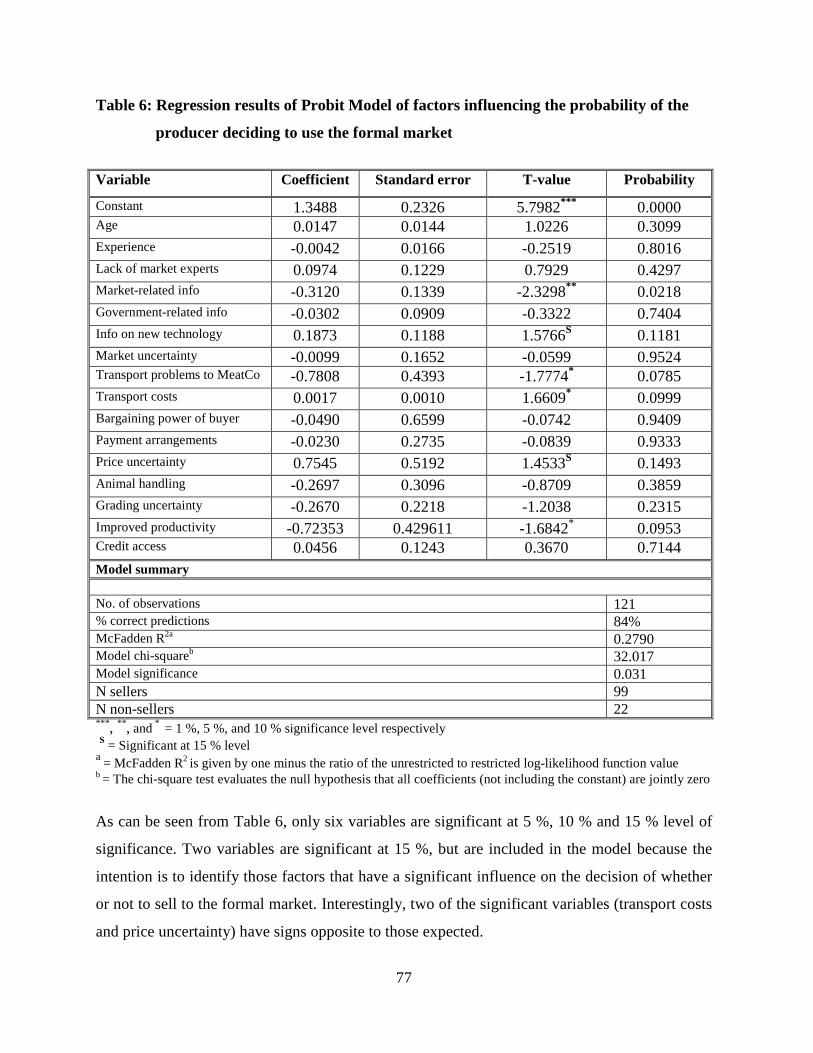
77
Table 6: Regression results of Probit Model of factors influencing the probability of the
producer deciding to use the formal market
Variable Coefficient Standard error T-value Probability
Constant 1.3488 0.2326 5.7982*** 0.0000 Age 0.0147 0.0144 1.0226 0.3099 Experience -0.0042 0.0166 -0.2519 0.8016 Lack of market experts 0.0974 0.1229 0.7929 0.4297 Market-related info -0.3120 0.1339 -2.3298** 0.0218
Government-related info -0.0302 0.0909 -0.3322 0.7404 Info on new technology 0.1873 0.1188 1.5766S 0.1181
Market uncertainty -0.0099 0.1652 -0.0599 0.9524 Transport problems to MeatCo -0.7808 0.4393 -1.7774* 0.0785
Transport costs 0.0017 0.0010 1.6609* 0.0999
Bargaining power of buyer -0.0490 0.6599 -0.0742 0.9409 Payment arrangements -0.0230 0.2735 -0.0839 0.9333 Price uncertainty 0.7545 0.5192 1.4533S 0.1493
Animal handling -0.2697 0.3096 -0.8709 0.3859 Grading uncertainty -0.2670 0.2218 -1.2038 0.2315 Improved productivity -0.72353 0.429611 -1.6842* 0.0953 Credit access 0.0456 0.1243 0.3670 0.7144 Model summary No. of observations 121 % correct predictions 84% McFadden R2a 0.2790 Model chi-squareb 32.017 Model significance 0.031 N sellers 99 N non-sellers 22 *** , ** , and * = 1 %, 5 %, and 10 % significance level respectively S = Significant at 15 % level a = McFadden R2 is given by one minus the ratio of the unrestricted to restricted log-likelihood function value b = The chi-square test evaluates the null hypothesis that all coefficients (not including the constant) are jointly zero
As can be seen from Table 6, only six variables are significant at 5 %, 10 % and 15 % level of
significance. Two variables are significant at 15 %, but are included in the model because the
intention is to identify those factors that have a significant influence on the decision of whether
or not to sell to the formal market. Interestingly, two of the significant variables (transport costs
and price uncertainty) have signs opposite to those expected.

78
It was not expected that transport costs (p<0.10) would have a positive sign on the decision to
sell to the formal market, because, as discussed earlier, it was hypothesised that this variable
would negatively influence the decision to sell to the formal market. Although the sign does not
make economic sense, it may indicate that cattle producers may decide to sell to the formal
market irrespective of whether or not the transport costs are high. Such a decision may become
necessary in cases where the producers are obliged to sell their cattle to the formal market
because they need the money. Other possible reasons that may have influenced the direction of
transport costs could be aligned to the mode of transport used by most producers in the NCR,
as different costs are associated with different modes of transport. This study has revealed that
60 % of the interviewed producers were driving their cattle on hoof to market (see Figure 5). A
possible reason for this could be affordability, as it is cheaper for producers to drive their cattle
on hoof.
Although price uncertainty (p < 0.15) was hypothesised to negatively affect the decision to sell
to the formal market, the results indicate a positive influence, making it difficult to justify the
influence of price uncertainty on the marketing behaviour of cattle producers in the NCR.
Nonetheless, this may be an indication that cattle producers are not sensitive to the weight
differences of their cattle, because marketing patterns are driven more by income needs than by
price movements. This may be attributed to the limited access to resources, as producers
typically do not own scales with which to weigh their animals before market. The differences in
weight (animal’s weight at the production area compared to its weight after delivery to the
slaughtering plant) will therefore not influence the marketing decision, because the initial
weight is unknown. According to the literature review, producers do not wish to see their cattle
moving around the area after having been sold, and they may therefore opt for the formal
market, where the animals are slaughtered a few days after delivery. Irrespective of price
uncertainty, cattle producers are likely to sell their cattle to the formal market as long as this
market honours their wish to not see their cattle moving around the area after having been sold.
Moreover, it may be justified to state that due to uncertainty, producers may hope to receive
high prices because they perceive their cattle to be in good condition – thus, the expectation of
fetching high prices may mobilise the producers to sell their cattle to the formal market.

79
According to the magnitude of the standard coefficients relating to problems transporting cattle
to MeatCo, improved productivity, accessibility to market-related information and accessibility
to information on new technology, problems transporting cattle to MeatCo (p<0.10) is the
variable with the most significant impact on the decision of whether or not to sell through the
formal market. Prominent livestock production areas (cattle posts) are located far from the
Oshakati abattoir, creating a situation where producers have to drive their cattle on hoof,
trekking long distances over several days. This study found that some producers in Omusati and
North-West of Oshikoto have to transport their animals over distances of more than 330 km. As
a result, livestock often loses weight while being transported.
The situation is worsened by the poor road network from the livestock production area, as
certain places cannot be accessed by trucks. Trucks often become stranded along the way,
particularly during the rainy seasons. Most cattle posts are situated deep in the forests, with
dense vegetation along single, narrow roads, fit for small vehicles only. In most cases, trucks
become tangled in the hanging branches of trees along the road, causing massive damage to
vehicles. Consequently, transportation costs are blatantly transferred onto the cattle producers.
Improved productivity ( p< 0.10) is the second variable to have a significantly negative
influence on the decision to sell through the formal market. It is very important to point out that
improved productivity does not necessarily mean an increase in the number of animals.
Rather, it refers to a situation where an increase in the number of animals can be attributed to
improved quality and more desirable breeds of cattle being used for farming. This argument is
based on the fact that producers may perceive large numbers of animals to be evidence of
improved productivity. However, no matter how many animals the producer owns, if they are of
poor quality they will not generate a good income, because productivity will be low.
Thus, lack of improved productivity among animals in the NCR is believed to discourage
producers from selling through the formal market. A possible reason could be that producers
have high expectations of receiving good returns when selling their cattle to the formal market,
without considering the productivity value of their cattle. Consequently, after the cattle have

80
been slaughtered and graded, producers who receive a lower price than expected often feel
deceived and become discouraged from supplying cattle to MeatCo.
In cases where improved productivity truly occurs, producers tend to retain their cattle,
especially when they are healthy and with an attractive appearance. The attitude of retaining
healthy and attractive animals is stimulated by the mindset of first marketing off the unhealthy
and unattractive animals. Thus, improved productivity may make it more difficult to select
cattle for marketing, leading to a situation where fewer or even no cattle are marketed.
Improving feed rations and feed efficiency would lower costs, but would necessitate capacity-
building in ancillary value chain functions, such as cattle nutrition practices and long-run
investment in better feed resources. Consider, for example, a policy that seeks to induce a
farmer to adopt a specific feeding regime pool so that all livestock production may be pooled
and marketed together in order to improve market bargaining power for all producers.
Accessibility to market-related information (p<0.05) is another factor that significantly
influences the decision of whether or not to sell cattle to the formal market. Lack of production-
and marketing-related information has been revealed to be a major constraint that requires
immediate attention in terms of the marketing behaviour of cattle producers in the NCR,
because it results in producers being unable to make mainstream market-related decisions.
Moreover, lack of information results in producers being unable to receive information for the
purpose of adopting new and relevant technologies at the right time. There might be a number
of financial schemes that are designed to benefit producers in a certain way; however, due to
lack of information, producers know very little in terms of whether or not they are eligible for
these funds and how they can access them. Sometimes the information only reaches them after
the application deadlines have passed. Insufficient market information is common due to large
numbers of small producers, inefficient communication systems, and a low level of literacy and
information administration.
Market related-information may include any information type that will be relevant to the
marketing of cattle in the area. This may include price, demand and supply (consumption and
meat-trading patterns), slaughter date, transportation permits, as well as outbreaks of animal
81
diseases. Cattle producers do not have access to information on things like herd off-take and
the carrying capacity of the available grazing areas. Even if such information is made available,
there are still fears of incurring transaction costs in assimilating the supplied information in
terms of understanding and interpreting the information to find the real meaning thereof. Thus,
the provision of market information will strengthen producers' negotiating powers during
transactions with buyers and will consequently prevent possible exploitation by better informed
buyers. Furthermore, provision of market information would result in the opportunistic use of
markets, allowing cattle producers to increase their wealth by buying when prices are low and
selling when prices are high. This would also smooth consumption through conversion between
livestock and cash, which is useful when it comes to solving their immediate needs.
Unlike the three factors discussed above, accessibility to information on new technology
(p<0.15) has a positive influence on the decision to sell through the formal market. Information
Technology (IT) can have a direct impact on transaction costs by reducing the cost and
increasing the accuracy of product quality measurement. This may be evident in cattle
productivity in terms of meat yield per investment unit (cow), as this varies substantially
according to breed improvement, feeding regime and health status. Through the adoption of
new livestock production technologies, producers are in a position to use medication to combat
diseases and employ improved management practices, which leads to a reduced mortality rate
and increased weight gain. Since cattle producers are confident of the quality of their cattle, they
are motivated to sell them through the formal market, as they are confident that they will get a
good return.
4.3 Factors influencing the proportion of cattle sold through the formal market in cases where the producer has decided to make use of that market
To achieve the second secondary objective of identifying factors influencing the proportion of
cattle sold through the formal market in cases where the producer has decided to make use of
that market, the Truncated Model was used. The results of the Truncated specification are
presented in Table 7. Similar to the Probit Regression, the marginal effect of the independent
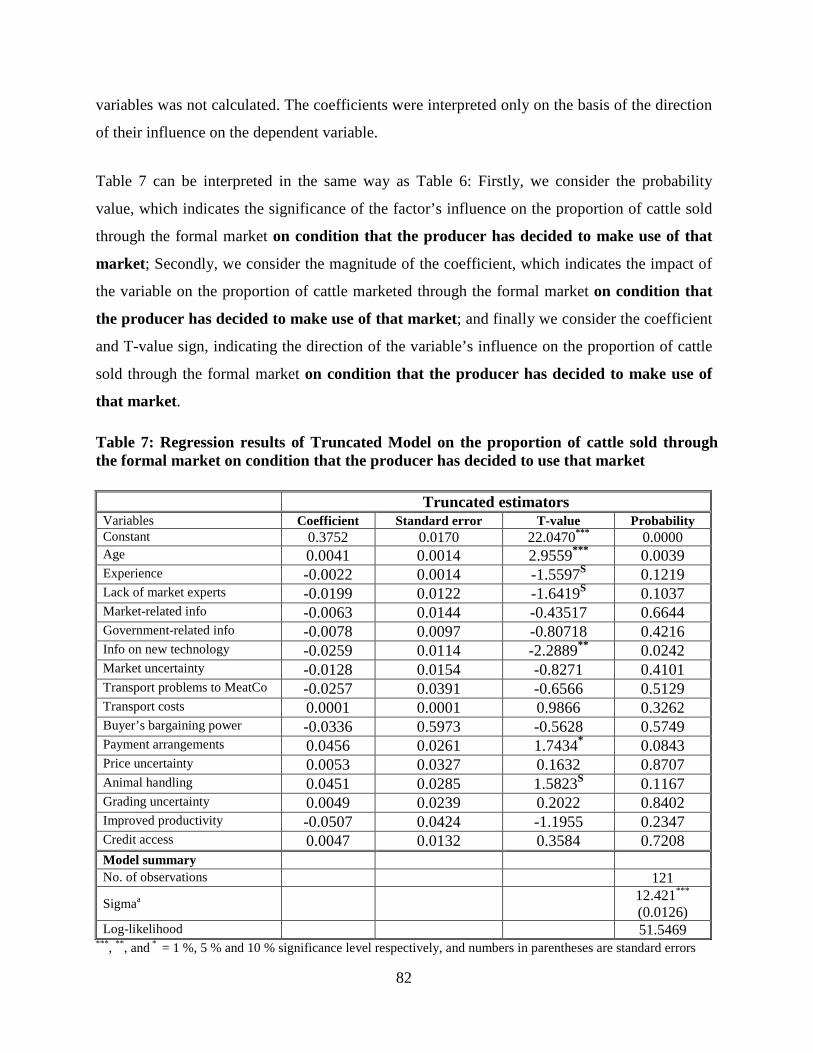
82
variables was not calculated. The coefficients were interpreted only on the basis of the direction
of their influence on the dependent variable.
Table 7 can be interpreted in the same way as Table 6: Firstly, we consider the probability
value, which indicates the significance of the factor’s influence on the proportion of cattle sold
through the formal market on condition that the producer has decided to make use of that
market; Secondly, we consider the magnitude of the coefficient, which indicates the impact of
the variable on the proportion of cattle marketed through the formal market on condition that
the producer has decided to make use of that market; and finally we consider the coefficient
and T-value sign, indicating the direction of the variable’s influence on the proportion of cattle
sold through the formal market on condition that the producer has decided to make use of
that market.
Table 7: Regression results of Truncated Model on the proportion of cattle sold through the formal market on condition that the producer has decided to use that market Truncated estimators Variables Coefficient Standard error T-value Probability Constant 0.3752 0.0170 22.0470*** 0.0000 Age 0.0041 0.0014 2.9559*** 0.0039
Experience -0.0022 0.0014 -1.5597S 0.1219
Lack of market experts -0.0199 0.0122 -1.6419S 0.1037
Market-related info -0.0063 0.0144 -0.43517 0.6644 Government-related info -0.0078 0.0097 -0.80718 0.4216 Info on new technology -0.0259 0.0114 -2.2889** 0.0242
Market uncertainty -0.0128 0.0154 -0.8271 0.4101 Transport problems to MeatCo -0.0257 0.0391 -0.6566 0.5129 Transport costs 0.0001 0.0001 0.9866 0.3262 Buyer’s bargaining power -0.0336 0.5973 -0.5628 0.5749 Payment arrangements 0.0456 0.0261 1.7434* 0.0843
Price uncertainty 0.0053 0.0327 0.1632 0.8707 Animal handling 0.0451 0.0285 1.5823S 0.1167
Grading uncertainty 0.0049 0.0239 0.2022 0.8402 Improved productivity -0.0507 0.0424 -1.1955 0.2347 Credit access 0.0047 0.0132 0.3584 0.7208 Model summary No. of observations 121
Sigmaa
12.421***
(0.0126)
Log-likelihood 51.5469 *** , ** , and * = 1 %, 5 % and 10 % significance level respectively, and numbers in parentheses are standard errors
83
S = 15 % significance level a = Represents the percentage variation in the dependent variable explained by the independent variables in the
model
Based on the results shown in Table 7, six factors (age, accessibility to new information
technology, payment arrangements by MeatCo, experience, lack of market experts and
animal handling) have a significant influence on the proportion of cattle sold through the
formal market.
There was no expectation that marketing experience (p<0.15) would have the opposite sign to
that anticipated. Satisfaction with the experience of selling to the formal market determines the
individual’s interest in that particular marketing channel. The lower the level of satisfaction, the
fewer cattle the producer will be willing to sell through that market channel. The way in which
cattle producers view their farming businesses depends on their personal aspirations, objectives
and goals. Thus, the producer’s decision in respect of marketing is influenced by the relative
importance they attach to their selling and producing roles.
The longer a cattle producer is engaged in agricultural activities, the more marketing experience
he gains. This gives the producer adequate time to compare different marketing channels and
establish a good bond with the channel that offers him the best price.
Given the standardised coefficients of the significant factors, payment arrangements by
MeatCo (p<0.10) has a significant influence in encouraging cattle producers to sell a large
proportion of their cattle through the formal market. MeatCo policy is to settle payment the day
after the slaughtering date. Due to this rapid payment process, producers are encouraged to
increase the proportion of cattle sold, as they are confident of receiving a lump sum of income
shortly after their cattle have been slaughtered.
With regard to the influence of animal handling (p<0.15) on the proportion of cattle sold
through the formal market, it appears that poor handling of their animals does not deter
producers from selling their cattle to the formal market. Instead, it seems to encourage them to
sell more animals to that market. This may be attributed to a number of reasons. Firstly, cattle
84
hides are of no value to the producers, as MeatCo does not grade hides and offal or compensate
producers for them. Secondly, producers tend to dispose of their unattractive cattle first, and any
animal showing bruises or symptoms of disease is likely to be sold before any others.
The next factor influencing the proportion of cattle sold through the formal market is
accessibility of information on new technology (p<0.05). The influence of this variable is
negative, which implies that although new technology can help the producer to increase the
number of animals as a herd, it does not necessarily help to increase the number of cattle with
the same qualities. Thus, producers only choose the best quality cattle to sell through the formal
market and discard the rest for home consumption or for selling to the informal markets, which
have no specified quality requirements or grading procedures. Another possible reason could be
that producers do not have access to the necessary technology to meet the quality demands of
the market, or they may not have enough information on the type of qualities demanded by the
market. For information on new technology to have any effect, it is a prerequisite that certain
infrastructure must be put in place, which means that certain investment decisions must be
made. Given the land tenure system in the NCR, some of the prearrangements made in terms of
paving the way to the implementation of new technology will not be met, as producers are
reluctant to invest in such land (state owned).
Another factor influencing the decision on the proportion of cattle to be sold through the formal
market is lack of market experts (p<0.15). As expected, the sign of this variable is negative.
Market experts (advisors) are important in any market, as these are the people who study the
market trends and patterns. They forecast the market in terms of demand and possible
opportunities that are likely to arise in the market or related areas. Therefore, lack of market
experts may have a lethal effect on the functionality of the entire marketing system if the
stakeholders in the system are uninformed. Producers will typically be the most uninformed
stakeholders, given their rate of digesting circulated market information (market signals).
Producers lacking market information have a reduced ability to respond to the market
requirements and catch up with improved technology, causing them to make ill-informed
decisions, especially regarding the proportion of cattle to be sold through the formal market.

85
The inaccessibility of market experts indicates that cattle producers have no access to the most
relevant information and they are likely to base their decisions on the outdated information they
have available, or on the little marketing experience they have. Cattle producers who are not
well advised, or who fail to consult market experts, continue to supply aged cattle on which they
receive small returns according to the low grades of those animals. Such producers then tend to
believe that the formal market is cheating them and they consequently reduce the proportion of
cattle sold through the formal market. Lack of information thus prevents them from selling
larger proportions of their cattle to the formal market.
The age (p<0.01) of the producer is the final factor that significantly influences the proportion
of cattle sold through the formal market. As discussed earlier, there is a relationship between the
age of the cattle producer and the size of the herd. Older cattle producers are likely to sell a
large quantity of cattle at one time. In most cases, their herds are of a good breed (hybrid) and
this encourages them to sell through the formal market, as they are confident that their cattle
meet the quality attributes considered by buyers.
The results presented by the Probit and Truncated models indicate that different factors
influence the market behaviour of cattle producers in different ways and at different levels. This
strongly defends the second research hypothesis, namely “modelling market behaviour within
the two-decision-making framework”. The next section presents the formal results of testing
whether it is sufficient to model the analysis as a one-decision-making model or as a two-
decision-making model.
4.4 Formal testing of whether it is sufficient to model the analysis as a one-decision-making model or as a two-decision-making model
The Tobit Model imposes the restriction that the coefficients that determine the probability of
being censored are the same as those that determine the conditional means of the uncensored
observation. To test this restriction, a Likelihood Ratio (LR) test, comparing the Tobit to the
unrestricted log-likelihood, that is the sum of a Probit and a Truncated Regression (Equation
30), was carried out. The dependent variable of the Tobit is the proportion of cattle sold to the
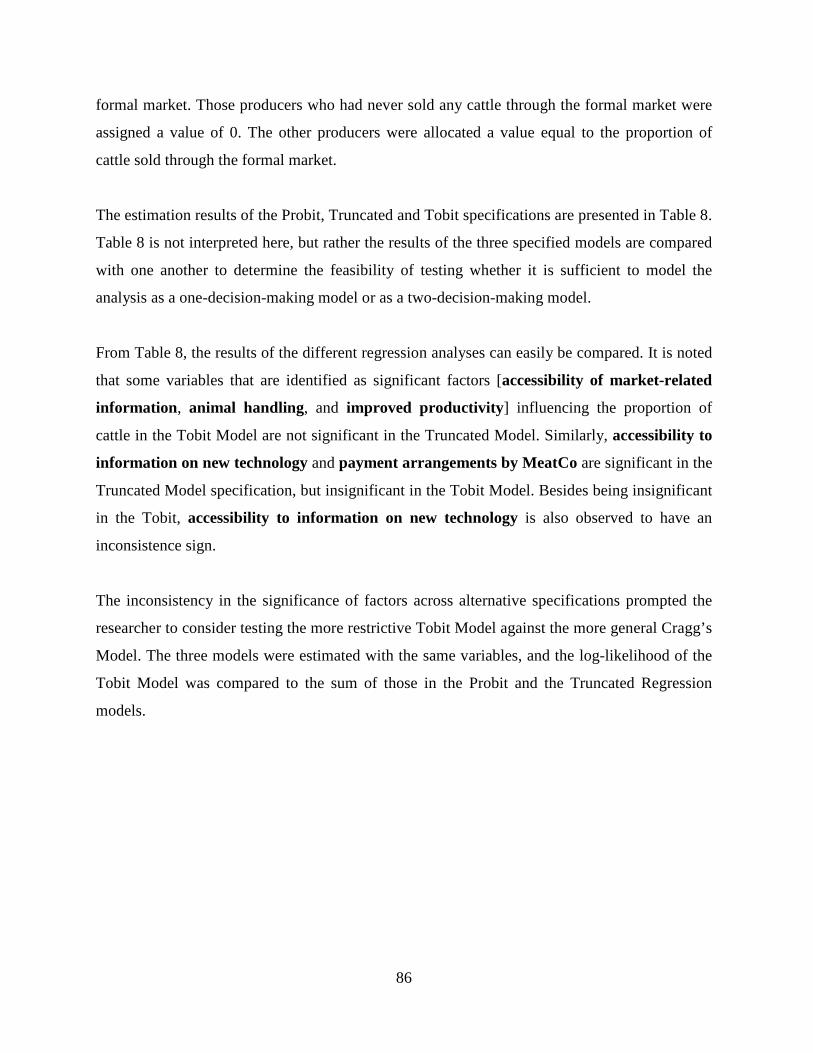
86
formal market. Those producers who had never sold any cattle through the formal market were
assigned a value of 0. The other producers were allocated a value equal to the proportion of
cattle sold through the formal market.
The estimation results of the Probit, Truncated and Tobit specifications are presented in Table 8.
Table 8 is not interpreted here, but rather the results of the three specified models are compared
with one another to determine the feasibility of testing whether it is sufficient to model the
analysis as a one-decision-making model or as a two-decision-making model.
From Table 8, the results of the different regression analyses can easily be compared. It is noted
that some variables that are identified as significant factors [accessibility of market-related
information , animal handling, and improved productivity ] influencing the proportion of
cattle in the Tobit Model are not significant in the Truncated Model. Similarly, accessibility to
information on new technology and payment arrangements by MeatCo are significant in the
Truncated Model specification, but insignificant in the Tobit Model. Besides being insignificant
in the Tobit, accessibility to information on new technology is also observed to have an
inconsistence sign.
The inconsistency in the significance of factors across alternative specifications prompted the
researcher to consider testing the more restrictive Tobit Model against the more general Cragg’s
Model. The three models were estimated with the same variables, and the log-likelihood of the
Tobit Model was compared to the sum of those in the Probit and the Truncated Regression
models.
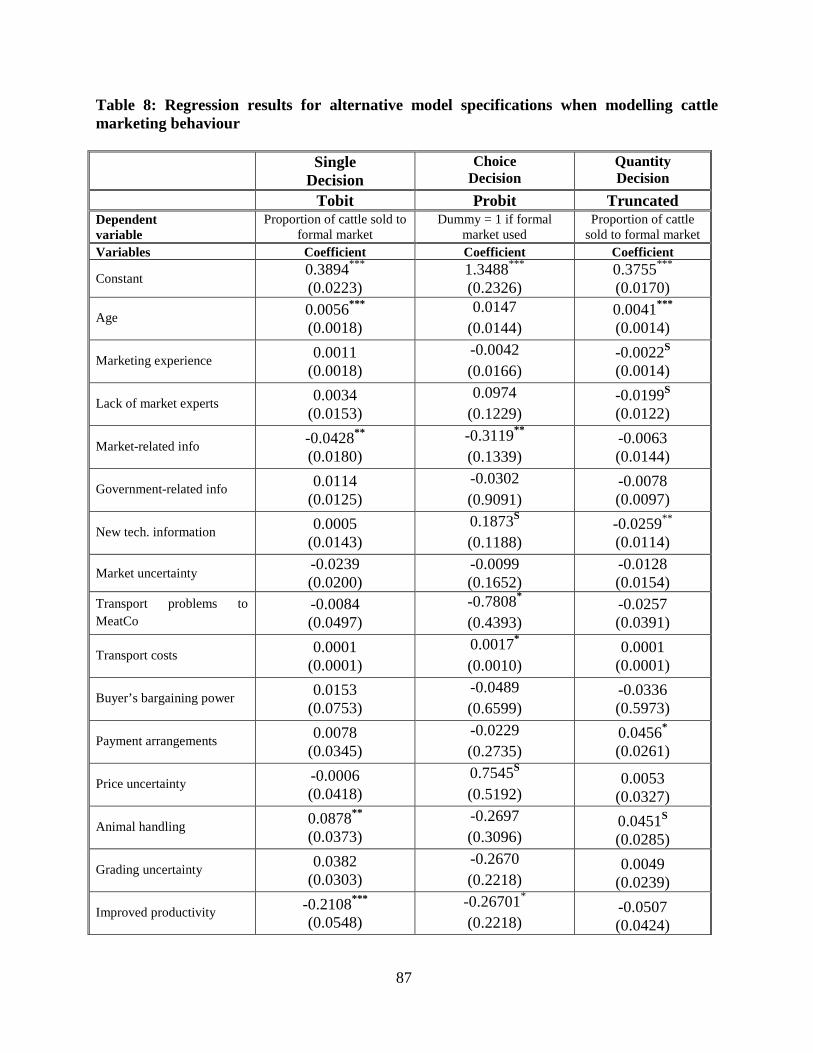
87
Table 8: Regression results for alternative model specifications when modelling cattle marketing behaviour Single
Decision Choice
Decision Quantity Decision
Tobit Probit Truncated Dependent variable
Proportion of cattle sold to formal market
Dummy = 1 if formal market used
Proportion of cattle sold to formal market
Variables Coefficient Coefficient Coefficient
Constant 0.3894***
(0.0223) 1.3488***
(0.2326) 0.3755***
(0.0170)
Age 0.0056***
(0.0018) 0.0147
(0.0144) 0.0041***
(0.0014)
Marketing experience 0.0011 (0.0018)
-0.0042 (0.0166)
-0.0022S
(0.0014)
Lack of market experts 0.0034 (0.0153)
0.0974 (0.1229)
-0.0199S
(0.0122)
Market-related info -0.0428**
(0.0180) -0.3119**
(0.1339) -0.0063 (0.0144)
Government-related info 0.0114 (0.0125)
-0.0302 (0.9091)
-0.0078 (0.0097)
New tech. information 0.0005 (0.0143)
0.1873S
(0.1188) -0.0259**
(0.0114)
Market uncertainty -0.0239 (0.0200)
-0.0099 (0.1652)
-0.0128 (0.0154)
Transport problems to MeatCo
-0.0084 (0.0497)
-0.7808*
(0.4393) -0.0257 (0.0391)
Transport costs 0.0001 (0.0001)
0.0017*
(0.0010) 0.0001
(0.0001)
Buyer’s bargaining power 0.0153 (0.0753)
-0.0489 (0.6599)
-0.0336 (0.5973)
Payment arrangements 0.0078 (0.0345)
-0.0229 (0.2735)
0.0456*
(0.0261)
Price uncertainty -0.0006 (0.0418)
0.7545S
(0.5192) 0.0053
(0.0327)
Animal handling 0.0878**
(0.0373) -0.2697 (0.3096)
0.0451S
(0.0285)
Grading uncertainty 0.0382 (0.0303)
-0.2670 (0.2218)
0.0049 (0.0239)
Improved productivity -0.2108***
(0.0548) -0.26701*
(0.2218) -0.0507 (0.0424)
88
Credit access 0.0062 (0.0169)
0.0456 (0.1243)
0.0047 (0.0132)
Model summary No. of observations 121 121 121
Sigmaa 13.728***
(0.0175) 12.421***
(0.0126) Log-likelihood -19.913 -41.356 51.546 McFadden R2b 0.2790 Model chi-squarec 32.017 Model significance level 0.031 LR test for Tobit vs. Truncated regression
60.2075d
(0.0000)e
*** , ** , and * = 1 %, 5 % and 10 % significance level respectively and numbers in parentheses are standard errors S = 15 % significance level a R represents the percentage variation in the dependent variable explained by the independent variables in the
model b = McFadden R2 is given by one minus the ratio of the unrestricted to restricted log-likelihood function value c= The chi-square test evaluates the null hypothesis that all coefficients (not including the constant) are jointly zero d = The likelihood ratio test is given by λ = 2(ln LProbit + ln LTruncated regression - ln LTobit) e = Numbers in parentheses are associated with chi-square probabilities
The highly significant (p<0.000012) log-likelihood test ratio of 60.21 strongly rejects the Tobit
Model specification in favour of the more general Cragg’s Model specification. This implies
that the same personal and farm characteristics do not influence both the decision of whether or
not to sell to the formal market and the decision on the proportion of cattle to be sold through
the formal market in the same way through the restricted coefficients in the Tobit Model. For
instance, in the Tobit Model, any variable that increases the probability of a non-zero value
must also increase the mean of the positive values (Lin & Schmidt, 1983). Thus, modelling the
proportion of cattle sold to the formal market within a one-decision-making framework will fail
to identify the correct factor affecting the decision of whether or not to sell through the formal
market.
Cragg’s Model avoids both the above problems associated with the Tobit Model. A reasonably
strong case can be made for it as a general alternative to the Tobit Model, for the analysis of
data sets in which zero is a common (and meaningful) value of the dependent variable, and the
non-zero observations are all positive. The distribution of such a dependent variable is
characterised by the probability that it equals zero and by the (conditional) distribution of the
positive observations, both of which Cragg’s Model parameterises in a general way.

89
4.5 Investigation into the underlying structure of factors causing transaction costs
A factor analysis was conducted to reduce the dimensionality of producers’ perceptions of the
factors hindering frequent use of the formal market and the supply of large proportions of cattle
to that market. As stated in Chapter 3, the first step when performing a factor analysis is to
determine whether it is actually necessary. This is done by testing the adequacy with which the
data can be sampled. In this study, the suitability of individual variables for use in the factor
analysis was evaluated using the Kaiser-Meyer-Olkin (KMO) measure of sampling adequacy.
The measure of sampling adequacy was determined by means of PASW Statistics 17. The
KMO values of the final variables included in the factor analysis are presented in Table 9. From
Table 9 it is clear that all of these variables scored a KMO value well over 0.5, with the lowest
being 0.745. This indicates that the remaining individual variables “belong to the family” of the
large group of variables, and a factor analysis could be performed on them.
Table 9: Results of the Kaiser-Meyer-Olkin measure of sampling adequacy Variables KMO value Weight loss during quarantine period 0.745 Weight loss during transportation 0.768 Carcass/hide damage 0.784 Consideration of time of delivery 0.934 Consideration of place of delivery 0.925 Frequency of cattle sales 0.784 Number of cattle to market 0.784
• Variables used in the factor analysis
Weight loss during quarantine period is a variable indicating that loss of weight has a direct
impact on the pricing of the carcass at the abattoir. This variable was included in the data
collection, because the temporarily abolition of the cattle quarantining law was implemented
within the 12 months prior to the date of data collection, and some of the interviewed
respondents had experience of this. Moreover, there is a possibility that the system may be re-
90
implemented in light of the reopening of the South African market, which in the past has
required cattle from the NCA to be quarantined for 21days before slaughter.
Weight loss during transportation indicates weight loss that occurs between the production
area and the slaughter house. Weight loss occurs because most producers drive their cattle to
market on hoof in order to avoid the high cost of using trucks. It may take several days to trek
cattle (on hoof) from the production areas (cattle post) to Oshakati, and in the process cattle
may become stressed, thus affecting the grading of the carcass. This has an impact on the
pricing of the carcass, thus reducing the expected return.
Carcass/hide damage leads to a reduction in the selling price of cattle. Damage to the carcass
or hide may happen as a result of poor handling of the animal in the production area or during
transportation to the abattoir. Carcass/hide damage has a similar impact to weight loss on the
selling price.
Consideration of time of delivery indicates that producers are obliged to deliver their cattle to
the abattoirs only during working hours. Due to the long distances travelled and poor timing,
this is an inconvenience to producers who are unable to meet the deadlines.
Consideration of place of delivery indicates that producers have to deliver their cattle to a
single point. MeatCo’s Oshakati abattoir is the only slaughterhouse formally recognised by the
NCA as being permitted to serve more than four regions. A producer who is not familiar with
the town of Oshakati may spend several hours searching for the abattoir.
Frequency of cattle sales indicates the number of times that producers are able to bring their
cattle for sale. Faced with a low supply of cattle, MeatCo has devised a strategy to cut
production costs by rationing slaughtering dates. Producers with large numbers of cattle ready
for market find this to be problematic, since the next slaughtering date may be one or two weeks
away. Producers who require an income urgently in order to solve an immediate problem may
find themselves having to wait for the next slaughtering date. However, poor planning on the
part of producers has also been also identified as a factor in this problem.
Number of cattle to market indicates that the number of cattle ready for market may be
considered a transaction cost, especially for producers who arrange trucks to transport their
91
cattle to the abattoir. There is a higher cost involved in repeatedly marketing a small number of
cattle than in marketing a large number of cattle at once.
• Determining the number of factors
The Principle Component Analysis was performed using an NCSS statistical package. The
eigenvalue criteria were used to determine the number of factors to be specified in the factor
analysis. Using the eigenvalue criteria, an eigenvalue of 1 was used as the cut-off value. Three
principle components had eigenvalues greater than 1 and explained 100 % of the variance in all
the respondents’ personal reasons for not using the formal market to sell their cattle. This led to
three factors being specified in the factor analysis.
Knowing the number of factors to be specified in the factor analysis will determine whether it is
worth performing the factor analysis. The factor analysis is discussed below.
• Factor analysis
Varimax rotation was used to determine factor loading, because it is the best and most widely
used orthogonal rotation that requires the factors to remain uncorrelated (Darlington, 2004;
DeCoster, 1998). The factor loadings after Varimax rotation are presented in Table 10. This
means that if a factor has loaded a value of more than ± 0.5 on more than one variable, then
those variables will be grouped in one family group. Weight loss during quarantine period
loaded -0.77 on Factor 1; weight loss during transportation loaded -0.78 on Factor 1; and
carcass/hide damage loaded -0.79 on Factor 1, indicating that all three variables belong to the
Factor 1 family (discounting factors). The rest were also grouped in the same way.
Factor loading represents the degree of correlation between individual variables and a given
factor. Values range from -1 to +1 with a large absolute value indicating a stronger contribution
of a variable to that factor. Within a factor, a positive loading indicates a direct association with
the factor, while a negative loading indicates an inverse association (Ridho et al., 2002).

92
Table 10: Factor loadings and communalities after Varimax rotation Factor 1 Factor 2 Factor 3
Variables Discounting Factors Delivery Aspects Market Features Weight loss during quarantine period -0.7706 -0.1759 -0.0606
Weight loss during transportation -0.7847 -0.0135 0.0486
Carcass/hide damage -0.7980 -0.1103 0.1035 Consideration of time of delivery
-0.0740 -0.9414 -0.0028
Consideration of place of delivery
-0.1811 -0.8906 0.0676
Frequency of cattle sales 0.0295 0.1380 -0.7519 Number of cattle to market
0.0332 -0.0749 -0.7175
The variables weight loss during quarantine period, weight loss during transportation, and
carcass/hide damage scored the highest factor loadings in Factor 1 with an eigenvalue of 1.89,
explaining 39.86 % of the observed variance, as shown in Figure 8. This indicates that these
three variables are grouped in Factor 1. Factor 1 can be explained as features that cause
reduction in the selling price of cattle. Factor 1 is defined “discounting factors”, which
indicates the dissatisfaction of producers in selling their cattle through the formal market.
Producers who have experienced the impact of discounting factors in the selling of their cattle
become discouraged from using the formal market. A producer who has found that weight loss
in his cattle during the quarantine period may have a negative influence on the selling price will
fear that additional weight loss during transportation and carcass/hide damage to the cattle
going to market will further reduce the returns from selling those cattle through the formal
market. The formal market determines price depending on carcass weight, and an animal may
be discounted if it has bruises; therefore, this transaction cost may be an impediment to the
marketing behaviour of cattle producers.
Time of delivery and place of delivery scored the highest factor loadings in Factor 2 and are
hence grouped into Factor 2, which has an eigenvalue of 1.75 and explains 36.91 % of the
observed variance. Cattle producers who consider time of delivery to be an obstacle to the
selling of cattle to the formal market are likely to believe that place of delivery is an additional
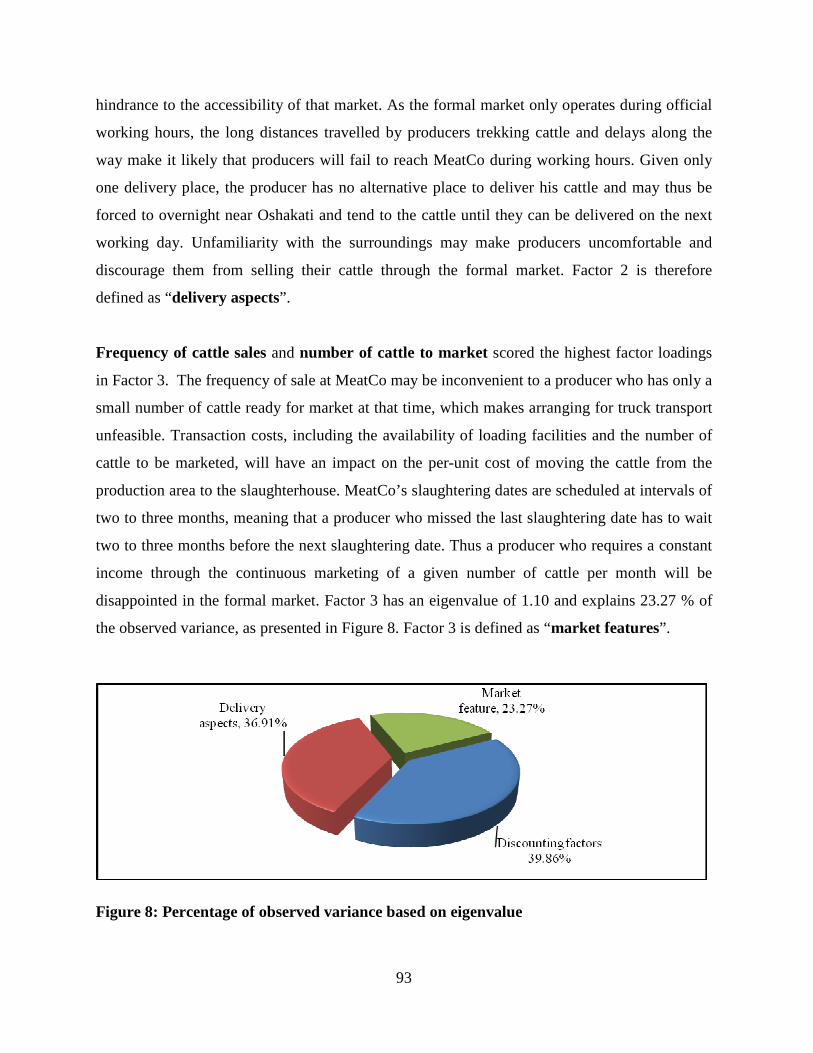
93
hindrance to the accessibility of that market. As the formal market only operates during official
working hours, the long distances travelled by producers trekking cattle and delays along the
way make it likely that producers will fail to reach MeatCo during working hours. Given only
one delivery place, the producer has no alternative place to deliver his cattle and may thus be
forced to overnight near Oshakati and tend to the cattle until they can be delivered on the next
working day. Unfamiliarity with the surroundings may make producers uncomfortable and
discourage them from selling their cattle through the formal market. Factor 2 is therefore
defined as “delivery aspects”.
Frequency of cattle sales and number of cattle to market scored the highest factor loadings
in Factor 3. The frequency of sale at MeatCo may be inconvenient to a producer who has only a
small number of cattle ready for market at that time, which makes arranging for truck transport
unfeasible. Transaction costs, including the availability of loading facilities and the number of
cattle to be marketed, will have an impact on the per-unit cost of moving the cattle from the
production area to the slaughterhouse. MeatCo’s slaughtering dates are scheduled at intervals of
two to three months, meaning that a producer who missed the last slaughtering date has to wait
two to three months before the next slaughtering date. Thus a producer who requires a constant
income through the continuous marketing of a given number of cattle per month will be
disappointed in the formal market. Factor 3 has an eigenvalue of 1.10 and explains 23.27 % of
the observed variance, as presented in Figure 8. Factor 3 is defined as “market features”.
Figure 8: Percentage of observed variance based on eigenvalue
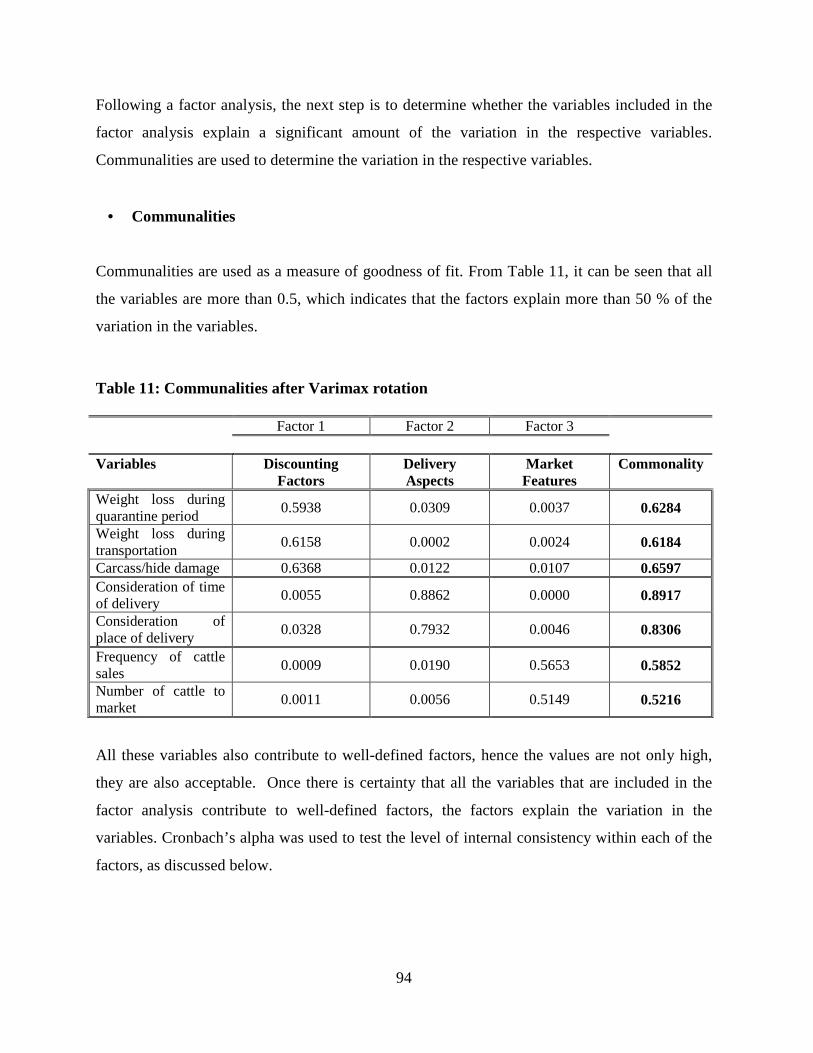
94
Following a factor analysis, the next step is to determine whether the variables included in the
factor analysis explain a significant amount of the variation in the respective variables.
Communalities are used to determine the variation in the respective variables.
• Communalities
Communalities are used as a measure of goodness of fit. From Table 11, it can be seen that all
the variables are more than 0.5, which indicates that the factors explain more than 50 % of the
variation in the variables.
Table 11: Communalities after Varimax rotation Factor 1 Factor 2 Factor 3
Variables Discounting
Factors Delivery Aspects
Market Features
Commonality
Weight loss during quarantine period
0.5938 0.0309 0.0037 0.6284
Weight loss during transportation
0.6158 0.0002 0.0024 0.6184
Carcass/hide damage 0.6368 0.0122 0.0107 0.6597 Consideration of time of delivery
0.0055 0.8862 0.0000 0.8917
Consideration of place of delivery
0.0328 0.7932 0.0046 0.8306
Frequency of cattle sales
0.0009 0.0190 0.5653 0.5852
Number of cattle to market
0.0011 0.0056 0.5149 0.5216
All these variables also contribute to well-defined factors, hence the values are not only high,
they are also acceptable. Once there is certainty that all the variables that are included in the
factor analysis contribute to well-defined factors, the factors explain the variation in the
variables. Cronbach’s alpha was used to test the level of internal consistency within each of the
factors, as discussed below.
95
• Reliability analysis scale alpha
Cronbach’s alpha was used to calculate the overall reliability of internal consistency. Using
PASW Statistics 17 to compute the average covariance between pairs of items and the
average variance of the items, Cronbach’s alpha values were manually calculated using
equation 32. All three factors had a Cronbach’s alpha value greater than 0.7. Factor 1 had a
Cronbach’s alpha value of 0.83, Factor 2 a value of 0.93, and Factor 3 a value of 0.71. This is
an indication that the internal consistency in all three factors is reliable and hence each item
measures the same concept as the overall factor.
• Interpreting factor structure
The variables discussed in the factor analysis section investigated cattle producers’ arguments
and sensitivity in respect of the decision not to sell their cattle through the formal market.
Contemplating these results signifies that producers believe that marketing cattle through the
formal market involves many inconveniences, thus leading to high transaction costs. They
consider carcass/hide damage and weight loss during transportation and quarantine periods as
the main source of low returns on their cattle when sold through the formal market. Due to low
returns perceived to be caused by weight loss and lack of compensation for hides and offal,
producers abstain from using the formal market because they assume that the formal market is
cheating them. Delivery aspects annoy producers who initially intended to market through the
formal market. Lack of co-ordination and poor communication may cause producers to divert
their marketing channel. For instance, let us assume that a producer has trekked his cattle over
a long distance to deliver them to MeatCo on a Friday. If he encounters delays along the way
and is therefore not able to reach his destination before closing time, he will only be attended to
after the weekend. As a result, the producer will be forced to sell his cattle to the only available
market – the informal market. The diversion of marketing channel applies the same scenario as
market features.
These negative perceptions about the formal market contribute to the producers’ decision not to
use the formal market to sell their animals. Therefore it is important for all stakeholders in the

96
meat industry to work together in the effort to change the negative perceptions of producers
towards the use of the formal market. Producers need to make well-informed marketing
decisions that encourage a stable income generation. Thus, producers must be given incentives
to make use of the formal market. A new mechanism is required to illustrate that if the producer
is willing to properly organise his affairs and make careful preparations, he will find it more
beneficial to sell his cattle to the formal market than to the informal market. Brilliant strategies
must be formulated to educate producers in such a way that they will change their perceptions
and be motivated to make use of the formal market. Producers must be informed about the
economic importance of selling through the formal market, as this is a means of directly
entering the economic mainstream. With the right knowledge, producers will be able to make
more informed decisions about the tradeoffs between income and variability in income
associated with production and marketing options.
This concludes the presentation and discussion of the results of the different models used to
achieve the objectives of the study. In this chapter, the Probit Regression Model was used to
determine the factors influencing the cattle producer’s decision of whether or not to sell through
the formal market. The Truncated Model was used to identify factors influencing the proportion
of cattle sold through the formal market. The formal testing of whether it is sufficient to model
the analysis as a one-decision-making model or as a two-decision-making model was done
using Cragg’s Model. An investigation into the underlying structure of factors causing
transaction costs was conducted by performing factor analysis.
The conclusions drawn from this study and the recommendations for further research are
presented in the next chapter.
97
CHAPTER 5
CONCLUSIONS AND RECOMMENDATIONS
5.1 Introduction This chapter provides the conclusions and recommendations of this study, which saw 121 cattle
producers surveyed to determine the effect of transaction costs on the choice of marketing
channel in the North-Central Regions (NCR) of Namibia. This chapter contains the conclusions
drawn on the different factors influencing the cattle producer’s decision of whether or not to sell
through the formal market, as well as the proportion of cattle sold to that market.
Recommendations are made in view of improving the current situation, and possible topics for
further research into the marketing of cattle in the NCR are presented.
5.2 Conclusions on the findings The empirical results shed light on the factors influencing the cattle producer’s decision of
whether or not to sell his/her cattle through the formal market, which was the first secondary
objective of the study. The Probit Model used to analyse this objective identified problems
transporting cattle to MeatCo and market-related information as having a significantly
negative impact on the decision to sell through the formal market. This indicates that transport
problems and lack of access to information are the main sources of transaction costs hindering
full participation of producers in the formal market. The results confirm the first hypothesis of
the study, i.e. “The producer’s decision to sell his cattle through formal channels is
significantly affected by high transaction costs”. Transport problems and lack of access to
information are believed to originate from the production and infrastructural setup in the area.
Many producers surveyed in the study area are constrained in their ability to make proper use of
the marketing system. Lack of grazing land due to demarcation for crop production around the
nearby towns forces cattle producers to separate cattle production from crop production areas.
Cattle production areas (cattle posts) are consequently moved deeper into the forest in the
98
search for good grazing pastures and underground water sources. Cattle posts are difficult to
access by truck due to the poor road network and lack of telecommunication infrastructure.
This study concludes that the provision of Information Technology (IT) would have a positive
influence on the producer’s decision to sell his cattle through the formal market. This indicates
that the effective introduction of livestock technologies must be clearly understood by the
producers if they are to improve feeding and management practices in order to uplift livestock
production and take marketing to another level. The development of feasible technical options
that address producers’ priorities and a participatory extension system responsive to producers’
needs is critical to enhance the knowledge of producers and win their trust so that they are at
least willing to try the new technologies introduced. Producers should be provided with
information about all feasible options and must be allowed to make an informed decision in
adopting the innovations that best suit their farming systems. Such participatory extension
systems must involve producer training, diagnosis of animal problems, planning of optional
measures, and follow-up monitoring and support in partnership with producers.
The stakeholders in the meat industry, with the assistance of the government, are therefore
called upon to intervene and assess the seriousness of the transportation problems that exist. A
specialised agency to disseminate information and thereby keep producers updated could be
introduced within the Directorate of Extension and Engineering Services (DEES) to ease the
flow of information. Producers from the same production area should create marketing
committees to co-ordinate and assist one another in various aspects concerning the production
and marketing of cattle in general.
The second secondary objective was to identify factors influencing the proportion of cattle sold
through the formal market on condition that the producer has decided to make use of that
market. Lack of market experts and IT were identified as significant factors that negatively
influence the proportion of cattle sold through the formal market. This indicates that if some
“important elements” of a marketing system are lacking, it could lead to a lack of quality cattle
supplied to the market. Lack of market experts means that producers are not equipped with
updated information that will allow them to make the correct marketing decisions.
99
Payment arrangements, animal handling and age of the respondent were found to positively
influence the decision on the proportion of cattle to be sold through the formal market. This
indicates that cattle producers are satisfied with MeatCo’s payment arrangements, thus
influencing them to supply a larger percentage of cattle to the formal market. The respondent’s
age was found to positively influencing the proportion of cattle sold through the formal market,
because there is a correlation between age and the number of cattle per herd, suggesting that the
formal market seeks to provide digested information to older cattle producers who are believed
to have larger herds of cattle and thus be able to supply a larger proportion of cattle at a time.
The different factors identified by the Truncated and Probit analyses indicate that different
factors must be considered when opting to influence marketing behaviour, i.e. when producers
are advised to sell their cattle through the formal market, and when they are advised on the
proportion of cattle to be sold through that market.
The results from Cragg’s Model justify the decision to model the analysis as a two-decision-
making framework, as different factors were found to influence the decision of whether or not
to sell through the formal market, as well as the decision on the proportion of cattle to be sold
through that market. By assuming a one-decision-making framework, one runs a risk of failing
to identify factors that influence the discrete and continuous making of decisions. Cragg’s
Model therefore provides clear recommendations on dealing with the two separate decision-
making measures. The estimation of factors influencing the decision of whether or not to sell
through the formal market, and a separate estimation of the factors influencing the decision on
the proportion of cattle to be sold through that market, are useful for policymaking, as the
government or other agency knows which factors to focus on when trying to influence
producers to choose the formal market as their market of choice. Likewise, factors that should
be considered when motivating producers to increase the proportion of cattle sold through the
formal market are also identified.
Factor analysis specified three factors (discounting factor, delivery aspects, and market
features) that are perceived to make up the underlying structure causing transaction costs. This
indicates that if these factors are left unattended, producers will hardly ever change their
100
negative perception of the use of the formal market. Persistence of producers’ negative
perception of the formal market determines the future survival of MeatCo’s Oshakati abattoir.
Therefore, producers with transport problems should be assisted in that regard, while those with
saltwater problems should be assisted with the drilling of boreholes, and those with road
problems should be assisted with the opening up of such road through de-bushing.
To conserve the rangeland currently under pressure due to the increasing number of cattle in the
communal areas, awareness of the importance of carrying capacity and the effects of
overgrazing must be emphasised. Thus a campaign to mobilise producers to market their cattle
must be considered. Awareness of the degradation of the natural pasture and the extinction of
highly palatable and nutritive grass species, which results in the invasion of unpalatable shrub
species in the limited available rangeland, should be carefully planned. The replacement of
palatable grass species with unpalatable species has a direct effect on the reduction of the
biomass of the natural pasture.
Finally, it is emphasised that the development of cattle production on communal land must
focus on equipping producers to efficiently utilise their natural resources so as to produce
livestock that can meet buyers’ standards and thus achieve the objectives and goals of all
stakeholders in the meat industry. In order to facilitate livestock marketing, cattle producers
should be provided with information to enable them to make informed decisions on the
marketing of their cattle.
5.3 Recommendations Considering the results of this study and the conclusions drawn above, the following
recommendations are made:
It is assumed that improving certain factors will remove or reduce the identified transaction
costs and hence stimulate the choice of the formal market in the NCR.
101
• Transportation of cattle to the abattoir
Improving the transportation infrastructure to and from the production areas may go a long way
towards boosting livestock marketing to the benefit of producers and towards poverty reduction.
Transportation costs can be reduced if producers from one production area are well organised
and make use of the same transport to market. By transporting in bulk they stand a better chance
of getting good basic consent of economies of scale compared to transporting as individuals and
in small quantities.
• Strengthening producers’ bargaining power
Efforts are needed to increase cattle producers’ bargaining power and specialisation in cattle
farming. As producers become more specialised in beef cattle production, their bargaining
power will increase when dealing with buyers (Gong et al., 2007). Therefore, producers are
encouraged to work collectively in the procurement of production inputs, managing all shared
grazing land and infrastructure, obtaining all required production- and marketing-related
information, and collectively marketing their livestock.
• Accessibility of IT and market-related information
The movement from traditional farming methods towards sustainable production techniques can
generally be accomplished by the adoption of a combination of new technologies, which result
in benefits such as less deterioration of rangeland pasture, less soil erosion, and lower water
requirements (Dorfman, 1996). Hence, it is important to take a gradual approach to
disseminating new technologies with substantial capacity-building support at field level to
ensure their successful adoption, as well as marketing development and information support,
development of private service providers in essential areas of livestock production, and
marketing for sustainable and effective livestock development.
The diffusion of new and adapted technologies capable of generating technical and financial
incentives is essential. The development of training programmes for producers to assist them in
102
improving their farm management skills, farming efficiency and the correct use and
management of livestock veterinary technologies is hereby recommended. Information
dissemination through producers’ information days, printed media, radio programmes and road
shows should be used to empower producers with knowledge, skills and appropriate techniques
on cattle production and marketing behaviour. Educating cattle producers on the grading system
will reduce transaction costs for some producers who feel cheated because they do not know
how the grading system works.
• Improving the quality and quantity of livestock
Animal improvement programmes that supply good-quality breeding material should be easily
accessible throughout the regions in question. Firstly, livestock research stations must be
established in these regions. Secondly, cattle producers must be invited to participate in the
animal improvement programmes on a voluntary basis to gain knowledge and experience. The
programmes should be encouraging and well-synchronised to ensure equal opportunities for
extensive benefits to all competent and interested cattle producers. Equally important are the
accessibility of general economic and specific market information, promotion of marketing
associations, participatory breeding, and regulation of contract production schemes between
producers and buyers (processors).
• Modification of cattle purchasing strategies
There is an urgent need for the abattoirs to devise alternative strategies to ensure an adequate
market supply of quality live cattle to meet their processing needs in order to improve their
efficiency and competitiveness. Purchasing strategies may be used to gradually induce change
in producer selling behaviour in terms of cattle sold and time and place of sale to suit the needs
of the abattoirs.
A step towards improving the market supply of quality cattle is to understand the livestock
producers’ ownership patterns and marketing behaviour and the factors affecting this. Such
information provides useful insights towards the designing and implementation of strategies to
103
alleviate the shortage of quality cattle in the market. In order to overcome these supply-related
problems, the abattoirs should consider using contracts as an instrument for sustained delivery
of adequate numbers of quality animals throughout the year. It is therefore recommended that
abattoirs contract existing prominent cattle producers and cattle producers’ co-operatives in the
regions in question to deliver certain numbers of animals of a specific quality at specific
intervals at pre-agreed attractive prices. By doing so, overall transaction costs may be reduced,
because the cost of monitoring groups handling larger numbers of animals should be much
lower than the cost of the time and effort required to locate, select and complete the transaction
of only one or two animals from numerous different sellers at several markets.
• Further research
Further research should be done to determine the marginal probability of factors influencing the
marketing behaviour of cattle producers in the NCR. This will ensure that factors with a
significant influence are identified and attended to first. Moreover, this study recommends that a
larger sample size be used in order to improve the reliability of the results and the ability to
generalise the results. Similar studies should be conducted in other regions in order to compare
the marketing behaviour of cattle producers in different regions.
An assessment of the technical factors affecting cattle productivity and production, the
effectiveness of input supply, and credit and marketing support services is required to gain a
comprehensive understanding of the cattle supply and marketing system. Therefore, a study
should be conducted to investigate the cattle supply chain in order to provide information on the
current operation of the chain and identify potential constraints to be alleviated and
opportunities to be utilised.
Should Namibia resume its beef exports to the South African market, with requirements
regarding the quarantining of cattle from the north of Namibia in place, the study suggests that
an alternative system be used to permanently replace the quarantine system. Due to the rapid
spread of foot-and-mouth disease (FMD) and serious economic consequences that can arise
from an outbreak, fast and reliable diagnosis of FMD is essential for effective disease control
104
(Alamdari, Ghorashi, Ahmadi & Salehi-Tabar, 2006). Therefore, one should consider the use of
rapid diagnostic tests for FMD. The use of infrared technology (IRT) is believed to detect
elevated temperatures up to two days before cattle develop clinical signs (Alamdari et al.,
2006). This technique is cheaper, more effective and faster than the existing quarantine system.
It could allow veterinarians to identify potentially infected cattle in large groups, without
examining animals individually. The advantage of this system is that it enables veterinarians to
concentrate their resources by quickly isolating animals that require further testing with a
disease-specific method. This study recommends that a study be done to assess the economic
viability of the use of infrared technology cameras in the Namibian context.
105
References
Acharya, S.S. 2006. Agricultural marketing and rural credit for strengthening Indian agriculture.
INRM Policy Brief No.3. Manila: Asian Development Bank.
Aklilu, J. 2002. An audit of the livestock marketing status in Kenya, Ethiopia and Sudan.
Nairobi: Community-Based Animal Health and Participatory Epidemiology Unit.
Alamdari, M.; Ghorashi, S.A.; Ahmadi, M. & Salehi-Tabar, R. 2006. Detection of foot-and-
mouth disease viruses and identification of serotypes in East Azerbaijan province of Fran.
Veterinarski ARHIV, 76(5): 413- 419.
Aldrich, J. & Cnudde, C.F. 1975. Probing the bounds of conventional wisdom: A comparison of
regression, probit and discrimant analysis. American Journal of Political Science, 19(3): 571-
608.
Alene, A.D.; Manyong, V.M.; Omanya, G.; Mignouna, H.D.; Bokanga, M. & Odhiambo, G.
2007. Smallholder market participation under transactions costs: Maize supply and fertilizer
demand in Kenya. Food Policy, 33(2008): 318-328.
Anastasopoulos, P.C.; Tarko, A.P. & Mannering, F.L. 2008. Tobit analysis of vehicle accident
rates on interstate highways. Accident Analysis and Prevention, 40(2008): 768-775.
Anding, M. & Hess, T. 2002. Online content syndication: A critical analysis from the
perspective of transaction cost theory. Paper presented at the ECIS Conference, held in Gdańsk,
Poland, 6-8 June 2002.
Araki, S. 2005. Change in population and land-use intensities in several villages of four
northern regions of Namibia. Africa Study Monographs, 30: 77-88.
106
Arbirk, M. & Vigne, P. 2002. Quarantine enterprise development in Northern Namibia: Final
report of the Quarantine Enterprise Development Pilot Scheme. Windhoek: Vigne & Associates
Consultants and Danea.
Ayars, M.B. 2003. Impact of transaction costs on Saskatchewan’s beef finishing sector.
Saskatoon: University of Saskatchewan, Department of Agricultural Economics.
Bahta, S.T. & Bauer, S. 2007. Analysis of the determinants of market participation within the
South African small-scale livestock sector: Utilization of diversity in land use systems:
Sustainable and organic approaches to meet human needs. Witzenhausen: Justus-Liebig
University Giessen, Institute of Project and Regional Planning.
Bartle, J.R. 2002. A transaction cost model of state government procurement. Omaha:
University of Nebraska, Department of Public Administration.
Bellemare, M.F. & Barrett, C.B. 2005. An ordered Tobit model of market participation:
Evidence from Kenya and Ethiopia. Ithaca: Cornell University, Department of Applied
Economics and Management.
Bennison, J.J.; Silverside, D. & Barton, D. 1998. Study on the establishment of feedlots in the
Northern Communal Areas of Namibia. Windhoek: Meat Board of Namibia.
Bertschek, I. & Lechner, M. 1998. Convenient estimators for the panel Probit model. Journal
of Econometrics, 87: 329-371.
Botha, R. 2007. Agribusinesses benchmarking survey. PricewaterhouseCoopers
Business Namibia. 2006. Unlocking the country’s economic potential: 2006 Edition.
Windhoek: ADS Publications.
107
Chen, M.; Chang, H.; Huang, C. & Liao, C. 2006. Channel coordination and transaction cost: A
game-theoretic analysis. Industrial Marketing Management, 35(2006): 178-190.
Christian Science Monitor. 2008. Namibia, the land of meat lovers. Available online at
http://www.csmonitor.com /2008/0221/p20s01-woaf.html?page=1-3 (Accessed: 11 April 2008).
Coetzee, L.; Montshwe, B.D. & Jooste, A. 2005. The marketing of livestock on communal lands
in the Eastern Cape Province: Constraints, challenges and implications for the Extension
Services. South African Journal of Agricultural Extension, 34(1): 81-103.
Crase, L. & Dollery, B. 1999. The evaluation of market information from livestock selling
complexes. Australian Journal of Agricultural and Resource Economics, 43(2): 195-208.
Cuthbert, R.H. 2008. Strategic planning: Niche marketing in the agriculture industry.
Edmonton: University of Alberta, Department of Rural Economics.
Darlington, R.B. 2004. Factor analysis. Available online at:
http://comp9.psych.cornell.edu/Darlington/factor.htm (Accessed: 26 October 2009).
Davidson, R. & MacKinnon, J.G. 2004. Econometric theory and methods. New York: Oxford
University Press.
Davies, D.; Eddison, J.; Cullinane, S.; Kirk, J. & Hayne, S. 1998. Is livestock marketing
channel utilization influenced by marketing orientations of beef producers? Plymouth:
University of Plymouth, Faculty of Agriculture, Food and Land Use.
De Bruyn, P.; De Bruyn, J.N.; Vink, N. & Kirsten, J.F. 2001. How transaction costs influence
cattle marketing decisions in the Northern Communal Areas of Namibia. Agrekon, 40(3):405-
425.

108
DeCoster, J. 1998. Overview of factor analysis. Tuscaloosa: University of Alabama, Department
of Psychology.
Dorfman, J.H. 1996. Modelling multiple adoption decisions in a joint framework. American
Journal of Agricultural Economics, 78: 547-557.
Doss, C.; McPeak, J. & Barrett, C.B. 2005. Perceptions of risk within pastoralist households in
Northern Kenya and Southern Ethiopia. New Haven: Yale University.
Dovie, D.B. & Shackleton, C. 2003. Valuation of communal area livestock benefits, rural
livelihoods and related policy issues. Johannesburg: University of the Witwatersrand.
Düvel, G.H. 2001. Livestock marketing in Northern Namibia: Cultural versus economic
incentives. Pretoria: University of Pretoria, South African Institute for Agricultural Extension.
Düvel, G.H. & Stephanus, A.L. 1999. Perceptions of livestock farmers in some districts of the
Northern Communal Areas of Namibia. Pretoria: University of Pretoria: South African Institute
for Agricultural Extension.
Ehui, S.; Benin, S. & Paulos, Z. 2009. Policy options for improving market participation and
sales of smallholder livestock producers: A case study of Ethiopia. Paper presented at the 27th
Conference of the International Association of Agricultural Economists, held in Beijing, China,
16-22 August 2009.
Evans, J.R.; Brown, C.; Collin, A.R.; D’Souza, G.E.; Rayburn, E.B. & Sperow, M. 2008.
Determining consumer perceptions of and willingness to pay for Appalachian grass-fed beef:
An experimental economics approach. Selected paper prepared for presentation at the
American Agricultural Economics Association’s Annual Meeting, held in Orlando, Florida, 27-
29 July 2008.

109
FAO & NEPAD (Food and Agriculture Organization & New Partnership for Africa’s
Development). 2005. Government of the Republic of Namibia: Livestock Improvement.
Midrand: NEPAD.
Fausti, S.W. & Feuz, D.M. 1995. Production uncertainty and factor price disparity in the
slaughter cattle market: Theory and evidence. American Journal for Agricultural Economics,
77: 533-540.
Fenwick, L.J. & Lyne, M.C. 1999. The relative importance of liquidity and other constraints
inhibiting the growth of small-scale farming in KwaZulu-Natal. Development Southern Africa,
16(1): 141-151.
Feuz, D.M.; Fausti, S.W. & Wagner, J.J. 1995. Risk and market participant behaviour in the US
slaughter-cattle market. Journal of Agricultural and Resource Economics, 20(1): 22-31.
Filzmoser, P. 2001. Robust principal component regression. Vienna: Technical University
Vienna, Department of Statistics, Probability Theory, and Actuarial Maths.
Frauendorf, J.; Gnoth, J. & McCole, P. 2005. A transaction cost theory based perspective on
customer service scripts. Dunedin: University of Otago.
Friel, C.M. 2006. Reliability analysis. Huntsville: Sam Houston State University, Criminal
Justice Center.
Gabre-Madhin, E.Z. 2001. Market institutions, transaction costs and social capital in the
Ethiopian grain market. Washington DC: International Food Policy Research Institute.
Gauthier, M. 2000. Transaction costs in applied trade models. Washington DC: United States
Department of Agriculture.
110
Gong, W.; Parton, K.; Cox, R.J. & Zhou, Z. 2007. Transaction costs and cattle producers’
choice of marketing channels in China. Management Research News, 30(1): 47-57.
Greene, W.H. 2008. Econometric analysis. 6th Edition. Upper Saddle River: Pearson Prentice
Hall.
Griffiths, W.E.; Hill, R.C. & Judge, G.G. 1993. Learning and practising econometrics. New
York: John Wiley & Sons, Inc.
Grosh, B. 1994. Contract farming in Africa: An application of the New Institutional Economics.
Journal of African Economies, 3(2): 231-261.
Gu, B. & Hitt, L.M. 2001. Transaction costs and market efficiency. Philadelphia: University of
Pennsylvania, Wharton School.
Gujarati, D.N. 2003. Basic econometrics. 4th Edition. New York: McGraw-Hill.
Hobbs, J.E. 1996. Transaction costs and slaughter cattle procurement: Processors’ selection of
supply channels. Agribusiness, 12(6): 509-523.
Hobbs, J.E. 1997. Measuring the importance of transaction costs in cattle marketing. Journal of
the American Agricultural Economics Association, 79(4): 1083-1095.
Hoffmann, J.A.H. 2009. Namibia Trade Directory 2009: Agriculture trade in Namibia, local,
regional and European markets – A review of Namibian trade and industry (Volume 18).
Windhoek: Namibia Trade Directory.
Horsthemke, O. 2009. Namibia Trade Directory 2009: Agriculture: Unlocking our true
potential: An engine for growth in the Namibian economy – A review of Namibian trade and
industry (Volume 18). Windhoek: Namibia Trade Directory.
111
Hueth, B. & Lawrence, J. 2002. Quality management and information transmission in cattle
markets: A case study of the Chariton Valley Beef Alliance. Iowa City: Iowa State University,
Center for Agricultural and Rural Development (CARD).
Hwang, J.T.G. & Nettleton, D. 2002. Principal Components Regression with Data-Chosen
Components and Related Methods. Ithaca: Cornell University, Department of Mathematics.
IFAD (International Fund for Agricultural Development). 1997. Northern Regions Livestock
Development Project: Reformulation Report, Volume I: Main Report and Annexes. Rome:
IFAD.
Iimi, A. 2007. Infrastructure and trade preferences for the livestock sector: Empirical evidence
from the beef in Africa. Washington DC: World Bank.
Jabbar, M.; Benin, S.; Gabre-Madhin, E. & Paulos, Z. 2006. Trader Behaviour and
Performance in Live Animal Marketing in Rural Ethiopian Markets. Poster paper prepared for
presentation at the International Association of Agricultural Economists Conference, held on the
Gold Coast, Australia, 12-18 August 2006.
Jabbar, M.; Benin, S.; Gabre-Madhin, E. & Paulos, Z. 2008. Market Institutions and Transaction
Costs Influencing Trader Performance in Live Animal Marketing in Rural Ethiopian Markets.
Journal of African Economics, 17(5): 747-764.
Joshi, A.W. & Stump, R.L. 1999. Determinants of commitment and opportunism: Integrating
and extending insights from transaction cost analysis and relational exchange theory. Canadian
Journal of Administrative Science, 16(4): 334-352.
Kamuanga, M.J.B.; Somda, J.; Sanon, Y. & Kagone, H. 2008. Livestock and regional market in
the Sahel and West Africa: Potentials and challenges. Abuja: ECOWAS.

112
Katchova, A.L. & Miranda, M.J. 2004. Two-step econometric estimation of farm characteristics
affecting marketing contract decisions. American Journal of Agricultural Economics, 86(1):
88-102.
Katja, W. 2002. Hierarchy amidst Anarchy: Transaction costs and institutional choice. New
York: State University of New York Press.
Kirsten, J.F. 2002. Livestock marketing in the Northern Communal Areas of Namibia (livestock
producer marketing strategies and informal trade in live animals, meat, hides and skin).
Windhoek: NOLIDEP.
Klein, S. 1989. A Transaction Cost Explanation of Vertical Control in International Markets.
Journal of the Academy of Marketing Science, 17(3): 253-260.
Kruger, B. & Lammerts-Imbuwa, L. 2008. Livestock Marketing in Namibia. Windhoek:
Namibia National Farmers’ Union.
Kumar, A.; Staals, S.; Elumalai, K. & Singh, D.K. 2007. Livestock Sector in North-Eastern
Region of India: An Appraisal of Performance. Agricultural Economics Research Review,
20(July-December): 255-272.
Lapar, M.L.; Holloway, G. & Ehui, S. 2003. Policy options promoting market participation
among smallholder livestock producers: A case study from the Philippines. Food Policy, 28:
187–211.
Laubscher, K.; Spies, D.C.; Rich, K.; Taljaard, P.R.; Jooste, A.; Hoffman, L.; Baker, D.
& Bonnet, P. 2009. Value Adding Information Management System developed for livestock in
SADC countries. Unpublished research report, Gaborone, Botswana.
113
Lawrence, J.D. 2002. Quality assurance “down under”: Market access and product
differentiation. Iowa City: Iowa State University, Midwest Agribusiness Trade Research and
Information Center.
Ledesma, R.D. & Valero-Mora, P. 2007. Determining the number of factors to retain in EFA:
An easy-to-use computer program for carrying out parallel analysis. Practical Assessment,
Research and Evaluation, 12(2). Available online at: http://www.pareonline.net.
Li, G.G. 2008. Economic sense of Metcalfe’s law. Southampton: University of Southampton.
Lin, T. & Schmidt, P. 1983. A test of the Tobit specification against an alternative suggested by
Cragg. Cincinnati: University of Cincinnati.
MacInnis, B. 2004. Transaction Costs and Organic Marketing: Evidence from US Organic
Produce Producers. Berkeley: University of California, Department of Agricultural and
Resource Economics.
Maddala, G.S. 2001. Introduction to econometrics. 3rd Edition. London: John Wiley & Sons,
Ltd.
Madola, M. 2008. Analysis of Alternative Impact Market Institutions on Smallholder
Agriculture in Malawi: Implications for Pro-Poor Growth: The Case of Cotton and Paprika.
London: University of Greenwich.
Magingxa, L.L.; Alemu, Z.G. & Van Schalkwyk, H.D. 2006. Factors influencing the success
potential in smallholder irrigation projects of South Africa: A principal component regression.
Bloemfontein: University of the Free State, Department of Agricultural Economics.
Mahmood, K. & Cheema, M.A. 2004. Determinants and Maximum Likelihood Functions of
Juvenile Crime in Punjab, Pakistan. International Journal of Agriculture and Biology, 6(5):
918-921.

114
Malhotra, N.K. 1983. A comparison of the predictive validity of procedures for analyzing
binary data. Journal of Business and Economics Statistics, 1(4): 326-336.
Mapiye, C.; Chimonyo, M.; Dzama, K.; Raats, J.G. & Mapekula, M. 2009. Opportunities for
improving Nguni cattle production in the smallholder farming systems of South Africa.
Livestock Science, 124: 196–204.
Matungul, P.M.; Lyne, M.C. & Ortmann, G.F. 2001. Transaction costs and crop marketing in
the communal areas of Impendle and Swayimana, KwaZulu-Natal. Development Southern
Africa, 18(3): 347-363.
MAWF (Ministry of Agriculture and Water Affairs). 2006. Proceedings of a Livestock
Marketing Conference held in Ongwediva, Namibia, 1-2 March 2006. Windhoek: Directorate of
Forestry.
MAWF (Ministry of Agriculture and Water Affairs). 2008. Agricultural Statistics Bulletin.
Windhoek: Directorate of Planning.
MAWF (Ministry of Agriculture, Water & Forestry). 2009. Foot-and-Mouth Disease and Other
Transboundary Animal Diseases in Namibia. Windhoek: Directorate of Veterinary Services.
MAWRD (Ministry of Agriculture, Water & Rural Development). 2004. Northern Namibia
farming communities inter-stakeholder consultative forum. Report No. 0410001, Vol. 1: 25-29.
Windhoek: MAWRD.
Meat Board of Namibia. 2008. Statistics: Marketing of total production of livestock 2008.
Windhoek: Meat Board of Namibia.
MeatCo. 2009. MeatCo – Meat Corporation of Namibia: Home page. Available online at:
www.meatco.com.na (Accessed: 25 March 2009).
115
Mendelsohn, J.; Obeid, S. & Roberts, C. 2000. A profile of north-central Namibia: Gamsberg:
Macmillan Publishers.
Ministry of Lands and Resettlement. 2004/2005. Annual Report. Windhoek: Ministry of Lands
and Resettlement.
Montshwe, B.D. 2006. sFactor affecting participation in mainstream cattle markets by small
scale producers in South Africa. Bloemfontein: University of the Free State, Department of
Agricultural Economics.
Morgan, N. & Tallard, G. 2006. Competitive Commercial Agriculture in Sub-Saharan Africa
(CCAA) study: Cattle and Beef International Commodity Profile. Rome: FAO, Markets and
Trade Division.
Musemwa, L.; Chagwiza, C.; Sikuka, W.; Fraser, G.; Chimonyo, M. & Mzileniet, N. 2007.
Analysis of cattle marketing channels used by small scale producers in the Eastern Cape
Province, South Africa. Alice: University of Fort Hare, Department of Agricultural Economics
and Extension.
Musemwa, L.; Mushunje, A.; Chimonyo, M.; Frazer, G.; Mapiye, C. & Muchenje, V. 2008.
Nguni cattle marketing constraints and opportunities in the communal areas of South Africa:
Review. African Journal of Agricultural Research, 3(4): 239-245.
Mushendami, P.; Biwa, B. & Gaomab, I.I.M. 2006. Unleashing the potential of the agriculture
sector in Namibia. Windhoek: Bank of Namibia, Research Department.
Nambundunga-Xulu, B.I.T.; Shikongo-Kuvare, L.T. & Masaire, E. 2008. Improvement of
slaughter data collection and hygiene standards in informal meat markets of Namibia’s
communal area (NCA) North of the Veterinary Cordon Fence (VCF). Windhoek: Meat Board of
Namibia.

116
Namibia Tourism Board. 2006. Welcome to Namibia: Official Visitor’s Guide 2006:
Windhoek: Solitaire Press (Pty) Ltd.
NASSP (National Agricultural Support Services Programme). 2005. Onyuulaye Auction final
report: 30th April and 1st May 2005. Project No. 8 ACP NAM 023. Windhoek: NASSP.
Negassa, A. & Jabbar, M. 2007. Commercial offtake of cattle under smallholder mixed crop-
livestock production system in Ethiopia, its determinants and implications for improving live
animal supply for export abattoirs. Kalamazoo: Western Michigan University.
NERPO (National Emergent Red Meat Producers’ Organisation). 2009. Bringing emerging
producers into the mainstream of agricultural economy: What are the important interventions?
Windhoek: NERPO.
Nevil, T. 2004. Adding taste to beef. African Business, July/August 2004. Available online at:
http://findarticles.com/p/articles/mi_qa5327/is_199907/ai_n21441499
Nicholas, S. 1987. Emperical Tests of the Transaction Cost Model: The Evolution of the Pre-
1939 British Manufacturing Multinational. Business and Economic History, Second Series,
16(87-72645): 133-145.
Nkhori, P.A. 2004. The impact of transaction costs on the choice of cattle markets in
Mahalapye district, Botswana. Pretoria: University of Pretoria, Department of Agricultural
Economics, Extension and Rural Development.
Nkonde, A. 2007. Overview of food security status in SADC region: Regional workshop on
agricultural trade policy. Lusaka: Biodiversity Community Network.
NOLIDEP (Northern Regions’ Livestock Development Project). 2002. Second northern regions
livestock development projects: August 2002. Windhoek: Project Support Services.

117
Orskov, E.R. 1993. Reality in rural development aid, with emphasis on livestock. London:
Rowett Research Services Ltd.
Ouseb, I. 2006. An investigation into the implementation of the FANMEAT Scheme among the
Grootberg area Communal Producers of North Western Namibia. Bloemfontein: University of
the Free State.
Peracchi, F. 1987. Robust estimation of engel curve with censored data. Berkeley: University
of California.
Pingali, P.; Khwaja, Y. & Meijer, M. 2005. Commercializing Small Farms: Reducing
Transaction Costs. Rome: FAO.
Ramanathan, R. 1995. Introductory econometric with applications. Fort Worth: Dryden Press.
Rich, K.M.; Baker, D.; Negassa, A. & Ross, R.B. 2009. Concepts, applications, and extensions
of value chain analysis to livestock systems in developing countries. Contributed Paper prepared
for presentation at the International Association of Agricultural Economists’ Conference, held
in Beijing, China, 16-22 August 2009.
Ridho, M.; Setyono, J.S.; Li, Q. & Sumi, T. 2002. Application of factor analysis to identify
resource characteristics in rural are of Indonesia. Proceedings of Infrastructure Planning, 26:
135.
Riley, J.M.; Schroeder, T.C.; Wheeler, T.L.; Shackelford, S.D. & Koohmaraie, M. 2009.
Valuing fed cattle using objective tenderness measures. Journal of Agricultural and Applied
Economics, 41(1): 163-173.
SARD (Sustainable Agriculture and Rural Development). 2007. SARD and Livestock: Policy
Brief 17. 2007. Rome: FAO.
118
Sartorius von Bach, H.J. 1990. Supply Response in the Namibian Beef Industry. Pretoria:
University of Pretoria, Department of Agricultural Economics, Extension and Rural
Development.
Sartorius von Bach, H.J.; Van Renen, E. & Kirsten, J.F. 1998. Supply response, demand and
stocks for Southern African beef. Pretoria: University of Pretoria, Department of Agricultural
Economics, Extension and Rural Development.
Singh, N. 2004. Transaction Costs, Information Technology and Development. Santa Cruz:
University of California, Center For International Economics.
Suppadit, T.; Phumkokrak, N. & Poungsuk, P. 2006. Adoption of good agricultural practices for
beef cattle farming of beef cattle-raising producers in Tambon Hindard, Dan Khunthod district,
Nakhon Ratchasima Province, Thailand. KMITL Sci. Tech. Journal, 6(2): 67-73.
Sweet, J. 1998. Livestock Coping with Drought: Namibia Case Study. Tsumeb: Northern
Regions Livestock Development Project.
Sweet, J. & Burke, A. 2006. Namibia pasture/Forage resource profile. Rome: FAO.
Tapscott, C. 1990. The Social Economy of Livestock Production in the Ovambo Region.
Windhoek: Namibia Institute for Social and Economic Research.
Tronstad, R. 1994. Comparison of Livestock Marketing Alternatives. Rochester: National Farm
and Ranch Business Management Education Association.
Upton, M. & Otter, J. 2004. Pro-poor livestock policies: Which poor to target. Reading:
University of Reading.
Vakis, R.; Sadoulet, E. & De Janvry, A. 2003. Measuring Transactions Costs from Observed
Behaviour: Market Choices in Peru. Berkeley: University of California.

119
Walter, C.D. & Boeckenstedt, R. 2007. Transaction Cost Case Studies for Six Iowa Food
Producers. Iowa City: Iowa State University.
World Bank. 2007. Agriculture for Development: World Development Report. Washington DC:
World Bank.
Zereyesus, Y.A. 2003. Chain Management and Marketing Performance of the Banana Industry
in Eritrea. Bloemfontein: University of the Free State, Department of Agricultural Economics.
Zhang, F.; Huang, C.L. & Lin, B. 2006. Modeling fresh organic produce consumption: A
generalized double-hurdle model approach. Paper presented at the annual meeting of the
Southern Agricultural Economics Association, held in Orlando, Florida, 5-8 February 2006.

Appendix A
Transaction costs and cattle farmers’ choice of marketing channel
in North-Central Namibia
The information revealed in this questionnaire will be treated with the highest order of confidentiality.
Thank you sincerely for your honest responses
Instruction: Fill in or tick (√) where applicable
Region:………………………………………...
Constituency:…………………………………..
Date: / / /2009
Time Started: / / /H/ / /
Time ended: / / /H/ / /
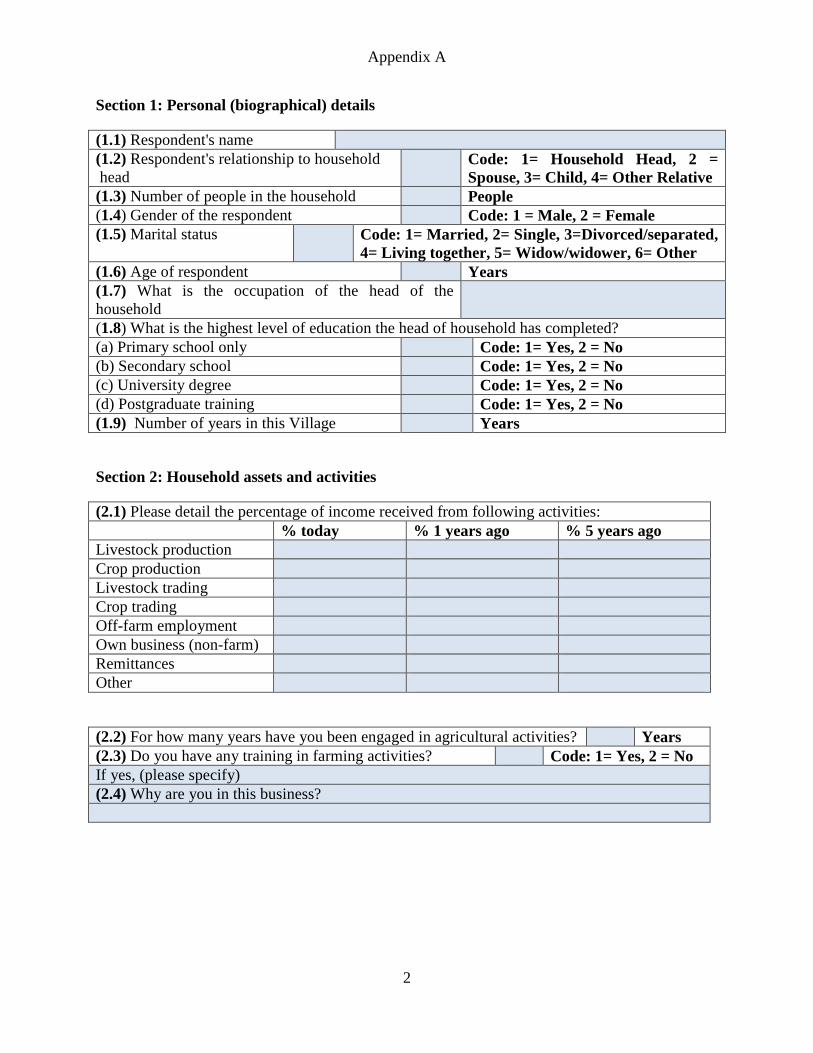
Appendix A
2
Section 1: Personal (biographical) details
(1.1) Respondent's name (1.2) Respondent's relationship to household head
Code: 1= Household Head, 2 = Spouse, 3= Child, 4= Other Relative
(1.3) Number of people in the household People (1.4) Gender of the respondent Code: 1 = Male, 2 = Female (1.5) Marital status Code: 1= Married, 2= Single, 3=Divorced/separated,
4= Living together, 5= Widow/widower, 6= Other (1.6) Age of respondent Years (1.7) What is the occupation of the head of the household
(1.8) What is the highest level of education the head of household has completed? (a) Primary school only Code: 1= Yes, 2 = No (b) Secondary school Code: 1= Yes, 2 = No (c) University degree Code: 1= Yes, 2 = No (d) Postgraduate training Code: 1= Yes, 2 = No (1.9) Number of years in this Village Years
Section 2: Household assets and activities
(2.1) Please detail the percentage of income received from following activities: % today % 1 years ago % 5 years ago Livestock production Crop production Livestock trading Crop trading Off-farm employment Own business (non-farm) Remittances Other
(2.2) For how many years have you been engaged in agricultural activities? Years (2.3) Do you have any training in farming activities? Code: 1= Yes, 2 = No If yes, (please specify) (2.4) Why are you in this business?
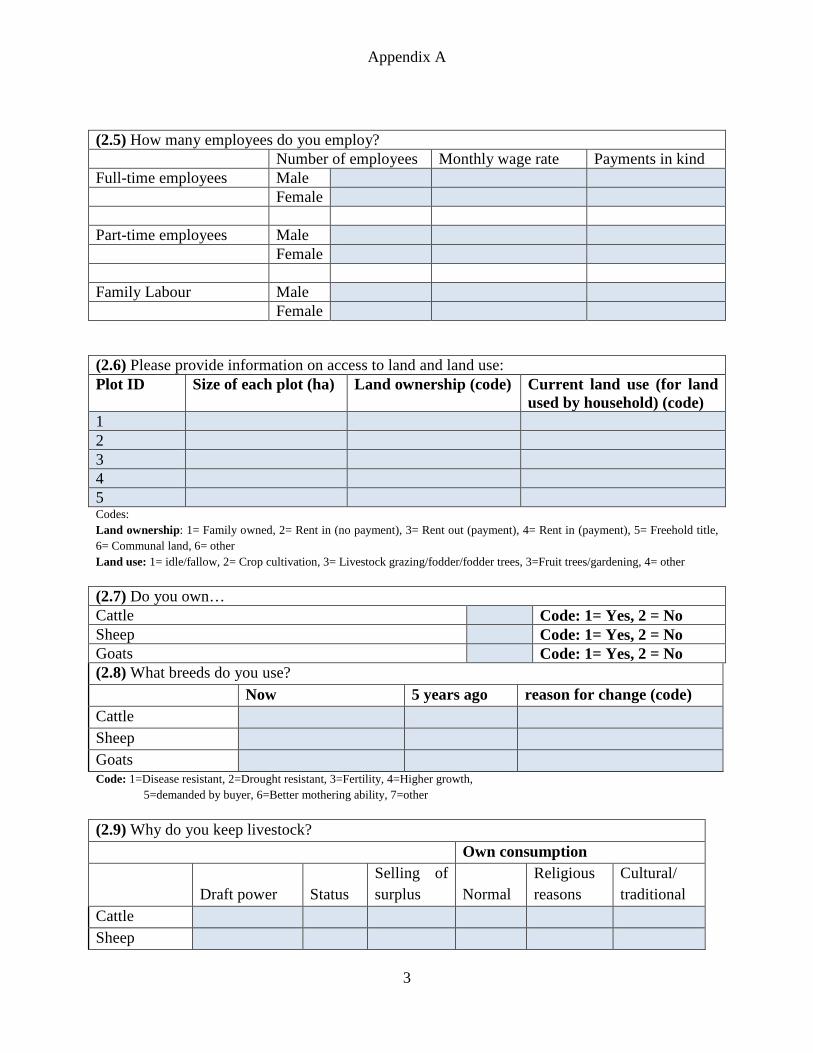
Appendix A
3
(2.5) How many employees do you employ? Number of employees Monthly wage rate Payments in kind Full-time employees Male Female Part-time employees Male Female Family Labour Male Female
(2.6) Please provide information on access to land and land use: Plot ID Size of each plot (ha) Land ownership (code) Current land use (for land
used by household) (code) 1 2 3 4 5 Codes: Land ownership: 1= Family owned, 2= Rent in (no payment), 3= Rent out (payment), 4= Rent in (payment), 5= Freehold title, 6= Communal land, 6= other Land use: 1= idle/fallow, 2= Crop cultivation, 3= Livestock grazing/fodder/fodder trees, 3=Fruit trees/gardening, 4= other
(2.7) Do you own… Cattle Code: 1= Yes, 2 = No Sheep Code: 1= Yes, 2 = No Goats Code: 1= Yes, 2 = No (2.8) What breeds do you use? Now 5 years ago reason for change (code) Cattle Sheep Goats Code: 1=Disease resistant, 2=Drought resistant, 3=Fertility, 4=Higher growth,
5=demanded by buyer, 6=Better mothering ability, 7=other
(2.9) Why do you keep livestock? Own consumption
Draft power Status Selling of surplus Normal
Religious reasons
Cultural/ traditional
Cattle Sheep
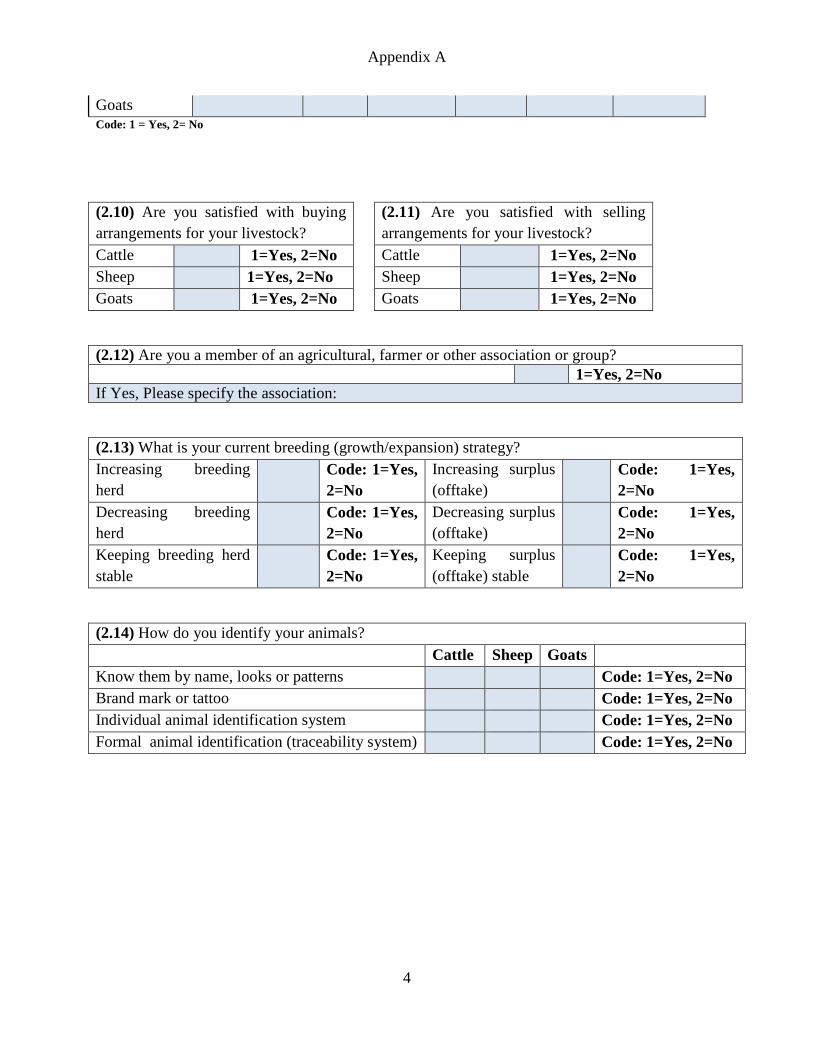
Appendix A
4
Goats Code: 1 = Yes, 2= No
(2.10) Are you satisfied with buying arrangements for your livestock?
(2.11) Are you satisfied with selling arrangements for your livestock?
Cattle 1=Yes, 2=No Cattle 1=Yes, 2=No Sheep 1=Yes, 2=No Sheep 1=Yes, 2=No Goats 1=Yes, 2=No Goats 1=Yes, 2=No
(2.12) Are you a member of an agricultural, farmer or other association or group? 1=Yes, 2=No If Yes, Please specify the association:
(2.13) What is your current breeding (growth/expansion) strategy? Increasing breeding herd
Code: 1=Yes, 2=No
Increasing surplus (offtake)
Code: 1=Yes, 2=No
Decreasing breeding herd
Code: 1=Yes, 2=No
Decreasing surplus (offtake)
Code: 1=Yes, 2=No
Keeping breeding herd stable
Code: 1=Yes, 2=No
Keeping surplus (offtake) stable
Code: 1=Yes, 2=No
(2.14) How do you identify your animals? Cattle Sheep Goats
Know them by name, looks or patterns Code: 1=Yes, 2=No Brand mark or tattoo Code: 1=Yes, 2=No Individual animal identification system Code: 1=Yes, 2=No Formal animal identification (traceability system) Code: 1=Yes, 2=No
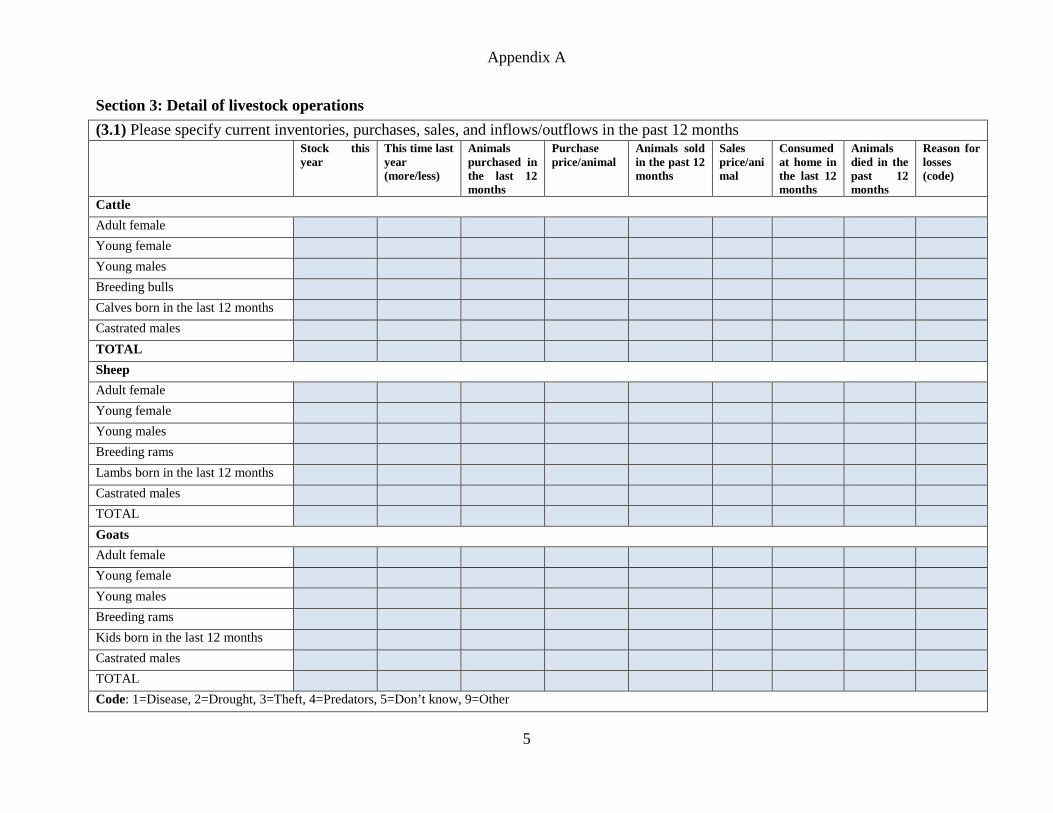
Appendix A
5
Section 3: Detail of livestock operations
(3.1) Please specify current inventories, purchases, sales, and inflows/outflows in the past 12 months Stock this
year This time last year (more/less)
Animals purchased in the last 12 months
Purchase price/animal
Animals sold in the past 12 months
Sales price/animal
Consumed at home in the last 12 months
Animals died in the past 12 months
Reason for losses (code)
Cattle
Adult female
Young female
Young males
Breeding bulls
Calves born in the last 12 months
Castrated males
TOTAL
Sheep
Adult female
Young female
Young males
Breeding rams
Lambs born in the last 12 months
Castrated males
TOTAL
Goats
Adult female
Young female
Young males
Breeding rams
Kids born in the last 12 months
Castrated males
TOTAL
Code: 1=Disease, 2=Drought, 3=Theft, 4=Predators, 5=Don’t know, 9=Other
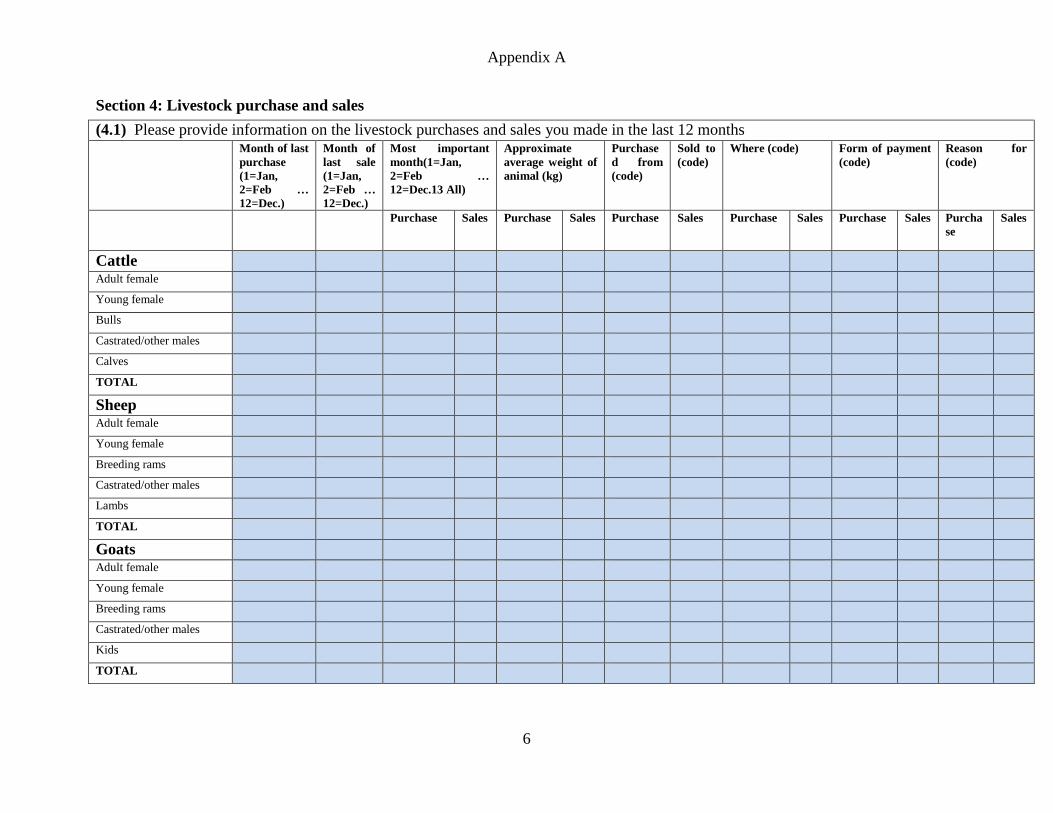
Appendix A
6
Section 4: Livestock purchase and sales
(4.1) Please provide information on the livestock purchases and sales you made in the last 12 months Month of last
purchase (1=Jan, 2=Feb … 12=Dec.)
Month of last sale (1=Jan, 2=Feb … 12=Dec.)
Most important month(1=Jan, 2=Feb … 12=Dec.13 All)
Approximate average weight of animal (kg)
Purchased from (code)
Sold to (code)
Where (code) Form of payment (code)
Reason for (code)
Purchase Sales Purchase Sales Purchase Sales Purchase Sales Purchase Sales Purchase
Sales
Cattle
Adult female
Young female
Bulls
Castrated/other males
Calves
TOTAL
Sheep
Adult female
Young female
Breeding rams
Castrated/other males
Lambs
TOTAL
Goats
Adult female
Young female
Breeding rams
Castrated/other males
Kids
TOTAL

Appendix A
7
Code: Purchased from whom: 1 = Smalholder farm, 2= Commercial farm, 3= Government farm, 4= Auction yard, 5= Village market, 6= Town/city market, 7 = others
Where sold: 1 = Smallholder farm, 2 = Village market, 3 = Local collection point, 4 =Informal slaughter facility, 5 =Oshakati abattoirs, 6 = Broker/trader, 7= Butchery, 8= Retailer, 9= Final consumer (live animals), 10= Final consumer (slaughtered animals), 11= others Sold to whom: 1 = Other small-holders, 2 = MeatCo (Abattoirs), 3 = Informal slaughter market, 4 = Butchers, 5 = Others
Where purchased: 1=Farm gate, 2=Village market, 3=Parallel local sales pen,4=Local collection point, 5=Local business centre, 6= Local dip tank, 7= Regional auction yard, 8= Regional town, 9= Other
Form of payments: 1 = Contract, 2 = Spot cash payment, 3 = Loan, 4 = Exchange, 5 = Others
Reason for purchase: 1= Replace animal that died, 2= Increase herd size, 3=Breed improvement, 4= Resale before fattening, 5= Resale after fattening, 6= other
Reason for sale = 1 = Household expenses, 2 = Business, 3 = Culling, 4 = Social obligation,5=others
(4.2) Where do you obtain price information from? Purchases Sales
Cattle Sheep Goats Code: 1=Cell phone, 2=buyer/trader, 3=e-mail, 4=Announced by government, 5=Newspaper, 6=Radio, 7=TV, 8=Extension officer 9=Third party, 10=word of mouth
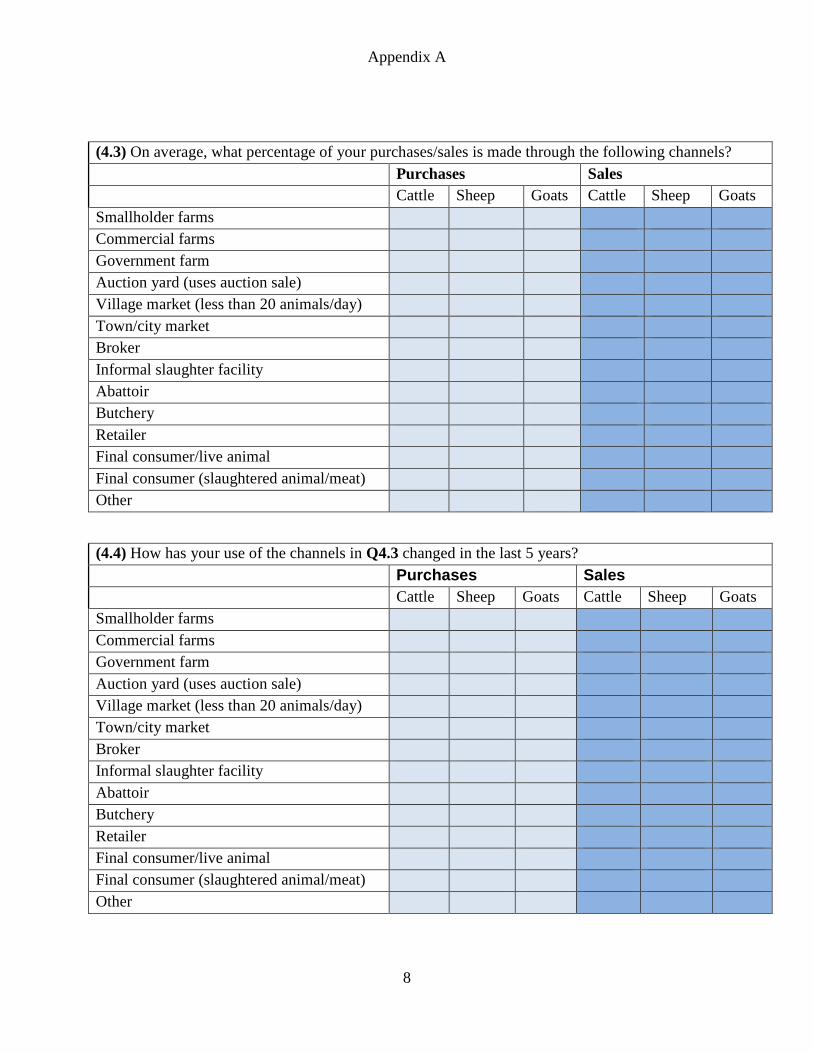
Appendix A
8
(4.3) On average, what percentage of your purchases/sales is made through the following channels? Purchases Sales Cattle Sheep Goats Cattle Sheep Goats Smallholder farms Commercial farms Government farm Auction yard (uses auction sale) Village market (less than 20 animals/day) Town/city market Broker Informal slaughter facility Abattoir Butchery Retailer Final consumer/live animal Final consumer (slaughtered animal/meat) Other
(4.4) How has your use of the channels in Q4.3 changed in the last 5 years?
Purchases Sales Cattle Sheep Goats Cattle Sheep Goats Smallholder farms Commercial farms Government farm Auction yard (uses auction sale) Village market (less than 20 animals/day) Town/city market Broker Informal slaughter facility Abattoir Butchery Retailer Final consumer/live animal Final consumer (slaughtered animal/meat) Other
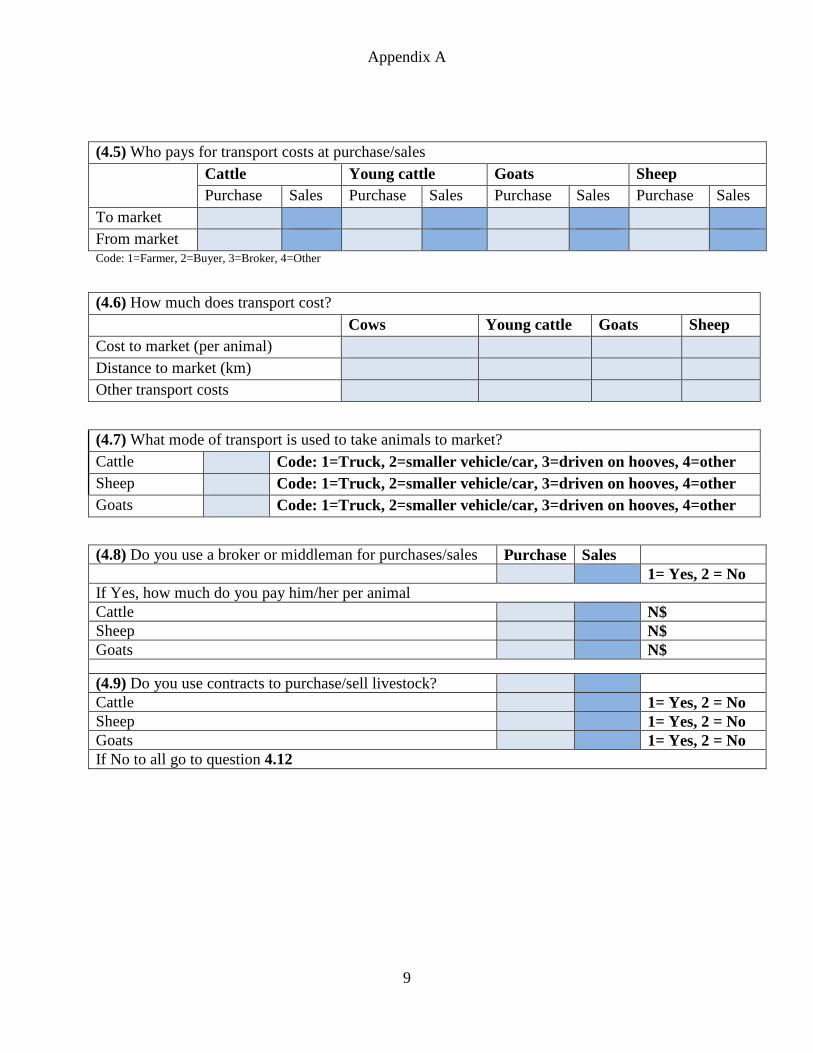
Appendix A
9
(4.5) Who pays for transport costs at purchase/sales Cattle Young cattle Goats Sheep Purchase Sales Purchase Sales Purchase Sales Purchase Sales To market From market Code: 1=Farmer, 2=Buyer, 3=Broker, 4=Other
(4.6) How much does transport cost?
Cows Young cattle Goats Sheep Cost to market (per animal) Distance to market (km) Other transport costs
(4.7) What mode of transport is used to take animals to market? Cattle Code: 1=Truck, 2=smaller vehicle/car, 3=driven on hooves, 4=other Sheep Code: 1=Truck, 2=smaller vehicle/car, 3=driven on hooves, 4=other Goats Code: 1=Truck, 2=smaller vehicle/car, 3=driven on hooves, 4=other
(4.8) Do you use a broker or middleman for purchases/sales Purchase Sales 1= Yes, 2 = No If Yes, how much do you pay him/her per animal Cattle N$ Sheep N$ Goats N$
(4.9) Do you use contracts to purchase/sell livestock?
Cattle 1= Yes, 2 = No Sheep 1= Yes, 2 = No Goats 1= Yes, 2 = No If No to all go to question 4.12

Appendix A
10
(4.10) If contracts are used, do they specify: Purchase Sales age 1=Yes, 2=No 1=Yes, 2=No sex 1=Yes, 2=No 1=Yes, 2=No breed 1=Yes, 2=No 1=Yes, 2=No weight (measured) 1=Yes, 2=No 1=Yes, 2=No weight (apparent) 1=Yes, 2=No 1=Yes, 2=No condition of animal 1=Yes, 2=No 1=Yes, 2=No free of disease 1=Yes, 2=No 1=Yes, 2=No specified use of feed or medicine 1=Yes, 2=No 1=Yes, 2=No pelt condition 1=Yes, 2=No 1=Yes, 2=No pelt colour 1=Yes, 2=No 1=Yes, 2=No time of delivery 1=Yes, 2=No 1=Yes, 2=No place of delivery 1=Yes, 2=No 1=Yes, 2=No advance payment 1=Yes, 2=No 1=Yes, 2=No
(4.11) If contracts are used, what proportion of purchases/sales is made with them?
Purchase Sales
Cattle Sheep Goats Code: 1=0-25% 2=25%-50%, 3=50-75%, 4=75%-99%, 5=All purchases
(4. 12)Rate the quality attributes buyers look for:
Age 1=never, 2=sometimes, 3=always Sex 1=never, 2=sometimes, 3=always Breed 1=never, 2=sometimes, 3=always Weight (measured) 1=never, 2=sometimes, 3=always Weight (apparent) 1=never, 2=sometimes, 3=always Condition of animal 1=never, 2=sometimes, 3=always Free of disease 1=never, 2=sometimes, 3=always Specified use of feed or medicine 1=never, 2=sometimes, 3=always Pelt condition 1=never, 2=sometimes, 3=always Pelt colour 1=never, 2=sometimes, 3=always Time of delivery 1=never, 2=sometimes, 3=always Place of delivery 1=never, 2=sometimes, 3=always Advance payment 1=never, 2=sometimes, 3=always
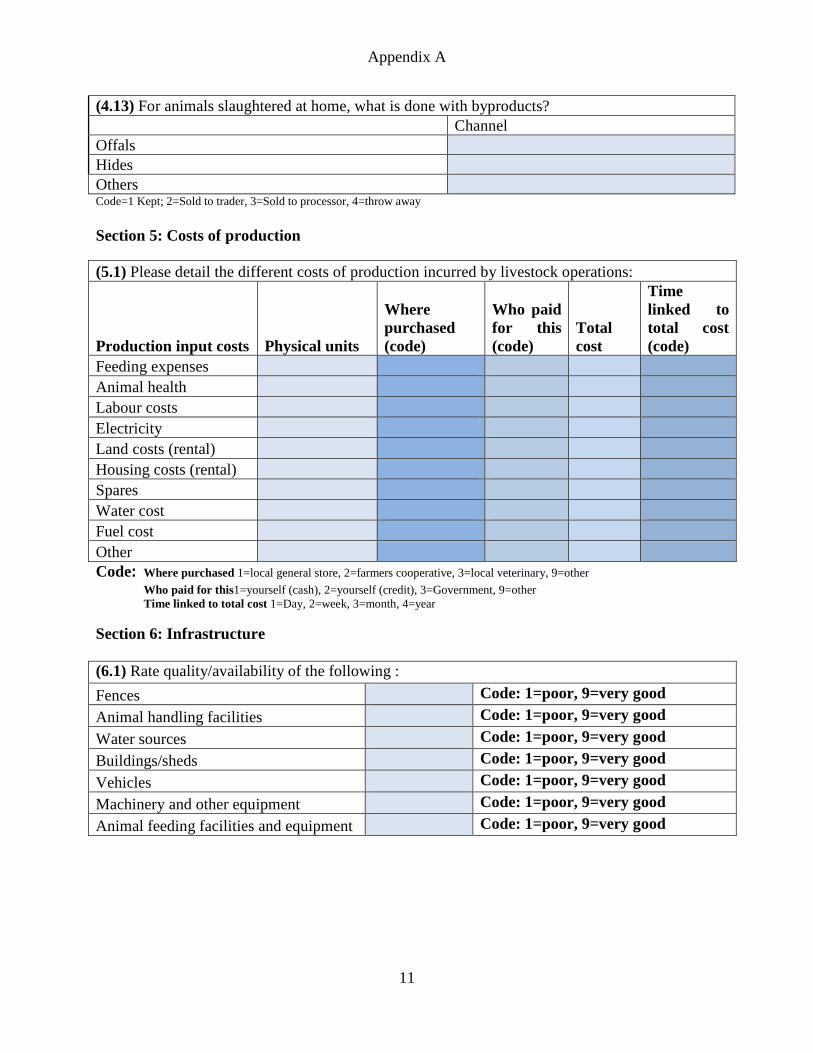
Appendix A
11
(4.13) For animals slaughtered at home, what is done with byproducts? Channel Offals Hides Others Code=1 Kept; 2=Sold to trader, 3=Sold to processor, 4=throw away
Section 5: Costs of production
(5.1) Please detail the different costs of production incurred by livestock operations:
Production input costs Physical units
Where purchased (code)
Who paid for this (code)
Total cost
Time linked to total cost (code)
Feeding expenses Animal health Labour costs Electricity Land costs (rental) Housing costs (rental) Spares Water cost Fuel cost Other Code: Where purchased 1=local general store, 2=farmers cooperative, 3=local veterinary, 9=other
Who paid for this1=yourself (cash), 2=yourself (credit), 3=Government, 9=other Time linked to total cost 1=Day, 2=week, 3=month, 4=year
Section 6: Infrastructure (6.1) Rate quality/availability of the following :
Fences Code: 1=poor, 9=very good
Animal handling facilities Code: 1=poor, 9=very good
Water sources Code: 1=poor, 9=very good
Buildings/sheds Code: 1=poor, 9=very good
Vehicles Code: 1=poor, 9=very good
Machinery and other equipment Code: 1=poor, 9=very good
Animal feeding facilities and equipment Code: 1=poor, 9=very good
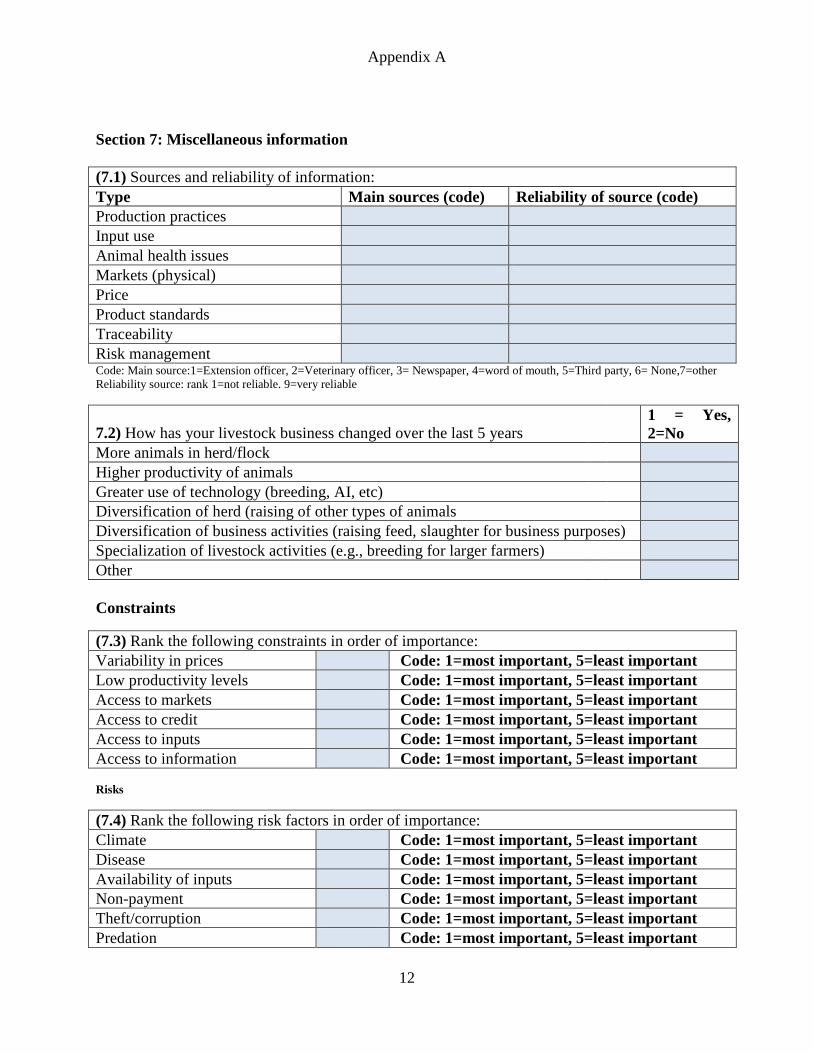
Appendix A
12
Section 7: Miscellaneous information (7.1) Sources and reliability of information: Type Main sources (code) Reliability of source (code) Production practices Input use Animal health issues Markets (physical) Price Product standards Traceability Risk management Code: Main source:1=Extension officer, 2=Veterinary officer, 3= Newspaper, 4=word of mouth, 5=Third party, 6= None,7=other Reliability source: rank 1=not reliable. 9=very reliable
7.2) How has your livestock business changed over the last 5 years 1 = Yes, 2=No
More animals in herd/flock Higher productivity of animals Greater use of technology (breeding, AI, etc) Diversification of herd (raising of other types of animals Diversification of business activities (raising feed, slaughter for business purposes) Specialization of livestock activities (e.g., breeding for larger farmers) Other Constraints
(7.3) Rank the following constraints in order of importance: Variability in prices Code: 1=most important, 5=least important Low productivity levels Code: 1=most important, 5=least important Access to markets Code: 1=most important, 5=least important Access to credit Code: 1=most important, 5=least important Access to inputs Code: 1=most important, 5=least important Access to information Code: 1=most important, 5=least important Risks
(7.4) Rank the following risk factors in order of importance: Climate Code: 1=most important, 5=least important Disease Code: 1=most important, 5=least important Availability of inputs Code: 1=most important, 5=least important Non-payment Code: 1=most important, 5=least important Theft/corruption Code: 1=most important, 5=least important Predation Code: 1=most important, 5=least important

Appendix A
13
Preferred market
(7.5) What is your preferred marketing channel regarding the marketing of cattle? (a) MeatCo Code: 1= Yes, 2 = No (b) Informal market Code: 1= Yes, 2 = No (c) Sell to other farmers Code: 1= Yes, 2 = No (d) Self slaughtering and sell meat Code: 1= Yes, 2 = No (e) Others (please specify)
(7.6) Why do you prefer that marketing channel chosen in the previous question (Q 7.5)? (a) Better price Code: 1= Yes, 2 = No (b) Easy to access Code: 1= Yes, 2 = No (c) Can sell many cattle at once Code: 1= Yes, 2 = No (d) Others (please specify)
Information Cost
(7.7) How do you rate the marketing of cattle in this area regarding: (a) Frequency of sale Code:1= Very poor,5= Very good (b) Quantity of cattle marketed Code:1= Very poor,5= Very good (c) Quality of cattle marketed Code:1= Very poor,5= Very good (d) Availability of marketing infrastructure Code:1= Very poor,5= Very good (e) Marketing experts (advisor) / Extension officers Code:1= Very poor,5= Very good
(7.8) By rating describe how easy / difficult it is to obtain the following information. (a) Price information Code: 1 = Very easy – 5 = Very difficult (b) Market related information (Auction date)
Code: 1 = Very easy – 5 = Very difficult
(c) Government related information Code: 1 = Very easy – 5 = Very difficult (d) New technology Code: 1 = Very easy – 5 = Very difficult

Appendix A
14
Negotiation Cost
(7.9) Is there a payment delay with the following marketing channels? (a) MeatCo Code: 1=never, 2=sometimes, 3=always (b) Informal market Code: 1=never, 2=sometimes, 3=always (c) Sell to other farmers Code: 1=never, 2=sometimes, 3=always (e) Others (Please specify) (7.10) Do you have bargaining power to influence the selling price when selling to:? (a) MeatCo Code: 1=never, 2=sometimes, 3=always (b) Informal market Code: 1=never, 2=sometimes, 3=always (c) Sell to other farmers Code: 1=never, 2=sometimes, 3=always (e) Others (Please specify) (7.13) Do you use a broker or middleman and contract to market your cattle? (a) Broker or middle-man Code: 1= Yes, 2 = No (b) Contract Code: 1= Yes, 2 = No (7.14) Is it a problem to transport cattle to? (a) MeatCo abattoir Code: 1= Yes, 2 = No (b) Informal market / Open market Code: 1= Yes, 2 = No
(7.15) How far are the following points from your cattle post? (a) Nearest quarantine camp km (b) Oshakati abattoirs km (c) Nearest open market km (d) Local sale pen km (7.16) Percentage of household income from cattle marketing? Code: 1 = < 30%, 2 = 30-59%, 3 = 60-79%, 4 = > 80% (7.17) How do you rate the grazing condition of this area? Code:1= Very poor,5= Very good
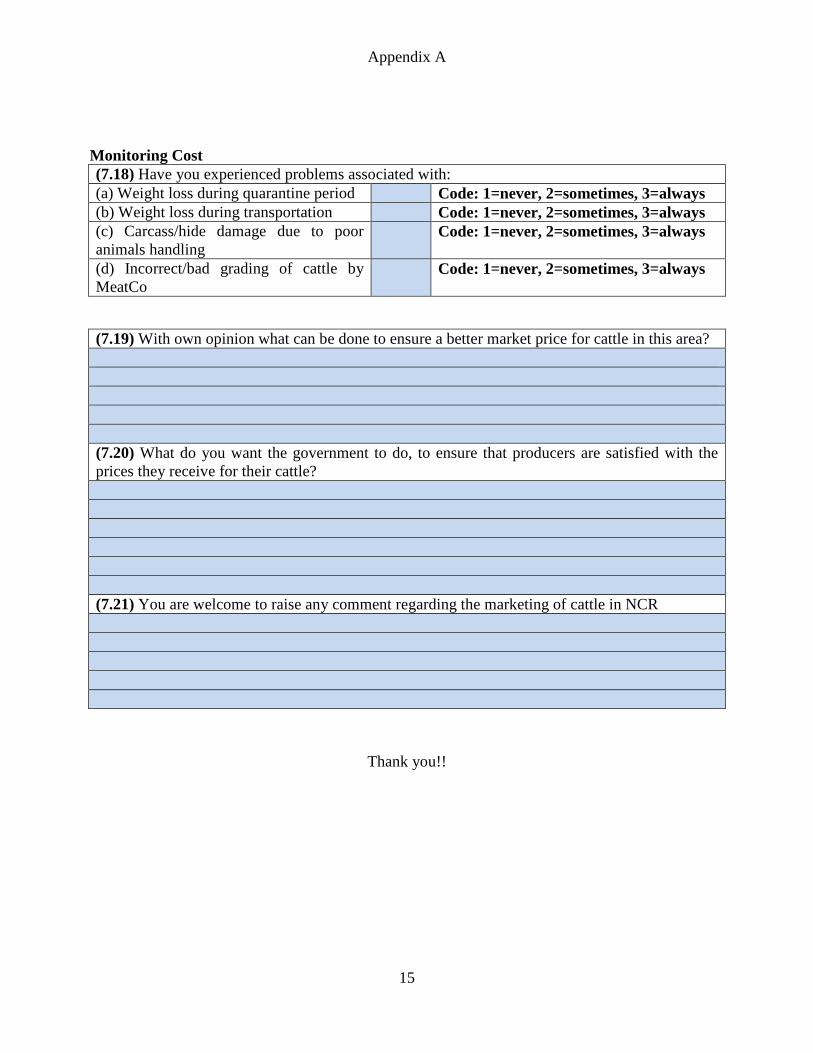
Appendix A
15
Monitoring Cost (7.18) Have you experienced problems associated with: (a) Weight loss during quarantine period Code: 1=never, 2=sometimes, 3=always (b) Weight loss during transportation Code: 1=never, 2=sometimes, 3=always (c) Carcass/hide damage due to poor animals handling
Code: 1=never, 2=sometimes, 3=always
(d) Incorrect/bad grading of cattle by MeatCo
Code: 1=never, 2=sometimes, 3=always
(7.19) With own opinion what can be done to ensure a better market price for cattle in this area? (7.20) What do you want the government to do, to ensure that producers are satisfied with the prices they receive for their cattle? (7.21) You are welcome to raise any comment regarding the marketing of cattle in NCR
Thank you!!
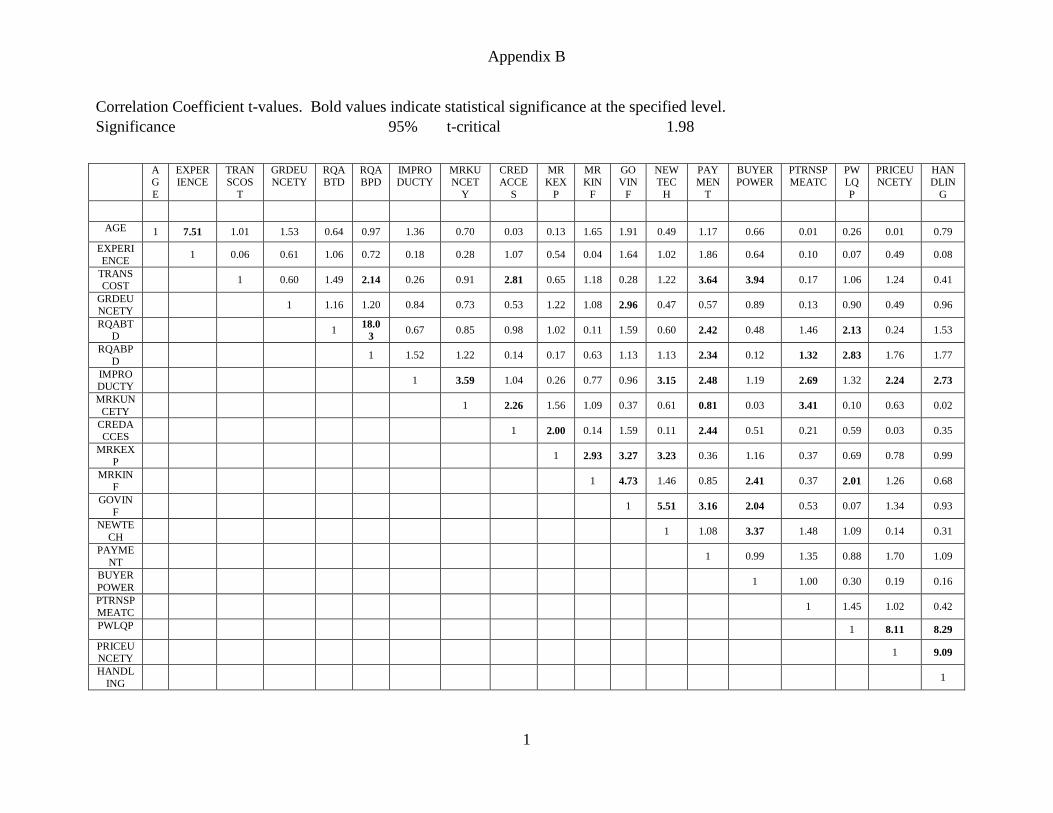
Appendix B
1
Correlation Coefficient t-values. Bold values indicate statistical significance at the specified level. Significance 95% t-critical 1.98
AGE
EXPERIENCE
TRANSCOS
T
GRDEUNCETY
RQABTD
RQABPD
IMPRODUCTY
MRKUNCET
Y
CREDACCE
S
MRKEX
P
MRKIN
F
GOVIN
F
NEWTEC
H
PAYMEN
T
BUYERPOWER
PTRNSPMEATC
PWLQP
PRICEUNCETY
HANDLIN
G
AGE 1 7.51 1.01 1.53 0.64 0.97 1.36 0.70 0.03 0.13 1.65 1.91 0.49 1.17 0.66 0.01 0.26 0.01 0.79
EXPERIENCE
1 0.06 0.61 1.06 0.72 0.18 0.28 1.07 0.54 0.04 1.64 1.02 1.86 0.64 0.10 0.07 0.49 0.08
TRANSCOST
1 0.60 1.49 2.14 0.26 0.91 2.81 0.65 1.18 0.28 1.22 3.64 3.94 0.17 1.06 1.24 0.41
GRDEUNCETY
1 1.16 1.20 0.84 0.73 0.53 1.22 1.08 2.96 0.47 0.57 0.89 0.13 0.90 0.49 0.96
RQABTD
1 18.03
0.67 0.85 0.98 1.02 0.11 1.59 0.60 2.42 0.48 1.46 2.13 0.24 1.53
RQABPD
1 1.52 1.22 0.14 0.17 0.63 1.13 1.13 2.34 0.12 1.32 2.83 1.76 1.77
IMPRODUCTY
1 3.59 1.04 0.26 0.77 0.96 3.15 2.48 1.19 2.69 1.32 2.24 2.73
MRKUNCETY
1 2.26 1.56 1.09 0.37 0.61 0.81 0.03 3.41 0.10 0.63 0.02
CREDACCES
1 2.00 0.14 1.59 0.11 2.44 0.51 0.21 0.59 0.03 0.35
MRKEXP
1 2.93 3.27 3.23 0.36 1.16 0.37 0.69 0.78 0.99
MRKINF
1 4.73 1.46 0.85 2.41 0.37 2.01 1.26 0.68
GOVINF
1 5.51 3.16 2.04 0.53 0.07 1.34 0.93
NEWTECH
1 1.08 3.37 1.48 1.09 0.14 0.31
PAYMENT
1 0.99 1.35 0.88 1.70 1.09
BUYERPOWER
1 1.00 0.30 0.19 0.16
PTRNSPMEATC
1 1.45 1.02 0.42
PWLQP 1 8.11 8.29
PRICEUNCETY
1 9.09
HANDLING
1
Transaction costs and cattle farmers’ choice of marketing channel in North-Central Namibia
By
Teofilus Shiimi
Supervisor: Dr. P.R. Taljaard
Co-supervisor: Mr. H. Jordaan
Submitted in partial fulfillment of the
Requirements for the degree of
Master of Science in Agriculture
(Agricultural Economics)
In the
Department of Agricultural Economics
Faculty of Natural and Agricultural Sciences University of the Free State
Bloemfontein Republic of South Africa
December 2009