Embed Size (px)
Citation preview

LUNDS
UNIVERSITET
Lunds Tekniska Högskola
Electroporation of stomata: Effect on drying kinetics and aroma
compounds of Genovese basil leaves
Stephen Kwao
Master of Science Thesis 2015

II
Department of Food Technology, Engineering and Nutrition
Lund University, Sweden

I
Abstract
The aroma components of herbs and spices are very sensitive to heat, complicating their
drying process. Until now, exporters of dried herbs face the challenge of low total phenolic
contents and efforts are constantly being made to improve the drying efficiency of herbs and
conserve their aroma. This thesis looks at the influence of extracellular trehalose impregnated
by vacuum impregnation (VI) and electroporation achieved with reversible pulsed electric
field (PEF) treatment affecting stomata opening on the convective air drying kinetics,
rehydration properties, colour changes and aroma preservation of basil leaves. In describing
the drying kinetics of treated basil samples, attention is given to the determination of the
drying rate and the effective moisture diffusivity.
The results indicate that reversible electroporation of opened stomata resulted in faster drying
rate (from 0.025 to 0.00039 min-1) compared to samples with opened stomata not
electroporated (from 0.0202 to 0.0021 min-1) throughout the drying period. Vacuum
impregnation with trehalose increased the initial drying rate of the control from 0.012 to
0.016 min-but towards the end of drying, the drying rate of the control and vacuum infused
control were slightly the same (0.0025 and 0.0024 min-1) respectively. Similar trends were
also observed for effective moisture diffusivity where samples with stomatal electroporation
resulted in increased effective moisture diffusivity (1.857*10-9 m2 s-1) compared to samples
where the opened stomata were not electroporated (1.309*10-9 m2 s-1). As a result of the
increased drying efficiency, irreversible electroporation of the leaf tissue resulted in 47%
reduction, reversible electroporation of opened stomata resulted in 37% reduction whilst
leaves samples that were reversible electroporated but opened stomata was not electroporated
resulted in 18% reduction in the drying time. The quality parameters analysed on the dried
herb indicate that reversible electroporation of opened stomata resulted in less colour change,
produced good rehydration properties and resulted in 1.3 to 5.7 fold increase in the major
aroma compounds relative to the untreated dried samples.

II
Table of Contents
Contents Abstract .................................................................................................................................................... i
Table of Contents .................................................................................................................................. ii
1. Introduction ....................................................................................................................................... 1
2. Objectives........................................................................................................................................... 3
3. Background ....................................................................................................................................... 4
3.1.1. Chemical compounds ............................................................................................................ 4
3.1.2 Uses ........................................................................................................................................ 5
3.2. The physiology for regulating water loss from leaves ................................................................. 5
3.2.1. Stomatal movement in plants ................................................................................................ 5
3.3. Pre-drying treatments ................................................................................................................... 7
3.3.1. Vacuum impregnation (VI) ................................................................................................... 7
3.3.2. Pulsed electric field (PEF) .................................................................................................... 7
3.4. Drying of herbs ............................................................................................................................ 9
3.4.1. Convective air drying of herbs .............................................................................................. 9
3.4.2. Mathematical modelling of convective air drying .............................................................. 10
3.4.3. Effect of air drying on quality parameters .......................................................................... 13
4. Materials and methods ................................................................................................................... 16
4.1. Source of basil and sample preparation ..................................................................................... 16
4.2. Determination of moisture content ............................................................................................ 16
4.3. Treatments.................................................................................................................................. 16
4.3.1. Influence of stomata on drying times - Chemical incubation with ABA and FC ............... 16
4.3.2. Vacuum impregnation ......................................................................................................... 17
4.3.3. PEF treatment ...................................................................................................................... 17
4.3.4. Drying ................................................................................................................................. 18
4.4. Analysis...................................................................................................................................... 18
4.4.1. Mass gain during vacuum impregnation ............................................................................. 18
4.4.2. Evaluation of PEF treatments ............................................................................................. 18
4.4.3. Effect of treatment on colour change during drying ........................................................... 19
4.4.4. Rehydration ratio................................................................................................................. 19
4.4.6. Analysis of volatile compounds .......................................................................................... 20
4.5. Statistical analysis ...................................................................................................................... 21
5. Results ............................................................................................................................................... 22
5.1. Effect of treatments on leaf structure and initial moisture content ............................................ 22

III
5.2. Effect of ABA and FC on stomatal movement and drying curves............................................. 22
5.3. Effect of PEF-treatment on the drying curves............................................................................ 24
5.3.1. Effect of PEF on stomata .................................................................................................... 24
5.3.2. Effect of PEF parameters on cell viability .......................................................................... 25
5.3.3. Drying curves ...................................................................................................................... 25
5.4. Mathematical modelling of the drying curves ........................................................................... 27
5.5. Effect of treatments on colour change ....................................................................................... 32
5.6. Effect of the treatments on rehydration properties ..................................................................... 33
5.7. Effect of treatments on composition of chemical compounds ................................................... 34
6. Discussion......................................................................................................................................... 37
6.1. Stomatal movement ................................................................................................................... 37
6.2. Electroporation and cell viability ............................................................................................... 37
6.3. Effect of treatments on drying kinetics ...................................................................................... 38
6.4. Effect of treatments on the quality of the final product ............................................................. 39
7. Concluding remarks ....................................................................................................................... 41
8. Acknowledgement ........................................................................................................................... 42
9. References ........................................................................................................................................ 43

IV
List of Abbreviations
ABA Abscisic acid
ANOVA Analysis of variance
Deff Effective moisture diffusivity
dMR Change in moisture content
DRC Dry mass Retention Capacity
dt Change in time
FC Fusicoccin
FDA Flourescein Diacetate
GC-MS Gas Chromatography-Mass Spectrometry
k Drying rate (constant)
m/z Mass/charge
MC Moisture content (dry basis)
Me Equilibrium moisture content
Mo Initial moisture content
MR Moisture ration
Mt Moisture content at any stage in the drying process
NIST National Institute of Standards and Technology
PBS Phosphate buffered saline
PEF Pulsed Electric fields
PI Propidium iodide
R2 Coefficient of determination
RA Rehydration Ability
RMSE Root mean square error
SD Standard deviation
SSE Sum of square error
t Drying time
USDA United States Department of Agriculture
VI Vacuum impregnation
WAC Water Absorption Capacity

1
1. Introduction
Sweet basil (Ocimum basilicum L.) is an aromatic herb belonging to the family Lamiaceae.
The basil plant is cultivated not only for its culinary use which is mostly derived from the
leaves but also for its medicinal and antioxidant properties. Fresh basil is used to enhance
flavour in many Mediterranean dishes such as tomato products, pizza, salads, soups and
marine foods while the dried basil leaves are mostly used in confectionary, bakery and
flavoured products. (Simon et al., 1999; Díaz-Maroto, 2004). Fresh basil leaves have high
moisture content (92 %) at harvest and cannot be preserved for long at ambient conditions. If
marketed in the dried form, the high moisture content of the leaves needs to be lowered to
safe level to extend the shelf life of the product. Drying is an old method of food preservation
widely used for such purpose. Drying of plant materials induces structural changes which
leads to loss of nutritional value, tissue damage and colour change.
Until now, exporters of dried sweet basil leaves face the challenge of low total phenolic
contents. This is because the aromatic constituents of herbs and spices are very sensitive to
heat, complicating their drying process. Often, the dehydration of herbs and spices is carried
out at low temperatures to help preserve most of the volatiles components. A major challenge
with the low temperature drying is the slow removal of moisture, leading to long drying times
and high energy consumption. The need to reduce the cost of heat treatment coupled with
increased consumer demand for processed products that retain most of the characteristics of
the original produce has led to the development of various pre-drying techniques aimed at
accelerating the rate of moisture removal.
Vacuum infusion (VI) of solutes with known biological membrane preservation
properties have been shown to protect cellular tissue during air drying and improve
rehydration properties of plant tissue (Ataré et al., 2009; Oliver et al., 2012). Pulsed electric
field (PEF) is a non- thermal pre-treatment technique which is receiving considerable
attention in drying applications due to its potential to enhance drying efficiency (Ade-
Omowaye et al., 2003; Lebovka, 2007). The increased drying efficiency of PEF treated
samples is attributed to irreversible plasma membrane disintegration at high field strength as
an upstream process to enhance mass transfer (Gachovska et al., 2008; Ade-Omowaye et al.,
2003). However, complete cell disruption cannot be used as a pre-treatment to enhance the
drying rate of herbs since their aromatic constituents will leak out.

2
Plants lose water through opened stomata during growth but the stomata gradually closes
when a plant is cut. In a recent work (Advance course: Food engineering) on basil leaves, we
observed that reversible electroporation of opened stomata at low field strength enhanced the
rate of moisture removal during convective air drying of the leaves and the drying time was
considerably reduced. The reduction in drying time as a result of opened stomatal
electroporation indicates the potential of targeting opened stomata to enhance the rate of
moisture removal during dehydration without irreversible damage of cell membranes of the
cells in the leaves.
3
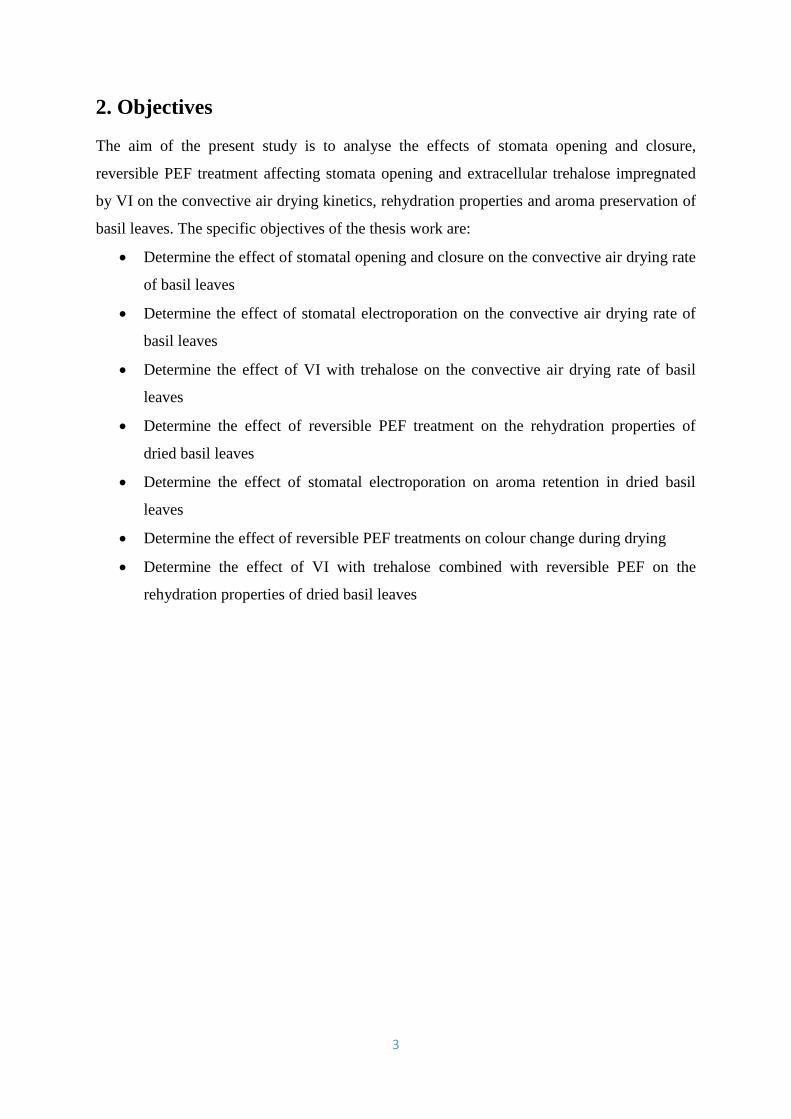
2. Objectives
The aim of the present study is to analyse the effects of stomata opening and closure,
reversible PEF treatment affecting stomata opening and extracellular trehalose impregnated
by VI on the convective air drying kinetics, rehydration properties and aroma preservation of
basil leaves. The specific objectives of the thesis work are:
Determine the effect of stomatal opening and closure on the convective air drying rate
of basil leaves
Determine the effect of stomatal electroporation on the convective air drying rate of
basil leaves
Determine the effect of VI with trehalose on the convective air drying rate of basil
leaves
Determine the effect of reversible PEF treatment on the rehydration properties of
dried basil leaves
Determine the effect of stomatal electroporation on aroma retention in dried basil
leaves
Determine the effect of reversible PEF treatments on colour change during drying
Determine the effect of VI with trehalose combined with reversible PEF on the
rehydration properties of dried basil leaves

4
3. Background
3.1. Basil plant
Sweet basil (Ocimum basilicum L.) is an aromatic plant belonging to the family Lamiaceae.
The genus Ocimum contains about 50 to 150 species which are either hardy annuals or non-
woody perennial herbs and shrubs (Simon et al., 1999). The basil plant can grow up to 20 –
60 cm long depending on the cultivar (Chalchat and Özcan, 2008). Basil is believed to have
originated from the tropical and subtropical regions of Asia, Africa and Central and South
America (Simon et al., 1999) but is now extensively cultivated in many Mediterranean
countries for its culinary use. There are many cultivars of basil with variable leaf shape and
size. Different cultivars show variation in morphological features, essential oil production
and the composition of the oils (Lachowicz et al., 1997; Miele, 2001). The most commonly
cultivated basil cultivars are Genovese, Purple Ruffles, Cinnamon, Globe, Thai, Mammoth
and African Blue. Most of these cultivars marketed for their culinary use are cultivars of
sweet basil.
3.1.1. Chemical compounds
The presence of essential oils and their composition determines the specific aroma of herbs.
The oil yield of herb varies greatly under different environmental conditions. A number of
phenyl-propanoids, terpanoids, monoterpenes, sesquiterpene hydrocarbons etc such as 1, 8-
cinoele, methy cinnamate, methyl chavical citronellol, linalool, myrcene, ocimene, eugenol
and linalool have been noted as main volatiles responsible for the aroma of basil (Simon et
al., 1999; Gang et al., 2001; Díaz-Maroto, 2004). As by 1999, approximately 190 chemical
compounds had been identified in basil. Cultivars of basil have varying essential oils
composition which depends on the growing conditions, method of extraction and analysis
(Gil et al., 2002). These chemicals come together in different proportions to produce a
distinctive spicy pungent aroma. No particular cultivar contains all of these volatiles in
significant amount but there is often one dominant volatile in each cultivar. Sweet basils for
example have a strong clove fragrance due to higher proportions of methyeugenol whist the
citrus aroma of lemon and lime basils is due to higher proportions of citral (Simon et al.,
1999).

5
3.1.2 Uses
Sweet basil is a popular culinary herb in most countries used extensively as a food ingredient.
Fresh basil leaves contain about 92 % water and is a good source of vitamin A, Vitamin C,
vitamin K, iron, folate and traces of other vitamins and minerals (Table 1). Dried basil leaves
are mostly used as a spice and the basil seed is used in Asian drinks. Genovese basil (a
cultivar of sweet basil) is cultivated mainly for its use in the traditional Genovese sauce
popularly known as ‘pesto’. Extract from basil have been used traditionally to treat
headaches, cough, diarrhoea, constipation, warts, worms and kidney malfunction (Simon et
al., 1999; Vierira and Simon, 2000). Basil extract contains biologically active constituents
that have insecticidal, nematicidal, fungicidal, and antimicrobial and antioxidant properties
(Lee et al., 2005; Lee and Scagel, 2009).
Table 1. Nutritional value of fresh basil, per 100g serving, source: USDA, 2014
3.2. The physiology for regulating water loss from leaves
3.2.1. Stomatal movement in plants
Stomata are microscopic pores circumscribed by two guard cells which are located in the
impermeable cuticle that coats the aerial parts of terrestrial plants. Plants loss about 95 % of
the water that is lost during growth through opened stomata. Stomatal opening or closing is
controlled by the movement of the surrounding guard cells. The stomata close in response to
less efficient carbon fixation and utilization in order to decrease the loss of water through
transpiration (Assmann, 1993). The controlled movement of stomatal aperture allows the
plant to balance the demand for carbon dioxide and water.
Proximate amount Minerals amount Vitamins amount
Energy
Carbohydrate
Water
Dietary fibre
Fat
protein
94 KJ
2,65 g
92.06 g
1.6 g
0.64 g
3.15 g
Calcium
Iron
Magnesium
Phosphorus
Potassium
Sodium
Zinc
177 mg
3.17 mg
64 mg
56 mg
295 mg
4 mg
0.81 mg
Vitamin C
Thiamin
Riboflavin
Niacin
Vitamin B-6
Folate
Vitamin A
Vitamin E
Vitamin K
18 mg
0.034 mg
0.076 mg
0.902 mg
0.155 mg
68 μg
264 μg
0.8 mg
414.8 μg

6
Guard cells movement is also triggered by its turgidity which is dependent on the
concentrations of primary osmolytes. It is a well-known fact that increased guard cells
osmolarity induces stomatal opening whilst decreased guard cells osmolarity leads to
stomatal closure. The increased accumulation of major osmolytes such as K+, Cl-, malate2-
and sucrose increases the turgidity of guard cells (Talbott and Zeiger, 1998). These
accumulations are triggered by light activated plasma membrane H+-ATPase through
different signalling pathways. Talbott and Zeiger (1998) observed a pathway which involves
the uptake of K+ and Cl- from the apoplast and the synthesis of malate2- from starch-derived
carbon skeletons. High K+ decreases the osmotic potential of guard cells leading to the influx
of water into guard cells. This mechanism increases the turgor pressure in guard cells and
inflates them into two kidney bean-like shapes thereby opening the stomata in the centre of
two guard cells (Johansson et al., 1993; Schroeder et al., 2001; Hlavinka et al., 2013). In a
reverse form, stomatal closure is induced by increased efflux of K+ ions from guard cells,
leading to increased membrane depolarization and turgor loss (Schroeder et al., 2001; Negi et
al., 2008).
Much is known about the role of hormones on guard cells osmolarity and on stomatal
movement. Johansson et al (1993) reported the activation of guard cells plasma membrane
H+-ATPase by the fungal toxin, fusicoccin (FC). Hlavinka et al (2013) reported the opening
of stomata treated by FC and/or exposed to white light in their epidermal strip experiment.
Irving et al (1992) observed an initial acidification of guard cell cytosol by FC and other
hormones prior to stomatal opening and H+-ATPase activation.
The phytohormone abscisic acid (ABA) is widely known to induce the closure of opened
stomata and inhibits the opening of closed stomata through a signalling cascade driven by the
efflux of K+ from guard cells and involving H2O2 and Ca2+ as intermediary components
(Wang et al., 2001). ABA-dependent depolarization of plasma membrane is partly attributed
to its ability to inhibit the action of plasma membrane H+-ATPase (Schroeder et al., 2001).
When the roots sense water deficit in the soil, they send a signal to the shoots through
increased concentration of ABA in leaf apoplast or guard cells which eventually produces a
chemical signal leading to stomata closure (Dodd, 2003).

7
3.3. Pre-drying treatments
The choice of any pre-drying processing depends on the kind of material to be processed.
Many applications such as ultrasound (Carcel et al., 2007), vacuum impregnation and pulse
vacuum (Deng and Zhao, 2008; Ataré et al., 200; Oliver et al., 2012), blanching (Akyol et al.,
2006) and electric field pulses (Ade-Omowaye et al., 2003) have been used as pre-drying
steps to affect tissue integrity and accelerate drying of plant tissues (Gachovska et al., 2008).
The effect of VI and PEF treatment on the drying kinetics is reviewed below.
3.3.1. Vacuum impregnation (VI)
VI is reported to improve the quality of dried and frozen products through a cascade of
cellular structure modification. VI involves the application of low pressure to provoke the
elimination of gas/air in the pores of the product. The eliminated gas is replaced by a
surrounding solution with some specific solute components when atmospheric pressure is
restored (Fito et al., 2001; Fito and Chiralt, 2003). Mass transfer in the open pores is driven
by hydrodynamic mechanism resulting from the applied pressure gradients (Fito and Pastor,
1994). The reduced porosity and incorporated solute might offer some protective action on
the cellular structure of the product, thereby changing the mass transfer behaviour.
Disaccharides such as glucose, sucrose and trehalose have been demonstrated to preserve
the function of biological membranes in the dry state (Ataré et al., 2009; Oliver et al., 2012)
and freeze state (Phoon et al., 2008; Velickova et al., 2013) and have been used for cellular
structure modification. Apple samples pre-treated with trehalose were found to shrink less
during drying and had better rehydration properties (Ataré et al., 2009; Ataré et al., 2008;
Oliver et al., 2012). Ferrando and Spiess (2001) also observed cellular structure protection of
trehalose during their work on the osmotic dehydration of onion and strawberry. The extent
of vacuum impregnation and tissue deformation are analysed by different methods. However,
the most important condition is to ensure maximal mass gain in the infused samples.
3.3.2. Pulsed electric field (PEF)
PEF treatment is a non-thermal food processing technique which involves the application of a
high intensity electric field to biological cell membranes. Cell electroporation induces
permeabilization on cell membranes, causing the cells to undergo dielectric breakdown and
eventual disruption of the cell membrane. Every cell has its threshold electric field strength

8
beyond which the cell membranes are irreversibly damaged, resulting in cell death. The
extent of cell damage is dependent on the relevant electric parameters: field strength, pulse
duration, pulse width, number of pulses, treatment time, whether bipolar or monopolar pulses
and on product components (Rastogi, 2003; Dymek, 2014a). The degree of tissue damage and
cell disintegration is proportional to the field strength, higher electric field leads to greater
cell disintegration (Gachovska et al., 2008; Lebovka, 2007).
PEF treatment ensures continuous application with little heating of the medium, the
treatment time is short and there is low energy requirement (Barsotti and Cheftel, 1999). The
application of PEF to enhance the drying efficiency of various food materials have been
reported by many authors. Angersbach and co-workers (1997) reported an increased
permeability of potato tissue in response to PEF treatment, resulting in improved mass
transfer during fluidized bed drying. Armyanov and co-workers (2001) reported 20-30 %
reduction in drying time of PEF treated tobacco leaves. Amami and co-workers (2008)
studied the combined effect of PEF and osmotic dehydration pre-treatment on the convective
drying of carrot tissue and observed a reduction in the drying time. Gachovska et al (2008)
observed an increased drying rate of PEF-treated carrot. Wu and co-workers (2011) studied
the influence of PEF pre-treatment on vacuum freeze-drying of apples and reported 22.5 %
reduction in the drying time and 27.02 % improvement in the drying rate. Ade-Omowaye and
co-workers (2001) reported that high PEF pre-treatment improved the drying rate of paprika.
The net effect of PEF treatment is accelerated moisture removal during further processing
leading to reduced processing time and energy cost, and enhanced product quality (Ade-
Omowaye et al., 2003; Gachovska et al., 2008). There is an interactive effect of the various
PEF parameters on the drying rate and drying time (Gachovska et al., 2008). These benefits
of PEF treatment have been achieved through irreversible plasma membrane
permeabilization. By strict control of the electroporation parameters, permeabilization may
evade affecting the cell viability. The effect of reversible membrane permeabilization on the
rate of moisture removal, drying time and rehydration properties has not yet been explored
and it is the main aim of this study.
Reversibly electroporation occurs when the applied electric field is below the threshold of
the transmembrane potential and pores are created temporarily in the cell membrane. In this
case, the pores are able to reseal and the cell membrane completely recover from
electroporation thus preserving the viability of the cell membrane (Dymek, 2014a).

9
Reversibly electroporation is often used in medical applications where substances such as
dyes, drugs, proteins and nucleic acids are incorporated into cells (Garcia et al., 2010). A
recent application of reversibly electroporation of plant tissue was reported by Phoon et al.
(2008). The authors reported improvement of the freezing tolerance of spinach leaves after
reversible PEF treatment and vacuum impregnation with trehalose. Dymek and co-workers
(2014a) reported that the reversibility of electroporation in rucola leaves was higher for
bipolar pulses compared to mono polar pulses, with increased interval between the pulses
further enhancing cell viability after electroporation.
3.4. Drying of herbs
Water is an important component of vegetables and the first step in any preservation
operation is the removal of moisture (drying). In biological systems such as food, water exists
as free or as bound water. Drying of herbs must meet certain requirements (Oztekin and
Martinov, 2007):
(1) moisture content that is at equilibrium with storage conditions
(2) Minimum reduction in active volatile components and in colour
(3) Microbial load must be below the prescribed limits
(4) Good rehydration properties
To help achieve these requirements, adequate temperature, air velocity and humidity
values coupled with some pre-drying treatments are combined to provide rapid reduction in
the moisture content without affecting the colour and composition of the aroma constituents.
Many drying techniques have been employed in recent years to help achieve the above
requirements. Microwave drying, oven drying, freeze-drying, sunlight drying have
specifically been used to dry basil. However, hot air drying is still the most commonly used
dehydration method for basil (Chiampo et al., 1997; Di Cesare et al, 2003; Pirbalouti et al.,
2013).
3.4.1. Convective air drying of herbs
Air drying of biological tissues results in simultaneously phenomena of mass transfer,
structural changes and tissue modification with drying time. The microstructure of plant
tissue such as its porosity affects the mass transfer process. At the same time, mass transfer
provokes microscopic and macroscopic structural modifications such as destruction of natural

10
tissue and shrinkage that in turn affect the mass transfer processes (Barat et al., 2001; Fito
and Chiralt, 2003; Seguí et al., 2010). The structural modification may lead to shrinkage,
texture and colour changes and lose of nutritional value; resulting in low quality dried
products.
Two transport processes occur simultaneously during the convective air drying of plant
tissues. These processes are heat transfer and moisture movement. Dehydration involves the
evaporation of water from a wet surface to a stream of moving air. There is a simultaneous
migration of water from the interior of a drying material toward the surface as water is being
removed from the surface. The process creates a difference in vapour pressure on the drying
surface and the vapour pressure of water in air surrounding the surface (moisture flux) is
hence the driving force for moisture removal. The rate of moisture loss is thus proportional to
the remained moisture to be lost (Toledo, 1999).
Convective air drying occurs in a number of stages with different drying rates at each of
the stages. At the early stages of drying, characterised by a constant drying rate, the transfer
of moisture from the centre to the surface is mainly by capillary action. Capillary action is
more rapid and the rate of surface evaporation controls the rate of drying. At this stage, the
rate of drying is limited by the mode of heat transfer and the rate at which heat is transferred
from air to the material (Toledo, 1999; Lewicki, 2006).
In the later stages of drying, characterised by the falling rate period, the diffusion of water
from the centre of the solid to the surface controls the rate of drying (Wang et al., 2007).
Moisture diffusivity is affected by composition, moisture content and porosity of the drying
material (Afzal and Abe, 1998). For high moisture content produce, moisture removal often
leads to some physical changes such as shrinkage and cell collapse. These changes lead to
decreasing rates of moisture diffusion. Toledo (1999) noted that the rate of moisture diffusion
may be constant if cells do not collapse and pack together during drying.
3.4.2. Mathematical modelling of convective air drying
Two main groups of mathematical models are used to describe the thin-layer drying process
of agricultural produces. One group of mathematical models correspond to empirical models
.Another group of models correspond to diffusion models. These models describe the mass
transport process during drying and give mathematical expressions which:

11
1. Either links the drying rate as a function of time or as a function of moisture content
and
2. Relates the total amount of moisture leaving the drying sample to the drying time.
Depending on the type of model, the following parameters: (1) the effects of the thickness
of the drying sample, (2) heat and mass transfer, (3) shrinkage variation of the product and
(4) the effect of the drying conditions are taken into consideration in the drying simulation.
During drying, the loss in weight of a sample (representing the loss of moisture) is
monitored and the drying process is simulated by processing the obtained weight loss data.
Curves showing the variation of moisture content (kg water per kg dry weight) with drying
times are presented. In drying simulation, the drying curve is normalised by converting the
moisture content (kg water per kg dry weight) data to a dimensionless parameter (moisture
ratio) and fitted with the drying time. The moisture content, Mt (kg water per kg dry weight)
at any time during the drying process is given by an expression of the form:
Mt = Me + (Mo – Me)ƒ(t, a, b) Equation [3.1]
An expression for the dimensionless moisture ratio, MR at a time,‘t’ during the drying
process is obtained from Eqn 3.1 and is given by:
MR = 𝑀𝑡− 𝑀𝑒
𝑀𝑜 – 𝑀𝑒 Equation [3.2]
where Mo is the initial moisture content (kg water per kg dry weight) and Mt is the moisture
content at any time in the drying process (kg water per kg dry weight) and Me is the
equilibrium moisture content (kg water per kg dry weight).
For samples with long drying times, the value of equilibrium moisture content is
relatively small compared to the initial moisture content, hence equation (3.2) can be
simplified to equation (3.3) with negligible error.
MR = 𝑀𝑡
𝑀𝑜 Equation [3.3]
In drying simulation, the MR is related to a mathematical function [ƒ (t, a, b)] with 1 or 2
fitting parameters (a and b) as:
MR = ƒ(t, a, b) Equation [3.4]

12
Drying constant
In the falling rate period, the rate of moisture lost is assumed to be proportional to the
moisture remaining to be lost. This assumption is expressed in the form:
𝑑𝑀𝑅
𝑑𝑡 =− 𝑘 (𝑀𝑜 − 𝑀𝑒) Equation [3.5]
Integration of this expression yields the Newton or exponential drying model (Eqn 3.6)
which is often used in drying simulation to describe the falling rate period (Sarimeseli, 2011).
𝑀𝑡−𝑀𝑒
𝑀𝑜−𝑀𝑒 = 𝑒𝑥𝑝(− 𝑘 ∗ 𝑡) Equation [3.6]
where k is the drying rate (min-1) and t is the drying time (min). Fitting the exponential model
to the dimensionless moisture ratio vs time curves yields drying rate values at different stages
of drying.
Moisture diffusivity
The drying kinetics of biological materials is described using their transport properties
(moisture diffusivity, thermal diffusivity, mass transfer coefficients, etc.) and the properties
of the drying medium. At the falling rate period, it is assumed that the main mechanism
controlling the drying rate is internal moisture diffusivity. The solution for this equation is
based on an assumed uniform initial moisture concentration and negligible external gas phase
mass transfer resistance. The drying curve at the falling rate period is thus modelled using the
diffusion equation (Akpinar, 2005; Mariani et al., 2008). According to the diffusion model,
the total amount of moisture leaving an infinite slab with a constant surface flux is related to
the drying time (Akpinar, 2006; Sarimeseli, 2011) in the form:
MR =8
𝜋2 [∑
1
(2𝑛+1)2𝑛=∞𝑛=0 𝑒𝑥𝑝[− (2𝑛 + 1)2 𝐷𝑒𝑓𝑓 𝑡(
𝜋
2𝑡) 2] ] Equation [3.10]
For long drying times, only the first term of Eqn 3.10 is relevant and the diffusion model
for infinite slabs is modified with little error to:
MR =𝑀𝑡−𝑀𝑒
𝑀𝑜−𝑀𝑒 =
8
𝜋2 *𝑒𝑥𝑝[−
𝜋2 ∗ 𝐷𝑒𝑓𝑓
4𝐿2∗ 𝑡] Equation [3.11]

13
Where 𝐷𝑒𝑓𝑓 = effective moisture diffusivity (m2 min-1), L = half thickness of the leaves (m).
The effective moisture diffusivity is calculated from the slope derived from the linear
regression of the curves obtained by plotting ln [(𝜋2
8) * MR] versus time.
3.4.3. Effect of air drying on quality parameters
Texture and rehydration aspects
Structural changes such as cell deformation and shrinkage induced on plant tissues during
pre-drying and drying operations may lead to poor rehydration properties. Rehydration is
done by immersion in water or other liquids such as oil, fruit juice, and sugar solutions. When
a dried product is immersed into a liquid medium, the product imbibes the liquid which leads
to swelling of the product and leaching of soluble solids into the liquid (Lewicki, 1998). The
rehydration property of dried products that need rehydration prior to consumption is an
important quality criterion.
Rehydration properties can be used to quantify the physical and chemical changes
suffered by the material during drying (Krokida and Philippopoulus, 2005; Sacilik and Elicin,
2006). If there is no tissue damage, dried products should be able to imbibe and bind the
same amount of water evaporated from them, rehydration properties is thus an important
quality index. Maldonado et al., (2010) outline the following three methods to characterise
rehydration properties of dried products.
1. Water absorption capacity (WAC). This is the ability of the dried matrix to absorb
water to replace the water lost during drying
2. Dry mass retention capacity (DRC). This measures the ability of the material to retain
soluble solids after rehydration.
3. Rehydration ability (RA). This is a measure of the ability of the product to rehydrate,
gives an estimate of the total tissue damage induced by pre-drying and drying
operations on the plant tissue.
Flavour and colour aspects
The drying method has significant effects on the quality of dried products. The removal of
water during drying reduces the water activity of dehydrated products to levels that prevent
microbial growth and reduces the rate of deteriorative chemical and biochemical reactions
(Kubra and Rao, 2012). The reduced weight of dehydrated products reduces storage and
14
distribution costs and extends shelf life (Toledo, 1999). However, exporters of dried herbs
and spices still face the challenge of low total phenolic contents. Consumers characterise
dried food products based on their colour and texture resemblance to the raw material
(Lewicki, 2006). The dehydration process of aromatic plants often leads to some quality
deterioration mainly through loss of volatiles and flavours, loss of vitamin C, and colour
change (Kostaropoulos & Saravacos, 1995).
The aromatic constituents of herbs and spices are very sensitive to hot air drying
conditions. Drying temperature is the single most important parameter which influences the
aroma composition and colour change of dried herbs and spices. Higher temperatures may
lead to volatilization or degradation of the active ingredients (Venskutonis et al., 1996;
Johnson et al., 1998). Changes in the volatile oils composition and the concentration of some
specific compounds of herbs during drying have been observed (Dìaz-Maroto et al., 2002).
The temperature-sensitivity of the aroma compounds determines the drying temperature.
Often, the dehydration of herbs and spices is carried out at low temperatures to help
preserve most of the volatiles components. Chiampo and co-workers (1997) suggested an
oven drying temperatures close to 60 ℃ as optimal to conserve most of the volatile
compounds in basil. A major challenge with the low temperature drying is the slow removal
of moisture, leading to long drying times and higher energy consumption. The choice of the
optimal drying temperature is thus a central economic and quality criterion to be considered.
Colour is an important food attribute that influences consumer acceptance. The colour of
green leafy vegetables is due to chlorophyllic pigments namely the less stable chlorophyll a
and more stable chlorophyll b. chlorophyll a is the major pigment and is blue-green coloured
whilst chlorophyll b is yellow-green coloured. As the leaf is heated, chlorophyll is less stable
and is easily degraded. Thermal degradation of the chlorophyllic pigments due to the loss of
Mg2 produces a colour change from the bright green colour to the brown colour of
pheophytins a and b observed in dried green leafy vegetables (Eskin, 1990; Johnson et al.,
1998).
Non-destructive evaluation of colour can be done using the CIELAB colour space (L*, a*,
b*). The L*coordinate is a measure of the colour brightness with a value 0 representing black
and 100 representing white. The chromaticity coordinate a* measures redness when positive
and green when negative whilst the chromaticity coordinate b* measure yellowness when

15
positive and blueness when negative. Chen (2008) descriptive levels of colour change as
determined from colour change (𝛥 𝐸) values are shown in Table 2.
Table 2: Descriptive levels of colour change, (adapted from Chen (2008)).
Level 𝜟 𝑬 range
Trace level difference 0 – 0.5
Slight difference 0.5 – 1.5
Noticeable difference 1.5 – 3.0
Appreciable difference 3.0 – 6.0
Large difference 6.0 – 12.0
Very obvious difference ˃ 12.0
16
4. Materials and methods
4.1. Source of basil and sample preparation
Potted Genovese basil (Ocinum basilicum) was purchased at a local supermarket in Lund.
The potted plants were kept in cooled bags (5 ℃) and transported to the laboratory. To ensure
equal period of exposure to light, the plants were stored at 5 °C for 12 h in a dark room
before exposing them to white light for 1 h to initially open the stomata. After exposure to
light, 2-3 leaves of equal shape were manually detached from each stem and treated as
described below.
4.2. Determination of moisture content
Portions of fresh and treated samples were subject to moisture content (wet and dry basis)
determination according to the AOAC (1997) official method. Triplicates of 2 g of each
sample were dried in a pre-heated oven at 105 °C for 1 h and the loss in weight was
expressed as a percentage of the fresh weight.
4.3. Treatments
4.3.1. Influence of stomata on drying times - Chemical incubation with ABA and FC
After the 1 h exposure to light to initially open the stomata, three batches each consisting of
50 leaves (22 - 24 g) were either incubated in solutions of 10 µM ABA (to force stomata
closed), 5 µM FC (to force stomata open) for 2 h in the light prior to drying or not incubated.
The incubation solutions were enough to completely cover the leaves and the leaves were
held in such a way that the cut portion of the leaf petiole was facing downward in the
incubation medium. In this way, the incubation solutions were absorbed through the leaf
petiole to the leaf veins and other parts of the leaf. The non-incubated batch was stored on
moist tissue paper to avoid dehydration of the leaves.
The ABA solution was prepared in PBS buffer, pH 7.4. PBS buffer was prepared by
adding 8 g NaCl, 0.2 g KCl, 1.44 g KH2HPO4 and 0.24 g KH2PO4 to 1000 ml deionized
water and adjusting the pH with HCl (Dymek et al., 2014b). Ten mM stock solution of FC
was prepared by mixing 146.9 μL of 35% ethyl alcohol to 1 mg bottle of FC and mixed until
FC was fully dissolved. 50 μL of this stock solution was added to 100 ml deionized water.
After incubation, three leaves from each batch were rinsed in deionized water and observed

17
under a light microscope (Elipse Ti-U, Nikon, Japan). Images were acquired with the help of
an equipped camera (Nikon DS- QiMc) equipped with the image analysis software NIS
Element BR which allowed for stomatal aperture measurements at 20X magnification. The
remaining leaves from each batch were immediately subjected to drying.
4.3.2. Vacuum impregnation
Vacuum impregnation was carried out with aqueous solution of trehalose in a vacuum
desiccator at room temperature. Three untreated basil leaves were immersed in 100 ml
trehalose solution (4.5 g /100 g) for 30 min. This duration comprised a gradual increase of the
vacuum for 10 min, 10 min holding time at 50 mbar followed by a gradual release of the
vacuum for 10 min.
4.3.3. PEF treatment
Untreated and vacuum impregnated leaf samples were placed in a rectangular electroporation
chamber (0.5 cm gap between electrodes) and PEF treated with either deionized water or
propidium iodide (PI) (conductivity 250 µs). The conductivity of treatment solutions was
adjusted with NaCl. The treatment solution was enough to completely cover the stainless
steel electrodes of the PEF treatment chamber. The electric pulses were delivered by a CEPT
pulse generator (Arc Aroma Pure AB, Lund, Sweden) at room temperature and the electric
parameters were programmed by a computer software package (ARC CEPT HM13, Lund,
Sweden). The PEF treatment system was connected to a digital oscilloscope (Fluke 123,
Washington) which allowed for monitoring the pulses delivered to the samples.
Table 3. Combination of pulsed electric parameters
Field strength (KV/cm) Pulse width (μs) Pulse space (μs) Number of pulses
0.6
120
150
500
760
65
65
1.5 150 760 65
One train of monopolar, rectangular electric pulses with field strengths of 0.6 or 1.5
kV/cm was delivered. After preliminary trials (not shown in this report), the pulse width was
set at 120 or 150 μs, and consisted in 65 pulses with 500 or 760 μs resting period between the
pulses. The combination of the electric parameters is shown in Table 3.

18
4.3.4. Drying
Treated samples including the control were dried in a preheated convection oven at 50 °C
overnight to establish drying curves. The air velocity in the oven was 2 m/s and the oven
drying chamber was equipped with a balance which allowed for continuous weighing of the
samples. The loss in weight of the samples (representing moisture loss) was continuously
monitored during the drying process. Samples for further analysis were treated and dried to
the experimentally determined drying times using the same drying equipment as described
above and their moisture contents were determined according to the AOAC (1997) official
method. In order to describe the thin layer convective drying kinetics of vacuum infused and
PEF-treated basil leave samples, the MR obtained from the drying data is related to the
Newton and diffusion models and these mathematical expressions were used to evaluate the
effect of the treatments on the drying rate and the effective moisture diffusivity respectively.
4.4. Analysis
4.4.1. Mass gain during vacuum impregnation
The mass gain of vacuum infused basil samples was calculated according to the following
equation.
𝑚𝑤𝑒𝑖𝑔ℎ𝑡 𝑔𝑎𝑖𝑛 = 𝑚−𝑚𝑜
𝑚𝑜 * 100 Equation [4.1]
where m is the mass of the infused basil leaves and 𝑚𝑜 is the initial mass of fresh basil
leaves.
4.4.2. Evaluation of PEF treatments
Test of electroporation
PEF-treated samples were observed under the microscope as described above using 250 μM
PI as treatment solution. After electroporation, stained sections of the leaf samples were
rinsed with deionized water before observing them under epi-fluorescence light conditions.
The nuclei of electroporated cells were stained with PI and were easily identified under
fluorescence at 10X magnification (Gόmez Galindo et al., 2008).

19
Test of cell viability
PEF-treated samples were placed on a moist tissue paper and stored in the fridge at 4 ℃ for
20 h. The viability of cells 20 h after electroporation was evaluated by comparing them to
negative and positive controls. The negative control was prepared by storing fresh leaf
samples in the freezer for 10 min. PEF-treated and control samples were incubated in 12 μM
Flourescein Diacetate (FDA) solution for 1 h in the dark at room temperature. The FDA
solution was prepared by adding 200 μL of 12 mM FDA stock solution in acetone to 200 ml
deionized water. After incubation, stained sections of the samples were rinsed with deionized
water and the rinsed samples were observed under the microscope as described above. Viable
cells were easily identified by a bright fluorescence at 10X and 20X magnifications (Dymek
et al, 2014a).
4.4.3. Effect of treatment on colour change during drying
The colour of fresh and dried basil samples was determined by a chroma meter using the
hunter colour standards. The chroma meter was calibrated against white light and set to CIE
standard. Five leaves from each sample were used for colour measurement and the values
reported are means of 10 replicates. The parameters recorded were the L*, a*, b* coordinates
of the CIE lab scale. The total colour change (Eqn 4.2), which is a measure of the colour
difference between raw (R) and dried (D) basil leaves was calculated to evaluate the effect of
the treatments on colour retention (Di Cesare, 2003).
𝛥 𝐸 = [ √ + (𝐿∗𝑅 − 𝐿∗𝐷 )2 +(𝑎∗𝑅 − 𝑎∗𝐷 )2 +(𝑏∗𝑅 − 𝑏∗𝐷 )2] Equation [4.2]
4.4.4. Rehydration ratio
The rehydration capacity of the samples was determined according to the method described
by Gaschovska et al. (2009) with slight modification. Four dehydrated basil leaf samples
were weighed and placed in beakers containing 300 ml distilled water at room temperature
for seven hours. Samples were taken from the beaker every hour and drained on a mesh for 5
min before weighing. The rehydration capacity was calculated as the ratio of the weight of
rehydrated sample during rehydration to the weight of dry sample.

20
4.4.5. Water activity
The water activity of the dried leaf samples was determined using the Aqualab (Model CX-2,
Decagon Devices Inc., Pullman, WA) water activity analyser.
4.4.6. Analysis of volatile compounds
Extraction
Fresh and dried basil leaves were subjected to supercritical fluid extraction. 2 g of fresh basil
leaves and equivalent amounts of dried basil samples were calculated to obtain equal amount
of dry matter content and loaded into 5 ml stainless steel extraction cell filled with glass
beads. The MV-10 ASFE (waters Technologies, Manchester, UK) supercritical fluid
extraction system was used for CO2 expanded ethanol extraction. The system operation and
parameters setting were controlled by ChromScope™ Software.
Figure 1. Supercritical fluid CO2 expanded ethanol extraction system
The system, as illustrated in Figure 1, is equipped with dual piston pumps for CO2 and co-
solvent connected with T joint, extraction oven with 10 extraction cells of 5.0 ml, back
pressure regulator (BPR), heated restrictor, make-up solvent pump and 10 bottles collection
tray. The extraction was performed at 40 °C, 93 bar and 0.31 molar fraction of CO2 in
ethanol. The flow rate and extraction time were 1.0 ml/min and 60 min respectively. The
makeup solvent (ethanol) was kept at 0.3 ml/min. The outlet was bubbled into 5.0 ml of
liquid solvent in volumetric flask placed into ice bath. The system was flashed with
CO2/ethanol fluid mixture after each run for cleaning. The extracts were stored at -20 °C until
further analysis.

21
GC-MS Analysis
GC–MS analysis was performed using an 450-GC system (Bruker Corporation, Freemont,
CA, USA) equipped with an autosampler and SCION triple quadrupole (TQ) mass
spectrometry detector. A Capillary column HP-5 MS fused-silica cap. Column (5%
phenyl/95% dimethylpolysiloxane; 30 m x 0.25 mm i.d., film thickness 0.25 µm) was used
for analysis. The system was operated at 70 eV ionization energy, 0.5 s/scan and the mass
range m/z 40 to 350. The oven temperature was held at 60 °C for 3 min then increased to 270
°C at a rate of 3 °C/min, both injector and detector temperatures were set at 250 °C. Helium
was used as the carrier gas with a flow rate of 1.0 ml/min. The software adopted to handle
mass spectra and chromatograms was SCION SQ Software.
The tentative identification of compounds was done by comparing the obtained mass spectral
with those of an internal NIST standard reference mass spectral library and by comparing the
results with those reported in literature. The retention of the major aroma compounds in the
treated dried samples relative to the untreated dried sample was calculated by dividing the
peak area of each compound in the treated samples by their peak areas in the untreated dried
sample. Analysis of chemical compounds was repeated three times and mean values±
standard deviation are reported.
4.5. Statistical analysis
Drying experiments were performed in duplicate and average values were used for curve
fitting using Matlab curve fitting toolbox (Matlab R2014b, MathWork, Inc., MA, USA). The
goodness of fit of fitted models was evaluated using the coefficient of determination (R2), the
root mean square error (RMSE) and the sum of square error (SSE). The data were analysed
for the degree of variation and significance of difference based on one way analysis of
variance (ANOVA) using Microsoft Excel 2013 and Minitab 17. The Turkey’s pair-wise
comparison test was used to determine the difference (P < 0.05) between the treatment
means.

22
5. Results
5.1. Effect of treatments on leaf structure and initial moisture content
Fresh basil leaves have a typical thickness of 0.30 ± 0.02 mm and average weight of
0.41 ± 0.8 g (Table 4). The mass gain in the leaves was 40.46 ± 6.4 %, causing the mean
mass of the vacuum impregnated leaf to increase to 0.57 ± 0.1 g. The replacement of the gas
in the pores of the leaf structure significantly (P < 0.05) decreased the average thickness of
basil leaf to 0.25±0.01 mm.
Table 4. Leaf thickness and mass gain after vacuum impregnation with trehalose (n = 20)
Leaf weight (g) Leaf thickness (mm)
initial weight After VI % mass gain fresh After VI
0.41±0.8 0.57±0.1 40.46±6.4 0.30±0.02A 0.25±0.01B
Means ± SD followed by different letters within a row are significantly different (P < 0.05)
The initial moisture content (Table 5), wet basis of fresh basil (control) was 91.20 ± 0.10 %.
Both the PEF-treatments and the 2 h incubation of the leaves in the solutions significantly (P
< 0.05) affected the initial moisture content of the leaves compared to the control. After
drying to the predicted drying times, the water activity of all treated dried samples were the
same and lower than 0.6 - the limiting value of water activity for the growth of
microorganisms (Martin and Maurice, 2008).
Table 5. Effect of treatments on the moisture content (wet basis) of basil leaves (n = 3)
Treatment % MC Water activity
Control (Fresh) 91.20±0.10C 0.92±0.06A
ABA 92.53±0.12B 0.52±0.02B
FC 92.50±0.10B 0.52±0.01B
Survived, opened stomata electroporated 92.17±0.06B 0.53±0.03B
Survived, opened stomata not electroporated 92.60±0.10B 0.51±0.02B
Fully disintegrated cells 92.87±0.06B 0.53±0.02B
VI + Survived, opened stomata electroporated 93.23±0.001A 0.51±0.03B
VI + Control 93.09±0.001B 0.52±0.01B Means ± SD followed by different letters within a column are significantly different (P < 0.05)
5.2. Effect of ABA and FC on stomatal movement and drying curves
Figure 2 and Table 6 show the response of stomatal aperture to ABA and FC concentrations.
After exposure to 1 h white light, the stomata of the untreated samples were opened to
approximately 16.72 ± 1.30 μm (Figure 2A). Incubating the leaves in 10 μM of ABA

23
solution for 2 h induced complete closure of the stomata (Figure 2B). Whilst the stomata
aperture was totally closed under the ABA treatment, it was opened in the FC treatment
(Figure 2C). Incubating leaves in 5 μM FC solution significantly (P < 0.05) increased
stomatal aperture from the initial 16.72 ± 1.30 μm opening induced by white light to
47.57 ± 2.82 μm, representing 185% increase in stomatal aperture after 2 h of incubation.
Figure 2. Microscopic view of Ocimum basilicum L. Stomata taking after plants were exposed to
white light for 1 h (A) before incubating leaves in white light under treatment with either (B) 10 μM
ABA or 5 μM FC solutions for 2 h. Images were taking at a magnification of 20X. The arrows in the
figure are pointing to the stomata.
Table 6. Effect of ABA and FC on stomatal aperture, measurements at 20X (n = 20).
Treatment Stomatal aperture (μm)
Control 16.72±1.30B
ABA -
FC 47.57±2.82A
Means ± SD followed by different letters within a column are significantly different at (P < 0.05).
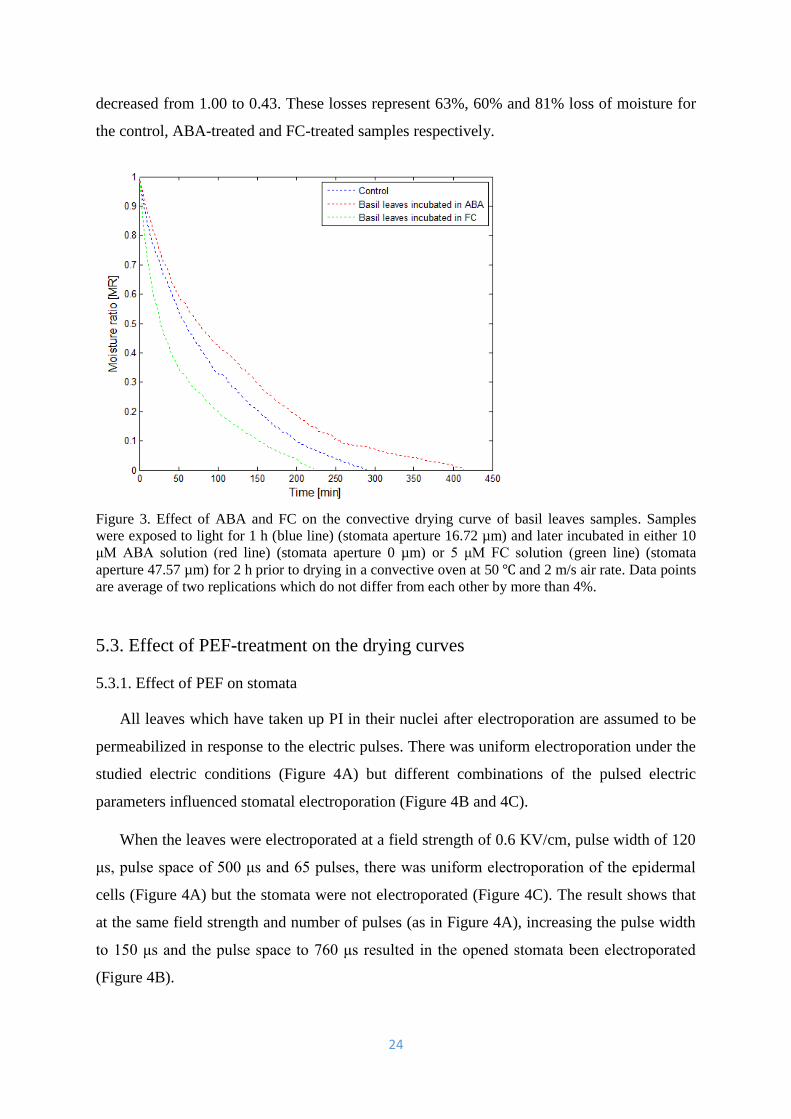
Figure 3 shows the drying curves for leaf samples treated with the chemical solutions.
The samples were dried from an initial moisture content of 10.36, 12.39 and 12.33 kg water
per kg dry weight for the control, ABA-treated and FC-treated samples respectively. The
drying curves show that stomatal movement has significant effect on the drying kinetics.
Complete stomatal closure induced by ABA resulted in a slow moisture removal whereas
increased stomatal aperture induced by FC resulted in a rapid drying of the leaves compared
to the control.
The dimensionless moisture ratio decreased continuously with drying time till the end of
drying. However, the loss of water from the leaves in all treatments and the control was rapid
during the first 100 min after which the loss of water decreases and slowly flattened out
toward the end of drying. However, there were differences in the variation of moisture ratio
with time. After 100 min of drying, the dimensionless moisture ratio of the control has
reduced from the initial 1.0 to 0.33. The dimensionless moisture ratio of samples treated with
FC had reduced from the initial 1.0 to 0.20 whilst that of samples treated with ABA had
A B C
24
decreased from 1.00 to 0.43. These losses represent 63%, 60% and 81% loss of moisture for
the control, ABA-treated and FC-treated samples respectively.
Figure 3. Effect of ABA and FC on the convective drying curve of basil leaves samples. Samples
were exposed to light for 1 h (blue line) (stomata aperture 16.72 µm) and later incubated in either 10
μM ABA solution (red line) (stomata aperture 0 µm) or 5 μM FC solution (green line) (stomata
aperture 47.57 µm) for 2 h prior to drying in a convective oven at 50 ℃ and 2 m/s air rate. Data points
are average of two replications which do not differ from each other by more than 4%.
5.3. Effect of PEF-treatment on the drying curves
5.3.1. Effect of PEF on stomata
All leaves which have taken up PI in their nuclei after electroporation are assumed to be
permeabilized in response to the electric pulses. There was uniform electroporation under the
studied electric conditions (Figure 4A) but different combinations of the pulsed electric
parameters influenced stomatal electroporation (Figure 4B and 4C).
When the leaves were electroporated at a field strength of 0.6 KV/cm, pulse width of 120
μs, pulse space of 500 μs and 65 pulses, there was uniform electroporation of the epidermal
cells (Figure 4A) but the stomata were not electroporated (Figure 4C). The result shows that
at the same field strength and number of pulses (as in Figure 4A), increasing the pulse width
to 150 μs and the pulse space to 760 μs resulted in the opened stomata been electroporated
(Figure 4B).

25
Figure 4. Effect of electric parameters on electroporation conditions. Microscopic view of Ocimum
basilicum L. cells taking after plants were exposed to light for 1 h before reversible permeabilization
in 250 μM PI. (A) shows uniform electroporation of epidermal cells; (B) the opened stomata are
electroporated at PEF conditions of field strengths of 0.6 KV/cm, pulse width of 150 μs, pulse space
of 760 μs and 65 pulses; (C) the opened stomata are not electroporated at PEF conditions of field
strength of 0.6 KV/cm, pulse width of 120 μs, pulse space of 500 μs and 65 pulses. The arrow in B
and C points to the stomata. A was taken at 10X whilst B and C were taken at 20X magnification.
5.3.2. Effect of PEF parameters on cell viability
Figure 5 shows the microscopic view of the cells monitored by FDA staining 20 h after
electroporation. There was no loss in viability of cells, shown by the complete FDA staining
of cells electroporated at 0.6 KV/cm field strength (Figures 5B and 5C) and the control fresh
basil leaves, non-electroporated (Figure 5A). There was complete loss of viability in the cells
electroporated at 1.5 KV/cm filed strength (Figure 5D) and the negative-non electroporated
but killed in the freezer (5E). The loss in viability shown in Figure 5D is a result of
irreversible cell damage inflicted by the high field strength treatment.
Figure 5. Test of cell viability after 20 h of electroporation. Microscopic view of Ocimum basilicum L.
cells taking after leaves were incubated in 12 μM FDA for 1 h. (A) is the positive control (fresh basil
leaves). PEF-treated samples were stored at 4 ℃ for 20 h before incubation. The PEF parameters for
(B) are field strength of 0.6 KV/cm, pulse width of 120 μs, pulse space of 0.5 ms and 65 pulses). (C)
and (D) were electroporated at field strengths of 0.6 KV/cm and 1.5 KV/cm respectively with other
PEF parameters (pulse width of 150 μs, pulse space of 0.76 ms and 65 pulses) constant (E) is the
negative control (dead cells, leaves were stored in the freezer for 10 min before incubation). Images
were taking at a magnification of 10X.
5.3.3. Drying curves
Figure 6 shows the plot of moisture ratio (MR) vs time (t) obtained from experimental data for
the PEF treated samples. The samples were dried from an initial moisture ratio of 10.36,
11.83, 12.51 and 12.86 kg water per kg dry weight respectively for:
A B C
A B C D E

26
The control,
Reversible electroporation of epidermal cells with opened, electroporated stomata
Reversible electroporation of epidermal cells with not electroporated, opened stomata
(after light exposure),
Irreversible electroporation of epidermal cells and opened stomata after light exposure
The loss of water from the leaves changed rapidly during the first 100 min after which the
loss of water decreases and slowly flattened out toward the end of drying. However, PEF
conditions affected the variation of moisture ratio with time. The initial dimensionless
moisture ratios had respectively fallen to 0.33, 0.16, 0.10 and 0.04 for the control, reversible
electroporation of epidermal cells with opened electroporated stomata, reversible
electroporation of epidermal cells with opened stomata not electroporated, and irreversible
electroporation of epidermal cells with opened stomata after 100 min of drying.
Figure 6. Effect of PEF parameters on the convective air drying of basil leaves. Convective drying of
the samples was carried out 50 ℃ and 2 m/s air velocity. Both samples were exposed to light for 1 h
and either immediately dried (blue line) or PEF-treated before drying. PEF parameters are (red line)-
field strength of 0.6 KV/cm, pulse width of 120 μs, pulse space of 0.5 ms and 65 pulses; (green line) -
field strength of 0.6 KV/cm, pulse width of 150 μs, pulse space of 0.76 ms and 65 pulses and (violet
line) - field strength of 1.5 KV/cm, pulse width of 150 μs, pulse space of 0.76 ms and 65 pulses. Data
points represent the average of two replications with maximum of 4.0 % deviation from each other
depending on the stages of drying and the treatment.
Whilst both PEF-treated samples dried faster compared to the control, the rate of drying
was fast at higher field strength where the cells had completely been damaged throughout the
drying process. On the samples treated at the same field strength, where there was reversible
electroporation, the drying rate was relatively parallel for the first 100 min of drying beyond
27
which samples treated with PEF conditions optimized for the opened stomata to be
electroporated dried significantly faster than samples in which the opened stomata is not
electroporated. If stomata closes during drying was not monitored during this study.
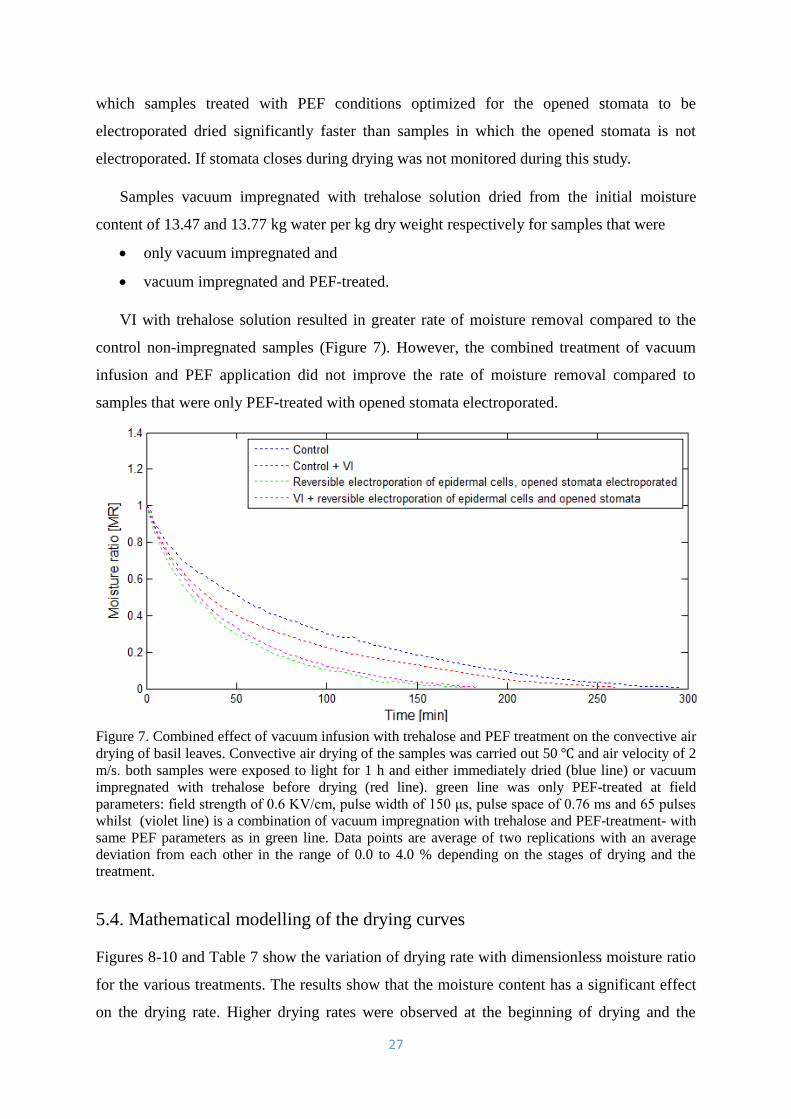
Samples vacuum impregnated with trehalose solution dried from the initial moisture
content of 13.47 and 13.77 kg water per kg dry weight respectively for samples that were
only vacuum impregnated and
vacuum impregnated and PEF-treated.
VI with trehalose solution resulted in greater rate of moisture removal compared to the
control non-impregnated samples (Figure 7). However, the combined treatment of vacuum
infusion and PEF application did not improve the rate of moisture removal compared to
samples that were only PEF-treated with opened stomata electroporated.
Figure 7. Combined effect of vacuum infusion with trehalose and PEF treatment on the convective air
drying of basil leaves. Convective air drying of the samples was carried out 50 ℃ and air velocity of 2
m/s. both samples were exposed to light for 1 h and either immediately dried (blue line) or vacuum
impregnated with trehalose before drying (red line). green line was only PEF-treated at field
parameters: field strength of 0.6 KV/cm, pulse width of 150 μs, pulse space of 0.76 ms and 65 pulses
whilst (violet line) is a combination of vacuum impregnation with trehalose and PEF-treatment- with
same PEF parameters as in green line. Data points are average of two replications with an average
deviation from each other in the range of 0.0 to 4.0 % depending on the stages of drying and the
treatment.
5.4. Mathematical modelling of the drying curves
Figures 8-10 and Table 7 show the variation of drying rate with dimensionless moisture ratio
for the various treatments. The results show that the moisture content has a significant effect
on the drying rate. Higher drying rates were observed at the beginning of drying and the

28
drying rate decreased continuously with both moisture ratio and drying time. This means that
there was no constant rate period and the entire drying process occurs in the falling rate
period. Fitting the Newton model to the drying curves resulted in drying rate at the initial
stages of drying in the range of 0.0088 to 0.25 min-1 and the drying rate towards the later
stages of drying ranges from 0.00024 to 0.00039 min-1 (Table 7). All the treatments except
the 2 h incubation in ABA resulted in higher initial drying rate compare to the control.
Among the PEF-treated samples, higher initial drying rate (0.03 min-1) was observed in leaf
samples subjected to irreversible permeabilization at higher field strength compared to
samples subjected to reversible permeabilization at low field strength (0.0202 to 0.025 min-1).
Figure 8. Variation of drying rate with moisture ratio for chemically treated samples. Treatment and
drying conditions are the same for each treatment as described in the MR vs time curves in Fig. 3.

29
Figure 9. Variation of drying rate with moisture ratio for PEF treated samples. Treatment and drying
conditions are the same for each treatment as described in the MR vs time curves in Figure 6.
Figure 10. Variation of drying rate with moisture ratio for vacuum impregnated samples. Treatment
and drying conditions are the same for each treatment as described in the MR vs time curves in Fig. 7.
Among samples with reversible electroporation at low field strength, reversible
electroporation of opened electroporated stomata resulted in faster drying rate (from 0.025 to
0.00039) compared to samples with opened stomata not electroporated (from 0.0202 to
0.0021) throughout the drying period. Vacuum impregnation with trehalose increased the
initial drying rate of the control from 0.012 to 0.016 min-1 (Table 7) but towards the end of
drying, the drying rate of the control and vacuum infused control were slightly the same

30
(0.0025 and 0.0024 min-1) respectively. Combination of vacuum infusion and PEF treatment
however decreased the drying rate compared to the drying rate of samples that were only
PEF-treated. Vacuum infusion before PEF treatment decreased the initial drying rate of the
PEF-treated samples from 0.025 to 0.022 min-1.
Table 7. Effective moisture diffusivity and drying rate obtained for selected moisture ratios.
Treatment Deff (m2 s-1) Drying rate (min-1)
MR = 1 MR = 0.5 MR = 0.01
Control 1.036*10-9 0.0120 0.0060 0.0005
ABA 7.076*10-10 0.0088 0.0050 0.0003
FC 1.204*10-9 0.0190 0.0120 0.0030
Survived, opened stomata electroporated 1.857*10-9 0.0250 0.0120 0.0004
Survived, opened stomata not electroporated 1.309*10-9 0.0202 0.0110 0.0002
Fully disintegrated cells 2.586*10-9 0.0300 0.0160 0.0052
VI + Survived, opened stomata electroporated 1.171*10-9 0.0220 0.0120 0.0004
VI + Control 1.718*10-9 0.016 0.0091 0.0002
The fit parameters obtained after fitting the Newton model to the experimental drying
curves are given in Table 8. A good fit of experimental data was observed with all the
calculated R2 values within the range of 0.999-0.942 and the observed RMSE, which is a
measure of the deviation of the fitted curve from the experimental data within the range of
0.014 to 0.053. The closer the RMSE value to zero, the more accurate the curve is for
predictability.
Table 8. Statistical results obtained after fitting the Newton model to the drying curves to
determine the drying rates.
Treatment R2 SSE RMSE
Control 0.985 0.129 0.030
ABA 0.992 0.105 0.023
FC 0.942 0.307 0.053
Survived, opened stomata electroporated 0.997 0.018 0.014
Survived, opened stomata not electroporated 0.987 0.077 0.026
Fully disintegrated cells 0.999 0.002 0.005
VI+ Survived, opened stomata electroporated 0.996 0.022 0.015
VI + Control 0.974 0.181 0.037

31
The drying curves and the drying rate vs moisture ratio curves show that all the drying
occurred in the falling rate period. The diffusion model was used to evaluate the effects of the
treatments on mass transport within the leaf tissue at the falling rate period. Linear regression
analysis of the drying curves shows concave moisture diffusivity curves (not shown). The
obtained effective moisture diffusivity values were in the range 7.076*10-10 to 2.586*10-9 m2
s-1 (Table 7). Apart from chemical incubation with ABA which decreased the effective
moisture diffusivity, all the other treatments increased the effective moisture diffusivity
compared to the control. Stomatal electroporation also resulted in increased effective
moisture diffusivity (1.857*10-9 m2 s-1) compared to samples where the opened stomata were
not electroporated (1.309*10-9 m2 s-1). The effective moisture diffusivity values of basil
leaves obtained for each treatment in this studies are within the range of 10-7 to 10-11 m2 s-1
reported for biological materials (Wang et al., 2007) but were however higher than the values
6.44*10-12 m2 s-1 (Akpinar, 2006) reported for basil. Differences in the effective moisture
diffusivity values may be attributed to the treatments applied and the drying medium used.
Table 9. Experimentally determined drying times to dry to 10 % moisture content (dry basil)
and the dry weight after drying basil leaf samples to the predicted drying time.
Treatment drying time (min) % dry weight
Control 279 89.98 ± 0.02
ABA 406 -
FC 217 -
Survived, Stomata opened and electroporated 177 90.03 ± 0.03
Survived, Stomata opened but not electroporated 228 89.99 ± 0.02
Fully disintegrated cells 148 90.05 ± 0.01
Control + VI 248 90.10 ± 0.01
VI + Survived, opened stomata electroporated 181 90.25 ± 0.02
The increased mass transport and the resultant increase in the drying rates due to the
applied treatments (except the sample incubated with ABA), resulted in reduced drying time
needed to reach an expected moisture ratio compared with the control. The experimentally
determined drying times needed to reach moisture content of 10% (kg water per kg dry
weight) are summarised in Table 9. Compared to the control, irreversible electroporation of
the leaf tissue resulted in 47% reduction whilst reversible electroporation of the epidermal
cells with opened stomata electroporated resulted in 37% reduction in the convective air
drying time of basil leaves. Reversible electroporation of the epidermal cells but with opened
stomata not electroporated could only result in 18% reduction in the experimentally

32
determined drying time. Vacuum infusion with trehalose also resulted in 11% reduction in the
convective air drying time compared to the control. The combination of vacuum infusion
with trehalose and PEF-treatment did not have any influence on the final drying time
compared to PEF treatment alone.
5.5. Effect of treatments on colour change
The colour evaluation parameters are given in Table 10. The colour brightness (L*),
greenness (negative a*) and yellowness (positive b*) for the fresh basil leaves are
35.66±3.71, -9.45±0.32 and 21.02± 2.92 respectively. Pre-drying and drying operations
altered the colour of the dried leaf samples compared to the fresh basil leaf. The colour
brightness of the untreated dried samples and samples that were vacuum impregnated with
trehalose solution prior to drying were significantly (P < 0.05) lower when compared to either
the fresh leaves or the untreated dried samples. There was no change in colour brightness
between the fresh leaves and PEF-treated samples. The colour greenness significantly (P <
0.05) decreased with pre-drying treatment and with drying compared to the fresh leaves.
Samples that were pre-treated before drying recorded significantly (P < 0.05) higher values
for the colour greenness compared to the untreated dried samples. Vacuum impregnation with
trehalose solution resulted in intense greener colour prior to drying but drying of the vacuum
impregnated samples significantly (P < 0.05) decreased the colour greenness compared to the
fresh leaves and the untreated dried samples. The colour yellowness significantly (P < 0.05)
decreased in the untreated dried samples and dried samples that were either irreversibly
electroporated of vacuum impregnated with trehalose prior to drying when compared to the
fresh leaves.
Table 10. Effect of treatments on colour change of dried basil leave samples (n = 20)
Treatment L* a* b*
Control (fresh) 35.66±3.71A -9.45 ±0.32A 21.02± 2.92A
Control (dried) 32.65 ± 65BCD -2.16 ± 1.09 F 17.13 ± 2.20B 8.91
Opened stomata not reversible
electroporated
34.12 ± 3.30AB -5.58 ± 0.46C 19.62 ± 2.00A 4.40
Reversible electroporation of opened
stomata and epidermal cells
34.73 ± 3.28AB -6.90 ± 0.28B 20.94 ± 2.14A 2.72
Irreversible electroporation of
epidermal cells
33.40 ± 2.64ABC -3.31 ± 0.64 E 16.99 ± 1.90B 7.79
Control + VI 30.05 ± 1.35 CD -4.60 ± 0.30D 16.21 ± 2.37B 8.83
VI + reversible electroporation of
opened stomata
30.91 ± 3.32D -3.46 ± 0.89E 13.36 ± 2.49C 10.82
Means ± SD followed by different letters within a column are significantly different (P < 0.05)

33
The total colour change values ( ) for the dried leaf samples were in the range 2.72 to
10.82. Again, samples PEF-treated before drying produced less total colour change compared
whilst samples vacuum impregnated with trehalose or combination of VI and PEF-treatment
before drying resulted in higher total colour change. Between the PEF-treated samples,
opened electroporated stomata resulted in less total colour change compared to dried samples
in which opened stomata were not electroporated. Adopting the descriptive level of colour
change used by Chen (2008), the obtained total colour change values ranges from noticeable
difference for samples with opened electroporated stomata prior to drying to large difference
for samples vacuum impregnated with trehalose solution before drying.
5.6. Effect of the treatments on rehydration properties
Figure 11 and Table 11 respectively show a graph of rehydration ratio with time and the
percent weight recovered after rehydrating to constant weight. All the pre-drying treatments
resulted in better rehydration ratio compared to the control (A).
Figure 11. Variation of rehydration ratio with time. The following treatments: (A):- the control
(untreated), (B):- reversibly electroporation with opened stomata not electroporated, (C):- reversible
electroporation of opened stomata, (D):- irreversible electroporation of epidermal cells, (E):- vacuum
impregnation with trehalose before PEF-treatment with PEF parameters as in D, (F):- vacuum
impregnation of the control with trehalose was applied prior to drying. Data points are averages of
three replications.

34
Among PEF-treated samples, samples that were reversibly electroporated (B and C)
significantly (P < 0.05) recovered more of the weight lost during dehydration compared to
samples that were irreversibly electroporated (D) prior to drying. The combination of vacuum
infusion with trehalose and PEF-treatment (E) recorded the highest rehydration ratio whist
samples that were only vacuum infused with trehalose (F) before drying recorded slightly
better rehydration properties compared to the control non-treated samples (A).
Table 11. Weight recovery after rehydrating to constant weight at room temperature.
Treatment1 Weight of
fresh leaves
Weight after rehydrating
to constant weight
% of weight recovered after
rehydrating to constant weight
A 2.05±0.08 1.12±0.01E 53.63±0.01E
B 2.05±0.08 1.46±0.02B 71.22±0.02B
C 2.05±0.08 1.48±0.00B 72.20±0.00B
D 2.05±0.08 1.17±0.01D 57.07±0.01D
E 2.05±0.08 1.57±0.02A 76.59±0.02A
F 2.05±0.08 1.25±0.02C 60.98±0.02C 1 Treatments are: (A) The control (untreated), (B):- reversibly electroporation with opened stomata not
electroporated, (C):- reversible electroporation of opened stomata, (D):- irreversible electroporation of
epidermal cells, (E):- vacuum impregnation with trehalose before PEF-treatment with PEF parameters
as in C, (F):- vacuum impregnation of the control with trehalose was applied prior to drying. Reported
are average data of three replications. Means ± SD followed by different letters within a column are
significantly different (P < 0.05).
5.7. Effect of treatments on composition of chemical compounds
Table 12 shows the GC-MS aroma profile and Figure 12 shows a typical chromatogram of
aroma compounds of Genovese basil extracted by supercritical fluid CO2 expanded ethanol.
Nineteen aroma compounds were identified and the GC-MS spectral shows the main aroma
compounds from Genovese basil cultivated in Sweden are methyleugenol (31.7%),
caryyophellene oxide (9.12%), eugenol (8.04%) and cis-beta-farnesene (5.09%). Other
sesquiterpene hydrocarbons (such as cubebene, bergamotene), oxygenated sesquiterpene
(farnesol), monoterpene hydrocarbons (beta-ocimene) and oxygenated monoterpene
(menthol) were in substantial amount.
The pre-drying treatments and drying of the leaf samples produced changes in the aroma
profile. All the major identified aroma compounds in the fresh leaves were present in the
dried samples whilst some minor aroma compounds were below detection limit in some pre-
treated dried samples. The concentrations of three aroma compounds; bergamotene, beta-
ocimene and menthol in all PEF-treated dried samples were below detection limit. The
concentrations of carvacrol, cubebene and cadinol were also below detection limits in all

35
dried samples. Pinene oxide was either below detection limit or unseparated from
caryophellene oxide in all dried samples.
Table 12. Chemical compounds from fresh Genovese basil leaves, extracted by supercritical
fluid CO2 expanded ethanol and analysed by GC-MS
Peak Retention time [min] Compounds
1 11.8 Carvacrola
2 13.3 Eugenol
3 14.9 Methyleugenol
4 15.9 Bergamoteneb
5 16.3 beta –ocimeneb
6 16.7 Cis-beta farnesene
7 17.3 Cubebenea
8 21.2 Dodecanol
9 22.4 Cadinola
10 28.4 Octadecene
11 28.6 Cis-9-tetradecen-1-ol
12 29.3 Cytronellyl butyrate
13 29.8 Menthol
14 32.9 Ethyl palmitate
15 35.9 Phytol
16 37.0 Pinene oxidea
17 37.3 Caryophellene oxide
18 40.3 Hexadecanoic acida
19 51.3 Farnesol a
concentration below detection limit in all dried samples
b concentration below detection limit in all samples PEF-treated before drying
Figure 12. Typical chromatogram of chemical compounds extracted from Genovese basil by direct
injection in GC-MS. The peak numbers correspond to the numbers in Table 12.

36
Table 13. Relative increase in aroma compounds of Genovese basil in the treated dried
samples compared to the untreated dried sample.
Compounds A B C D E
Eugenol 1.77±0.02B 2.32±0.06A 1.81±0.05B 0.54±0.02D 0.83±0.04C
Methyl eugenol 1.19±0.05A 1.31±0.09A 0.98±0.05B 0.47±0.03C 0.49±0.04C
Cis-beta-farnesene 1.11±0.11B 2.07±0.11A 0.76±0.06C 0.43±0.03D 0.47±0.03D
dodecanol 1.12±0.01B 1.45±0.01A 0.73±0.02C 0.31±0.01D 0.32±0.02D
Octadecene 1.30±0.03B 1.92±0.11A 1.15±0.03C 0.28±0.01D 0.36±0.01D
Cis-9-tetradecen-1-ol 1.29±0.02B 1.65±0.12A 1.33±0.09B 0.18±0.01D 0.41±0.02C
Menthol 1.32±0.06B 1.65±0.08A 1.30±0.06B 0.17±0.01C 0.15±0.01C
Ethyl pamitate 1.21±0.04B 1.30±0.04B 1.65±0.06A 0.94±0.04C 0.96±0.04C
phytol 1.15±0.06C 1.56±0.05A 1.29±0.06B 0.29±0.00E 0.61±0.01D
Caryophellene oxide 3.14±0.30B 5.74±0.23A 1.37±0.10C 0.61±0.02D 0.76±0.02D
farnesol 0.98±0.04D 1.42±0.06B 1.17±0.06C 1.64±0.06A 1.06±0.06CD
The following treatments: (A):- reversibly electroporation with opened stomata not electroporated,
(B):- reversible electroporation of opened stomata, (C):- irreversible electroporation of epidermal
cells, (D):- vacuum impregnation with trehalose before PEF-treatment with same PEF parameters as
that of B, (E):- vacuum impregnation of the control with trehalose was applied prior to drying. Data
points are average of three replications. Means of three replicates ± SD followed by different letters
within a row are significantly different (P < 0.05)
Eleven of the identified aroma compounds in the fresh leaves were fully separated and
identified in all dried samples. These eleven aroma compounds were chosen to evaluate the
effects of the pre-drying treatments on the concentration of aroma compounds relative to the
untreated dried sample (Table 13). The abundance of these eleven compounds were higher in
all the treated dried samples relative to the untreated dried sample. The reduced drying times
as a result of PEF-treatment resulted in high abundance of the aroma compounds relative to
the untreated dried sample. The four major aroma compounds; methyleugenol, caryophellene
oxide, eugenol and cis=beta-farnesene identified in the fresh leaves were:
1. 0.76 to 1.37 fold higher in dried samples that were irreversibly electroporated prior to
drying compared to untreated dried samples;
2. 1.19 to 3.14 fold higher in dried samples that were reversibly electroporated but with
opened stomata not electroporated prior to drying compared to untreated dried
samples.
3. 1.31 to 5.74 fold higher in dried samples that were reversibly electroporated with the
opened stomata electroporated prior to drying compared to untreated dried samples.
The major volatiles identified in the treated dried samples were significantly (P < 0.05)
higher in dried samples in which stomata was electroporated. The combination of vacuum
impregnation with trehalose and reversible electroporation of opened stomata however
significantly (P < 0.05) decreased the abundance of the aroma compounds compared to the
samples that were only reversible electroporated with the opened stomata electroporated.

37
6. Discussion
6.1. Stomatal movement
In the present study, stomatal opening in the presence of light was observed after treating leaf
samples in 5 μM FC solution. Exogenous application of 10 μM ABA to light-induced opened
stomata promoted complete stomatal closure after 2 h of treatment. The regulation of plasma
membrane H+ ATPase and K+ ions and other osmolytes are responsible for the observed
opposite effects of ABA and FC on stomatal movement. Light induced stomatal movement is
known to depend on the osmotic regulation of K+ ions and other solutes such as chloride and
sugars. Assmann and Schwartz (1992) observed a synergistic effect of light and low FC
concentrations on stomatal opening of epidermal peel of Asiatic Dayflower (Commelina
communis) and broad bean (Vicia faba).
The effect of FC on stomatal opening is attributed to its ability to activate plasma
membrane H+ ATPase (Assmann and Schwartz, 1992; Braunsgaard et al., 1998). ABA has
been implicated in both light and dark-induced stomatal closure and its action in regulating
light-induced stomata closure is believed to occur through signalling components such as
Ca2+ (Kwak et al., 2003) which serves as an intermediate in the stomatal closing cascade
induced by ABA. These results further confirm the opposite effects of ABA and FC on
stomatal movement.
6.2. Electroporation and cell viability
PI cell staining has been used in several studies to study the electropermeabilization of cell
membranes (Joersbo et al, 1990; Gόmez Galindo et al., 2008). Since PI cannot enter intact
plant cell membranes, the presence of red colour of PI staining in the nuclei is indicative of
cell membrane permeabilization in response to electrical pulses. The PI staining results show
cells with either the stomata electroporated or not in addition to uniform electroporation of
the epidermal cells. Stomatal electroporation is dependent on the combination of the
electrical parameters. Our results show that optimization of the pulse width and pulse space
are necessary to achieve stomata electroporation. For basil, preliminary trials (results not
given in this report) shows a narrow range of pulse width (140 - 160 μs) and pulse space (750
- 760 μs) as optimal conditions to achieve stomatal electroporation and these optimal
conditions must be combined to achieve full stomata electroporation.

38
FDA staining is often used to differentiate between reversibly damaged and irreversibly
damaged electropermeabilized cell membranes (Dymek et al., 2014a). The FDA staining
assay gives a distinction between dead and living cells. The study was not designed to
determine the threshold field strength to recover cell viability in basil leaves after
electroporation but the FDA assay shows that if the applied field strength is low enough, in
our case 0.6 KV/cm (probably below the threshold value for basil cell membrane), the
electroporation is reversible and the viability of cells is not affected. H`+-ATPase is the main
trans-membrane transport channel in living cells. It is generally accepted that the activity of
H`+-ATPase helps the cell to take up ions leaked from partially damaged cell membranes
(Arora and Palta, 1991). The complete loss of viability at higher field strength (1.5 KV/cm) is
indicative of electrical parameters beyond the threshold values. The ions in a cell move to the
membrane surface in response to an external electric field. The electric pulses create pores in
the cell membrane and the cell membrane breaks down when the transmembrane potential
reaches a threshold value (Hibino et al., 1991).
6.3. Effect of treatments on drying kinetics
The experimental drying curves confirm that stomatal aperture has significant effect on the
drying rate and the mass transfer within the drying basil leaves (see Table 9). In describing
the drying kinetics of treated basil samples, attention is given to the determination of the
drying rate and the effective moisture diffusivity. Samples treated with 10 μM ABA solution,
and in which the stomata were microscopically confirmed to be closed, shows significantly
reduced rate of moisture removal, thereby elongating the drying rate and the drying time by
127 min compared to the control. However, samples treated with FC dried significantly faster
(217 min). This result demonstrates that stomata aperture has significant effect on drying
kinetics of detached plant parts and was further confirmed in the PEF treated samples.
For the PEF treated samples, samples treated at higher field strength (1.5 KV/cm) resulted
in faster drying (148 min to reach moisture ratio of 0.1 kg water per kg dry weight) whilst
samples treated at lower field strength (0.6 KV/cm) were dried after 177 and 228 min, for
stomata opened electroporated and opened stomata not electroporated, respectively. These
results suggest that the irreversible membrane damage as a result of the higher field strength
(1.5 KV/cm) treatment significantly reduced the drying time by 131 min compared to the
control but could only reduce the drying time by 29 min when compared to the drying time of
samples treated at low field strength provoking reversible electroporation of opened stomata

39
(177 min). This proves that the drying time of samples can significantly be reduced without
necessary disintegrating the cell membrane but only by affecting the stomata with
electroporation.
Among the samples which survived electroporation, electroporation of opened stomata
resulted in 51 min reduction in the drying time compared to samples in which opened stomata
electroporation was not achieved. Since the samples with and without opened stomatal
electroporation were treated at the same field strength (the main electrical parameter which
influences reversibility after electroporation), the difference in their drying times could be
attributed to the electroporated opened stomata. The electroporated opened stomata might
have remained opened for most of the drying period thereby enhancing the rate of moisture
removal during drying.
The difference in drying between samples treated at higher field (1.5 KV/cm) and
samples treated at lower field (0.6 KV/cm) was more obvious after just 25 min of drying. The
diffusion of water from the interior of the leaf tissues to the drying surface controls the rate of
drying (Wang et al., 2007). The mechanism of mass transfer in biological materials is very
complex but in the falling rate period, the drying rate is assumed to be controlled by the
diffusion of moisture from the interior of the leave tissue to the drying surface. The term
effective moisture diffusivity is used to encompass all the known and unknown diffusional
processes occurring at the falling rate period. Moisture diffusivity is affected by composition,
moisture content and porosity of the drying material (Afzal and Abe, 1998). The electric field
increased the permeability of the cell membrane and as a result, the diffusion of water from
the centre of the leave tissues to the drying surface was speeded up.
6.4. Effect of treatments on the quality of the final product
Moisture removal provokes microscopic and macroscopic structural modifications such as
shrinkage and cell collapse that in turn reduces the mass transfer (Barat et al., 2001; Fito and
Chiralt, 2003; Seguí et al., 2010). Shrinkage and tissue disintegration may also lead to texture
and colour changes and lose of nutritional value; resulting in low quality dried products. Any
application which modifies the cellular structure or speed up drying without considerable
disintegration of the cellular tissue of the drying material is thus likely to influence the
quality of the final product. Such effects were observed when trehalose was impregnated into
the leaves prior to drying. The reduced porosity due to the incorporated solute offers some

40
protective action on the cellular structure of the product, which led to less tissue damage and
better rehydration properties. Leave tissues that were reversible electroporated also had less
tissue damage and had higher rehydration ratio compared to leave tissues that were
irreversibly electroporated, though the later dried faster.
Consumers characterise dried products eaten after rehydration by their colour, texture,
and shape resemblance to the raw material. Less colour changes and the ability of dried
products to rehydrate are thus important quality indexes. The colour analysis shows that dried
samples that were reversibly electroporated with the opened stomata electroporated were
more bright, greener and resulted in less total colour change compared to all other dried
samples. Wetting of dried products with water or with saliva during consumption should
liberate nutritional parameters such as aroma which are important quality parameters. The
loss of aroma in air-dried herbs is a major constraint to the marketing of dried herbs. These
effects were observed in the untreated dried samples which exhibited a hay-like flavour
perception but the samples that were reversibly electroporated with the opened stomata
electroporated prior to drying exhibited a distinct oily flavour perception. Reversible
electroporation of opened stomata thus offers the opportunity to conserve aroma compounds
in dried herbs.

41
7. Concluding remarks
The opposite effects of ABA and FC on opening and closure of the stomata resulted in
different drying times, confirming our assertion that stomatal aperture could influence drying
time. Both irreversible membrane permeabilization at high field strength and the reversible
membrane permeabilization of epidermal cells and opened stomata at low field strength
improve mass transport in the leaf tissue and enhance the drying rate, thereby reducing the
drying time compared to the control. Irreversible electroporation of the leaf tissue resulted in
47% reduction in the drying time, reversible electroporation of opened stomata resulted in
37% reduction in the drying time whilst leaves samples that were reversible electroporated
but opened stomata was not electroporated resulted in 18% reduction in the drying time.
Vacuum impregnation with trehalose slightly improved the drying rate and rehydration
properties but resulted in large difference in colour change whist the combination of vacuum
infusion and PEF-treatment did not have any appreciable effect on the drying kinetics
(resulted in large colour change but good rehydration properties). Optimization of PEF
parameters to achieve stomatal electroporation is a difficult process but if attained, could
enhance the drying efficiency even at low field strength.
The quality parameters analysed on the dried herb indicate that reversible electroporation
of opened stomata resulted in less colour change, produced good rehydration properties and
significantly improved the abundance of the aroma compounds relative to the untreated dried
samples. Reversibly electroporation of opened stomata prior to drying thus represent the best
treatment in this studies and indicates the potential of targeting stomata to enhance the rate of
moisture removal during dehydration without irreversible damage of the leave cell membrane
and conserve aroma in dried herbs.
42
8. Acknowledgement
I give thanks to God for bringing me this far, indeed He had never left nor forsaken me. I
would also like to express my sincere gratitude to my supervisor, Prof. Federico Gomez and
my examiner, Prof. Ingegerd Sjöholm for their continuous support. Federico and Ingegerd,
your comments were my key motivation throughout the thesis work.
I gratefully acknowledge the expert assistance of Katarzyna Dymek and Said Al-Hamimi
who respectively helped with the electroporation process and analysis of the aroma
compounds.
My special thanks also go to the staff of the Department of Food Technology, Engineering
and Nutrition. I am exceptionally grateful for your training, motivation and exemplarily life.
This Thesis has been produced during my scholarship period at Lund University, thanks to a
Swedish Institute scholarship.

43
9. References
Ade-Omowaye B. I. O., Rastogi, N. K., Angersbach, A., and Knorr, D. (2003). Combined
effect of pulsed electric field pre-treatment and partial osmotic dehydration on air drying
behaviour of red bell peppers. Journal of Food Engineering, 60: 89-98.
Ade-Omowaye, B. I. O., Rastogi, N. K., Angersbach, A., and Knorr, D. (2001). Effects of
high hydrostatic pressure or high intensity electric field pulse pre-treatment on dehydration
characteristics of red paprika. Innovative Food Science and Engineering Technologies, 2: 1-
7.
Afzal, T. M. and Abe, T. (1998). Diffusion in potato during far infrared radiation drying.
Journal of Food Engineering, 37: 353-365.
Akyol, C., Alpas, H., and Bayindirh, A. (2006). Inactivation of peroxidase and lipoxygenase
in carrots, green beans and green peas by combination of high hydrostatic pressure and mild
heat treatment. European Food Research and Technology, 224: 171-176.
Amami, E., Khezami, L., Vorobiev, E., and Kechaou, N. (2008). Effect of Pulsed Electric
Field and Osmotic Dehydration Pre-treatment on the convective drying of Carrot Tissue.
Drying Technology, 26: 231-238.
Angersbach, A., and Knorr, D. (1997). High intensity electric field pulses as pre-treatment
for affecting dehydration characteristics and rehydration properties of potato cubes.
Nährung, 41: 194-200.
AOAC (1997) Official methods of Analysis of the Association of Official Analytical
Chemist. 16th Edition. Washington, DC.
Armyanov, N., Gachovska, T., Stoyanova, T., and Nedyalkov, N. (2001). An investigation
of longitudinal electrical spark treatment of tobacco leaves brand ``Burley. `` Agricultural
Engineering, Sofia, 2: 39-45.
Arora, R., and Palta, J. P. (1991). A loss in the plasma membrane ATPase activity and its
recovery coincides with incipient freeze-thaw injury and post-thaw recovery in onion bulb
scale tissue. Plant Physiology, 95: 846-852.
Assmann, S. M. (1993). Signal transduction in guard cells. Annual Review of Cell Biology,
9: 345-375.
Assmann, S. M. and Schwartz, A. (1992). Synergistic Effect of Light and Fusicoccin on
Stomatal Opening. Epidermal Peel and Patch Clamp Experiments. Plant Physiology, 98:
1349-1355.

44
Atarés, L., Chiralt, A., and González-Martĩnez, C. (2008). Effect of solute on osmotic
dehydration and rehydration of vacuum impregnated apple cylinders (cv. Granny Smith).
Journal of Food Engineering, 89: 49-56.
Atarés, L., Chiralt, A., and González-Martĩnez, C. (2009). Effect of the impregnated solute
on air drying and rehydration of apple slices (cv. Granny Smith). Journal of Food
Engineering, 91: 305-310.
Barat, J. M., Fito, P., and Chiralt, A. (2001). Modelling of simultaneous mass transfer and
structural changes in fruit tissues. Journal of Food Engineering, 49: 77-85.
Barsotti, L., and Cheftel, J. C. (1999). Food processing by pulsed electric fields. Biological
aspects. Food Review International, 15: 181-213.
Braunsgaard, L., Fuglsang, A. T., Jahn, T., Korthout, H. A. A. J., de Boer, A. H., and
Palmgren, M. G. (1998). The 14-3-3 Proteins Association with Plant Plasma membrane H+-
ATPase to Generate a Fusiciccin Binding Complex and a Fusiciccin responsive System.
Plant Journal, 13: 661-671.
Carcel, J. A., Benedito, J., Rossello, C., and Mullet, A. (2007). Influence of ultrasound
intensity on mass transfer in apple immersed in a sucrose solution. Journal of Food
Engineering, 78: 472-479.
Chalchat, J. C., and Özcan, M. M. (2008). Comparative essential oil composition of flowers,
leaves and stems of basil (Ocimum basilicum L) used as herb. Food Chemistry, 110: 501-
503.
Chen, X. D. (2008). Food drying fundamentals, In: Drying Technologies in Food
Processing, Chen X. D. and Mujumdar A. S. (ed), West Sussex, Blackwell Publishing.
Chiampo, F., Occelli, A., Conti, R. (1997). Hot air dehydration in processing basil. Food
Ingredients, 97: 157-164.
Deng, Y., and Zhao, Y. (2008). Effects of pulsed-vacuum and ultrasound on the
osmodehydration kinetics and microstructure of apples (Fuji). Journal of Food Engineering,
85: 84-93
Di Cesare, L. F., Forni, E., Viscardi, D., and Nani, R. C. (2003). Changes in the Chemical
Composition of Basil caused by different drying procedures. Journal of Agricultural and
Food Chemistry, 51: 3575-3581.
Díaz-Maroto, M. C., Palomo, E. S., Castro, L., Vińas, M. G., and Pérez-Coello, M. S.
(2004). Changes produced in the aroma compounds and structural integrity of basil

45
(Ocimum basilicum L) during drying. Journal of the Science of Food and Agriculture, 84:
2070-2076.
Dodd, C. I. (2003). Hormonal interactions and stomatal responses. Journal of Plant Growth
Regulators, 22: 32-46.
Dymek, K., Dejmek, P., and Gόmez Galindo, F. (2014a). Influence of pulsed electric field
protocols on the reversible permeabilization of rucola leaves. Food and Bioprocess
Technology, 7: 761-773.
Dymek, K., Rems, L., Zorec, B., Dejmek, P., Gόmez-Galindo, F. and Miklavčič (2014b).
Modelling electroporation of the non-treated and vacuum impregnated heterogeneous tissue
of spinach leaves. Innovative Food Science and Emerging Technologies (in press).
Eskin, N. A. M. (1990). Biochemical changes in raw food; fruit and vegetables; V-colour
changes. In: Biochemistry of food, 2nd ed., Academic Press INC., San Diego, CA, pp 90-
119.
Ferrando, M., and Spiess, W. E. L. (2001). Cellular response of plant tissue during the
osmotic treatment with sucrose, maltose and trehalose solutions. Journal of Food
Engineering, 49: 115-127.
Fito, P. (1994). Modelling of vacuum osmotic dehydration of food. Journal of Food
Engineering, 22: 313-328.
Fito, P., and Chiralt, A. (2003). Food matrix engineering: the use of the water-structure-
functionality ensemble in dried food product development. Food Science and Technology
International, 9: 151-156.
Fito, P., and Pastor, R. (1994). Non-diffusional mechanisms occurring during vacuum
osmotic dehydration. Journal of Food Engineering, 21: 513-519.
Fito, P., Chiralt, A., Betoret, N., Gras M., et al., (2001). Vacuum impregnation and osmotic
dehydration in matrix engineering. Application in functional fresh food development.
Journal of Food Engineering, 49: 175-183.
Gachovska, T. K., Adedeji, A. A., Ngadi, M., and Raghavan, G. V. S. (2008). Drying
Characteristics of Pulsed Electric Field-Treated Carrots. Drying Technology, 26: 1244-
1250.
Gang, D. R., Wang, J., Dudareva, N., Nam, K, H., Simon, J. E. et al., (2001). An
investigation of the storage and biosynthesis of phenylpropenes in sweet basil. Plant
Physiology, 125: 539-555.

46
Garcia, P. A., Neal, R. E., Rossmeisl, J. H., and Davalos, R. V. (2010). Non-thermal
irreversible electroporation for deep intracranial disorders. Annual International Conference
of the IEEE Engineering in Medicine and Biology: 2743-6.
Gaschovska, T. K., Simpson, M. V., Ngadi, M. O., and Raghavan, G. S. V (2009). Pulsed
electric field treatment of carrots before drying and rehydration. Journal of the Science of.
Food and Agriculture, 89: 2372-2376.
Gil, A., De La Fuente, E. B., Lenardis, A. E., Lόpez, Pereira, M., Suarez, S. A., et al.,
(2002). Coriander essential oil composition from two genotypes grown in different
environmental conditions. Journal of Agriculture and. Food Chemistry, 50: 2870-2877.
Gόmez-Galindo, F., Wadsö, L., Vicente, A., and Dejmek, P. (2008). Exploring metabolic
responses of potato tissue induced by electric pulses. Food Biophysics, 3: 352-360.
Hibino, M., Shigemori, M., Itoh, H., Nagayama, K., Kinosita, K. (1991). Membrane
conductance of an electroporated cell analysed by submicrosecond imaging of
transmembrane potential. Biophysical Journal, 59: 209-220.
Hlavinka, J., Naus, J., Fellner, M. (2013). Spontaneous mutation 7B-1 in tomato impairs
blue light-induced stomatal opening. Plant Science, 209. 75-80.
Irving, H. R., Gehring, C. A., and Parish, R. W. (1992). Changes in Cytosolic pH and
calcium of Guard Cells Precede Stomatal movements. Proceedings of the National
Academy of Sciences, USA, 98: 1790-1794.
Joersbo, M., Jorgensen, R. B., and Olesen, P. (1990). Transient electropermeabilization of
barley (Hordeum vulgare L.) microspores to propidium iodide. Plant Cell, Tissue and
Organ Culture, 23: 125-129.
Johansson, F., Sommarin, M., and Larsson, C. (1993). Fusicoccin activates the plasma
membrane H+-ATPase by mechanism involving the C-terminal inhibitory domain. Plant
Cell, 5: 321-327.
Johnson, P-N. T., Brennan, J. G., and Addo-Yobo, F. Y. (1998). Air-drying characteristics
of plantain (Musa AAB). Journal of Food Engineering, 37: 233-242.
Kostarpoulos, A. E., and Saravacos, G. D. (1995). Microwave pre-treatment for sun dried
raisins. Journal of Food Science, 60: 344-347.
Krokida, M. K., and Philippopoulos, C. (2005). Rehydration of dehydrated foods. Drying
Technology, 23: 799-830.
47
Kubra, I. R., and Rao, L. J. M. (2012). An impression on current developments in the
technology, chemistry and biological activities of ginger (Zingiber officinale Roscoe).
Critical Review in Food Science and Nutrition, 52: 652-688.
Kwak, J. M., Mori, I. C., Pei, Z. M., Leonhardt, N., Dang, J. L., Schroeder, J. I. (2003).
NADPH oxidase AtrbohD and AtrbohF genes function in ROS-dependent ABA signalling
in Arabidopsis. The EMBO Journal, 22: 2623-2633.
Lachowicz, K. J., Jones, G. P., Briggers, D, R., Bienvenu, F. E., Palmer, m. V., et al.,
(1997). Characteristics of plants and plants extracts from five varieties of basil (Ocimum
basilicum L.) grown in Australia. Journal of Agricultural and Food Chemistry, 45: 2600-
2665.
Lebovka, N. I., Shynkaryk, N. V., and Vorobiev, E. (2007). Pulsed electric field enhanced
drying of potato tissue. Journal of Food Engineering, 78: 606-613.
Lee, J., and Scagel, C. F. (2009). Chicoric acid found in basil (Ocimum basilicum L) leaves.
Food Chemistry, 115: 650-656.
Lee, S. J., Umano, K., Shibamoto, T., Lee, K. G. (2005). Identification of volatile
components in basil (Ocimum basilicum L.) and thyme leaves (Thymus vulgaris L.) and
their antioxidant properties. Food Chemistry, 91; 131-137.
Lewicki, P. P. (1998). Some Remarks on Rehydration of Dried Foods. Journal of Food
Engineering, 36: 81-87.
Lewicki, P. P. (2006). Design of hot air drying for better foods. Trends in Food Science and
Technology, 17: 153-163.
Maldonado, S., Arnau, E., and Bertuzzi, M. A. (2010). Effect of temperature and pre-
treatment on water diffusion during rehydration of dehydrated mangoes. Journal of Food
Engineering, 96: 333-341.
Mariani, V. C., Lima, A. G. B., and Coelho, L. S. (2008). Apparent thermal diffusivity
estimation of the banana during drying using inverse method. Journal of Food Engineering,
85: 569-579.
Martin, R. A., and Maurice, O. M. (2008) Food Microbiology. Third Edition, page 35, 36.
University of Surrey, Guildford, UK.
Miele, M., Dondero, R., Ciarallo, G., and mazzei, M. (2001). Methyleugenol in Ocimum
basilicum L. cv. Genovese gigante. Journal of Agriculture and Food Chemistry, 49: 519-
521.

48
Negi, J., Matsuda, O., Nagasawa, T., Oba, Y., Takahashi, H., Kawai-Yamada, M.,
Uchimiya, H., Hashimoto, M., and Iba, K. (2008). CO2 regulator SLACI and its
homologues are essential for anion homeostasis in plant cells. Nature, 452: 483-486.
Oliver, L., Betoret, N., Fito, P., and Meinders, M. B. J. (2012). How to deal with visco-
eleatic properties of cellular tissue during osmotic dehydration. Journal of Food
Engineering, 110: 278-288.
Özcan, M., Arslan, D., and Ünver, A. (2005). Effect of drying methods on the mineral
content of basil (Ocimum basilicum L.). Journal of Food Engineering, 69: 375-379.
Oztekin, S., and Martinov, M, (2007). Medicinal and aromatic crops: harvesting, drying and
processing. Haworth food agricultural products press, New York, p. 320.
Phoon, P. Y., Galindo, F. G., Vicente, A., and Dejmek, P. (2008). Pulsed electric field in
combination vacuum impregnation with trehalose improves the freezing tolerance of
spinach leaves. Journal of Food Engineering, 88: 144-148.
Pirbalouti, A. G., Mahda, E., and Craker, L. (2013). Effects of drying methods on
quantitative and qualitative properties of essential oil of two basil landraces. Food
Chemistry, 141: 2440-2449.
Rastogi, N. K. (2003). Application of high intensity pulsed electric field in food processing.
Food Reviews International, 19: 229-251.
Sacilik, K., and Elicin, A. K. (2006). The thin layer drying characteristic of organic apple
slices. Journal of Food Engineering, 73: 281-289.
Schroeder, J. I. Allen, G. J., Hugouvieux, V., Kwak, J. M., and Waner, D. (2001). Guard
cell signal transduction. Annu. Rev. Plant Physiol. Plant Molecular Biology, 52: 627-658.
Seguí, L., Fito, P. J., and Fito, P. (2010). Analysis of structure-property relationships in
isolated cells during OD treatments. Effect of initial structure on the cell behaviour. Journal
of Food Engineering, 99: 417-423.
Simon, J. E., Morales, M. R., Phippen, W. B., Vieira, R. F., and Hoa, Z. (1999). Basil: A
source of aroma compounds and a popular culinary and ornamental herb. In: Perspective on
New Crops and New Uses (Janick, J., and Alexandria, V. A. eds.), pp 499-505, ASHS
Press, Alexandria, VA.
Talbott, L. D., and Zeiger, E. (1998). The role of sucrose in guard cell osmoregulation.
Journal of Experimental Botany, 49: 329-337.
Toledo, R. T. (1999) Fundamentals of Food Process Engineering, 2nd edn. Aspen
Publishers, Aspen, MA.

49
USDA-United States Department of Agriculture, national Nutrient Database for Standard
Reference Release 27.
Velickova, E., Tylewicz, U., Della Rosa, M., Winkelhausen, E., et al., (2013). Effect of
vacuum infused cryoprotectants on the freezing tolerance of strawberry tissues. Journal of
Food Engineering, 52: 146-150.
Venskutonis, P. R., Poll, L., and Larsen, M. (1996). Influence of drying and irradiation on
the composition of the volatile compounds of thyme (Thymus vulgaris L.). Flavour and
Fragrance Journal, 11: 123-128.
Vierira R. F., and Simon, J. E (2000). Chemical characterization of basil (Ocimum
bacilicum L.) found in the markets and used in traditional medicine in Brazil. Economic
Botany, 54; 207-206. Abdul-baki, A. A. (1992). Determination of pollen viability in
tomatoes, Journal of American Society for Horticultural Science, 117: 473-476.
Wang, W., Chen, G., and Mujumdar, A. S. (2007). Physical interpretation of solids drying.
An overview on mathematical modelling research. Drying Technology, 25: 659-668.
Wang, X-Q., Ullah, H., Jones, A. M., and Assmann, S. M. (2001). G protein regulation of
ion channels and abscisic acid signalling in Arabidopsis guard cells. Science, 290: 2070-
2072.
Wu, Y., Guo, Y., and Zhang, D. (2011). Study of the effect of High-Pulsed Electric Field
Treatment on Vacuum Freeze-Drying of Apples. Drying Technology. 29: 1714-1720.