Embed Size (px)
Citation preview
Luiz Fernando RollaChief Officer for Finance, Investor Relations and Control of Holdings
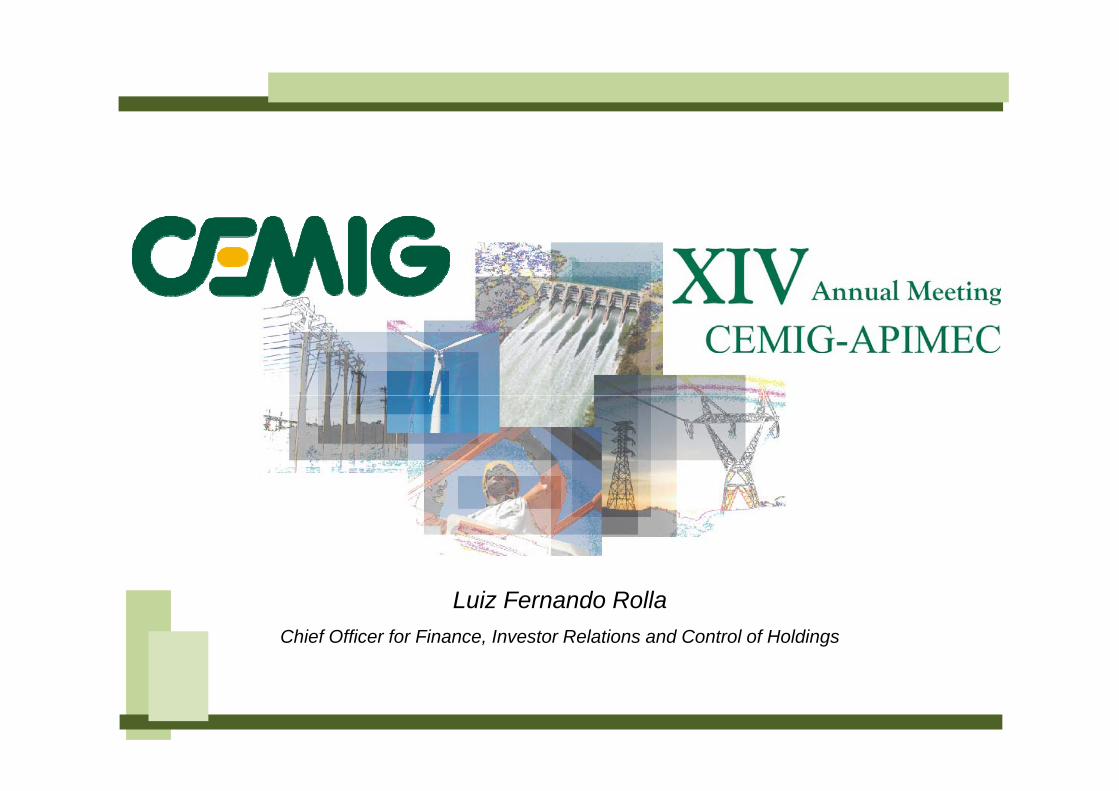
Stockholding base ensures liquidityEUROPE
Canada United States
NORTH AMERICA LuxemburgUnited Kingdom
SpainSwitzerland
Ireland
JerseyHollandFranceNorway
Denmark
GermanyBelgiumAustria
PortugalPoland
ASIA
IrelandGuernsey
DenmarkItaly
Sweden
PolandRomania
BruneiSingapore
NYSECIG.CCIG
Latibex
Central America SingaporeSouth Korea
JapanMalaysia
China
BermudaBahamas
Cayman IslandsMexico
Turks and Caicos I.Virgin Islands
CIG
Middle EastSaudi Arabia
UAEKuwait
Lebanon
BovespaCMIG3CMIG4
Australia
South America
OCEANIA
ArgentinaBoliviaBrazilChile
OmanSyria
Average daily trading(2008)
April 2009
AustraliaUruguay
• Cemig’s shares are traded on 3 stock exchanges
2
(2008)
Bovespa: R$ 64 million
NYSE: US$ 33 million
• Cemig s shares are traded on 3 stock exchanges
• 118,000 stockholders in 46 countries
Long‐term commitment to stockholders
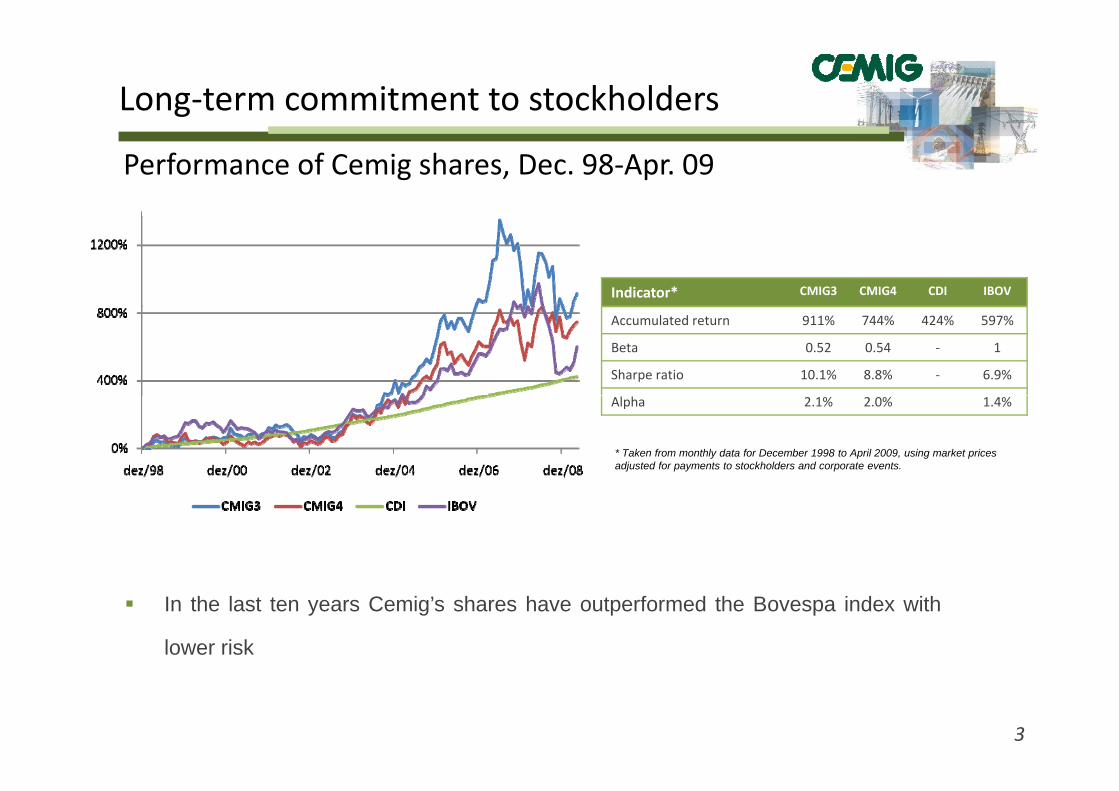
Performance of Cemig shares, Dec. 98‐Apr. 09
Indicator* CMIG3 CMIG4 CDI IBOV
Accumulated return 911% 744% 424% 597%
Beta 0.52 0.54 ‐ 1
Sharpe ratio 10.1% 8.8% ‐ 6.9%
Alpha 2.1% 2.0% 1.4%
* Taken from monthly data for December 1998 to April 2009, using market prices adjusted for payments to stockholders and corporate events.
In the last ten years Cemig’s shares have outperformed the Bovespa index with
lower risk
3
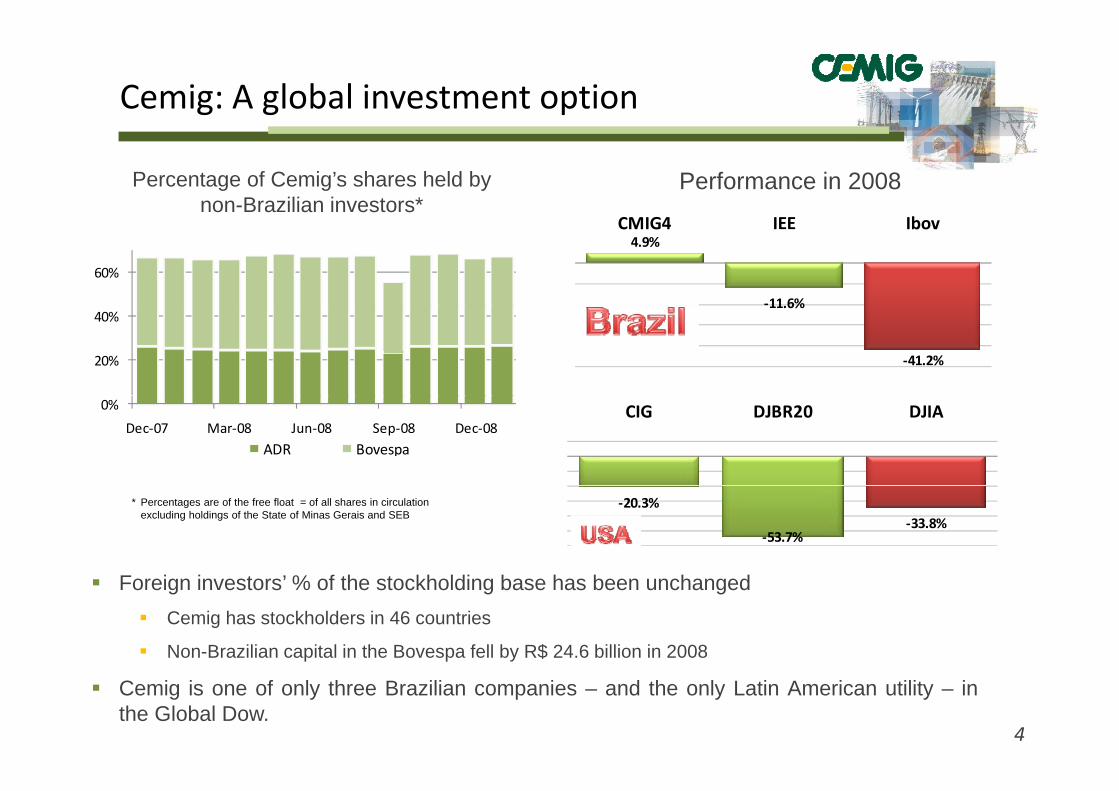
Cemig: A global investment option
Percentage of Cemig’s shares held by non-Brazilian investors*
Performance in 2008
4.9%
‐11.6%
CMIG4 IEE Ibov
60%
11.6%
‐41.2%20%
40%
CIG DJBR20 DJIA0%
Dec‐07 Mar‐08 Jun‐08 Sep‐08 Dec‐08ADR Bovespa
‐20.3%
‐53.7%‐33.8%
F i i ’ % f h kh ldi b h b h d
* Percentages are of the free float = of all shares in circulation excluding holdings of the State of Minas Gerais and SEB
Foreign investors’ % of the stockholding base has been unchangedCemig has stockholders in 46 countries
Non-Brazilian capital in the Bovespa fell by R$ 24.6 billion in 2008
4
Cemig is one of only three Brazilian companies – and the only Latin American utility – inthe Global Dow.

Management of capital
Negotiation with creditors: align financial covenants / reduce cost
Pre-payment of debts: studied, and implemented
Management of financial risk (volatility of indexors)g ( y )
Continuous analysis of whether appropriate to use derivatives / timing
M it i f th li it l id d i C i ’ L t St t i PlMonitoring of the limits laid down in Cemig’s Long-term Strategic Plan:
Debt / Ebitda : less than or equal to 2.5
Debt / (Stockholders’ equity + Debt) : less than or equal to 50%
Compliance with credit quality parameters of the regulator, ratingCo p a ce t c ed t qua ty pa a ete s o t e egu ato , at g
agencies and creditors
5

Debt profile lengthened, costs reduced
Average real cost (%)Average real cost (%)Average cost of debt: 7.27 % p.a. (constant March 2009 prices), including holdings
Resumption in national monetary policy of reduction of7,4
8,69,7 9,0
7,37.48.6
9.7 9.07.3
M t iti ti t bl
Resumption, in national monetary policy, of reduction of interest rates points to reduction of cost of debt
mar/08 jun/08 set/08 dez/08 mar/09mar/08 jun/08 sep/08 dec/08 mar/09
Average tenor: 4 years
Maturities timetableManagement of debt focused on:
Lengthening of tenor (without pressure on cash flow)
1,295 1 101
1,235 cash flow)
Limitation of debt to levels set in the Bylaws
Reduction of cost of debt
847 895
1,101 1,047
444
220
493
Reduction of cost of debt
2009 2010 2011 2012 2013 2014 2015 2016 2017 –2031
6
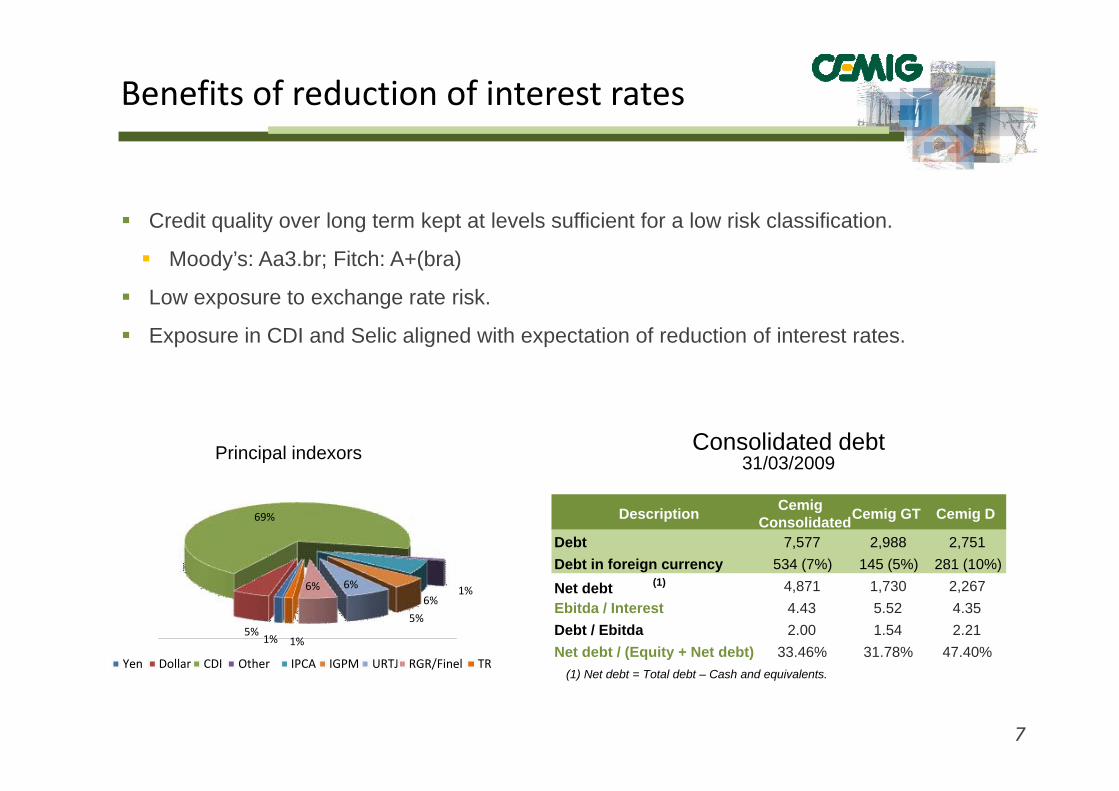
Benefits of reduction of interest rates
C dit lit l t k t t l l ffi i t f l i k l ifi tiCredit quality over long term kept at levels sufficient for a low risk classification.
Moody’s: Aa3.br; Fitch: A+(bra)
Low exposure to exchange rate risk.p g
Exposure in CDI and Selic aligned with expectation of reduction of interest rates.
Consolidated debt31/03/2009Principal indexors
Description Cemig ConsolidatedCemig GT Cemig D
Debt 7,577 2,988 2,751Debt in foreign currency 534 (7%) 145 (5%) 281 (10%)
69%
Net debt (1) 4,871 1,730 2,267Ebitda / Interest 4.43 5.52 4.35Debt / Ebitda 2.00 1.54 2.21Net debt / (Equity + Net debt) 33.46% 31.78% 47.40%
1%5%
1%6%
5%
6%6%
1%
Yen Dollar CDI Other IPCA IGPM URTJ RGR/Finel TR
7
(1) Net debt = Total debt – Cash and equivalents.Yen Dollar CDI Other IPCA IGPM URTJ RGR/Finel TR
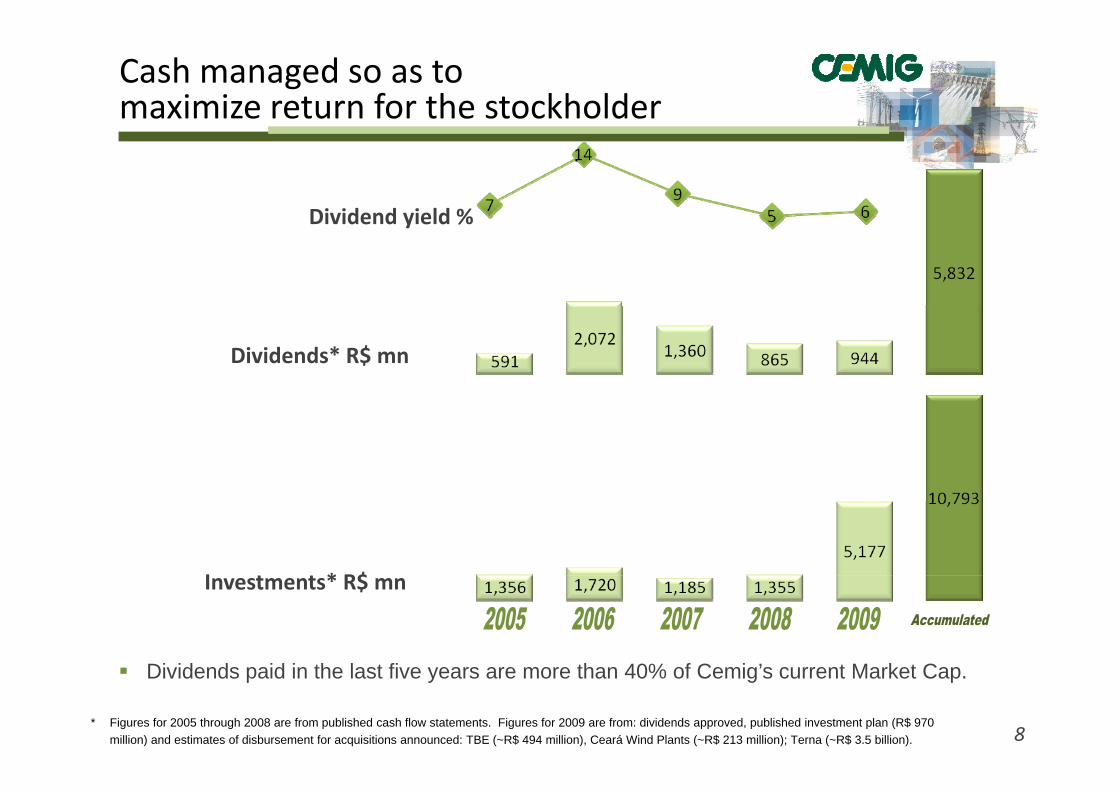
Cash managed so as to maximize return for the stockholder
Dividend yield %Dividend yield %
Dividends* R$ mn
I * R$Investments* R$ mn
Di id d id i th l t fi th 40% f C i ’ t M k t C
8
Dividends paid in the last five years are more than 40% of Cemig’s current Market Cap.
* Figures for 2005 through 2008 are from published cash flow statements. Figures for 2009 are from: dividends approved, published investment plan (R$ 970 million) and estimates of disbursement for acquisitions announced: TBE (~R$ 494 million), Ceará Wind Plants (~R$ 213 million); Terna (~R$ 3.5 billion).
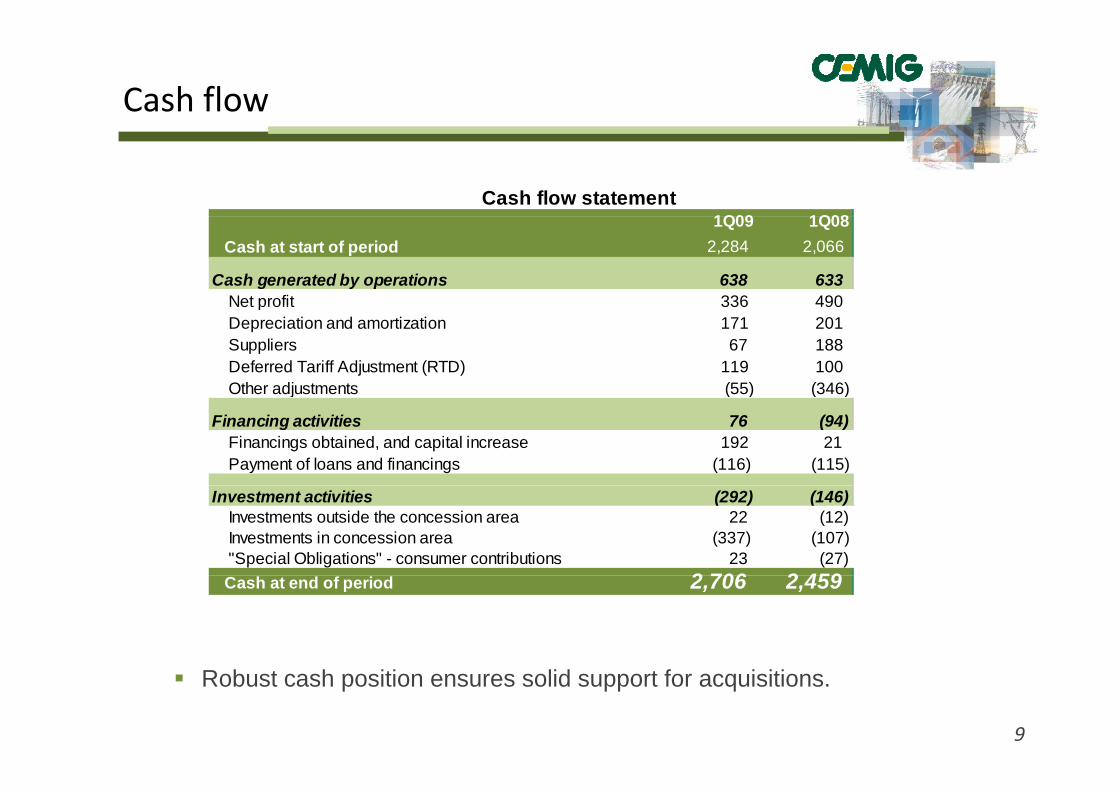
Cash flow
1Q09 1Q08Cash flow statement
1Q09 1Q08Cash at start of period 2,284 2,066
Cash generated by operations 638 633 Net profit 336 490Net profit 336 490 Depreciation and amortization 171 201 Suppliers 67 188 Deferred Tariff Adjustment (RTD) 119 100 Other adjustments (55) (346)j ( ) ( )
Financing activities 76 (94) Financings obtained, and capital increase 192 21 Payment of loans and financings (116) (115)
Investment activities (292) (146) Investments outside the concession area 22 (12) Investments in concession area (337) (107) "Special Obligations" - consumer contributions 23 (27)
2 706 2 459Cash at end of period 2,706 2,459
9
Robust cash position ensures solid support for acquisitions.

Management of holdings
CIA. ENERGÉTICADE MINAS GERAIS
Cia. Translestede Transmissão
25%
Cia. Transirapéde Transmissão
24.5%
CEMIGGeração e
Transmissão S.A.100%
Rio Minas EnergiaParticipações S.A.
25%
Light S.A.
52.1%
CEMIGDistribuição S.A.
100%
Cia. de Gás deMinas Gerais
55.2%
Efficientia S.A.
100%
Usina TérmicaIpatinga S.A.
100%
CEMIG PCH S.A.100%
Cia. de TransmissãoCentroeste de Minas
51%
Cia. Transudestede Transmissão
24%
HidrelétricaCachoeirão S.A
49%
ConsórcioAHE Funil
49%
Consórcio daUsina Hidrelétrica de
Aimorés49%
Guanhães Energia S.A.
49%
Light Energia S.A.
100%
Lightger Ltda.
100%
CEMIG Trading S.A.
100%
Axxiom Soluções Tecnológicas S.A.
49%
ConsórcioPCH ParacambiCEMIG GT:49%
Lightger: 51%
ConsórcioPCH Lajes
CEMIG GT:49% Light Energia: 51%
Horizontes Energia S.A.
100%
Sá Carvalho S.A.
100%
Empresa Catarinensede Transmissãode Energia S.A.
7.49%
Transchile CharrúaTransmisión S.A.
49%
Consórcio daUsina Hidrelétrica
de Igarapava14.5%
Consórcio AHE Porto Estrela
33.33%
Madeira Energia S.A.
10%
ItaocaraEnergia Ltda.
100%
Lighthidro Ltda.
100%
Centro de GestãoEstratégica de
Tecnologia100%
Empresa deInfovias S.A.
99.99%Santo AntônioEnergia S.A.
100%
ConsórcioUHE Itaocara
CEMIG GT:49% Itaocara Energia: 51%
Rosal Energia S.A.
100%
Usina TermelétricaBarreiro S.A.
100%
Empresa Regionalde Transmissãode Energia S.A.
18.35%
Empresa Paraensede Transmissãode Energia S.A.
VS: 25% TS: 19.47%
ConsórcioAHE Queimado
82.5%
Instituto Lightde Desenvolvim.Social e Urbano
100%
Light EscoPrest. Serviços
Ltda.100%
CEMIG Serviços S.A.
100%
Hidrelétrica Pipoca S.A
49%
CEMIG Baguari Energia S.A.
100%
EBL Companhia de Eficiência
Energética S.A.33%
Central Termelétrica de Cogeração S.A.
100%
Central HidrelétricaPai Joaquim S.A.
100%
LIR Energy Ltd.100%
Empresa Nortede Transmissãode Energia S.A.
18.35%
Empresa Amazonensede Transmissãode Energia S.A.
VS: 25% TS: 17.42%
Baguari Energia S.A.
69.39%
Consórcio UHE Baguari
49%
Light Serviçosde Eletricidade
S.A.100%
STC–Sistema de Transmissão
Catarinense S.A.80%
ConsórcioCapim Branco
Energia21.5%
CEMIG Capim BrancoEnergia S.A.
100%
Key
10
LUMITRANS Companhia Transmissora de Energia Elétrica
80%
Empresa Brasileirade Transmissãode Energia S.A.
CEMIG GT:49% EATE: 51%
VS = Voting StockTS = Total Stock
Transmission CompaniesDistribution CompaniesGeneration CompaniesGeneration ConsortiaFinancial OperationsNon-profit
yGas DistributionTelecommunicationsTradingHoldingServices
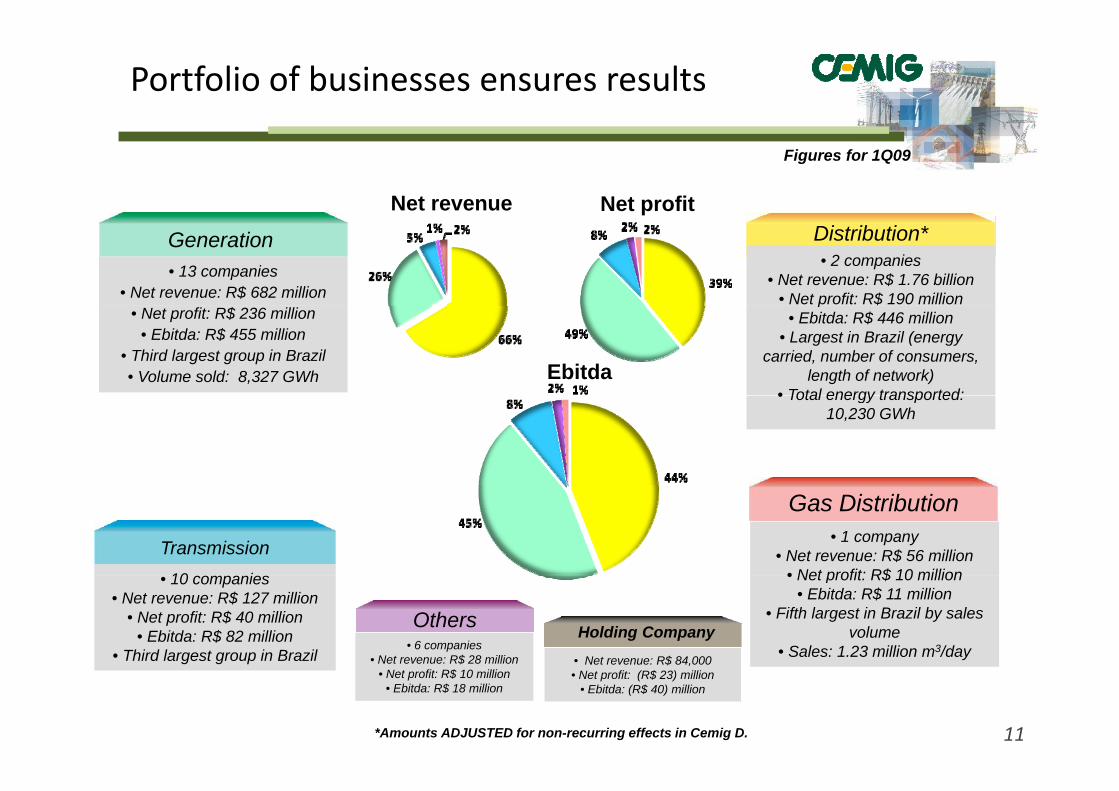
Portfolio of businesses ensures results
Net profitNet revenue
Figures for 1Q09
• 13 companies• Net revenue: R$ 682 million
• 2 companies• Net revenue: R$ 1.76 billion
• Net profit: R$ 190 million
Distribution*Generation
• Net profit: R$ 236 million• Ebitda: R$ 455 million
• Third largest group in Brazil• Volume sold: 8,327 GWh
p• Ebitda: R$ 446 million
• Largest in Brazil (energy carried, number of consumers,
length of network)• Total energy transported:
Ebitda• Total energy transported:
10,230 GWh
Transmission10 i
• 1 company• Net revenue: R$ 56 million
• Net profit: R$ 10 million
Gas Distribution
• 10 companies• Net revenue: R$ 127 million
• Net profit: R$ 40 million• Ebitda: R$ 82 million
• Third largest group in Brazil
• Net profit: R$ 10 million• Ebitda: R$ 11 million
• Fifth largest in Brazil by sales volume
• Sales: 1.23 million m3/day
Others• 6 companies
• Net revenue: R$ 28 million
Holding Company• Net revenue: R$ 84,000
11*Amounts ADJUSTED for non-recurring effects in Cemig D.
• Net profit: R$ 10 million• Ebitda: R$ 18 million
$ ,• Net profit: (R$ 23) million
• Ebitda: (R$ 40) million
Investor [email protected]
Telephone: (55‐31) 3506‐5024Telephone: (55‐31) 3506‐5024Fax: (55‐31) 3506‐5025