Embed Size (px)
Citation preview
1
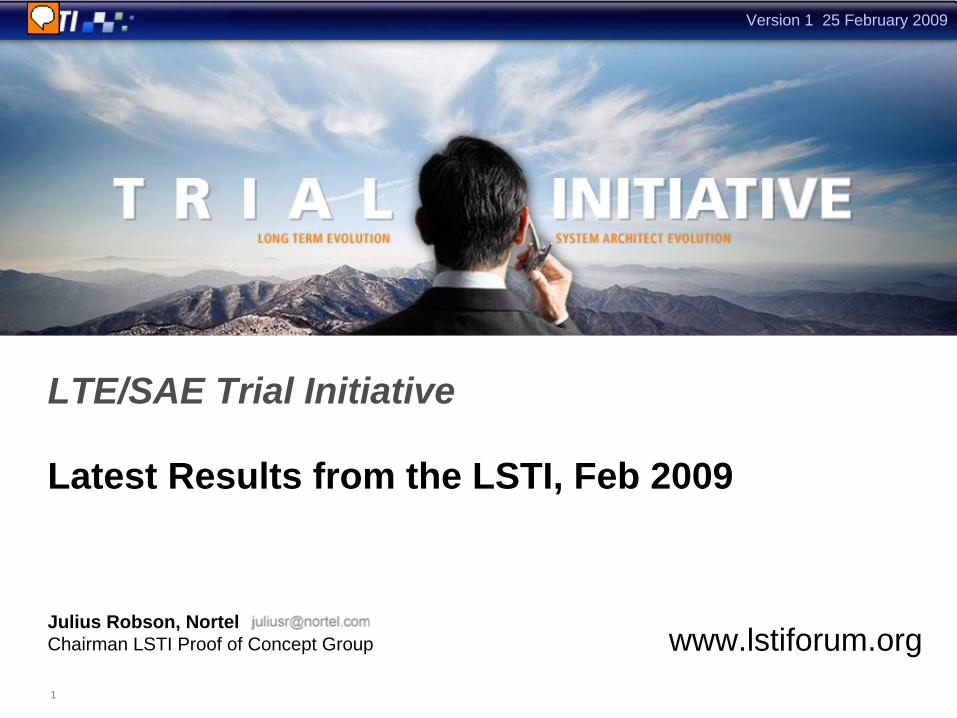
LTE/SAE Trial Initiative
Latest Results from the LSTI, Feb 2009
www.lstiforum.orgJulius Robson, Nortel Chairman LSTI Proof of Concept Group
Version 1 25 February 2009
2
Contents
• LSTI’s Objectives
• Who’s involved?
• LSTI Activities• Latest results from the Proof of Concept Group• Inter-Operability Testing • Friendly Customer Trials
• Activity timelines
• Summary
Version 1 25 February 2009

3
The LTE /SAE Trial Initiative
• The LSTI is an open initiative driven by Vendors and Operators launched in May 2007
• Its objectives are to:• Drive industrialization of 3GPP LTE/SAE technology• Demonstrate LTE/SAE capabilities against 3GPP and NGMN requirements
• Stimulate development of the LTE/SAE ecosystem
Version 1 25 February 2009
4
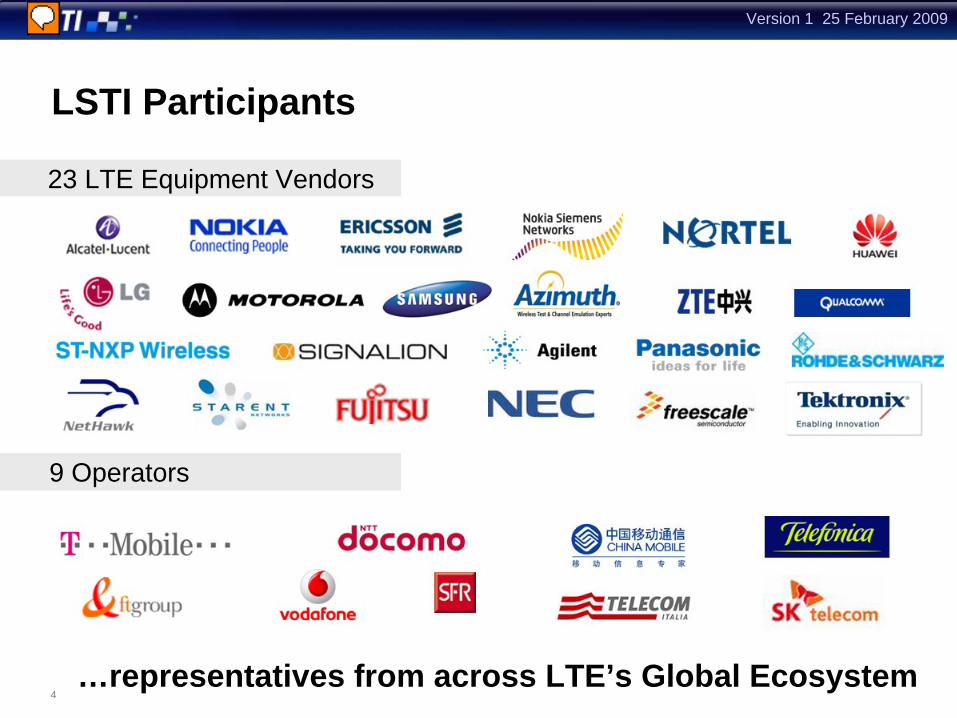
LSTI Participants
…representatives from across LTE’s Global Ecosystem
23 LTE Equipment Vendors
9 Operators
Version 1 25 February 2009

5
LSTI Activities
From Standardisation…
…to Commercial Rollout
Proof of ConceptCan the design be implemented? Are the performance targets achievable?
InteroperabilityDoes everyone have the same interpretation of the standard?
Friendly Customer Trials
What can it deliver in near commercial conditions?
Version 1 25 February 2009

6
Latest Results From the Proof of Concept Activity
Demonstrating that basic LTE/SAE functionality and performance are achievable with pre-standards proprietary equipment
Version 1 25 February 2009

7
“Proving The Concept” of LTE/SAE
Early testing focused on fundamental performance in ideal conditions…
Multi Cell Live Air
Handover
VoIPReal worldData rates
Peak data rates
Radio latency
Vehicle speeds
MIMOgains
Lab tests Multi User End-End
QoSMulti userscheduling
ConnectionSetup time
…later tests required end to end architecture and real world scenarios
Version 1 25 February 2009

8
Proofpoint Status
Each filled circle represents one set of vendors tests which demonstrate the proofpoint is feasible
Proved in
Proved In
Observed: LSTI Operators visited the vendor’s test facilities and observed successful demonstration of the proofpoint
A status indicator shows industry progress for each proofpoint
Version 1 25 February 2009

9
PoC Results
Part 1) Data Rates How much will you get?
LTE is designed to deliver over 320 Mbps throughput…But what can be achieved in practice?And what data rates will users actually experience?
Part 2) Latency How quickly will you get it?
Version 1 25 February 2009
10
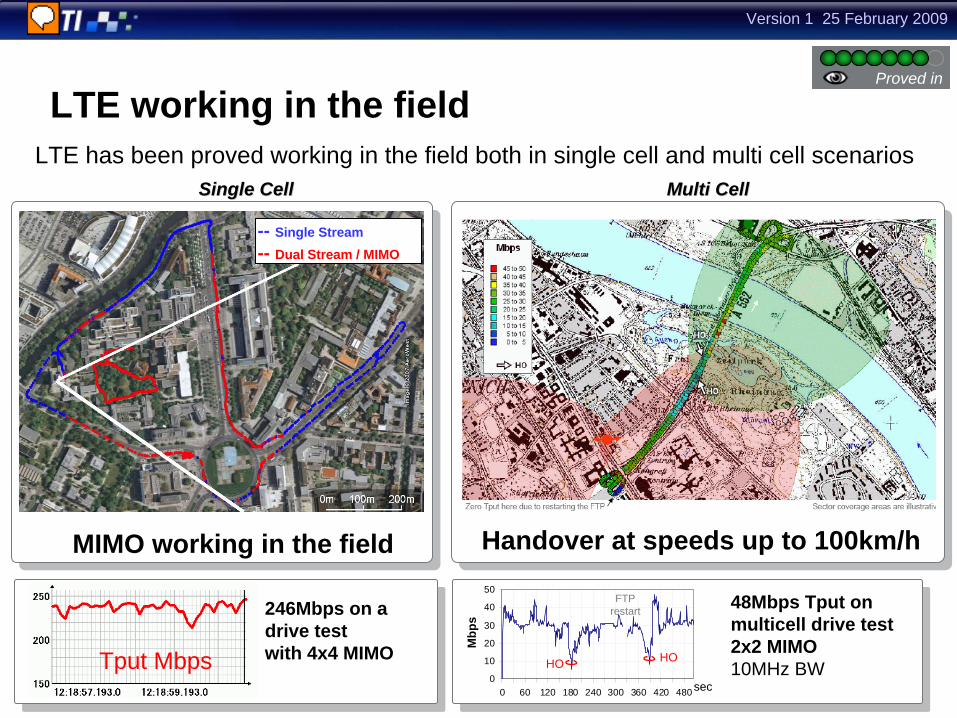
246Mbps on a drive test with 4x4 MIMO
LTE has been proved working in the field both in single cell and multi cell scenarios
Tput Mbps
MIMO working in the field
-- Single Stream-- Dual Stream / MIMO
LTE working in the field
Handover at speeds up to 100km/h
48Mbps Tput on multicell drive test2x2 MIMO 10MHz BW
Single CellSingle Cell Multi CellMulti Cell
0
10
20
30
40
50
0 60 120 180 240 300 360 420 480
FTPrestart
HO HO
Mbp
s
sec
Proved in
Version 1 25 February 2009

11
Peak Data Rates & Spectral EfficiencyProved in
Peak rates are the top speed of the system …achieved in optimal signal conditions with a single user in the cell
Requirements are 100Mbps or 5bps/Hz for DL, and 50Mbps or 2.5bps/Hz for UL
Measured Peak rates in lab and field meet the requirements
TD-LTE
0
50
100
150
200
250
300
350
0 0.2 0.4 0.6 0.8 1
Mbp
s
LTE-FDD
UL 64QAM
DL 2x28.6bps/Hz
DL 4x4
0
1
2
3
4
5
6
7
8
9
0 0.2 0.4 0.6 0.8 1
bps/
Hz
UL 16QAM2.8bps/Hz
DL 2x2
UL 64QAM
UL 16QAM
Code rate Code rate
L1 p
k ra
te, M
bps
L1 S
pect
ral E
ffici
ency
, bps
/Hz
Lab resultsField resultsDL targetUL target
results normalized 3GPP overheads & 20MHz bandwidth
Version 1 25 February 2009
12
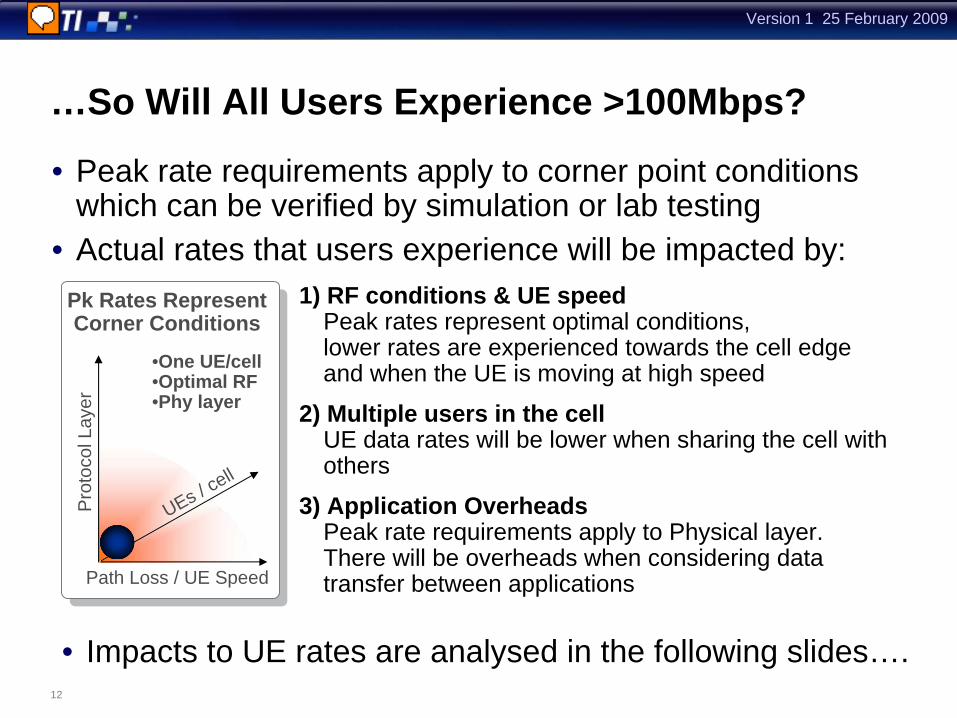
…So Will All Users Experience >100Mbps?
• Peak rate requirements apply to corner point conditions which can be verified by simulation or lab testing
• Actual rates that users experience will be impacted by:
UEs / cell
Path Loss / UE Speed
Pro
toco
l Lay
er
1) RF conditions & UE speed Peak rates represent optimal conditions, lower rates are experienced towards the cell edge and when the UE is moving at high speed
2) Multiple users in the cell UE data rates will be lower when sharing the cell with others
3) Application Overheads Peak rate requirements apply to Physical layer. There will be overheads when considering data transfer between applications
• Impacts to UE rates are analysed in the following slides….
Pk Rates RepresentCorner Conditions
•One UE/cell•Optimal RF•Phy layer
Version 1 25 February 2009

13
0%
20%
40%
60%
80%
100%
5 10 15 20 25
SNR, dB
Tput
rela
tive
to p
eak
Radio Conditions – Signal quality
Peak rates are achieved with high signal quality near the base station
Tput is lower towards the cell edge
Cell edge Near base
Tput vs SNR typical example DL result
Example results shown, similar behaviour observed
for SM MIMO, SIMO and SFBC and UL SIMO
Version 1 25 February 2009

14
0%
20%
40%
60%
80%
100%
5 10 15 20 25
SNR, dB
Tput
rela
tive
to p
eak
3 kmh 30 kmh120 kmh240 kmh350 kmh
Radio Conditions – UE Speed
Resiliency of LTE prototypes to high user speeds is tested in the lab
Initial results demonstrate support of up to 350km/h
Little impact to throughput is seen at speeds up to 120km/h
Cell edge Near base
Tput vs SNR typical example DL result
Example results shown, similar behaviour observed
for SM MIMO, SIMO and SFBC and UL SIMO
Proved-in
Version 1 25 February 2009

15
0
5
10
15
20
25
Predicted End User Data RatesProved in
Active Downloads per cell4 5 6 7 8 92 31 10 20
avecell edge
Peak, single cell
Bottom 5%
Average
Top 5%, loaded
Predicted end-user Tputs based on LSTI lab measurements align with NGMN Targets for ‘cell edge’ and average Tput
End
user
Tpu
t, M
bps
Consolidated measurements show cell edge and average user Tputs with ‘busy hour’ interference levels and 1 UE/cell,
The green area is an extrapolation showing the variation of user data rates…
..from the best case Peak rate in an isolated cell
..to the worst caseBottom 5%-ile in busy hour
LSTI Measurements(1 UE / cell)
NGMN Targets(10 UEs/cell)Extrapolation assuming
a fair scheduler
for 20MHz bandwidth
Version 1 25 February 2009

16
frequency
pwr UE1 UE2
Multiple Users per Cell - DownlinkProved-in
The scheduler can exploit different frequency responses of each UE’s channel, to increase cell Tput
0
10
20
0 10 20 30SNR (dB)
2UEs1UE
Cel
l Tpu
t Mbp
s
Idle UEs
Active UEs
At any given instant, the cell’s spectral resource is shared between all
active users
Frequency Selective Scheduling
Lab test with flat AWGN channels
Active
L1 T
put,
Mbp
s
Sharing of Downlink Tput
Version 1 25 February 2009

17
Multiple Users per Cell - Uplink Proved-in
The LTE Uplink has Multi-User MIMO, which pairs-up UEs to
share the same UL resource to increase cell Tput
% U
sage MU
-MIM
O
0%
100%
Sharing of Uplink Throughput during a drive test
Idle UEsActive UEs Paired-up
Good
GoodMed
Med
MedGood
PoorPoorPoor
Multi UE Uplink Tput with various mixes of RF conditions
Mbp
s
Cell Tput depends on the mix of RF conditions
for the active UEs
Version 1 25 February 2009

18
Proved In
Throughput at the Application Layer
Note IP packet size affects the amount of protocol overhead
Over-the-air bitsCoding, Control,
HARQ Ref signals L1- (PHY) Tput
MAC TputMACheader
TCP/UDP TputRLC PDCP, IP & TCP/UDP headrs
Applicationheader Application TputNot to scale
Throughput requirements are specified at L1 (Physical Layer)Measurements show the difference between L1 & Application to be small for large packets (e.g. File Transfer)
Lab measurement (10 MHz, SIMO) Field measurement (20 MHz, 2x2 MIMO)
0 20 40 60 80 100 120 140 1600
10
20
30
40
50
60
70
80
90
100
Throughput [Mbps]
CD
F [%
]
TCPLayer 1
L1APP
0
5
10
15
20
25
30
0 10 20 30SNR (dB)
Mbp
s
L1 (AMC + HARQ)Application Layer
Version 1 25 February 2009

1919
Guaranteed Bit Rate Support
Since end user data rates can vary with radio conditions and network loading, LTE has to provide Guaranteed Bit Rate (GBR) links, in order to support streaming services such as IPTV or internet radio
Several vendors have demonstrated that constant bit rates can be maintained independently of signal quality and other traffic on the cell
Proved in
GuaranteedBit Rate pipe
The GBR user is allocated resource to maintain their desired rate. The best effort user is given the rest
Best effortBest effort
GBR
Cell edge
Version 1 25 February 2009

20
PoC Results
Part 1) Data Rates How much will you get?
Part 2) Latency How quickly will you get it?
To provide an ‘always on’ experience, LTE/SAE requires low delays for both user data and control of resources
Stopwatch by P.Neal www.PNeal.com
Version 1 25 February 2009

21
0 20 40 60 80 100 120
Measured Idle-Active TimesMeasured with one UE/cell
Control-Plane Latency: Idle to Active time
• To provide many users with an ‘always-on’ experience, LTE is designed with a low idle to active transition time
• All UEs sit in an idle state when there is no data to transfer – but can be activated quickly when they need to communicate
Idle UEs
Active UEs
Proved in
Measured idle to active times meet the 100ms requirement
3GPP target 100ms
activeidle
ms
Version 1 25 February 2009
22
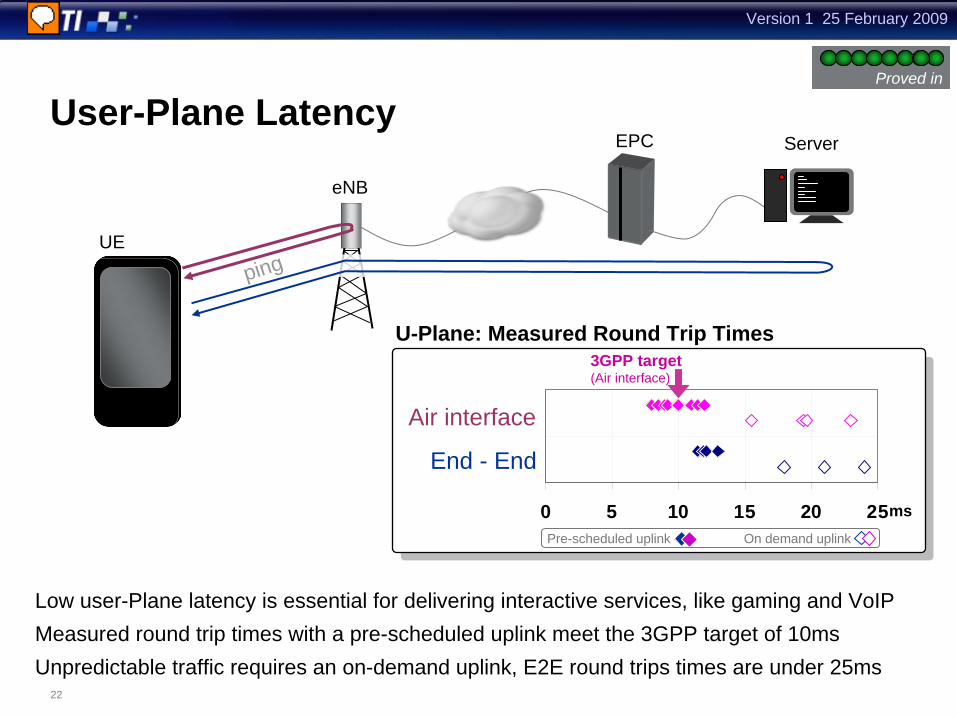
User-Plane Latency DRAFT
Low user-Plane latency is essential for delivering interactive services, like gaming and VoIPMeasured round trip times with a pre-scheduled uplink meet the 3GPP target of 10msUnpredictable traffic requires an on-demand uplink, E2E round trips times are under 25ms
Proved in
ServerEPC
eNB
UE
ping
Air interface
End - End
3GPP target (Air interface)
U-Plane: Measured Round Trip Times
Pre-scheduled uplink
msOn demand uplink
0 5 10 15 20 25
Version 1 25 February 2009

23
VoIP Support DRAFTProved in
Server withVoIP Test Tool
EPC
eNB
Best effort loading
VoIPQoS Measured Performance in loaded conditions
Packet LossPacket Latency(one way)
Jitter
=acceptable performance0
0,10,20,30,40,50,6
%
0
10
20
30
40
50
ms
0
10
20
30
40
50
ms
As with data rates, latency can be impacted by signal conditions and loading
Tests in ideal lab conditions have demonstrated that LTE/SAE is capable of providing IP connectivity with sufficient latency, jitter and packet loss performance to support good quality VoIP, even in the presence of other traffic.
Operators observed good quality VoIP maintained in live air drive tests with handover
Version 1 25 February 2009

24
Uplink Transmit Power Control
-70
-60
-50
-40
-30
-20
-10
0
10
20
30 40 50 60 70 80 90Pathloss (dB)
Pow
er (d
Bm
)
UE Tx Power (dBm)UL Rx Power (dBm)
Three companies demonstrated open and closed-loop TPC working in the lab or field. Results shows TPC maintaining desired UL received power at eNB to compensate for path loss.
Normal Power Control
Fractional Power Control
0
0.5
1
1.5
2
70 80 90 100 110 120
CTPCFractional TPC
Thro
ughp
ut (M
bps)
Measured path loss (dB)
An initial result shows Fractional TPC increases Tput near the base station with only a small increases in interference to other cells
Proved in
Path loss PL0
Po
Near cell site Cell edge user
Targ
et R
x po
wer
Factor : -(1 – )
Target Rx power is low for cell edge user to reduce the interference to
Path loss PL0
Po
Near cell site Cell edge user
Targ
et R
x po
wer
Factor : -(1 – )
Target Rx power is low for cell edge user to reduce the interference to neighbour cell
Version 1 25 February 2009

25
Measurement Functionality
The UE must perform measurements and report them back to the eNB, for use in Radio Resource Management decisions.
The above example shows UE measurements of pilot signals from two cells. The eNB performs a handover once the new cell is consistently stronger.
UE Measurements have also be shown to enable uplink power control, frequency selective scheduling and link adaptation
Proved in
-100
-95
-90
-85
-80
-75
-70
-65
-60
17:23:19.783 17:23:22.662 17:23:25.652 17:23:28.773 17:23:31.652
RSR
P (d
Bm
)
CellID 184CellID 185
Handover
time
Version 1 25 February 2009

26
HandoverProved in
SourceeNB
TargeteNB
S1 S1
X2
EPC:Gateway& MME
Intra eNB handover
Inter eNB handover
• Inter-eNB and intra-eNB handovers demonstrated in the lab and field at up to 120 km/h
• Data interruption times under 50ms achieved, meeting NGMN’s ‘real time service’ requirement
• Both S1 and X2-assisted handovers demonstrated• X2 Improves handover performance and
reduces loading on MME
Version 1 25 February 2009

27
Summary of PoC Results
• Over 80 sets of tests from 8 vendors consolidated into 15 proofpoints, demonstrating feasibility of key LTE/SAE functionality and performance:• 3GPP and NGMN targets for peak data rates and minimum
latency are achievable for both FDD and TDD variants• ‘Real world’ performance results are also given, helping
operators understand what can be offered to end users• QoS has been demonstrated to provide the consistent data
rates and latency needed to support services like VoIP• Benefits of MIMO, Frequency Selective Scheduling and
fractional power control technologies are shown• Demonstration of key functionality like Handover and UE
measurement reporting shows the maturity of developments
LTE/SAE does exactly what it says on the box
Version 1 25 February 2009

28
Interoperability Testing (IOT)
• Successful IOT shows that everybody has the same interpretation of the standard, implying a level of maturity
• LSTI agrees and recommends a core set of features for interoperability testing on the LTE/SAE interfaces
eNB
Uu
S1 S1
X2
EPC
eNB
• First phase: IODT (D=Development)• Focus on the Air interface: IOT between UEs and eNBs• Feature set and standards baselines agreed• Testing underway, reporting during Q2-Q4 2009
• Second phase: IOT• Extra features and multiple partners
for the Air Interface• S1 and X2 testing, requiring multiple
RAN and EPC vendors• Expected to complete mid 2010
Version 1 25 February 2009

29
Friendly Customer Trials
• The friendly user trial phase enables Vendors and Operators to prepare for deployment and commercial launch• Visualize LTE capabilities and advantages in nearly commercial conditions
with test applications provided by vendors and 3rd parties
• Status• Trial test cases based on NGMN field trial requirements have been drafted
and are under peer review• Content and timing of phases agreed:
1) Early testing of Radio access systems – by end 2009
2) Integration of EPC to enable End-to-end testing – by mid 2010
Version 1 25 February 2009

30
LSTI Activity Timing
2007 2008 2009 2010
IODT preparation
IOT preparation
Friendly Customer Trials preparation
Proof of Concept
PR/Marketing
Version 1 25 February 2009

31
In Summary, The LTE/SAE Trial Initiative….
…is an open initiative of vendors and operators working together to accelerate the development of a global ecosystem for LTE
…provides cross-industry co-ordination of prototyping, interoperability testing and field trials
The Proof of Concept Activity……has shown that it is feasible to make LTE/SAE equipment
that can meet industry targets for peak performance…is also revealing the performance that operators will be
able to offer to end users in real world conditions
Version 1 25 February 2009

32
Thank You
www.lstiforum.org


![Cell outage management in LTE networks [.pdf]](https://img.dokumen.tips/doc/110x75/584d41631a28ab857390778d/cell-outage-management-in-lte-networks-pdf.jpg)

