Embed Size (px)
Citation preview

Smart Measurement Solutions®
Bode 100 - Application Note
Loudspeaker and Audio Crossover
Measurements
By Tobias Schuster
© 2017 by OMICRON Lab – V2.0
Visit www.omicron-lab.com for more information.
Contact [email protected] for technical support.

Bode 100 - Application Note
Loudspeaker and Audio Crossover Measurements
Page 2 of 16
Smart Measurement Solutions®
Table of Contents
1 SUMMARY ............................................................................................................................................................. 3
2 MEASUREMENT TASK ........................................................................................................................................ 3
3 LOUDSPEAKER DETAILS .................................................................................................................................. 4
4 MEASUREMENT SETUP & RESULTS ............................................................................................................... 5
4.1 INPUT IMPEDANCE OF THE LOUDSPEAKERS .................................................................................................................. 5
4.1.1 Bode 100 Setup ................................................................................................................................................... 5
4.1.2 Connecting the Speakers ................................................................................................................................... 6
4.1.3 Measuring the Complete Speaker Box ............................................................................................................ 6
4.1.4 Measuring the tweeter, mid-range driver and woofer .................................................................................... 7
4.2 AUDIO CROSSOVER TRANSFER FUNCTION ................................................................................................................... 9
4.2.1 Bode 100 Setup ................................................................................................................................................... 9
4.2.2 Measurement and Calibration Setup .............................................................................................................. 10
4.2.3 Measurement Result ......................................................................................................................................... 11
4.2.4 Comparison with LTspice Simulation ............................................................................................................. 14
5 CONCLUSION ..................................................................................................................................................... 15
Note: Basic procedures such as setting-up, adjusting and calibrating the Bode 100 are described
in the Bode 100 user manual. You can download the Bode 100 user manual at
www.omicron-lab.com/bode-100/downloads#3
Note: All measurements in this application note have been performed with the Bode Analyzer
Suite V3.0. Use this version or a higher version to perform the measurements shown in this
document. You can download the latest version at
www.omicron-lab.com/bode-100/downloads

Bode 100 - Application Note
Loudspeaker and Audio Crossover Measurements
Page 3 of 16
Smart Measurement Solutions®
1 Summary
This application note explains how to measure the impedance of loudspeakers as well as how to
measure the voltage transfer function of audio crossovers using the Bode 100 VNA.
After a short introduction to the measurements it is shown how to configure the Bode 100 and how to
connect the DUT1 for each measurement.
2 Measurement Task
The following measurements are outlined in this application note:
Impedance measurement of loudspeakers
Measurement of each path of an audio crossover
Comparison of the measurement and the simulation results of an audio crossover
The measurements are performed on self-made loudspeakers.
These loudspeakers are part of a self-developed sound system, developed by the electronics teacher
Dipl.-Päd. Ing. Michael Kvasznicza at the Federal Higher Technical institute for Education and
Experimenting in Bregenz. The system was refined and extended with a Bluetooth connection to
android devices during a diploma thesis project.
1 Device Under Test

Bode 100 - Application Note
Loudspeaker and Audio Crossover Measurements
Page 4 of 16
Smart Measurement Solutions®
3 Loudspeaker Details
The loudspeakers we are using, are passive loudspeakers. The satellite speakers consists of a
tweeter and a mid-range driver as well as a self-made audio crossover. The woofer is installed in a
separate wooden housing, therefore no audio crossover is needed for the woofer.
The built-in speakers are:
Tweeter: Visaton DTW 72 8 Ω
Mid-range driver: Visaton W 100 S 4 Ω
Woofer: Visaton W 200 SC 4 Ω
Figure 1: Satellite speaker including tweeter, mid-range driver and audio crossover

Bode 100 - Application Note
Loudspeaker and Audio Crossover Measurements
Page 5 of 16
Smart Measurement Solutions®
4 Measurement Setup & Results
4.1 Input impedance of the Loudspeakers
4.1.1 Bode 100 Setup
For the input impedance measurement we perform a logarithmic frequency sweep from
10 Hz to 100 kHz and use an output level of 0 dBm such that the sound of the loudspeakers during
the measurement is not too loud.
The other setup parameters can be seen in the following:
Figure 2: select measurement type one-port
Figure 3: measurement settings – one-port

Bode 100 - Application Note
Loudspeaker and Audio Crossover Measurements
Page 6 of 16
Smart Measurement Solutions®
4.1.2 Connecting the Speakers
We connect either the satellite speaker or the woofer to the output of the Bode 100 via a BNC cable
and a self-made adapter (see Figure 5).
Figure 4: Impedance measurement of the loudspeakers
Figure 5: BNC - wire – adapter for connection between BNC and loudspeaker
4.1.3 Measuring the Complete Speaker Box
First of all we measure the complete satellite speakers (including the build-in audio crossover) and the
woofer.
Figure 6: Impedance measurement of the loudspeakers

Bode 100 - Application Note
Loudspeaker and Audio Crossover Measurements
Page 7 of 16
Smart Measurement Solutions®
The impedance curves of the satellite speakers and the woofer are nonlinear and different. Especially
the two satellite speakers are different. This is caused by the self-made audio crossovers including
self-wound inductors.
4.1.4 Measuring the tweeter, mid-range driver and woofer
For this measurement we choose the same settings like in the previous measurement but we change
the start and stop frequency to 20 Hz and 20 kHz and the y-axis from 0 to 50 Ω. These values are
typically used to create datasheet diagrams.
Figure 7: Tweeter impedance measurement
Figure 8: Mid-range driver impedance measurement

Bode 100 - Application Note
Loudspeaker and Audio Crossover Measurements
Page 8 of 16
Smart Measurement Solutions®
Figure 9: Woofer impedance measurement
The measurements show that the tweeter impedance is flat at 8 Ω whereas the mid-range driver and
the woofer show a clear peak and an increase of the impedance at higher frequencies.
These peaks are typical for woofers and mid-range drivers and the curves in the datasheets are
similar. The operating range of them normally starts after the peak and the higher the impedances are
in the high frequencies, the less you can hear them with the woofer or mid-range driver themselves.
Therefore, with this speakers we could hardly hear the high frequencies without the tweeter.
Bode 100 - Application Note
Loudspeaker and Audio Crossover Measurements
Page 9 of 16
Smart Measurement Solutions®
4.2 Audio Crossover Transfer Function
4.2.1 Bode 100 Setup
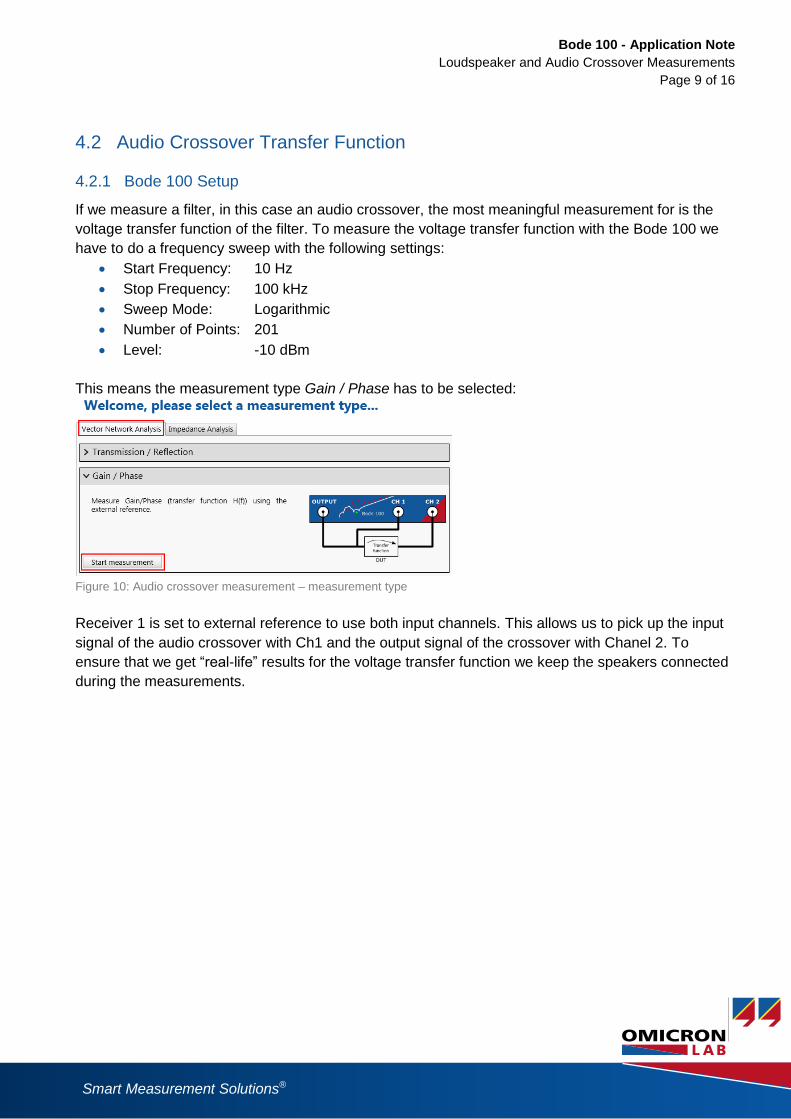
If we measure a filter, in this case an audio crossover, the most meaningful measurement for is the
voltage transfer function of the filter. To measure the voltage transfer function with the Bode 100 we
have to do a frequency sweep with the following settings:
Start Frequency: 10 Hz
Stop Frequency: 100 kHz
Sweep Mode: Logarithmic
Number of Points: 201
Level: -10 dBm
This means the measurement type Gain / Phase has to be selected:
Figure 10: Audio crossover measurement – measurement type
Receiver 1 is set to external reference to use both input channels. This allows us to pick up the input
signal of the audio crossover with Ch1 and the output signal of the crossover with Chanel 2. To
ensure that we get “real-life” results for the voltage transfer function we keep the speakers connected
during the measurements.

Bode 100 - Application Note
Loudspeaker and Audio Crossover Measurements
Page 10 of 16
Smart Measurement Solutions®
4.2.2 Measurement and Calibration Setup
Before we start the measurement we perform a THRU-calibration. To do so we connect the cables
and the probes to the same point in the circuit
Figure 11: Audio crossover setup - calibration setup
Two transfer functions can be measured. First we measure the input-to-tweeter transfer function and
then the input-to-midrange transfer function. Therefore we have to connect CH2 either to the tweeter
path or to the midrange path as shown in the figures below.
Figure 12: Audio crossover setup - tweeter path

Bode 100 - Application Note
Loudspeaker and Audio Crossover Measurements
Page 11 of 16
Smart Measurement Solutions®
Figure 13: Audio crossover setup - mid-range driver path
Note: The resistors shown in the schematic are resistors which stand for the impedance of the
loudspeakers. These resistors are needed for the simulation later on.
4.2.3 Measurement Result
In the following we perform two different measurements and get three curves.
1. Input-to-tweeter transfer function
2. Input-to-midrange transfer function
3. The sum of the two measurement results in the overall frequency response of the satellite
speaker.
Figure 14: Audio crossover measurement - mid-range driver

Bode 100 - Application Note
Loudspeaker and Audio Crossover Measurements
Page 12 of 16
Smart Measurement Solutions®
The mid-range driver path of the audio crossover is a LC-low pass with a cutoff frequency of 6.7 kHz.
Figure 15: Audio crossover measurement – tweeter
The tweeter path of the audio crossover is a LC-high pass with a cutoff frequency of 5.4 kHz.
Figure 16: Audio crossover measurement - tweeter and mid-range driver
As we can see in the picture above, the mid-range driver path is conductive up to approximately
6 kHz where it starts attenuating. The tweeter path starts conducting above that frequency.

Bode 100 - Application Note
Loudspeaker and Audio Crossover Measurements
Page 13 of 16
Smart Measurement Solutions®
There are two different methods to get the overall frequency curve of the satellite speaker:
Directly in the Bode Analyzer Suite
Export the two curves of the tweeter and the mid-range driver to a spreadsheet program such
as Excel® or something similar and sum up the two curves there
In the following we do it directly in the Bode Analyzer Suite.
First of all, we store the mid-range measurement data to the Memory in the Bode Analyzer Suite.
Figure 17: store the measurement data
Then the Trace 1 Display is set to Math and the memory of the mid-range driver subtracted by the
memory of the tweeter:
Figure 18: calculation in the BAS
If we have done this we see the overall frequency curve of the satellite speaker.
Figure 19: Audio crossover measurement - tweeter and mid-range driver path (overall frequency curve)
The curve should be as close to 0 dB as possible over the entire frequency range. However at
approx. 5 - 8 kHz the curve shows some attenuation with a maximum of 10 dB,
caused by the cutoff frequencies of the two single paths.

Bode 100 - Application Note
Loudspeaker and Audio Crossover Measurements
Page 14 of 16
Smart Measurement Solutions®
4.2.4 Comparison with LTspice Simulation
In order to compare the measurement with a simulation of the audio crossover, we have exported the
tweeter path curve (V(tre)), the mid-range driver path (V(mid)) as well as the overall frequency curve
(V(mid)+V(tre)) of the satellite speaker to an Excel® sheet.
For a better comparison between the simulation and the measurement, we also exported the LTspice
simulation to an Excel® sheet.
Simulation:
To simulate the audio crossover the following circuit is modeled in LTspice.
Figure 20: Audio crossover simulation schematic
The nominal values of the capacitors are used for the simulation. Since we do not consider the
parasitics of the capacitors and the self-wound inductors, the simulation will not fit perfectly.
Comparison:
Figure 21: Audio crossover tweeter path
-80
-70
-60
-50
-40
-30
-20
-10
0
10
10 100 1000 10000 100000
V(tre) simulated
V(tre) measured

Bode 100 - Application Note
Loudspeaker and Audio Crossover Measurements
Page 15 of 16
Smart Measurement Solutions®
Figure 22: Audio crossover mid-range path
Figure 23: Audio crossover mid-range + tweeter path
The attenuation of the simulated overall frequency curve at the interception point of the tweeter and
the mid-range driver is a lot bigger than in the measurement because the ESR of the devices
downgrade the Q factor.
That is a deliberated effect because if the attenuation is too big at a small frequency range, we could
not hear this frequencies as good as all the others.
5 Conclusion
The Bode 100 enables simple and fast measurements to characterize the input impedance of
loudspeakers as well as the voltage transfer function of audio crossovers.
If you would like to have some information how to measure different characteristics of audio
amplifiers, check out the application note “Audio Amplifier Frequency Response”.
-80
-70
-60
-50
-40
-30
-20
-10
0
10
10 100 1000 10000 100000
V(mid) simulated
V(mid) measured
-80
-70
-60
-50
-40
-30
-20
-10
0
10
10 100 1000 10000 100000
V(mid)+V(tre) simulated
V(mid)+V(tre) measured

Bode 100 - Application Note
Loudspeaker and Audio Crossover Measurements
Page 16 of 16
Smart Measurement Solutions®
Americas
OMICRON electronics Corp. USA
Phone: +1 713 830-4660
Fax: +1 713 830-4661
Asia Pacific
OMICRON electronics Asia Limited
Phone: +852 3767 5500
Fax: +852 3767 5400
Europe, Middle East, Africa
OMICRON electronics GmbH
Phone: +43 59495
Fax: +43 59495 9999
[email protected] www.omicron-lab.com
OMICRON Lab is a division of OMICRON electronics specialized in
providing Smart Measurement Solutions to professionals such as
scientists, engineers and teachers engaged in the field of electronics.
It simplifies measurement tasks and provides its customers with more
time to focus on their real business.
OMICRON Lab was established in 2006 and is meanwhile serving
customers in more than 40 countries. Offices in America, Europe, East
Asia and an international network of distributors enable a fast and
extraordinary customer support.
OMICRON Lab products stand for high quality offered at the best
price/value ratio on the market. The products' reliability and ease of use
guarantee trouble-free operation. Close customer relationship and more
than 25 years in-house experience enable the development of
innovative products close to the field.