Embed Size (px)
Citation preview

Looking Beneath the SurfaceWhat we can learn from the Minnesota TIMSS Science
Results
William H. SchmidtMichigan State University

2007 Grade 4 Mathematics
Significantly Higher than MNNot Significantly Different from MN
Significantly Lower than MN
Nation Mean
Hong Kong SAR 607Singapore 599Chinese Taipei 576Massachusetts, US 572Japan 568
Nation MeanMinnesota, US 554Kazakhstan 549Russian Federation 544England 541
Nation Mean
Latvia 537Netherlands 535Lithuania 530United States 529
Germany 525
Denmark 523
Australia 516
Hungary 510Italy 507Austria 505Sweden 503Slovenia 502Armenia 500Slovak Republic 496Scotland 494New Zealand 492Czech Republic 486Norway 473Ukraine 469Georgia 438Iran, Islamic Rep. of 402Algeria 378Colombia 355Morocco 341El Salvador 330Tunisia 327Kuwait 316Qatar 296Yemen 224
© 2008 Center for Research in Mathematics and Science Education, Michigan State University

© 2008 Center for Research in Mathematics and Science Education, Michigan State University
2007 Grade 8 Mathematics
Nation Mean
Chinese Taipei 598Korea, Rep. of 597Singapore 593Hong Kong SAR 572Japan 570Massachusetts, US 547
Nation MeanMinnesota, US 532
Nation Mean
Hungary 517England 513Russian Federation 512United States 508Lithuania 506Czech Republic 504
Slovenia 501
Armenia 499
Australia 496
Sweden 491Malta 488Scotland 487Serbia 486Italy 480Malaysia 474Norway 469Cyprus 465Bulgaria 464Israel 463Ukraine 462Romania 461Bosnia and Herzegovina 456Lebanon 449Thailand 441Turkey 432Jordan 427Tunisia 420Georgia 410Iran, Islamic Rep. of 403
Nation Mean
Bahrain 398Indonesia 397Syrian Arab Republic 395Greece 391Romania 387Lithuania 381Colombia 380Oman 372Palestinian Nat'l Auth. 367Botswana 364Kuwait 354El Salvador 340Saudi Arabia 329Ghana 309Qatar 307
Significantly Higher than MNNot Significantly Different from MN
Significantly Lower than MN

Grade 8 Mathematics Mean Teaching Emphasis
1995 2007
NUMBER
ALGEBRA
GEOMETRY
DATA
OTHER
2007 TIMSS TEST EMPHASIS
© 2008 Center for Research in Mathematics and Science Education, Michigan State University

2007 Grade 4 Science
© 2008 Center for Research in Mathematics and Science Education, Michigan State University
Nation Mean
Singapore 587Massachusetts, US 571
Nation Mean
Chinese Taipei 557Hong Kong SAR 554Minnesota, US 551Japan 548Russian Federation 546Latvia 542England 542United States 539
Nation Mean
Hungary 536Italy 535
Kazakhstan 533Germany 528Australia 527
Slovak Republic 526
Austria 526
Sweden 525
Netherlands 523Slovenia 518
Denmark 517Czech Republic 515
Lithuania 514New Zealand 504Scotland 500Armenia 484Norway 477Ukraine 474Iran, Islamic Rep. of 436Georgia 418Colombia 400El Salvador 390Algeria 354Kuwait 348Tunisia 318Morocco 297Qatar 294Yemen 197
Significantly Higher than MNNot Significantly Different from MN
Significantly Lower than MN

Grade 4 Science: 1995 & 20071995 Rescaled Scores 2007 Scores 1995 Rescaled Scores
Nation Mean Nation Mean
Japan 553 (8.8) Singapore 587Minnesota, US 553 (1.8) Hong Kong SAR 554United States 542 (3.3) Minnesota, US 551Austria 538 (3.6) Japan 548Czech Republic 532 (3.0) England 542Netherlands 530 (3.2) Latvia 542England 528 (3.1) United States 539Singapore 523 (4.8) Hungary 536Australia 521 (3.8) Australia 527Scotland 514 (4.5) Austria 526Hong Kong SAR 508 (3.3) Netherlands 523Hungary 508 (3.4) Slovenia 518New Zealand 505 (5.3) Czech Republic 515Norway 504 (3.7) New Zealand 504Latvia 486 (4.9) Scotland 500Slovenia 464 (3.1) Norway 477Iran, Islamic Rep. of 380 (4.6) Iran, Islamic Rep. of 436
Significantly Higher than MN Significantly Higher than the US Not Significantly Different from MN Not Significantly Different from the US
Significantly Lower than MN Significantly Lower than the US

2005 NAEP Grade 4 Science
0 20 40
Massachusetts
Minnesota
New Hampshire
New Jersey
Vermont
Percent Students
Stat
esAt advanced
At proficient

2007 Grade 8 Science
© 2008 Center for Research in Mathematics and Science Education, Michigan State University
Nation Mean
Singapore 567Chinese Taipei 561Massachusetts, US 556Japan 554Korea, Rep. of 553
Nation Mean
England 542Hungary 539Czech Republic 539Minnesota, US 539Slovenia 538Hong Kong SAR 530
Russian Federation 530
Nation Mean
United States 520Lithuania 519Australia 515
Sweden 511
Scotland 496
Italy 495
Armenia 488Norway 487
Ukraine 485Jordan 482
Malaysia 471Thailand 471Serbia 470Bulgaria 470Israel 468Bahrain 467Bosnia and Herzegovina 466Romania 462Iran, Islamic Rep. of 459Malta 457Turkey 454Syrian Arab Republic 452Cyprus 452Tunisia 445
Significantly Higher than MNNot Significantly Different from MN
Significantly Lower than MN
Nation MeanIndonesia 427Oman 423Georgia 421Kuwait 418Colombia 417Lebanon 414Egypt 408Algeria 408Palestinian Nat'l Auth. 404Saudi Arabia 403Morocco 402El Salvador 387Botswana 355Qatar 319Ghana 303

Grade 8 Science: 1995 & 20071995 Rescaled Scores 2007 Scores 1995 Rescaled Scores
Nation Mean Nation Mean
Singapore 580 (5.5) Singapore 567Czech Republic 555 (4.5) Japan 554Japan 554 (1.8) Korea, Rep. of 553Sweden 553 (4.4) England 542Korea, Rep. of 546 (2.0) Czech Republic 539Minnesota, US 544 (7.9) Hungary 539Hungary 537 (3.1) Minnesota, US 539England 533 (3.6) Slovenia 538Bulgaria 527 (5.8) Hong Kong SAR 530Russian Federation 523 (4.5) Russian Federation 530
Australia 514 (3.9) United States 520Norway 514 (2.4) Lithuania 519Slovenia 514 (2.7) Australia 515
United States 513 (5.6) Sweden 511Hong Kong SAR 510 (5.8) Scotland 496Scotland 501 (5.6) Norway 487Romania 471 (5.1) Bulgaria 464Lithuania 464 (4.0) Romania 462Iran, Islamic Rep. of 463 (3.6) Iran, Islamic Rep. of 459Cyprus 452 (2.1) Cyprus 452Colombia 365 (6.2) Colombia 417
Significantly Higher than MN Significantly Higher than the US Not Significantly Different from MN Not Significantly Different from the US
Significantly Lower than MN Significantly Lower than the US

2005 NAEP Grade 8 Science
0 10 20 30 40
Massachusetts
Minnesota
New Hampshire
New Jersey
Vermont
Percent Students
Stat
esAt advanced
At proficient

Grade 4 Science 1
1995Earth
FeaturesEarth
ProcessesEarth in the
UniversePlants & Animals
Organs & Tissues
Life Processes &
Functions
Life Cycles & Genetics
Minnesota 67 Minnesota 70 Minnesota 88 Minnesota 89 Minnesota 70 Japan 75 Czech Republic 73
Japan 63 Japan 62 Czech Republic 75 Japan 78 Singapore 67 Australia 70 Minnesota 72U.S.A. 60 U.S.A. 61 Hong Kong 75 Australia 72 Australia 66 Czech Republic 69 Australia 71England 59 Australia 56 Hungary 75 Czech Republic 72 Czech Republic 65 Minnesota 69 Japan 71Czech Republic 58 England 55 Norway 75 Singapore 70 U.S.A. 65 England 69 U.S.A. 70Hungary 58 Singapore 54 Australia 72 U.S.A. 70 Hong Kong 65 Singapore 69 Norway 68Norway 56 Czech Republic 54 England 71 England 67 Japan 63 U.S.A. 68 England 68Australia 56 Hungary 53 U.S.A. 70 Hungary 66 England 62 Norway 67 Hong Kong 68Hong Kong 54 Hong Kong 51 Japan 69 Hong Kong 65 Hungary 61 Hong Kong 66 Hungary 67International Mn 53 International Mn 50 Singapore 69 International Mn 64 Norway 61 Hungary 64 Singapore 67Singapore 53 Norway 42 International Mn 67 Norway 60 International Mn 59 International Mn 64 International Mn 64
57 54 72 69 64 69 69
2007Minnesota 70 Japan 70 England 66 Singapore 70 Hungary 63 Singapore 82 Singapore 62
Hong Kong 66 Minnesota 67 Singapore 66 Minnesota 62 Singapore 60 Hong Kong 63 Czech Republic 56
U.S.A. 64 England 65 Hong Kong 63 U.S.A. 61 Minnesota 60 U.S.A. 58 Hungary 56
Singapore 64 U.S.A. 65 Minnesota 62 England 60 England 59 England 56 Minnesota 55
England 63 Hong Kong 64 U.S.A. 61 Hungary 60 U.S.A. 58 Minnesota 55 Australia 53Japan 63 Australia 64 Australia 60 Hong Kong 59 Hong Kong 58 Japan 55 Japan 52Australia 60 Hungary 60 Hungary 56 Australia 59 Czech Republic 56 Australia 48 England 52Hungary 58 Singapore 60 Norway 55 Czech Republic 57 Australia 53 Hungary 48 U.S.A. 52Norway 54 Czech Republic 60 Japan 54 Japan 56 Japan 53 Czech Republic 47 Hong Kong 49International Mn 51 International Mn 51 Czech Republic 53 International Mn 50 Norway 50 International Mn 45 International Mn 43Czech Republic 50 Norway 51 International Mn 50 Norway 50 International Mn 49 Norway 35 Norway 42
60 62 59 59 57 55 53
Earth Features
Earth Processes
Earth in the Universe
Plants & Animals
Organs & Tissues
Life Processes &
Functions
Life Cycles & Genetics

Grade 4 Science 21995
Human Biology & Health
MatterEnergy & Physical
Processes
Physical & Chemical Changes
Forces & Motion
Environmental & Resource
Issues
Scientific Processes
Minnesota 75 Japan 75 Japan 70 Japan 72 Japan 62 Minnesota 79 Minnesota 67Australia 70 Singapore 67 Minnesota 66 Minnesota 69 Czech Republic 62 Japan 72 U.S.A. 63U.S.A. 69 Minnesota 66 Australia 63 Hong Kong 68 Singapore 60 Australia 69 Australia 59Norway 68 Australia 63 England 62 Czech Republic 67 Minnesota 59 U.S.A. 68 Singapore 54Singapore 68 U.S.A. 61 Czech Republic 61 U.S.A. 65 Norway 58 Czech Republic 63 England 54England 67 Czech Republic 61 U.S.A. 61 Singapore 65 Australia 55 Hungary 62 Japan 53Hong Kong 67 Hong Kong 60 Singapore 61 Australia 63 Hungary 55 England 60 Hong Kong 51Czech Republic 66 Hungary 59 Hong Kong 59 England 61 Hong Kong 54 International Mn 58 Czech Republic 51Japan 66 England 58 Hungary 57 Hungary 60 U.S.A. 53 Norway 58 Norway 48Hungary 65 International Mn 58 International Mn 56 International Mn 59 International Mn 51 Singapore 57 International Mn 46International Mn 63 Norway 56 Norway 53 Norway 58 England 49 Hong Kong 54 Hungary 40
67 62 61 64 56 62 53
2007Japan 65 Singapore 72 Singapore 73 Singapore 69 Hong Kong 71 Singapore 62 Singapore 70Singapore 64 Hong Kong 67 Japan 67 Japan 65 Singapore 70 Minnesota 63 Hong Kong 70Hong Kong 61 Japan 65 Hong Kong 61 Hong Kong 61 Minnesota 67 Hong Kong 61 England 69Hungary 60 Minnesota 61 Minnesota 58 Hungary 58 Australia 62 Japan 59 Minnesota 67Minnesota 57 England 59 England 56 Minnesota 57 England 62 Australia 58 U.S.A. 67England 57 Hungary 59 U.S.A. 55 England 57 U.S.A. 61 England 58 Australia 67U.S.A. 55 U.S.A. 59 Hungary 54 Czech Republic 55 Japan 61 U.S.A. 57 Japan 65Australia 54 Czech Republic 58 Australia 53 U.S.A. 55 Hungary 58 Hungary 57 Hungary 62Czech Republic 54 Australia 55 Czech Republic 50 Australia 51 International Mn 54 Czech Republic 51 Czech Republic 57Norway 51 International Mn 50 International Mn 47 International Mn 46 Czech Republic 54 International Mn 45 International Mn 56International Mn 48 Norway 48 Norway 42 Norway 40 Norway 53 Norway 41 Norway 54
58 60 57 57 61 56 64
Human Biology & Health
MatterEnergy & Physical
Processes
Physical & Chemical Changes
Forces & Motion
Environmental & Resource
Issues
Scientific Processes

Comparing MN and the US: Grade 4 ScienceTopic 1995 2007
Earth FeaturesEarth Processes Earth in the Universe Plants & AnimalsOrgans & Tissues Life Processes & FunctionsLife Cycles & GeneticsInteractions of Living Things Human Biology and HealthMatterEnergy and Physical Processes Physical & Chemical ChangesForces and Motion Environmental & Resource IssuesScientific Processes
MN>US
MN=US
MN<US

MN Grade 4 Student Science Performance
1995 2007
Earth Processes
> 75% Correct Earth in the Universe
Plants & Animals
Scientific Processes
Between 50 to 74% Correct 10 of 14 Topics 14 of 14 Topics
< 50% Correct
The 1995 Scores have been adjusted to account for the differences in difficulty of the 1995 & 2007 tests.

Grade 8 Science 11995
Earth Features Earth ProcessesEarth in the
Universe
Diversity & Structure of Living
Things
Life Processes & Functions
Life Cycles & Genetics
Czech Republic 67 Minnesota 67 Minnesota 74 Japan 76 Singapore 72 Minnesota 86Hungary 67 England 67 Sweden 71 Singapore 74 Japan 70 Czech Republic 82Korea 65 Singapore 67 Norway 70 Hong Kong 73 Korea 68 U.S.A. 81Singapore 65 Norway 62 Czech Republic 67 Korea 72 Czech Republic 64 England 80Minnesota 64 U.S.A. 61 Japan 67 Czech Republic 72 Thailand 63 Israel 79Sweden 61 Russian Federation 61 Thailand 66 Minnesota 70 Minnesota 63 Sweden 78Thailand 60 Sweden 60 Singapore 65 Thailand 69 Hungary 60 Norway 78Russian Federation 59 Korea 59 Korea 64 Sweden 68 Russian Federation 59 Korea 76Norway 59 Japan 58 U.S.A. 63 Hungary 67 England 59 Russian Federation 76Japan 59 Czech Republic 57 Australia 63 Australia 67 U.S.A. 58 Japan 75England 59 Australia 57 England 59 Russian Federation 66 Australia 57 Hungary 74Australia 57 Thailand 56 Hungary 59 England 64 Israel 57 Australia 73U.S.A. 57 Israel 55 International Mn 58 U.S.A. 64 Hong Kong 56 International Mn 70Israel 56 International Mn 54 Hong Kong 58 International Mn 61 Sweden 55 Singapore 69International Mn 55 Hong Kong 52 Israel 56 Israel 60 International Mn 55 Thailand 67Hong Kong 54 Hungary 51 Russian Federation 57 Norway 59 Norway 54 Hong Kong 65
60 59 63 68 61 75
2007
Minnesota 61 Czech Republic 60 Czech Republic 61 Singapore 61 Singapore 68 S. Korea 65Hungary 59 Hong Kong 60 S. Korea 60 S. Korea 60 S. Korea 63 Japan 60Czech Republic 59 Japan 59 Minnesota 60 Minnesota 59 Japan 62 Hong Kong 60Japan 58 Minnesota 58 U.S.A 58 Japan 57 Hong Kong 59 Singapore 57Russian Federation 57 Russian Federation 57 Sweden 57 Hungary 56 England 58 Russian Federation 52S. Korea 57 Singapore 56 Norway 57 Czech Republic 56 Minnesota 56 Hungary 51Sweden 56 U.S.A 53 Singapore 57 England 55 Russian Federation 52 Minnesota 49Norway 54 Australia 52 England 56 U.S.A 54 U.S.A 52 U.S.A 47Singapore 53 England 52 Russian Federation 55 Russian Federation 53 Czech Republic 47 England 47U.S.A 51 Sweden 51 Australia 53 Hong Kong 51 Sweden 47 Czech Republic 46Australia 51 Hungary 50 Hong Kong 51 Australia 50 Australia 47 Australia 44Hong Kong 50 S. Korea 50 Hungary 49 Sweden 48 Hungary 43 Sweden 41England 50 Norway 47 Thailand 49 Thailand 44 International Mn 43 Israel 39International Mn 38 Thailand 46 Japan 48 Norway 42 Thailand 41 International Mn 38Israel 37 International Mn 41 International Mn 45 International Mn 41 Norway 38 Norway 38Thailand 34 Israel 40 Israel 38 Israel 41 Israel 38 Thailand 35
52 52 54 52 51 49
Earth Features Earth ProcessesEarth in the
Universe
Diversity & Structure of Living
Things
Life Processes & Functions
Life Cycles & Genetics

Grade 8 Science 21995
Interactions of Living Things
Human Biology & Health
Properties & Classification of
MatterStructure of Matter
Energy & Physical Processes
Physical Changes
Korea 69 Singapore 74 Japan 67 Russian Federation 56 Singapore 71 Japan 67Singapore 66 Czech Republic 72 Singapore 67 Hungary 54 Japan 69 Singapore 63Minnesota 65 Minnesota 71 Korea 65 Czech Republic 54 Korea 67 Czech Republic 63Japan 65 Japan 69 Czech Republic 60 Singapore 53 England 64 Israel 61Thailand 64 Hungary 69 Hungary 57 Minnesota 49 Minnesota 63 Sweden 61Hungary 63 England 68 Sweden 57 U.S.A. 48 Czech Republic 62 Hungary 61Australia 62 Israel 68 Hong Kong 56 Israel 45 Australia 61 Norway 60England 62 U.S.A. 67 Norway 55 Sweden 43 Hungary 60 England 59Norway 60 Thailand 67 Australia 55 Korea 42 Hong Kong 60 Korea 57Czech Republic 58 Australia 66 England 55 Japan 41 Israel 59 Australia 57U.S.A. 54 Korea 66 Russian Federation 54 Hong Kong 40 Russian Federation 58 Russian Federation 57Russian Federation 52 Sweden 64 Israel 53 International Mn 40 U.S.A. 57 Thailand 53Sweden 52 Russian Federation 63 Minnesota 52 Australia 39 Norway 57 International Mn 53International Mn 51 Norway 63 International Mn 52 England 38 Sweden 57 Minnesota 50Israel 50 International Mn 61 U.S.A. 50 Norway 32 International Mn 56 U.S.A. 49Hong Kong 47 Hong Kong 60 Thailand 47 Thailand 31 Thailand 55 Hong Kong 49
59 67 57 44 61 58
2007
Singapore 64 Minnesota 70 Singapore 53 Singapore 64 Singapore 63 S. Korea 57S. Korea 62 S. Korea 69 S. Korea 53 Czech Republic 60 S. Korea 59 Singapore 55Minnesota 62 Czech Republic 66 Japan 50 Russian Federation 60 Japan 58 Japan 53Hungary 60 England 66 Hungary 50 Hungary 57 England 54 England 52Japan 59 Hungary 65 Czech Republic 49 Japan 52 Hungary 54 Russian Federation 49England 58 Japan 65 Russian Federation 48 U.S.A. 49 Czech Republic 52 Hungary 49Czech Republic 57 Singapore 64 England 47 Minnesota 46 Hong Kong 51 Czech Republic 47U.S.A. 57 Sweden 63 Hong Kong 44 Israel 44 Russian Federation 49 Hong Kong 45Hong Kong 55 U.S.A. 63 Minnesota 41 Sweden 44 Sweden 45 Sweden 44Australia 55 Hong Kong 63 Sweden 40 International Mn 43 Australia 45 Minnesota 43Russian Federation 55 Russian Federation 62 U.S.A. 40 England 42 Minnesota 45 Australia 42Sweden 53 Australia 62 Australia 39 S. Korea 42 U.S.A. 43 U.S.A. 41Norway 46 Norway 59 Israel 37 Australia 35 International Mn 40 Norway 40Israel 44 Thailand 57 International Mn 35 Thailand 35 Norway 39 Israel 39Thailand 43 Israel 54 Norway 34 Norway 31 Israel 38 International Mn 37International Mn 42 International Mn 50 Thailand 33 Hong Kong 29 Thailand 38 Thailand 34
55 63 44 46 49 46
Interactions of Living Things
Human Biology & Health
Properties & Classification of
MatterStructure of Matter
Energy & Physical Processes
Physical Changes

Grade 8 Science 31995
Chemical Changes Forces & MotionScience,
Technology, & Society
Environmental & Resource Issues
Scientific Processes
Singapore 74 Czech Republic 78 Korea 74 Singapore 73 Singapore 75Korea 66 Japan 74 Hungary 73 Thailand 70 Korea 64Hungary 65 Singapore 73 Sweden 67 Minnesota 68 Minnesota 63Minnesota 65 Korea 70 Singapore 66 England 67 Czech Republic 61Czech Republic 64 Hong Kong 69 Japan 60 Australia 65 Australia 61England 64 Hungary 69 Thailand 59 Korea 63 Japan 60Japan 64 England 68 England 57 Japan 62 England 60Australia 62 Sweden 68 Hong Kong 55 U.S.A. 60 U.S.A. 59Russian Federation 62 Australia 67 Norway 52 Czech Republic 59 Hungary 57U.S.A. 61 Norway 67 Czech Republic 52 Norway 58 Hong Kong 57Israel 61 Minnesota 63 Minnesota 52 Hong Kong 53 Thailand 55Hong Kong 58 Russian Federation 62 Australia 52 International Mn 53 International Mn 53Sweden 57 U.S.A. 61 Israel 51 Sweden 52 Sweden 52International Mn 56 International Mn 61 International Mn 48 Israel 52 Norway 52Norway 53 Israel 55 U.S.A. 48 Hungary 49 Israel 52Thailand 51 Thailand 56 Russian Federation 40 Russian Federation 47 Russian Federation 51
62 67 58 59 58
2007
England 55 Czech Republic 49 Singapore 51 Singapore 55 Japan 56Singapore 55 Japan 49 Japan 50 Minnesota 55 Singapore 52Hong Kong 48 S. Korea 48 Czech Republic 44 England 53 S. Korea 50Japan 47 Singapore 48 Russian Federation 44 Australia 52 Minnesota 48Australia 45 England 45 England 41 Hungary 51 England 46Minnesota 45 Hungary 44 Hong Kong 39 S. Korea 51 Czech Republic 45Russian Federation 44 Minnesota 43 S. Korea 39 Hong Kong 50 Hong Kong 43Hungary 43 Hong Kong 42 Minnesota 38 Russian Federation 49 U.S.A. 43U.S.A. 43 Russian Federation 41 U.S.A. 37 U.S.A. 49 Australia 42Czech Republic 39 Sweden 41 Australia 36 Czech Republic 48 Hungary 40S. Korea 37 U.S.A. 40 Hungary 34 Japan 48 Russian Federation 38Norway 35 Australia 38 Sweden 26 Sweden 43 Israel 34International Mn 34 Norway 32 International Mn 26 Norway 42 Sweden 34Sweden 34 Israel 32 Thailand 19 Thailand 40 Thailand 29Thailand 31 International Mn 31 Norway 17 International Mn 38 International Mn 29Israel 30 Thailand 29 Israel 16 Israel 35 Norway 28
42 41 35 48 41
Chemical Changes Forces & MotionScience,
Technology, & Society
Environmental & Resource Issues
Scientific Processes

Comparing MN and the US: Grade 8 Science
MN>US
MN=US
MN<US
Topic 1995 2007
Earth FeaturesEarth Processes Earth in the Universe Diversity & Structure of Living ThingsLife Processes & FunctionsLife Cycles & GeneticsInteractions of Living Things Human Biology and HealthProperties & Classification of MatterStructure of MatterEnergy and Physical Processes Physical ChangesChemical ChangesForces and Motion Science, Technology, & SocietyEnvironmental & Resource IssuesScientific Processes

MN Grade 8 Student Science Performance
1995 2007
> 75% Correct
Between 50 to 74% Correct 11 of 17 Topics 8 of 17 Topics
Properties & Classification of Matter
Physical Changes
Chemical Changes
Forces and Motion
< 50% Correct Science, Technology, & Society
Scientific Processes
Life Cycles & Genetics
Structure of Matter
Energy and Physical Processes
The 1995 Scores have been adjusted to account for the differences in difficulty of the 1995 & 2007 tests.

Grade 4 Earth Features:Average Percent Correct by SES
0.40
0.45
0.50
0.55
0.60
0.65
0.70
0.75
0.80
0.85
Less than 10% FRL
10 to 24.9 % FRL
25 to 49.9% FRL
50 to 74.9% FRL
75% or more FRL

Grade 4 Life Cycles and Genetics:Average Percent Correct by SES
0.35
0.40
0.45
0.50
0.55
0.60
0.65
0.70
Less than 10% FRL
10 to 24.9 % FRL
25 to 49.9% FRL
50 to 74.9% FRL
75% or more FRL

Grade 4 Physical and Chemical Changes:Average Percent Correct by SES
0.30
0.35
0.40
0.45
0.50
0.55
0.60
0.65
0.70
0.75
Less than 10% FRL
10 to 24.9 % FRL
25 to 49.9% FRL
50 to 74.9% FRL
75% or more FRL
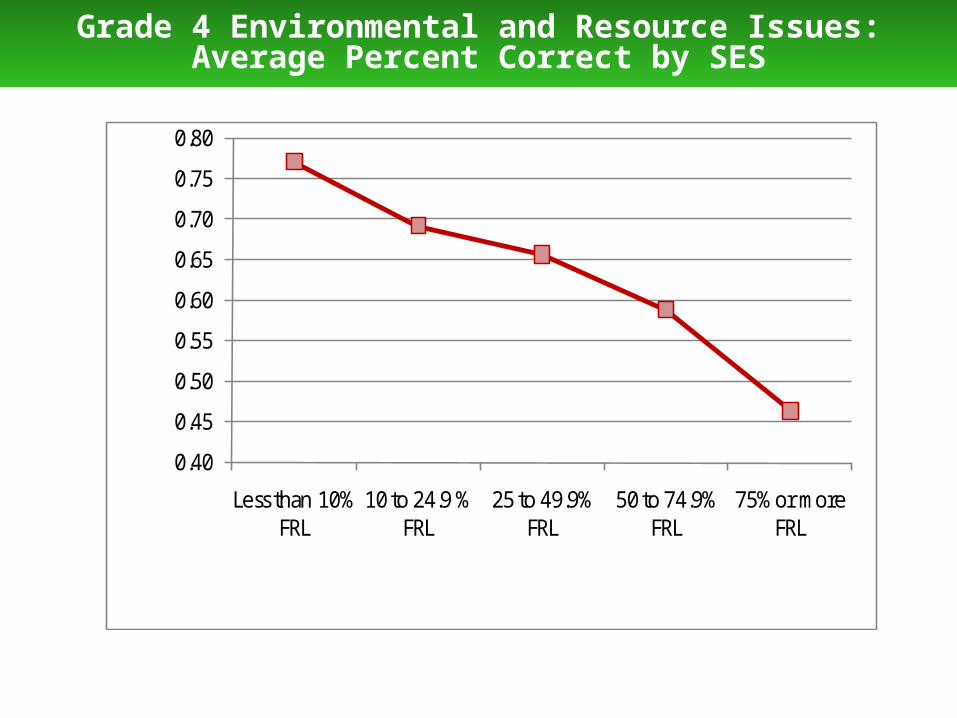
Grade 4 Environmental and Resource Issues:Average Percent Correct by SES
0.40
0.45
0.50
0.55
0.60
0.65
0.70
0.75
0.80
Less than 10% FRL
10 to 24.9 % FRL
25 to 49.9% FRL
50 to 74.9% FRL
75% or more FRL

Grade 8 Earth in the Universe:Average Percent Correct by SES
0.30
0.35
0.40
0.45
0.50
0.55
0.60
0.65
0.70
0.75
0.80
Less than 10% FRL
10 to 24.9% FRL
25 to 49.9% FRL
50 to 74.9% FRL
75% or more FRL

Grade 8 Human Biology and Health:Average Percent Correct by SES
0.40
0.45
0.50
0.55
0.60
0.65
0.70
0.75
Less than 10% FRL
10 to 24.9% FRL
25 to 49.9% FRL
50 to 74.9% FRL
75% or more FRL

Grade 8 Science, Technology and Society:Average Percent Correct by SES
0.10
0.15
0.20
0.25
0.30
0.35
0.40
0.45
0.50
Less than 10% FRL
10 to 24.9% FRL
25 to 49.9% FRL
50 to 74.9% FRL
75% or more FRL

Grade 8 Earth in the Universe:Average Percent Correct by SES
0.20
0.25
0.30
0.35
0.40
0.45
0.50
0.55
Less than 10% FRL
10 to 24.9% FRL
25 to 49.9% FRL
50 to 74.9% FRL
75% or more FRL

Instructional Content Constructs
Curricular CoherenceCurricular Structure
Curricular FocusExposure Time (OTL)
Curricular RigorLevel of Cognitive Complexity

2003 MN Science Curriculum
Grade
Topics 1 2 3 4 5 6 7 8Organs, Tissues l l l lPhysical Properties of Matter l l l l lPlants, Fungi l l l l lAnimals l l l l lClassifi cation of Matter lRocks, Soil l l lLight l lElectricity l lLife Cycles l l lPhysical Changes of Matter l l lHeat & Temperature l l lBodies of Water l l l lI nterdependence of Lif e l l l l l lHabitats & Niches lBiomes & Ecosystems l lReproduction l lTime, Space, Motion l lTypes of Forces l l l lWeather & Climate l lPlanets in the Solar System l lMagnetism l l l lEarth' s Composit ion Organism Energy Handling l lLand, Water, Sea Resource ConservationEarth in the Solar System l l l l lAtoms, I ons, Molecules lChemical Properties of Matter Chemical Changes of Matter lPhysical Cycles l l lLand Forms lMaterial & Energy Resource Conservation Explanations of Physical ChangesPollution Atmosphere l l lSound & Vibration l lCells l lHuman Nutrit ion Building & Breaking l lEnergy Types, Sources, Conversions l l l lDynamics of Motion l l lOrganism Sensing & Responding l
Science Topics Intended at Each Grade

Grade 4 Science Mean Teaching Emphasis
1995 2007
LIFE
PHYSICAL
EARTH
OTHER
2007 TIMSS TEST EMPHASIS

Grade 4 Teachers’ Reported Percent Teaching Time on Science Topics by School SES
© 2008 Center for Research in Mathematics and Science Education, Michigan State University

Grade 4 Teachers’ Reported Percent Teaching Time on Science Topics by School SES
© 2008 Center for Research in Mathematics and Science Education, Michigan State University
Grade 4: Highest SES Schools
Life Science
Physical Science
Earth Science
Other Topics
Grade 4 Lowest SES Schools

Mean Percent of Grade 4 Science Teaching Time
Topic Highest SES Lowest SES Difference
Life Science 37 25 4+ Weeks
Earth Science
27 41 5 Weeks

Grade 4 MN Teachers’ Yearly Total Science Instructional Time by SES
© 2008 Center for Research in Mathematics and Science Education, Michigan State University
20
30
40
50
60
70
80
90
Less than 10 percent FRL
10 to 24.9 percent FRL 25 to 49.9 percent FRL 50 to 74.9 percent FRL 75 percent or more FRL

MN Students Overall Percent Correct on TIMSS 2007 Science Fourth Grade Test by Percentage of
FRL Students in School
© 2008 Center for Research in Mathematics and Science Education, Michigan State University
0.3
0.35
0.4
0.45
0.5
0.55
0.6
0.65
0.7
0.75
0.8
FRL>25% FRL25% to 50% FRL>50%
To
tal
Pro
po
rtio
n o
f T
IMS
S S
cie
nce I
tem
s C
orr
ect
Free/Reduced Lunch Percentage

Grade 8 Science Mean Teaching Emphasis
1995 2007
BIOLOGY
CHEMISTRY
PHYSICS
EARTH SCIENCE
OTHER
2007 TIMSS TEST EMPHASIS

Grade 8 Teachers’ Reported Percent Teaching Time on Science Topics by School SES
© 2008 Center for Research in Mathematics and Science Education, Michigan State University

Grade 8 Teachers’ Reported Percent Teaching Time on Science Topics by School SES
© 2008 Center for Research in Mathematics and Science Education, Michigan State University
Grade 8 Highest SES Schools
Biology
Chemistry
Physics
Earth Science
Other Topics
Grade 8 Lowest SES Schools

Mean Percent of Grade 8 Science Teaching Time
TopicHighest
SESLowest SES Difference
Biology 7 39 11+ Weeks
Earth Science
46 53 2+ Weeks
Physics 15 3 2+ Weeks
Other Topics
13 2 4 Weeks

Grade 8 MN Teachers’ Yearly Total Science Instructional Time by SES
© 2008 Center for Research in Mathematics and Science Education, Michigan State University
110
115
120
125
130
135
140
145
150
155
Less than 10 percent FRL 10 to 24.9 percent FRL 25 to 49.9 percent FRL 50 to 74.9 percent FRL 75 percent or more FRL

MN Students Overall Percent Correct on TIMSS 2007 Science Eighth Grade Test by Percentage of
FRL Students in School
© 2008 Center for Research in Mathematics and Science Education, Michigan State University
0.20
0.30
0.40
0.50
0.60
0.70
0.80
FRL>25% FRL25% to 50% FRL>50%
To
tal
Pro
po
rtio
n o
f T
IMS
S S
cien
ce I
tem
s C
orr
ect
Free/Reduced Lunch Percentage

0% 10% 20% 30% 40% 50% 60% 70% 80% 90% 100%
White
Black
Hispanic
Percent Students
Gro
upMN Grade 4 Students Eligible for School Lunch Program: NAEP 2005
Science Proficiency Levels by Ethnicity
Below basic
At basic
At proficient
At advanced

0% 10% 20% 30% 40% 50% 60% 70% 80% 90% 100%
FRL
Non-FRL
FRL
Non-FRL
FRL
Non-FRL
FRL
Non-FRL
FRL
Non-FRL
Whi
teW
hite
Whi
teW
hite
Blac
kBl
ack
Blac
kBl
ack
Hisp
ani
cHi
span
ic
2005
2005
2000
2000
2005
2005
2000
2000
2005
2005
Percent Students
MN Grade 4 Students: NAEP 2005 and 2000 Science Proficiency Levels by Ethnicity and School Lunch Eligibility
Below basic At basic At proficient At advanced

0% 10% 20% 30% 40% 50% 60% 70% 80% 90% 100%
Non-FRL
FRL
Non-FRL
FRL
Non-FRL
FRL
Whi
teW
hite
Whi
teW
hite
Blac
kBl
ack
2005
2005
2000
2000
2005
2005
MN Grade 8 Students: NAEP 2005 and 2000 Science Proficiency Levels by Ethnicity and School Lunch Eligibility
Below basic
At basic
At proficient
At advanced

0% 10% 20% 30% 40% 50% 60% 70% 80% 90% 100%
FRL
Non-FRL
FRL
Non-FRL
FRL
Non-FRL
FRL
Non-FRL
FRL
Non-FRL
FRL
Non-FRL
Whi
teW
hite
Whi
teW
hite
Whi
teW
hite
Blac
kBl
ack
Blac
kBl
ack
Blac
kBl
ack
2009
2009
2007
2007
2005
2005
2009
2009
2007
2007
2005
2005
MN Grade 4 Students: NAEP 2009, 2007 and 2005 Math Proficiency Levels by Ethnicity and School Lunch Eligibility
Below basic At basic At proficient At advanced