Embed Size (px)
Citation preview
HAL Id: inserm-00491402https://www.hal.inserm.fr/inserm-00491402
Submitted on 11 Jun 2010
HAL is a multi-disciplinary open accessarchive for the deposit and dissemination of sci-entific research documents, whether they are pub-lished or not. The documents may come fromteaching and research institutions in France orabroad, or from public or private research centers.
L’archive ouverte pluridisciplinaire HAL, estdestinée au dépôt et à la diffusion de documentsscientifiques de niveau recherche, publiés ou non,émanant des établissements d’enseignement et derecherche français ou étrangers, des laboratoirespublics ou privés.
Long-circulating DNA lipid nanocapsules as new vectorfor passive tumor targeting.
Marie Morille, Tristan Montier, Pierre Legras, Nathalie Carmoy, PriscilleBrodin, Bruno Pitard, Jean-Pierre Benoît, Catherine Passirani
To cite this version:Marie Morille, Tristan Montier, Pierre Legras, Nathalie Carmoy, Priscille Brodin, et al.. Long-circulating DNA lipid nanocapsules as new vector for passive tumor targeting.. Biomaterials, Elsevier,2010, 31 (2), pp.321-9. �10.1016/j.biomaterials.2009.09.044�. �inserm-00491402�
1
LONG-CIRCULATING DNA LIPID NANOCAPSULES AS NEW VECTOR FOR PASSIVE TUMOR
TARGETING
Morille M.1, Montier T.2, Legras P.3, Carmoy N.2, Brodin P.4, Pitard B.5, 6, Benoit J-P.1 and Passirani
C1*.
1Inserm U646, Université d'Angers, 10 rue André Boquel, F-49100 Angers, France; 2 INSERM U613, IFR 148 ScInBIoS, Université de Bretagne Occidentale, 46 rue Félix Le Dantec, CS 51819, 29218 Brest Cedex 2, France; 3Service Commun d’Animalerie Hospitalo-Universitaire, Faculté de Médecine, F-49100 Angers, France; 4Institut Pasteur Korea, 39-1 Hawolgok-dong, Seongbuk-gu, Seoul, 136-791, Korea; 5Inserm U915, F-44000 Nantes, France; 6Université de Nantes, Faculté de Médecine, Institut du Thorax, F-44000 Nantes, France. �Corresponding author. Tel.: +33 241 735850. Fax: +33 241 735853.
E-mail: [email protected]
2
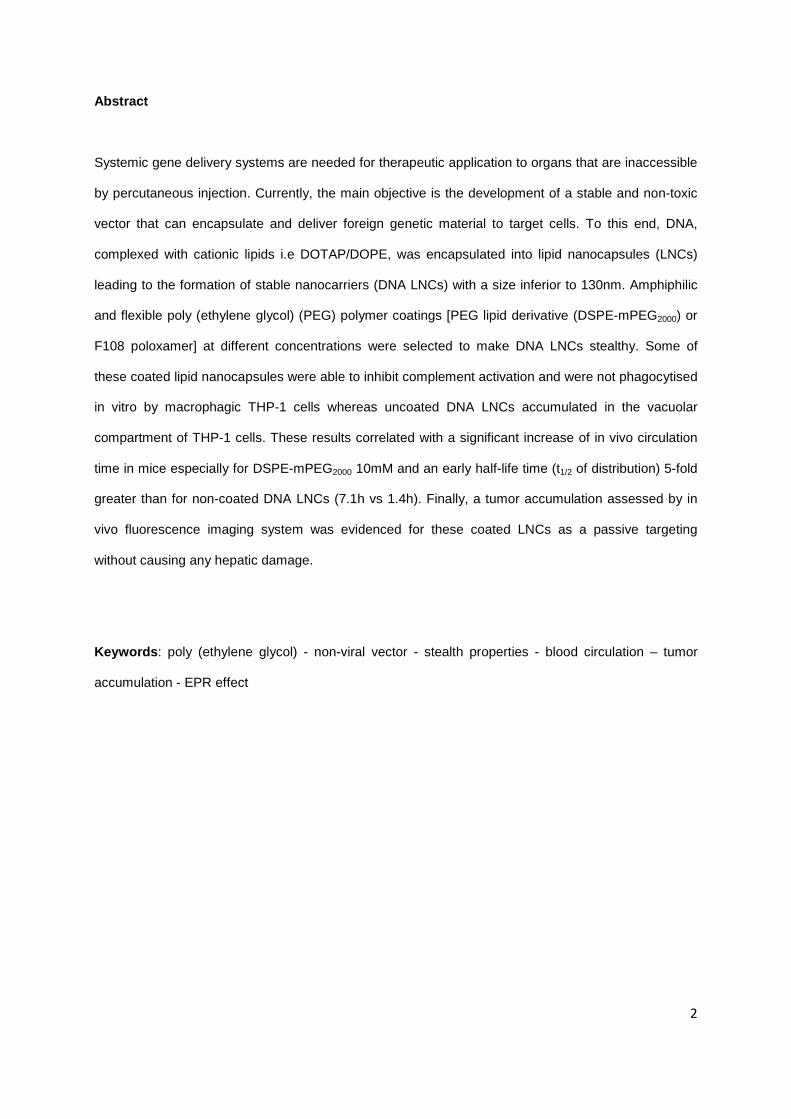
Abstract
Systemic gene delivery systems are needed for therapeutic application to organs that are inaccessible
by percutaneous injection. Currently, the main objective is the development of a stable and non-toxic
vector that can encapsulate and deliver foreign genetic material to target cells. To this end, DNA,
complexed with cationic lipids i.e DOTAP/DOPE, was encapsulated into lipid nanocapsules (LNCs)
leading to the formation of stable nanocarriers (DNA LNCs) with a size inferior to 130nm. Amphiphilic
and flexible poly (ethylene glycol) (PEG) polymer coatings [PEG lipid derivative (DSPE-mPEG2000) or
F108 poloxamer] at different concentrations were selected to make DNA LNCs stealthy. Some of
these coated lipid nanocapsules were able to inhibit complement activation and were not phagocytised
in vitro by macrophagic THP-1 cells whereas uncoated DNA LNCs accumulated in the vacuolar
compartment of THP-1 cells. These results correlated with a significant increase of in vivo circulation
time in mice especially for DSPE-mPEG2000 10mM and an early half-life time (t1/2 of distribution) 5-fold
greater than for non-coated DNA LNCs (7.1h vs 1.4h). Finally, a tumor accumulation assessed by in
vivo fluorescence imaging system was evidenced for these coated LNCs as a passive targeting
without causing any hepatic damage.
Keywords: poly (ethylene glycol) - non-viral vector - stealth properties - blood circulation – tumor
accumulation - EPR effect
3
1 - Introduction
For the treatment of unreachable organs and disseminated or metastatic cancer, it is now
essential to develop intravenous forms of gene therapy. However, systemic targeting remains a real
challenge. Synthetic vectors based on the use of cationic lipids or polymers associated to DNA appear
to have promising potential, given the safety problems encountered with viral vectors. Nevertheless,
the systemic injection of these synthetic carriers usually results in a toxic response linked to their
strong positive charge, incompatible with clinical applications [1].
Furthermore, when injected intravenously, colloidal carriers are rapidly cleared by the
mononuclear phagocyte system (MPS) mainly represented by Kupffer cells in the liver and spleen
macrophages. The recognition of the carriers by macrophages usually occurs through specific
recognition by cellular receptors specific for plasma proteins that have been adsorbed at the vector
surface. Among them, the C3 protein of the complement system plays a major role in the immune
system's recognition of foreign particles [2]. The concept of modifying the surface of vectors has
therefore been applied in order to decrease the opsonisation process and the specific or non-specific
recognition by MPS and blood components [3].
Heurtault et al.[4] developed lipid nanocapsules synthesised by a solvent-free method and
covered by PEG660 at high density, leading to really weak complement activation and low macrophage
uptake [3, 5]. In a previous work, the formulation of these nanocapsules was adapted to obtain DNA
nanocapsules (DNA LNCs) [6]. Thanks to the use of oleic Plurol® instead of Lipoid® in their
formulation, the lipid core allowed the entrapment of plasmid DNA molecules via the formation of
lipoplexes (cationic liposomes of DOTAP:DOPE complexed with plasmid DNA). DNA LNCs were small
(117 ± 10nm), suitable for an intravenous injection, but in vivo stability and blood half-life remained low
and were ill-adapted to efficient in vivo transfection [6].
To allow an extended circulation time, and consequently a higher tumor selectivity by passive
accumulation through the EPR (enhanced permeability and retention) effect [7], we chose to modify
the surface of our gene delivery systems, by inserting longer PEG chains at the surface of DNA LNCs
between the already-existing, dense PEG660 chains. This was carried out through the use of two kinds
of amphiphilic and flexible polymers. The first one was F108 block copolymer, consisting of ethylene
4
oxide (EO) and propylene oxide (PO) blocks arranged in a triblock structure (EO132–PO50–EO132). This
kind of amphiphilic polymer recently demonstrated great promise for the delivery of pDNA, thanks to
its proven in vivo transfection efficiency [8-11]. The second one was a lipid PEG derivative, 1,2-
distearoyl-sn-glycero-3-phosphoethanolamine-N-[methoxy(polyethyleneglycol)-2000] (DSPE-
mPEG2000). The ability of the different particles to escape complement activation and uptake by THP-1
macrophages was investigated. Then the long-circulating properties of these particles in vivo after
intravenous injection in mice and their tumor accumulation ability by NIR fluorescence imaging system
were evaluated. In parallel, blood samples were harvested to measure the hepatotoxic impact of the
different formulations before and after injection.
5
2 - Materials and methods
2.1 - Preparation of the nano-colloids
2.1.1 - Liposomes
DOTAP (1,2-DiOleoyl-3-TrimethylAmmonium-Propane) and DOPE (1,2-DiOleyl-sn-glycero-3-
PhosphoEthanolamine) (Avanti Polar Lipids, Inc, Alabaster, USA) were first dissolved in chloroform
(Sigma, Saint-Quentin Fallavier, France) and then dried by an evaporation process under vacuum.
The formed lipid film was hydrated with deionized water. Then liposomes were sonicated for 20
minutes. Lipoplexes were prepared by mixing DOTAP/DOPE (1/1, M/M) liposomes with 660µg of
luciferase-encoding plasmid [10] (pgWIZ-luciferase amplified and research grade purified by
GENEART, Regensburg, Germany) at a charge ratio of 5 (+/-) in 150mM NaCl.
2.1.2 - DNA-loaded lipid nanocapsules (DNA LNCs)
The formulation of LNCs was based on a phase-inversion process described by Heurtault et
al.[12]. LNCs were composed of lipophilic Labrafac® WL 1349 (caprylic-capric acid triglycerides,
European Pharmacopeia, IVth, 2002) and oleic Plurol® (Polyglyceryl-6 dioleate) which were kindly
provided by Gatefossé S.A. (Saint-Priest, France) and Solutol® HS-15 (30% of free polyethylene glycol
660 and 70% of polyethylene glycol 660 hydroxystearate (HS-PEG) European Pharmacopeia, IVth,
2002) which was a gift from BASF (Ludwigshafen, Germany). Briefly, 3.9 % of oleic Plurol® (w/w), 5.9
% of Solutol® (w/w), 9.9 % of Labrafac® (w/w), 78.9 % of water (w/w) and 1.4 % of NaCl, were mixed
together under magnetic stirring. DNA LNCs were synthesized as already described[6]. Fluorescent
lipid nanocapsules (DiI or DiD empty LNCs and DiI or DiD DNA LNCs) were obtained by a previously-
described method [13]. Briefly, 1,1'-dioctadecyl-3,3,3',3'-tetramethylindocarbocyanine perchlorate (DiI,
emission wavelength (em.) = 549nm; excitation wavelength (exc.) = 565nm) or 1,1'-dioctadecyl-
3,3,3',3'-tetramethylindodicarbocyanine perchlorate (DiD, em.= 644nm; exc.= 665nm) (Invitrogen,
Cergy Pontoise, France) was dissolved in acetone at 60/00 (w/w) and the resulting DiI or DiD stock
solution was incorporated in Labrafac® (1:10 (w/w)). Finally, acetone was evaporated before use.
2.1.3 - Preparation of coated nanocapsules by post-insertion
6
Two kinds of polymers were used for post-insertion: 1,2-DiStearoyl-sn-glycero-3-
PhosphoEthanolamine-N-[methoxy(polyethyleneglycol)-2000] (DSPE–mPEG2000) (Mean Molecular
Weight (MMW) = 2,805g/mol) (Avanti Polar Lipids, Inc, Alabaster, USA) or Pluronic® F108
(Poly(ethyleneoxide)132-poly(propyleneoxide)50-poly(ethyleneoxide)132) (MMW = 14,600g/mol) kindly
provided by BASF. These polymers were added to LNCs in order to obtain a final concentration of 2, 5
and 10mM for DSPE–mPEG2000 and 1, 2, 3 mM respectively for F108. Prior to the post-insertion, the
LNCs were purified thanks to the use of PD10 Sephadex columns (Amersham Biosciences Europe,
Orsay, France) and then concentrated by ultrafiltration with Millipore Amicon® Ultra-15 centrifugal filter
devices (Millipore, St Quentin-Yvelines, France). This purification step providing a desalting effect, the
salt concentration of the suspension was therefore adapted to obtain a physiologic concentration of
NaCl (150mM). Pre-formed LNCs and DSPE-mPEG2000 or F108 micelles were co-incubated for 4h at
30°C. The mixture was vortexed every 15 minutes and then quenched in an ice bath for 1 minute. To
provide controls, the same thermal treatments were applied to LNC suspensions without polymers.
2.1.4 - Polymethyl methacrylate nanoparticles (PMMA NP)
Polymethyl methacrylate (PMMA) nanoparticles were synthesized by the polymerisation of
methyl methacrylate (MMA, Merck, Hohenbrunn, Germany) as described previously[14]. To obtain
fluorescent PMMA NPs, the pre-formed PMMA particles were allowed to swell in methanol during an
incubation period of 2h at room temperature with DiI dissolved in acetone. The water-insoluble DiI
diffused into the PMMA nanoparticles and was entrapped when the solvent was removed through the
evaporation process, for 30min. at 70°C.
2.2 - Characterisation of the nanoparticles
2.2.1 - Physico-chemical characteristics of coated DNA LNCs
The average hydrodynamic diameter and the polydispersity index (PI) of the LNCs were
determined by dynamic light scattering (DLS) using a Malvern Zetasizer® (Nano Series DTS 1060,
Malvern Instruments S.A., Worcestershire, UK). A 1:100 dilution of the nanoparticle in deionized water
was processed and size measurement was performed at 25°C (in triplicate). The measure of zeta
7
potential was achieved on nanoparticle suspensions at 150mM NaCl diluted in deionized water at
1:100, providing a final salt concentration of 1,5mM.
2.2.2 - DNA stability study
The stability of nanocapsule suspensions during storage at 4°C was assessed by measuring
the size distribution. The stability was also tested after centrifugation at 15,000g at room temperature
for 20min in order to visualize any demixing among the components. The stability of encapsulation and
the integrity of DNA molecules after the process of nanocapsule formulation, and post-insertion were
evaluated by agarose gel electrophoresis. A volume of LNCs or lipoplexe suspension equivalent to
0.2µg of DNA before and after treatment with Triton® 100X (Sigma, Saint-Quentin Fallavier, France)
was mixed with gel-loading solution (Sigma, Saint-Quentin Fallavier, France) and deposited in each
well of 1% agarose gel containing ethidium bromide (Sigma, Saint-Quentin Fallavier, France). Controls
were constituted by using 0.2µg of free DNA in solution or associated to cationic lipids. Samples were
migrated 20min at 100V in a Tris- EDTA buffer.
2.3 - Macrophage uptake evaluation
2.3.1 - Cell culture
THP-1 cells (human monocyte/macrophage cell line obtained by ATCC, Manassas, VA, USA)
were grown in suspension in a humidifier-incubator (5% CO2) at 37°C in ATCC suggested medium.
Cells were cultured in the same medium with 200mM Phorbol 12-myristate 13-acetate (PMA, Sigma,
Saint-Quentin Fallavier, France) for 24h to allow adherence and differentiation [15]. The medium was
then aspired (to eliminate non-adhered cells) and the cells were subsequently incubated in a new
medium for an additional 24h prior to uptake studies. Cells were harvested and counted using Trypan
blue exclusion assay with a haemacytometer. Cells (0.6 x 10⁶/ml) were plated on sterile, 24-well cell
culture clusters, and then allowed to grow for 24h at 37°C.
2.3.2 - Cytotoxicity assay
The 24-well plates were exposed to different suspensions (free DNA, free lipoplexes, empty
LNCs, and DNA LNCs, at a DNA concentration equivalent to the DNA LNCs one, excepted for empty

8
LNCs). Nanoparticles were prepared at a DNA concentration of 446µg/ml and 1:10 cascade dilutions
were performed in culture (44.6, 4.46 and 0.446µg/ml). After 48h of exposure, cell viability was
determined by the MTT test performed in triplicate according to the procedure described by Mosmann
[16]. Briefly, 40µl of MTT solution at 5mg/ml in phosphate-buffered saline (PBS) 1X was added to each
well, and then the plates were incubated at 37°C fo r 4h. The medium was removed and 200µl of
0.06N acid–isopropanol was added to each well and mixed thoroughly to completely dissolve the dark
blue crystals. The optical density was measured at 580nm using a Microplate reader Multiskan Ascent
(Thermo Fisher Scientific, Cergy-Pontoise, France).
2.3.3 - Internalization study by cellular imaging
Cells were incubated with a series of 2-fold dilutions of Dil-labelled LNC suspensions starting
from 1/100. After 20min or 24h, macrophages were stained with Syto60 (Invitrogen, Cergy Pontoise,
France). Confocal images were recorded on an automated fluorescent confocal microscope OperaTM
(PerkinElmer) using a 20X-water objective (NA 0.70). Dil-labelled LNCs were detected using a 532nm
laser coupled with a 565/50nm detection filter (green channel) and cells labelled with Syto 60 were
identified with a 635nm laser coupled with a 690/40nm detection filter (red channel). Four independent
pictures were taken for each plate well and each image was then processed in order to quantify the
number of green LNCs and cells.
2.4 - Complement activation study
Complement consumption was assessed in normal human serum (NHS) (provided by the
Etablissement Francais du Sang, CHU, Angers, France) by measuring the residual haemolytic
capacity of the complement system after contact with the different particles[2]. The technique
consisted in determining the amount of serum able to lyse 50% of a fixed number of sensitized sheep
erythrocytes with rabbit anti-sheep erythrocyte antibodies (CH50), according to the procedure
described elsewhere [5]. Complement activation was expressed as a function of the surface area in
order to compare particles with different mean diameters. Nanoparticle surface areas were calculated
as described elsewhere[14], using the equation: S = n4πr2 and V = n(4/3)(πr3) leading to S = 3m/rρ
where S is the surface area (cm2) and V the volume (cm3) of n spherical beads of average radius r
9
(cm), m the weight (µg) and ρ the volumetric mass (µg/cm3). All experiments were performed in
triplicate and a t-test of non-matched samples was used to test for the statistical significance of the
results.
2.5 - In vivo hepato-toxicity study after IV injection
Blood samples (~200 µL) were collected from the saphenous vein of the mice on a heparin
tube before and 24 h after administration. Tubes were then centrifuged at 10000×g for 2 min at +4 °C
and plasma were harvested to measure the activity of the ALAT (alanine amino transferase) and
ASAT (aspartate aminotransferase) enzymes. For ALAT measurements, two solutions were needed
(S1 = Tris buffer at pH 7.5: 125mmol/L ; L-aspartate: 680 mmol/L ; LDH>2000 U/L and S2 = α-
cetoglutarate 97 mmol/L; NADH 1.1mmol/L). First, 200µL of S1 were mixed with 50µL of S2 during 20
sec. Then, 25µL of plasma were added to the mixture. After 50 sec of incubation at room temperature,
the absorbance at 340 nm was measured immediately and 60 sec later. The ALAT activity was
expressed in UI/L and resulted of the product between the variation of the absorbance (∆A/min) and a
coefficient σ [σ = (final volume in mL * 1000) / (serum volume in mL * length of the optical distance *
6.3) (6.3 corresponding to the absorption of NADH at 340nm)]. Here, the σ coefficient was equal to
1746. For ASAT evaluation, the protocol was the strictly same, except that solutions S1 and S2 have
been adapted (S1 = Tris buffer at pH 7.8: 100 mmol/L ; L-aspartate: 330 mmol/L ; LDH> 2000 U/L ;
MDH>1000 U/L and S2 = α-cetoglutarate 78 mmol/L ; NADH 1.1mmol/L). The measurements of the
ALAT and ASAT transaminases released into the serum reflected the toxicity, notably the
hepatological impact, of the various formulations. Our method adapted for small blood volume allowed
performing a kinetic of the transaminase activity on each animal, limiting the device induced by inter-
individual variations that resulted from the techniques that required sacrifice of the animals to get
enough volume.
2.6 - Blood kinetic study
Animal care was administered in strict accordance to French Ministry of Agriculture
regulations. One hundred and fifty microlitres of fluorescent LNCs were injected in the tail vein of six-
week old female Swiss mice (20-22g) (Ets Janvier, Le Genest-St-ile, France). The fluorescence was
10
measured at Time 1, 5, 15, 30, 60, 120, 240, 300min. and 24h. At each time, blood sampling was
performed by cardiac puncture on 3 mice and each sample was centrifuged for 10min at 2,000g in a
venous blood collection tube (Vacutainer, SST II Advance, 5 ml, Becton Dickinson France SAS, Le
Pont-De-Claix, France). One hundred and fifty microlitres of the supernatant were deposited in a
black, 96-well plate (Greiner Bio-one, Frickenhausen, Germany). Empty samples were constituted by
the supernatant of centrifuged blood taken from 3 mice injected with an isotonic solution (150mM
NaCl), representing the residual fluorescence of the plasma. DiI fluorescence (ex: 544 nm, em: 590
nm) was counted by a Fluoroscan (Ascent FL, Thermo Fisher Scientific, Cergy-Pontoise, France) and
the results were analyzed with the Ascent software for Fluoroscan (Thermo Fisher Scientific, Cergy-
Pontoise, France). The blood concentration of the different particles at the various times was
calculated on the assumption that blood represents 7.5% of mouse body weight [17]. Fluorescence
was expressed in fluorescence units (FU) and was calculated as: FUsample - FUempty. 100% of
fluorescence was considered as the value at t=1 min.
Pharmacokinetic data were treated by non-compartmental analysis of the percentage of the
injected dose versus time profiles with Kinetica 4.1.1 software (Thermo Fisher Scientific, Villebon sur
Yvette, France). The half-lives were calculated as following: t1/2=Log(2)/Lz. The Lz was determined
from linear regression using defined intervals (5h and 24h for t1/2 distribution [0-5h] and t1/2 elimination
[0-24h] respectively). The trapezoidal rule was used to calculate the area under the curve (AUC)
during the whole experimental period (AUC [0-24h]) without extrapolation, as well as the area under
the first moment curve (AUMC). The mean residence time was calculated from 0 to 5h, from the
following equation: MRT [0-5h] = AUMC [0-5h] / AUC [0-5h].
2.7 - In vivo fluorescence imaging
Tumor bearing mice were prepared by injecting subcutaneously a suspension of 1 x 10⁶
U87MG glioma cell line (ATCC, Manassas, VA) in 150µl of Hanks Balanced Saline Solution (HBSS)
into the right flank of athymic nude mice (6 weeks old females, 20-24g, purchased from Charles
Rivers, Wilmington, Ma). In order to evaluate the biodistribution of coated DNA LNCs and uncoated
DNA LNCs in tumor bearing mice, LNCs were labeled with DiD, a near-infrared (NIR) fluorophore.
11
After 21 days, 150µl of nanoparticles were injected via the tail vein of the mice presenting tumors on
their right flank. Non invasive fluorescent imaging was then performed 3h, 5h, 24h and 48h post-
injection using the biofluorescence imaging (BFI) system of the LB 983 NightOWL II (Berthold France
– Thoiry - France) equipped with cooled slow scan CCD camera and driven with the WINLIGHT
software. (Berthold France, Thoiry, France). As DiD fluorescent tag was used to localize the
nanoparticles, the 590nm excitation filter and the 655nm emission filter were selected. In parallel, the
light beam was kept constant for each fluorescent measurement, which was ideal with the ringlight epi
illumination. If the ringlight was always set at the same height, the excitation energy on the sample
would always be the same.
Each mouse was anesthetized with a 4% air-isofluran blend. Once laid in the acquisition
chamber, the anesthesia of the mice was maintained with a 2% air-isofluran mixture all along the
experiment. With the BFI system, the fluorescent acquisition time was 2 sec and the fluorescent signal
was then overlaid on a picture of the mice.
CCD camera collected light coming out from the skin of the animal without any a priori
information regarding the deepness of the sources. However, excitation and emission photons
employed in our experiments have a mean path before absorption of 1-2 cm, and this property
depends on the optical characteristic of tissues themselves. Thus, since the photons can pass up to 2
cm through the animal body, sources located up to 2 cm below the skin can be visualized. However, in
order to unambiguously localize the fluorescent dye accumulated in specific anatomical areas, a much
more detailed study should be performed.
12
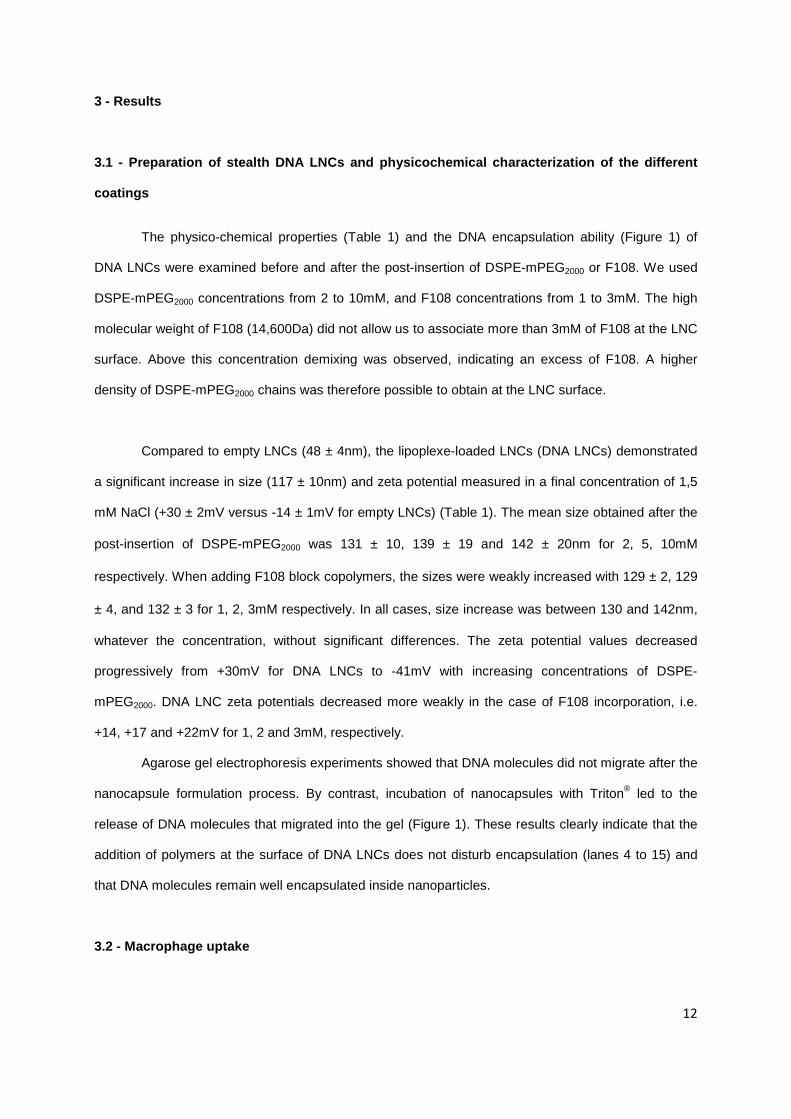
3 - Results
3.1 - Preparation of stealth DNA LNCs and physicochemical characterization of the different
coatings
The physico-chemical properties (Table 1) and the DNA encapsulation ability (Figure 1) of
DNA LNCs were examined before and after the post-insertion of DSPE-mPEG2000 or F108. We used
DSPE-mPEG2000 concentrations from 2 to 10mM, and F108 concentrations from 1 to 3mM. The high
molecular weight of F108 (14,600Da) did not allow us to associate more than 3mM of F108 at the LNC
surface. Above this concentration demixing was observed, indicating an excess of F108. A higher
density of DSPE-mPEG2000 chains was therefore possible to obtain at the LNC surface.
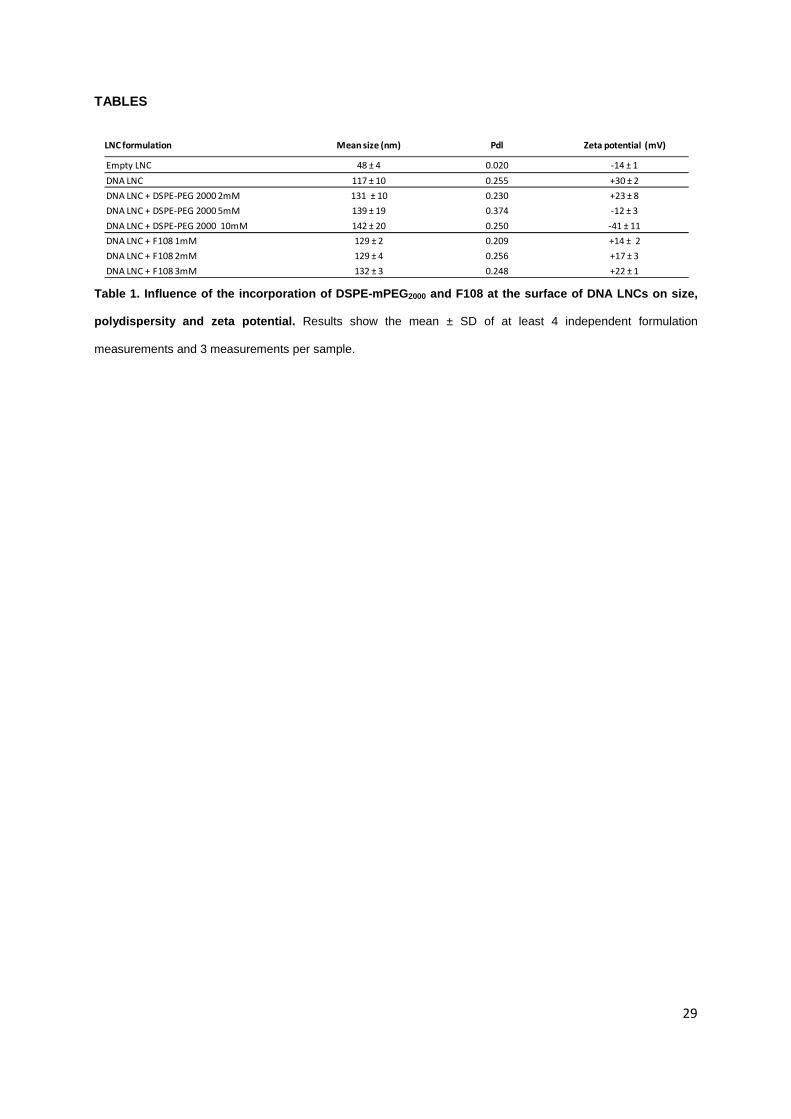
Compared to empty LNCs (48 ± 4nm), the lipoplexe-loaded LNCs (DNA LNCs) demonstrated
a significant increase in size (117 ± 10nm) and zeta potential measured in a final concentration of 1,5
mM NaCl (+30 ± 2mV versus -14 ± 1mV for empty LNCs) (Table 1). The mean size obtained after the
post-insertion of DSPE-mPEG2000 was 131 ± 10, 139 ± 19 and 142 ± 20nm for 2, 5, 10mM
respectively. When adding F108 block copolymers, the sizes were weakly increased with 129 ± 2, 129
± 4, and 132 ± 3 for 1, 2, 3mM respectively. In all cases, size increase was between 130 and 142nm,
whatever the concentration, without significant differences. The zeta potential values decreased
progressively from +30mV for DNA LNCs to -41mV with increasing concentrations of DSPE-
mPEG2000. DNA LNC zeta potentials decreased more weakly in the case of F108 incorporation, i.e.
+14, +17 and +22mV for 1, 2 and 3mM, respectively.
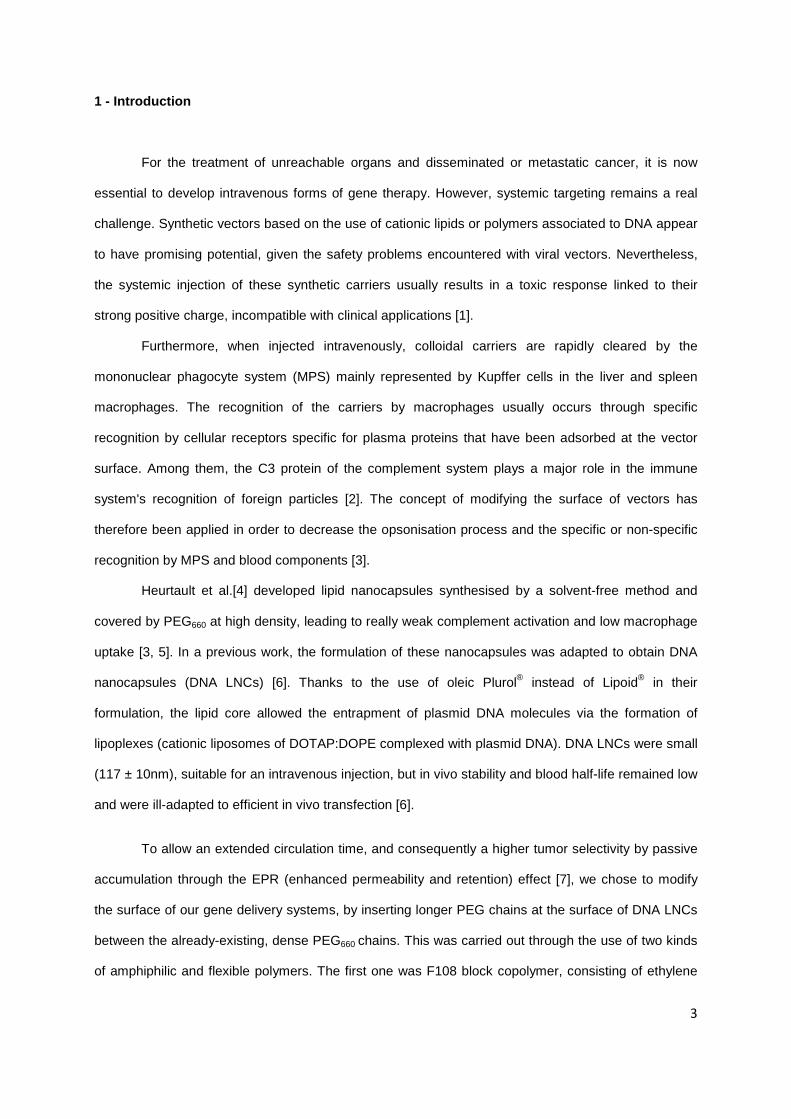
Agarose gel electrophoresis experiments showed that DNA molecules did not migrate after the
nanocapsule formulation process. By contrast, incubation of nanocapsules with Triton® led to the
release of DNA molecules that migrated into the gel (Figure 1). These results clearly indicate that the
addition of polymers at the surface of DNA LNCs does not disturb encapsulation (lanes 4 to 15) and
that DNA molecules remain well encapsulated inside nanoparticles.
3.2 - Macrophage uptake

13
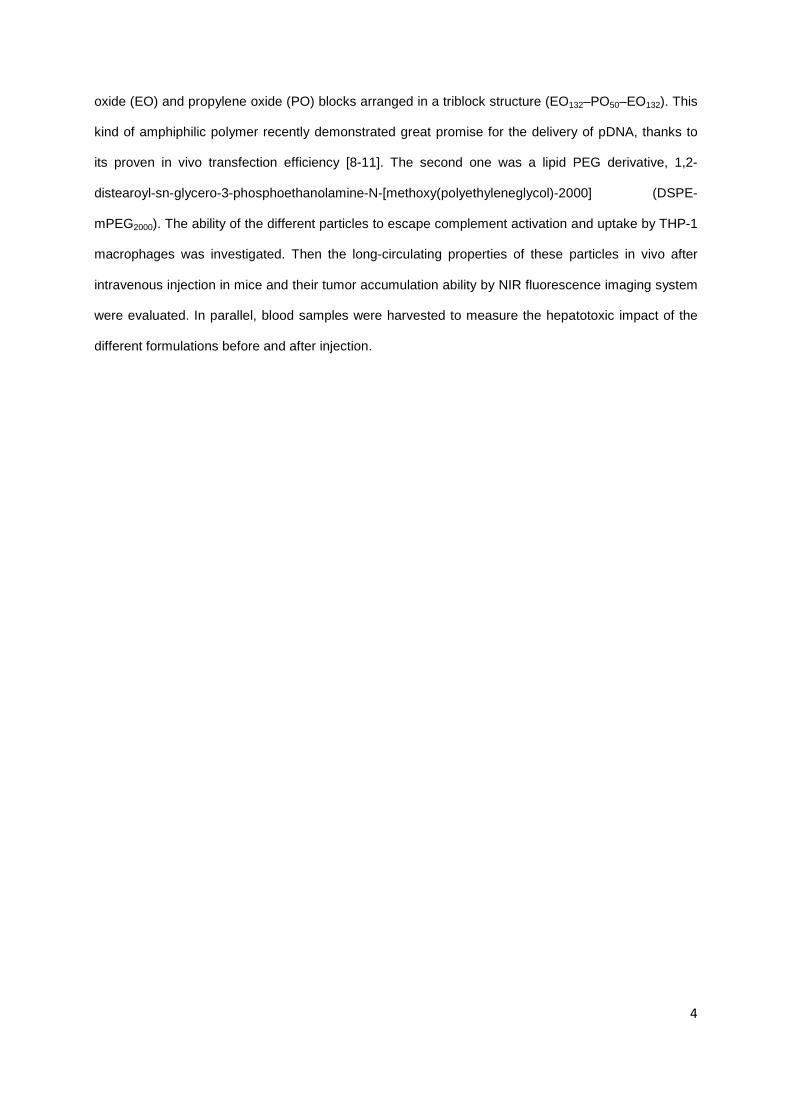
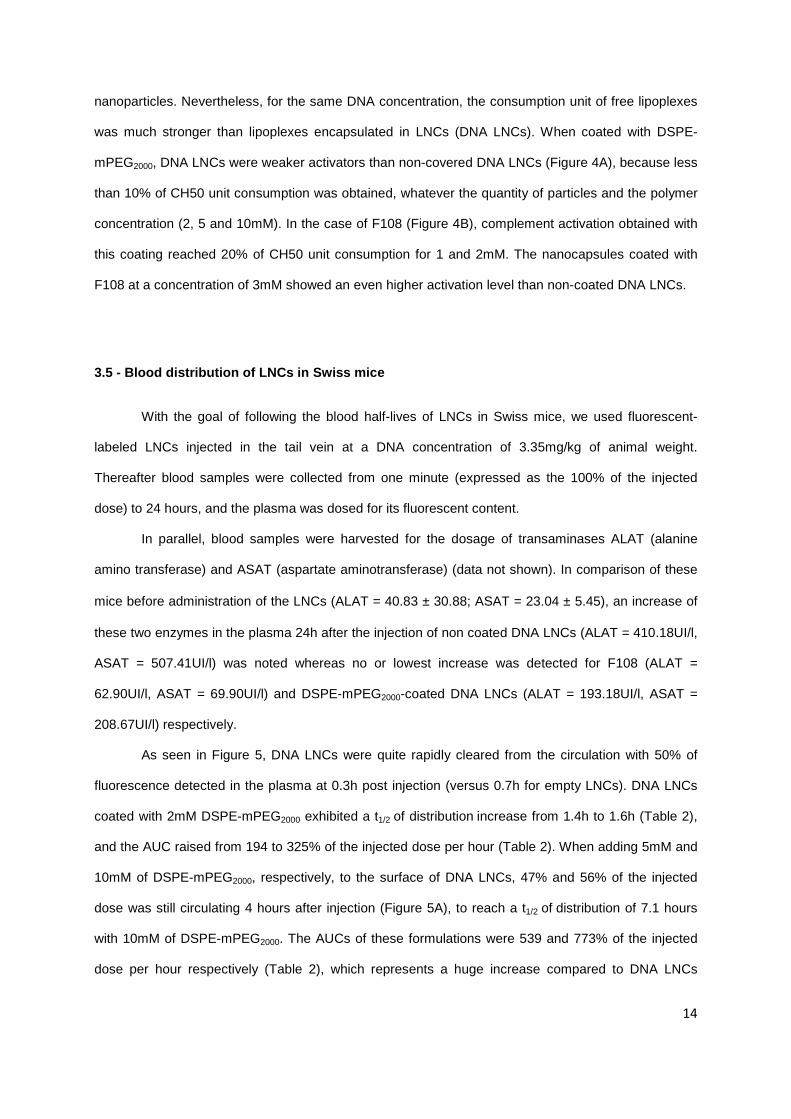
Free lipoplexes, empty LNCs or encapsulated lipoplexes (DNA LNCs) were firstly tested for
their cytotoxicity against THP-1 cells (Figure 2). Free DNA was clearly non-toxic to THP-1 cells
whatever the concentration from 0.46 to 44.6µg/ml. Empty LNCs and DNA LNCs were not toxic at
concentrations under 4.46µg/ml. By contrast, at this concentration, free lipoplexes induced significant
cell death (45% of cell survival versus 100% for LNCs encapsulating the same DNA concentration).
The encapsulation of lipoplexes in LNCs thus provided an efficient loss of toxicity.
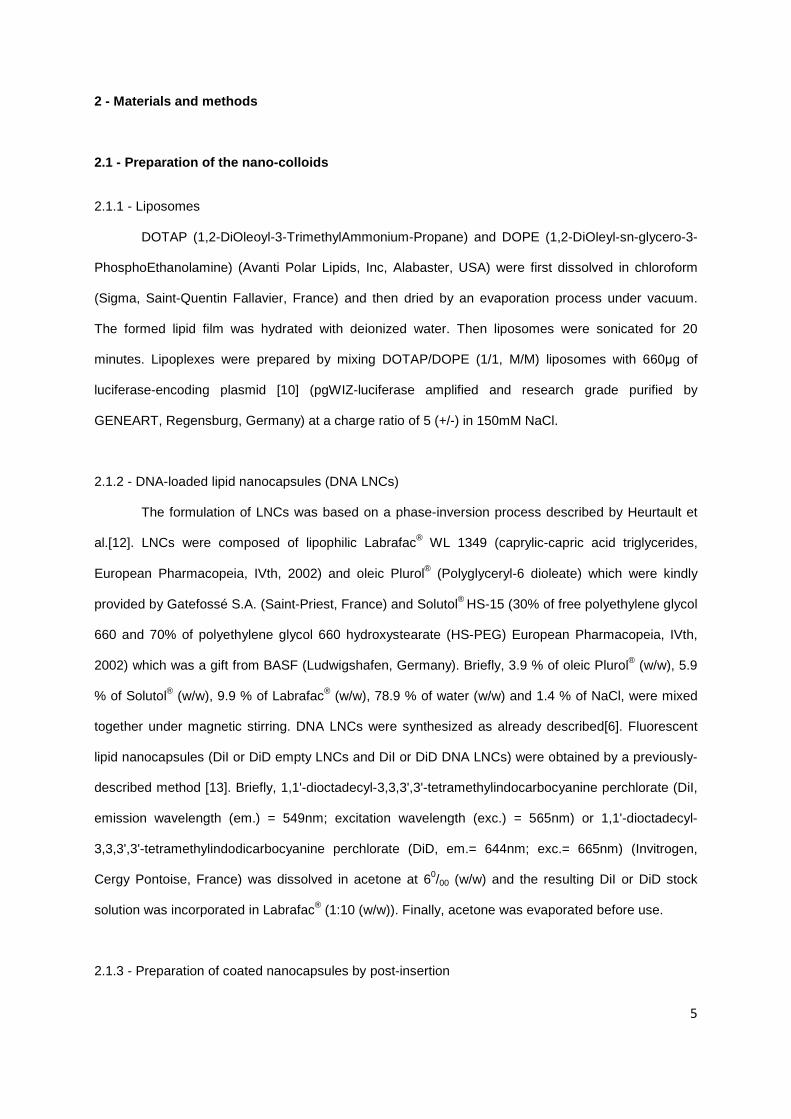
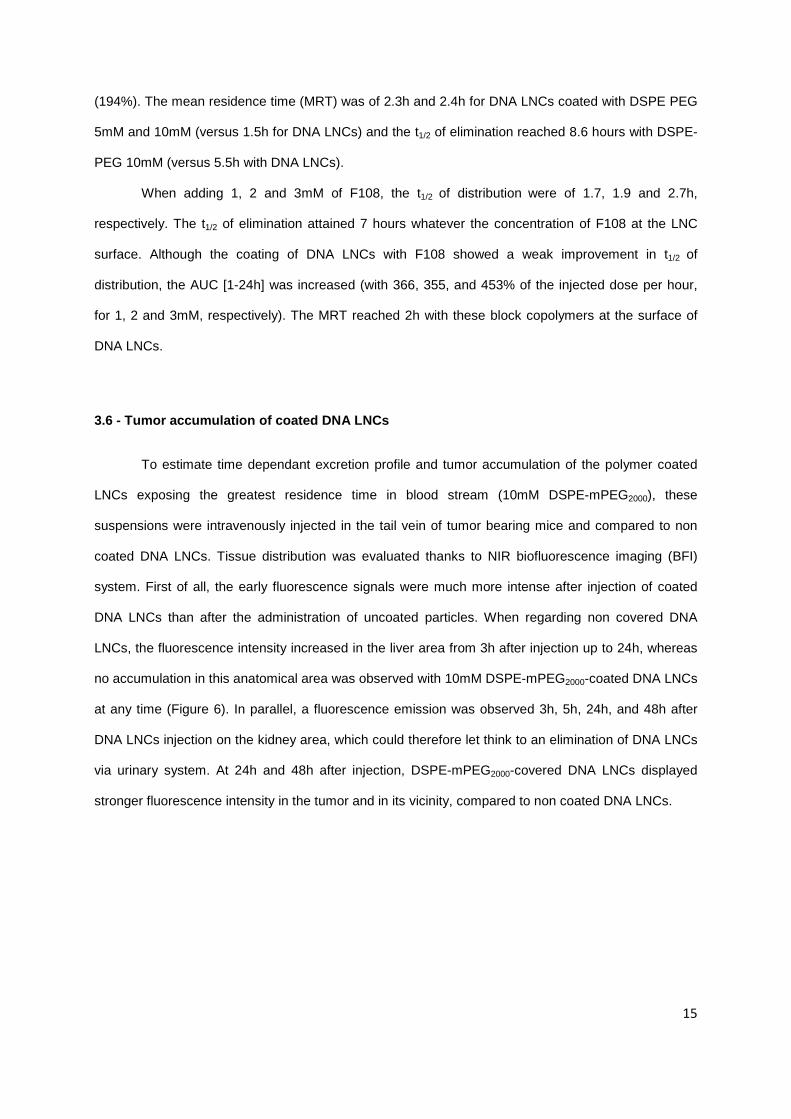
The influence of PEG concentration and chain length in empty and DNA-LNCs on
macrophage uptake was then studied. For this purpose, fluorescent LNCs were synthesized allowing
the tracking of these vectors inside macrophage cells (THP-1 lineage) by fluorescent confocal
microscopy (Figure 3A). DNA LNCs were loaded with both DiI fluorochrome (associated to the lipid
core) and lipoplexes. The cells were treated with a dose of 1.5mg/ml of nanocapsules (representing
4.46µg of DNA per ml). DNA LNCs and 2mM F108-coated DNA LNCs were internalised within 20
minutes at 37°C, mostly inside vesicles. Empty LNCs and 5mM DSPE-mPEG2000-coated DNA LNCs
did not give any signal within the cells, suggesting the absence of particle uptake. This was confirmed
by quantitative analysis exposing the number of dots per cell (Figure 3B) and showing that DSPE-
mPEG2000-coated DNA LNCs have the same behavior as empty LNCs. Same data were obtained after
24 hours of incubation at 37°C (data not shown).
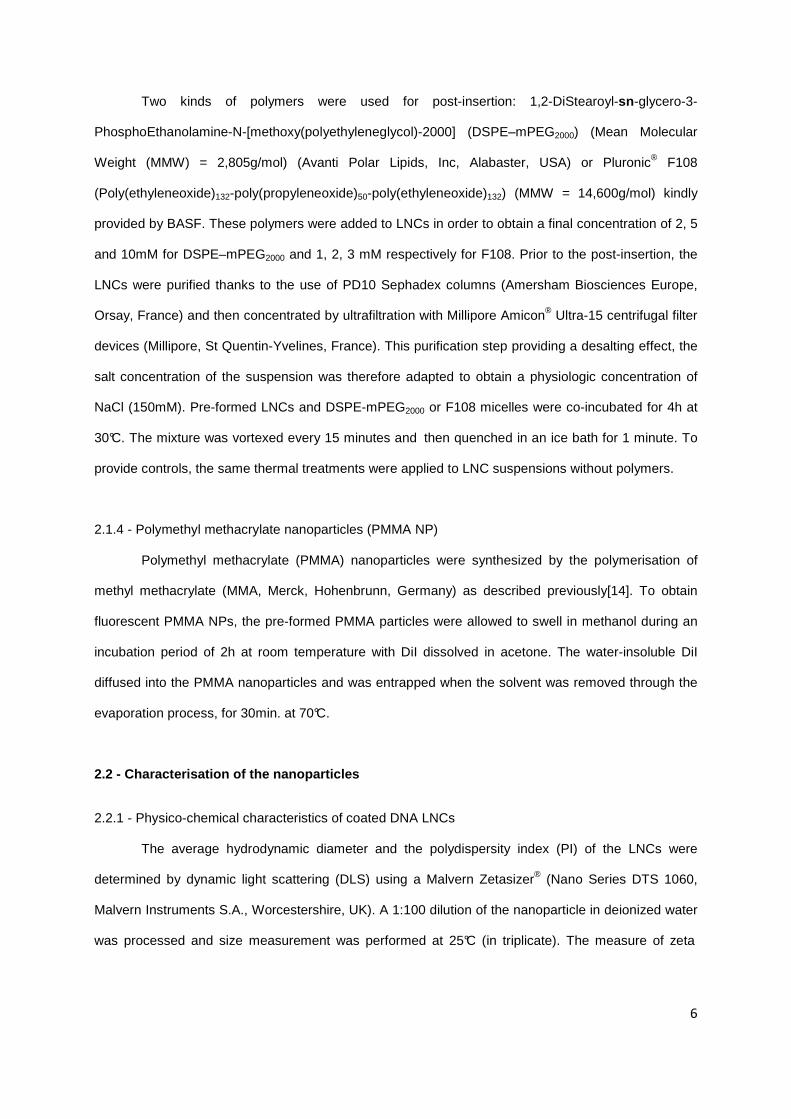
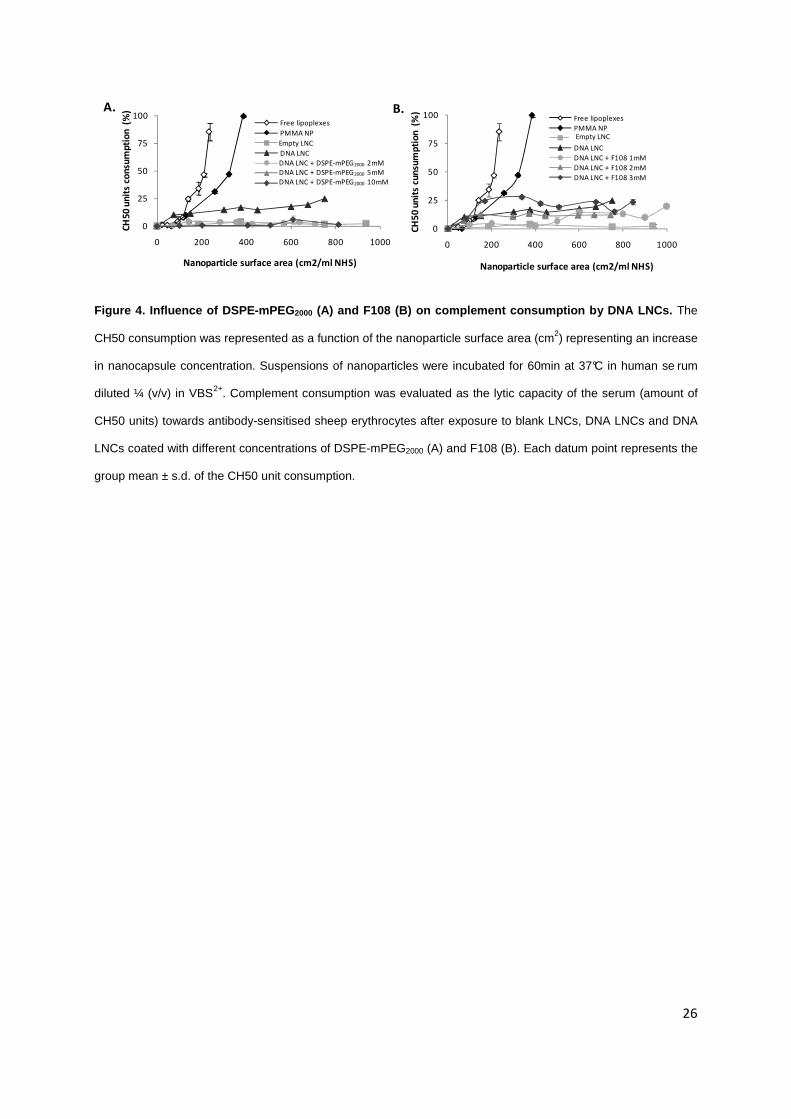
3.3 - Complement consumption
Complement consumption was evaluated as the lytic capacity of the serum towards 50% of
antibody-sensitized sheep erythrocytes (CH50 units) after exposure to free lipoplexes, empty LNCs,
DNA LNCs and DNA LNCs coated with different concentrations of DSPE-mPEG2000 (Figure 4A) and
F108 (Figure 4B).
PMMA nanoparticles, already described as strong complement activators [14], exposed a CH50
consumption of 100% at low concentrations (expressed in nanoparticle surface area). Free lipoplexes,
which are positively charged, were even stronger activators than PMMA particles, with 100% of CH50
unit consumption for a lower concentration. The consumption of CH50 units reached a maximum of
5% for empty LNCs, whereas DNA LNCs led to 25% of consumption with the same quantity of
14
nanoparticles. Nevertheless, for the same DNA concentration, the consumption unit of free lipoplexes
was much stronger than lipoplexes encapsulated in LNCs (DNA LNCs). When coated with DSPE-
mPEG2000, DNA LNCs were weaker activators than non-covered DNA LNCs (Figure 4A), because less
than 10% of CH50 unit consumption was obtained, whatever the quantity of particles and the polymer
concentration (2, 5 and 10mM). In the case of F108 (Figure 4B), complement activation obtained with
this coating reached 20% of CH50 unit consumption for 1 and 2mM. The nanocapsules coated with
F108 at a concentration of 3mM showed an even higher activation level than non-coated DNA LNCs.
3.5 - Blood distribution of LNCs in Swiss mice
With the goal of following the blood half-lives of LNCs in Swiss mice, we used fluorescent-
labeled LNCs injected in the tail vein at a DNA concentration of 3.35mg/kg of animal weight.
Thereafter blood samples were collected from one minute (expressed as the 100% of the injected
dose) to 24 hours, and the plasma was dosed for its fluorescent content.
In parallel, blood samples were harvested for the dosage of transaminases ALAT (alanine
amino transferase) and ASAT (aspartate aminotransferase) (data not shown). In comparison of these
mice before administration of the LNCs (ALAT = 40.83 ± 30.88; ASAT = 23.04 ± 5.45), an increase of
these two enzymes in the plasma 24h after the injection of non coated DNA LNCs (ALAT = 410.18UI/l,
ASAT = 507.41UI/l) was noted whereas no or lowest increase was detected for F108 (ALAT =
62.90UI/l, ASAT = 69.90UI/l) and DSPE-mPEG2000-coated DNA LNCs (ALAT = 193.18UI/l, ASAT =
208.67UI/l) respectively.
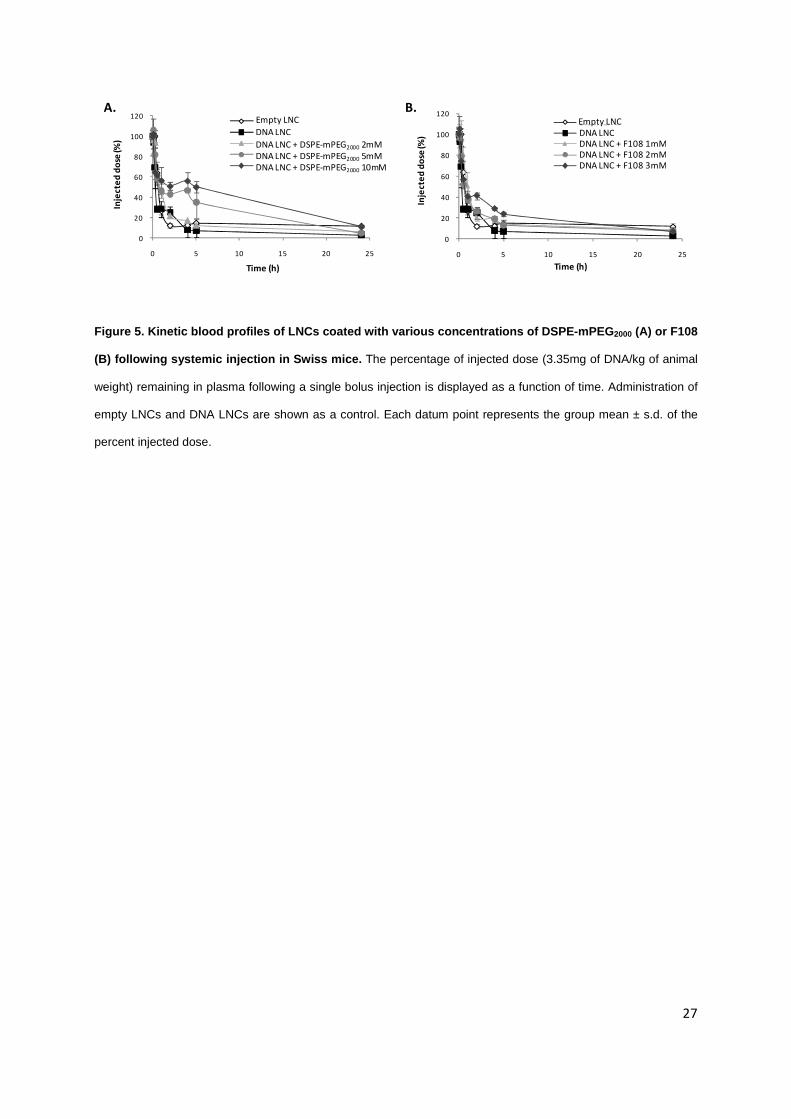
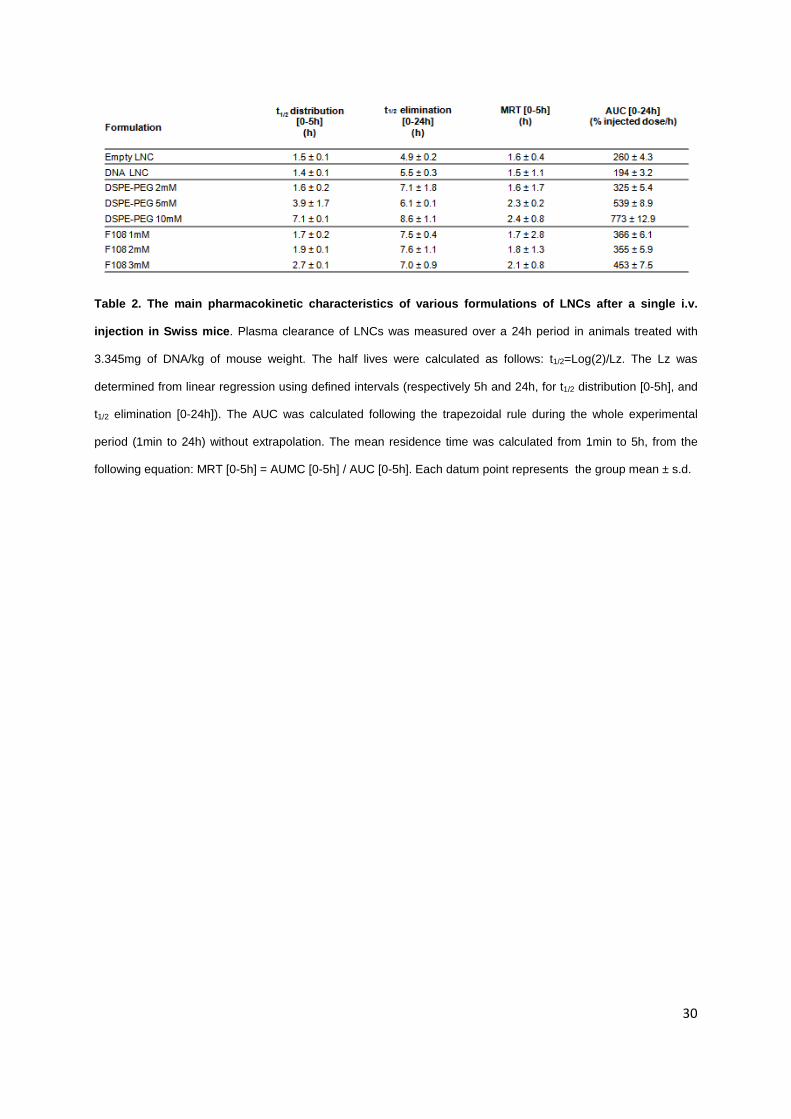
As seen in Figure 5, DNA LNCs were quite rapidly cleared from the circulation with 50% of
fluorescence detected in the plasma at 0.3h post injection (versus 0.7h for empty LNCs). DNA LNCs
coated with 2mM DSPE-mPEG2000 exhibited a t1/2 of distribution increase from 1.4h to 1.6h (Table 2),
and the AUC raised from 194 to 325% of the injected dose per hour (Table 2). When adding 5mM and
10mM of DSPE-mPEG2000, respectively, to the surface of DNA LNCs, 47% and 56% of the injected
dose was still circulating 4 hours after injection (Figure 5A), to reach a t1/2 of distribution of 7.1 hours
with 10mM of DSPE-mPEG2000. The AUCs of these formulations were 539 and 773% of the injected
dose per hour respectively (Table 2), which represents a huge increase compared to DNA LNCs
15
(194%). The mean residence time (MRT) was of 2.3h and 2.4h for DNA LNCs coated with DSPE PEG
5mM and 10mM (versus 1.5h for DNA LNCs) and the t1/2 of elimination reached 8.6 hours with DSPE-
PEG 10mM (versus 5.5h with DNA LNCs).
When adding 1, 2 and 3mM of F108, the t1/2 of distribution were of 1.7, 1.9 and 2.7h,
respectively. The t1/2 of elimination attained 7 hours whatever the concentration of F108 at the LNC
surface. Although the coating of DNA LNCs with F108 showed a weak improvement in t1/2 of
distribution, the AUC [1-24h] was increased (with 366, 355, and 453% of the injected dose per hour,
for 1, 2 and 3mM, respectively). The MRT reached 2h with these block copolymers at the surface of
DNA LNCs.
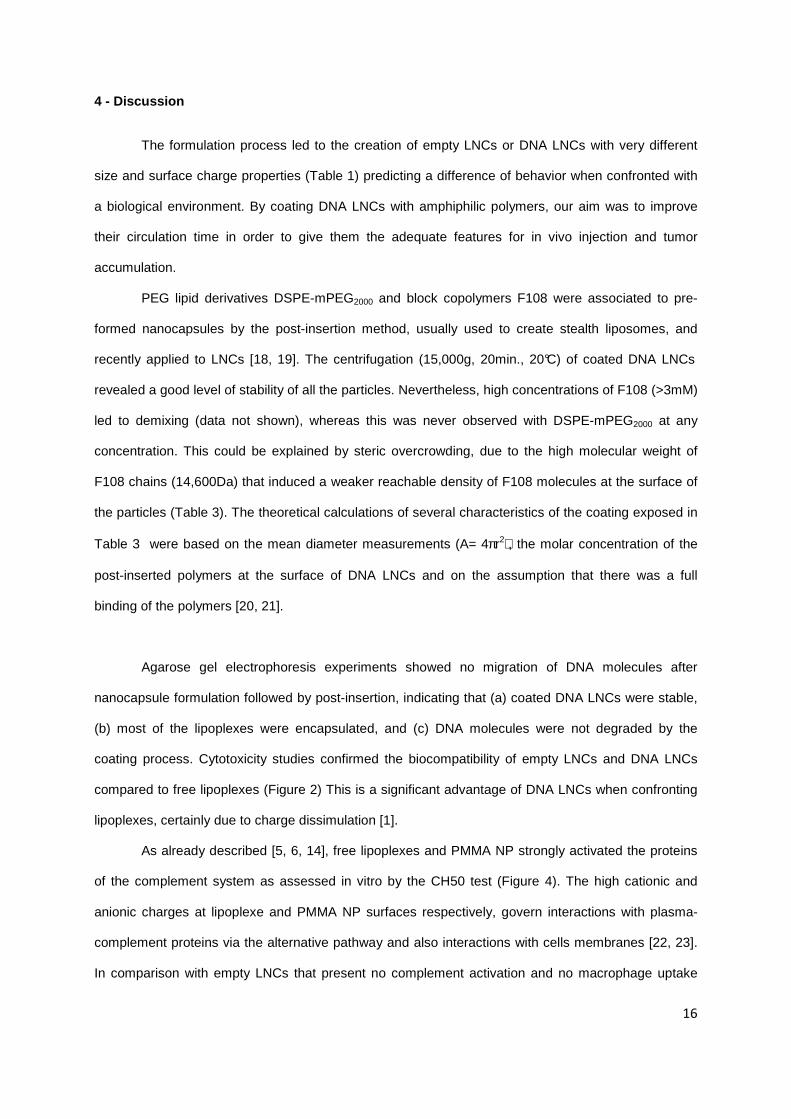
3.6 - Tumor accumulation of coated DNA LNCs
To estimate time dependant excretion profile and tumor accumulation of the polymer coated
LNCs exposing the greatest residence time in blood stream (10mM DSPE-mPEG2000), these
suspensions were intravenously injected in the tail vein of tumor bearing mice and compared to non
coated DNA LNCs. Tissue distribution was evaluated thanks to NIR biofluorescence imaging (BFI)
system. First of all, the early fluorescence signals were much more intense after injection of coated
DNA LNCs than after the administration of uncoated particles. When regarding non covered DNA
LNCs, the fluorescence intensity increased in the liver area from 3h after injection up to 24h, whereas
no accumulation in this anatomical area was observed with 10mM DSPE-mPEG2000-coated DNA LNCs
at any time (Figure 6). In parallel, a fluorescence emission was observed 3h, 5h, 24h, and 48h after
DNA LNCs injection on the kidney area, which could therefore let think to an elimination of DNA LNCs
via urinary system. At 24h and 48h after injection, DSPE-mPEG2000-covered DNA LNCs displayed
stronger fluorescence intensity in the tumor and in its vicinity, compared to non coated DNA LNCs.
16
4 - Discussion
The formulation process led to the creation of empty LNCs or DNA LNCs with very different
size and surface charge properties (Table 1) predicting a difference of behavior when confronted with
a biological environment. By coating DNA LNCs with amphiphilic polymers, our aim was to improve
their circulation time in order to give them the adequate features for in vivo injection and tumor
accumulation.
PEG lipid derivatives DSPE-mPEG2000 and block copolymers F108 were associated to pre-
formed nanocapsules by the post-insertion method, usually used to create stealth liposomes, and
recently applied to LNCs [18, 19]. The centrifugation (15,000g, 20min., 20°C) of coated DNA LNCs
revealed a good level of stability of all the particles. Nevertheless, high concentrations of F108 (>3mM)
led to demixing (data not shown), whereas this was never observed with DSPE-mPEG2000 at any
concentration. This could be explained by steric overcrowding, due to the high molecular weight of
F108 chains (14,600Da) that induced a weaker reachable density of F108 molecules at the surface of
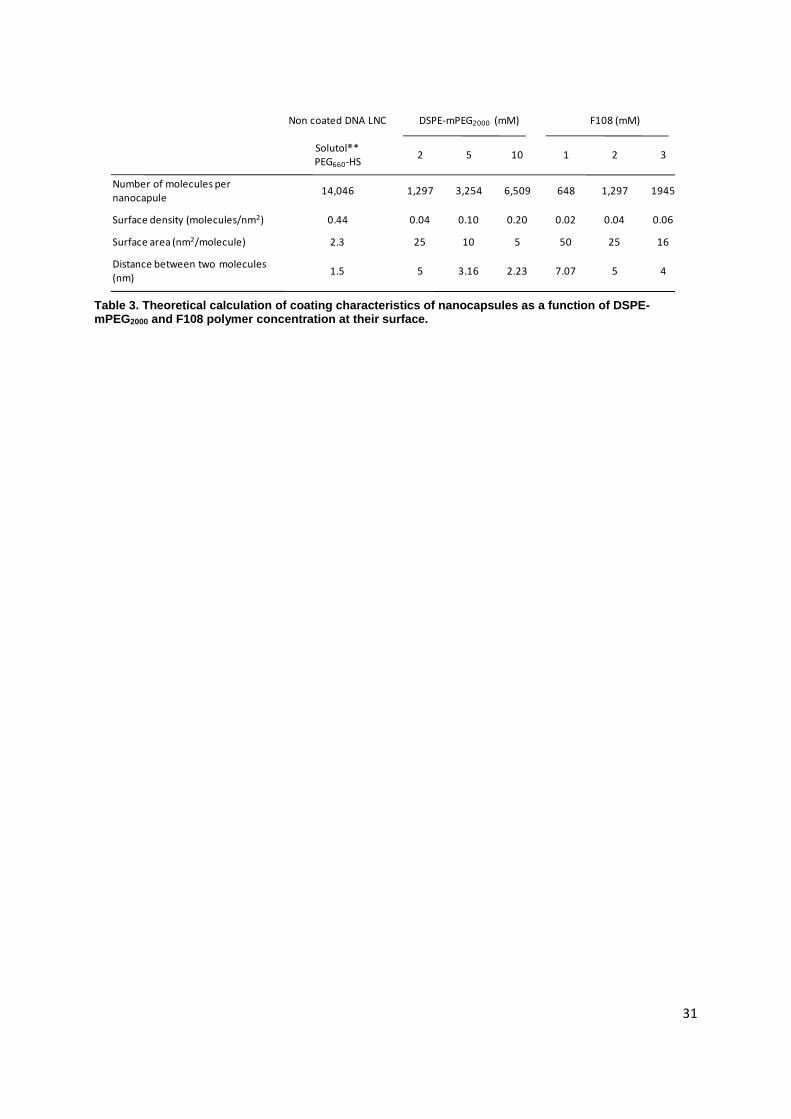
the particles (Table 3). The theoretical calculations of several characteristics of the coating exposed in
Table 3 were based on the mean diameter measurements (A= 4πr2), the molar concentration of the
post-inserted polymers at the surface of DNA LNCs and on the assumption that there was a full
binding of the polymers [20, 21].
Agarose gel electrophoresis experiments showed no migration of DNA molecules after
nanocapsule formulation followed by post-insertion, indicating that (a) coated DNA LNCs were stable,
(b) most of the lipoplexes were encapsulated, and (c) DNA molecules were not degraded by the
coating process. Cytotoxicity studies confirmed the biocompatibility of empty LNCs and DNA LNCs
compared to free lipoplexes (Figure 2) This is a significant advantage of DNA LNCs when confronting
lipoplexes, certainly due to charge dissimulation [1].
As already described [5, 6, 14], free lipoplexes and PMMA NP strongly activated the proteins
of the complement system as assessed in vitro by the CH50 test (Figure 4). The high cationic and
anionic charges at lipoplexe and PMMA NP surfaces respectively, govern interactions with plasma-
complement proteins via the alternative pathway and also interactions with cells membranes [22, 23].
In comparison with empty LNCs that present no complement activation and no macrophage uptake
17
(Figures 3 and 4), DNA LNCs showed weak complement activity, but more pronounced macrophage
uptake (Figure 4). While the coating of DNA LNCs with F108 led to the same activation as with non-
coated DNA LNCs, DSPE-mPEG2000 led to the inhibition of complement activation down to the empty
LNC level. As expected, the addition of DSPE-mPEG2000 improved macrophage escape (Figure 3).
The high charge of DNA LNCs (+30mV) was dissimulated thanks to the use of DSPE-mPEG2000
polymers, to reach a still positive (+22mV) or negative (-12mV or -41mV) surface charge. These
differences of zeta potentials are linked to the fact that DSPE-PEG chains can form negative dipoles
that are able to diminish the surface charge proportionally to their concentration [24]. This negative
charge, close to that of empty LNCs (-14mV) prevented their removal via non-specific interactions with
receptors by electrostatic attraction at the macrophage surface [25, 26], mainly observed with positive
charges. By contrast, F108-coated DNA LNCs were largely taken up; this could be linked to their
positive charge (+22mV) or to a dissociation of F108 copolymers and DNA LNCs which resulted in
their rapid uptake by the MPS. One hypothesis is also that the PPO hydrophobic moieties present on
F108 could be accessible to opsonins and consequently provide more association to cells compared
to the hydrophobic moieties of DSPE-mPEG2000 which are anchored in the nanocapsule core [18, 27].
It is now well established that a dissociation of the PEG chains from the particles is required to interact
with cell membranes [28] and, in this case, the disadvantage of F108 can become an advantage.
Indeed, DSPE-mPEG2000 coated DNA LNCs were less efficient than F108 covered ones in in vitro
HeLa cell transfection as previously described [29]. Anyway, there is, in vivo, a need of finding
equilibrium between transfection and pharmacokinetic behavior [28].
As our final aim was to obtain long-circulating vectors for systemic gene delivery, we then
investigated the plasma clearance of fluorescent LNCs in Swiss mice. It is well known that the low
circulation time of free lipoplexes explains their poor efficiency for gene delivery in vivo, with only 1%
detected in the blood 5min after injection in mice [30]. By contrast, DNA LNCs exposed 93% of the
injected dose at the same time (Figure 5).
In order to enhance their circulation time we chose to protect the DNA LNC surface with
DSPE-mPEG2000 or F108 poloxamers. The half-lives and the mean residence time for all the DSPE-
mPEG2000 and F108-coated DNA LNCs were higher than for DNA LNCs However, F108 poloxamers
did not efficiently improve circulation properties, probably because the surfactant is displaced on

18
dilution in the blood and enters into competition with opsonins. This confirm that the anchorage of PEG
chains in DNA LNCs is essential for prolonging the in vivo residence time [31]. By contrast, DSPE-
mPEG2000-coated DNA LNCs had extended half lives, and the blood circulation time increased with the
density of DSPE-mPEG2000 chains. The distance between two PEG chains from 5 to 2.33nm (Table 3)
and their density is in good agreement with other long-circulating systems such as PLA-PEG
nanocapsules [31].
The excretion profile of DNA LNCs and 10mM DSPE-mPEG2000 DNA LNCs in live tumor
bearing mice was then tested by monitoring real time NIR fluorescence intensity in the whole body, as
this last formulation was the more promising in terms of circulation time. Near-infrared (NIR)-absorbing
dyes represent an intriguing way for extracting biological information form living subjects since they
can be monitored with safe, non-invasive optical imaging/contrasting techniques. While light in the
visible range is routinely used for microscopy, imaging deeper tissues (>500 µm to cm) required the
used of near-infrared light, as hemoglobin and water, the major absorbers of visible and infrared light
have their lowest coefficient in the NIR section (650-900 nm). The advantages of imaging in the NIR
region are numerous: the significant reduction of background absorption, fluorescence and light
scattering along with high sensitivity, the availability of low-cost sources of excitation and the versatility
of different reporter probes.
Consistently with blood kinetic profiles (Figure 5 and Table 2), DNA LNCs were rapidly
localized in the liver and in the kidney suggesting a removal by the MPS. By contrast, DSPE-mPEG2000
coated DNA LNCs were able to accumulate in the tumor and its neighborhood by passive targeting
thanks to a sufficient circulation time in blood. The low hepatotoxic impact of these coated particles
was also a positive point.
This newly formed vector can advantageously be compared to other gene therapy systems
reported in the literature. Actually, as exposed in the study of Cui et al., 30 min. after tail-vein injection
in mice, only 40% of the pDNA entrapped in nanoparticles synthesized from emulsion remained in the
circulating blood [32]. Even the clinically relevant systemic RNAi-mediated gene silencing in non-
human primates developed by Zimmermann et al. [33], exposed a half-life in mice of 38 minutes.
However, the circulation time of stabilized plasmid lipid particles (SPLP) in the blood can vary from 1h
to 16h, depending on the PEG lipid anchor used. Nevertheless this study also showed that the PEG
lipid anchor has to be disassociated from the particle surface in order to transform the complex from a
19
stable particle to a transfection-competent entity [34-36], which occurs with one of the shortest lipid
anchors (C14) and a distribution t1/2 of 2h.
5 - Conclusion
The DSPE-mPEG2000 coated DNA LNCs developed here are able to circulate in the
bloodstream without being degraded or captured by the cellular defense mechanisms, and to
accumulate in the tumor area. One hurdle, the extracellular one, is therefore crossed, but numerous
barriers still exists at the cellular level, and efforts have to be made to still improve this vector.
Nevertheless, this DNA delivery system seem to be an excellent candidate for an efficient in vivo
transfection, either by the enhanced and permeability retention effect (EPR effect) [7] or by active
targeting thanks to the grafting of specific molecules to the extremity of the longest PEG chains.
Acknowledgments
This research was supported by the Biogeneouest®, the “SynNanoVect” IBiSA platform - Brest, INRA
UMR 118, 35653 Le Rheu, France.
20
References
1. Morille M, Passirani C, Vonarbourg A, Clavreul A, Benoit JP. Progress in developing cationic
vectors for non-viral systemic gene therapy against cancer. Biomaterials 2008;29(24-25):3477-3496. 2. Kazatchkine MD, Carreno MP. Activation of the complement system at the interface between blood and artificial surfaces. Biomaterials 1988;9(1):30-35. 3. Vonarbourg A, Passirani C, Saulnier P, Benoit JP. Parameters influencing the stealthiness of colloidal drug delivery systems. Biomaterials 2006;27(24):4356-4373.
4. Heurtault B, Saulnier P, Pech B, Proust JE, Benoit JP. A novel phase inversion-based process for the preparation of lipid nanocarriers. Pharm Res 2002;19(6):875-880. 5. Vonarbourg A, Passirani C, Saulnier P, Simard P, Leroux JC, Benoit JP. Evaluation of pegylated lipid nanocapsules versus complement system activation and macrophage uptake. J Biomed Mater Res A 2006;78(3):620-628. 6. Vonarbourg A, Passirani C, Desigaux L, Allard E, Saulnier P, Lambert O, et al. The
encapsulation of DNA molecules within biomimetic lipid nanocapsules. Biomaterials 2009;30(18):3197-3204. 7. Maeda H, Wu J, Sawa T, Matsumura Y, Hori K. Tumor vascular permeability and the EPR effect in macromolecular therapeutics: a review. J Control Release 2000;65(1-2):271-284. 8. Nguyen HK, Lemieux P, Vinogradov SV, Gebhart CL, Guerin N, Paradis G, et al. Evaluation of
polyether-polyethyleneimine graft copolymers as gene transfer agents. Gene Ther 2000;7(2):126-138. 9. Ochietti B, Guerin N, Vinogradov SV, St-Pierre Y, Lemieux P, Kabanov AV, et al. Altered organ accumulation of oligonucleotides using polyethyleneimine grafted with poly(ethylene oxide) or pluronic as carriers. J Drug Target 2002;10(2):113-121. 10. Pitard B, Pollard H, Agbulut O, Lambert O, Vilquin JT, Cherel Y, et al. A nonionic amphiphile agent promotes gene delivery in vivo to skeletal and cardiac muscles. Hum Gene Ther
2002;13(14):1767-1775. 11. Kabanov AV, Lemieux P, Vinogradov S, Alakhov V. Pluronic block copolymers: novel functional molecules for gene therapy. Adv Drug Deliv Rev 2002;54(2):223-233. 12. Heurtault B, Saulnier P, Pech B, Venier-Julienne MC, Proust JE, Phan-Tan-Luu R, et al. The influence of lipid nanocapsule composition on their size distribution. Eur J Pharm Sci 2003;18(1):55-
61. 13. Garcion E, Lamprecht A, Heurtault B, Paillard A, Aubert-Pouessel A, Denizot B, et al. A new generation of anticancer, drug-loaded, colloidal vectors reverses multidrug resistance in glioma and reduces tumor progression in rats. Mol Cancer Ther 2006;5(7):1710-1722. 14. Passirani C, Barratt G, Devissaguet JP, Labarre D. Interactions of nanoparticles bearing heparin or dextran covalently bound to poly(methyl methacrylate) with the complement system. Life
Sci 1998;62(8):775-785.
21
15. Tsuchiya S, Kobayashi Y, Goto Y, Okumura H, Nakae S, Konno T, et al. Induction of maturation in cultured human monocytic leukemia cells by a phorbol diester. Cancer Res 1982;42(4):1530-1536. 16. Mosmann T. Rapid colorimetric assay for cellular growth and survival: application to
proliferation and cytotoxicity assays. J Immunol Methods 1983;65(1-2):55-63. 17. Calvo P, Gouritin B, Chacun H, Desmaele D, D'Angelo J, Noel JP, et al. Long-circulating PEGylated polycyanoacrylate nanoparticles as new drug carrier for brain delivery. Pharm Res 2001;18(8):1157-1166. 18. Hoarau D, Delmas P, David S, Roux E, Leroux JC. Novel long-circulating lipid nanocapsules. Pharm Res 2004;21(10):1783-1789.
19. Beduneau A, Saulnier P, Hindre F, Clavreul A, Leroux JC, Benoit JP. Design of targeted lipid nanocapsules by conjugation of whole antibodies and antibody Fab' fragments. Biomaterials 2007;28(33):4978-4990. 20. Vittaz M, Bazile D, Spenlehauer G, Verrecchia T, Veillard M, Puisieux F, et al. Effect of PEO surface density on long-circulating PLA-PEO nanoparticles which are very low complement activators.
Biomaterials 1996;17(16):1575-1581. 21. Lacoeuille F, Hindre F, Moal F, Roux J, Passirani C, Couturier O, et al. In vivo evaluation of lipid nanocapsules as a promising colloidal carrier for paclitaxel. Int J Pharm 2007;344(1-2):143-149. 22. Plank C, Mechtler K, Szoka FC, Jr., Wagner E. Activation of the complement system by synthetic DNA complexes: a potential barrier for intravenous gene delivery. Hum Gene Ther 1996;7(12):1437-1446.
23. Devine DV, Wong K, Serrano K, Chonn A, Cullis PR. Liposome-complement interactions in rat serum: implications for liposome survival studies. Biochim Biophys Acta 1994;1191(1):43-51. 24. Vonarbourg A, Saulnier P, Passirani C, Benoit JP. Electrokinetic properties of noncharged lipid nanocapsules: influence of the dipolar distribution at the interface. Electrophoresis 2005;26(11):2066-2075.
25. Hsu MJ, Juliano RL. Interactions of liposomes with the reticuloendothelial system. II: Nonspecific and receptor-mediated uptake of liposomes by mouse peritoneal macrophages. Biochim Biophys Acta 1982;720(4):411-419. 26. Gref R, Minamitake Y, Peracchia MT, Trubetskoy V, Torchilin V, Langer R. Biodegradable long-circulating polymeric nanospheres. Science 1994;263(5153):1600-1603. 27. Uster PS, Allen TM, Daniel BE, Mendez CJ, Newman MS, Zhu GZ. Insertion of poly(ethylene
glycol) derivatized phospholipid into pre-formed liposomes results in prolonged in vivo circulation time. FEBS Lett 1996;386(2-3):243-246. 28. Ambegia E, Ansell S, Cullis P, Heyes J, Palmer L, MacLachlan I. Stabilized plasmid-lipid particles containing PEG-diacylglycerols exhibit extended circulation lifetimes and tumor selective gene expression. Biochim Biophys Acta 2005;1669(2):155-163.
29. Morille M, Passirani C, Letrou-Bonneval E, Benoit JP, Pitard B. Galactosylated DNA lipid nanocapsules for efficient hepatocyte targeting. Int J Pharm 2009.
22
30. Zelphati O, Uyechi LS, Barron LG, Szoka FC, Jr. Effect of serum components on the physico-chemical properties of cationic lipid/oligonucleotide complexes and on their interactions with cells. Biochim Biophys Acta 1998;1390(2):119-133. 31. Mosqueira VC, Legrand P, Gulik A, Bourdon O, Gref R, Labarre D, et al. Relationship between
complement activation, cellular uptake and surface physicochemical aspects of novel PEG-modified nanocapsules. Biomaterials 2001;22(22):2967-2979. 32. Cui Z, Mumper RJ. Plasmid DNA-entrapped nanoparticles engineered from microemulsion precursors: in vitro and in vivo evaluation. Bioconjug Chem 2002;13(6):1319-1327. 33. Zimmermann TS, Lee AC, Akinc A, Bramlage B, Bumcrot D, Fedoruk MN, et al. RNAi-mediated gene silencing in non-human primates. Nature 2006;441(7089):111-114.
34. Zhang YP, Sekirov L, Saravolac EG, Wheeler JJ, Tardi P, Clow K, et al. Stabilized plasmid-lipid particles for regional gene therapy: formulation and transfection properties. Gene Ther 1999;6(8):1438-1447. 35. Wheeler JJ, Palmer L, Ossanlou M, MacLachlan I, Graham RW, Zhang YP, et al. Stabilized plasmid-lipid particles: construction and characterization. Gene Ther 1999;6(2):271-281.
36. Mok KW, Lam AM, Cullis PR. Stabilized plasmid-lipid particles: factors influencing plasmid entrapment and transfection properties. Biochim Biophys Acta 1999;1419(2):137-150.
23
FIGURES
+T
DNA LNC
1 32
+T +T+T
2
DNA LNC+ DSPE-mPEG2000 (mM)
105
4 65 7 98
+T +T+T
1
DNA LNC + F108 (mM)
32
10 1211 13 1514
DNA LNC DNA LNC+ DSPE-mPEG2000
DNA LNC+ F108
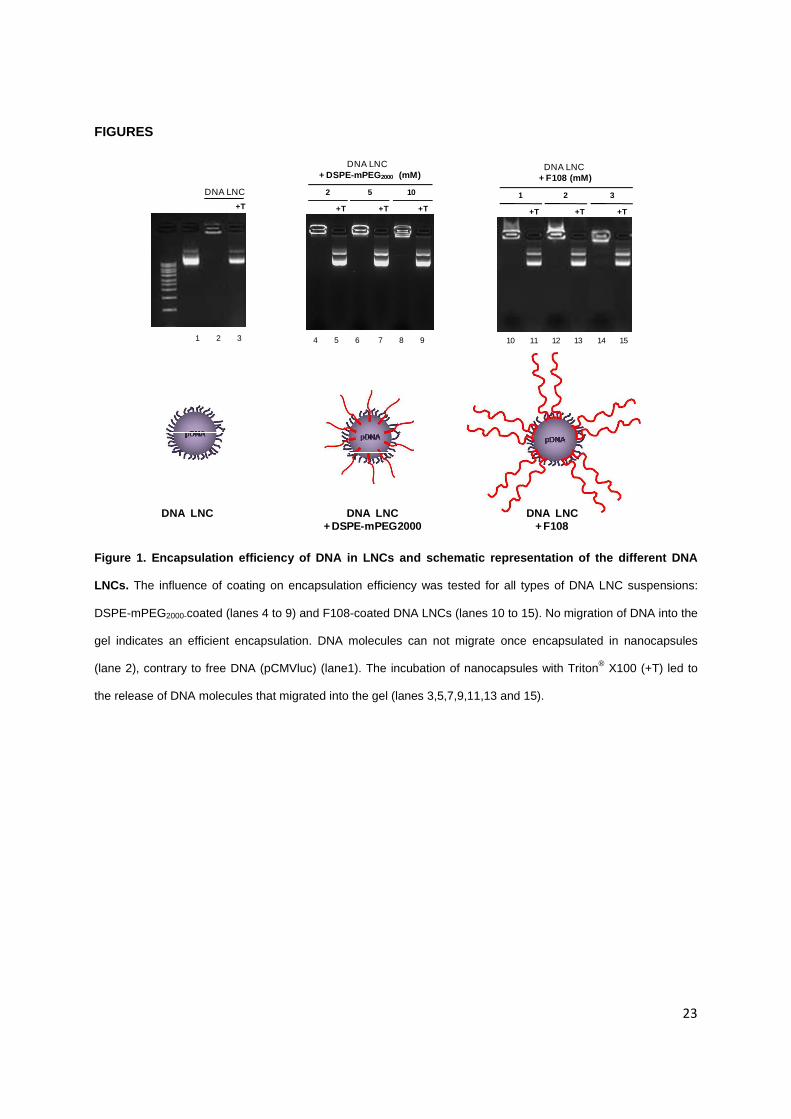
Figure 1. Encapsulation efficiency of DNA in LNCs and schematic representation of the different DNA
LNCs. The influence of coating on encapsulation efficiency was tested for all types of DNA LNC suspensions:
DSPE-mPEG2000-coated (lanes 4 to 9) and F108-coated DNA LNCs (lanes 10 to 15). No migration of DNA into the
gel indicates an efficient encapsulation. DNA molecules can not migrate once encapsulated in nanocapsules
(lane 2), contrary to free DNA (pCMVluc) (lane1). The incubation of nanocapsules with Triton® X100 (+T) led to
the release of DNA molecules that migrated into the gel (lanes 3,5,7,9,11,13 and 15).
24
0
20
40
60
80
100
120
140
160C
ell
surv
ival
(%
)**4.46µg/well
44.6µg/well
0.446µg/well
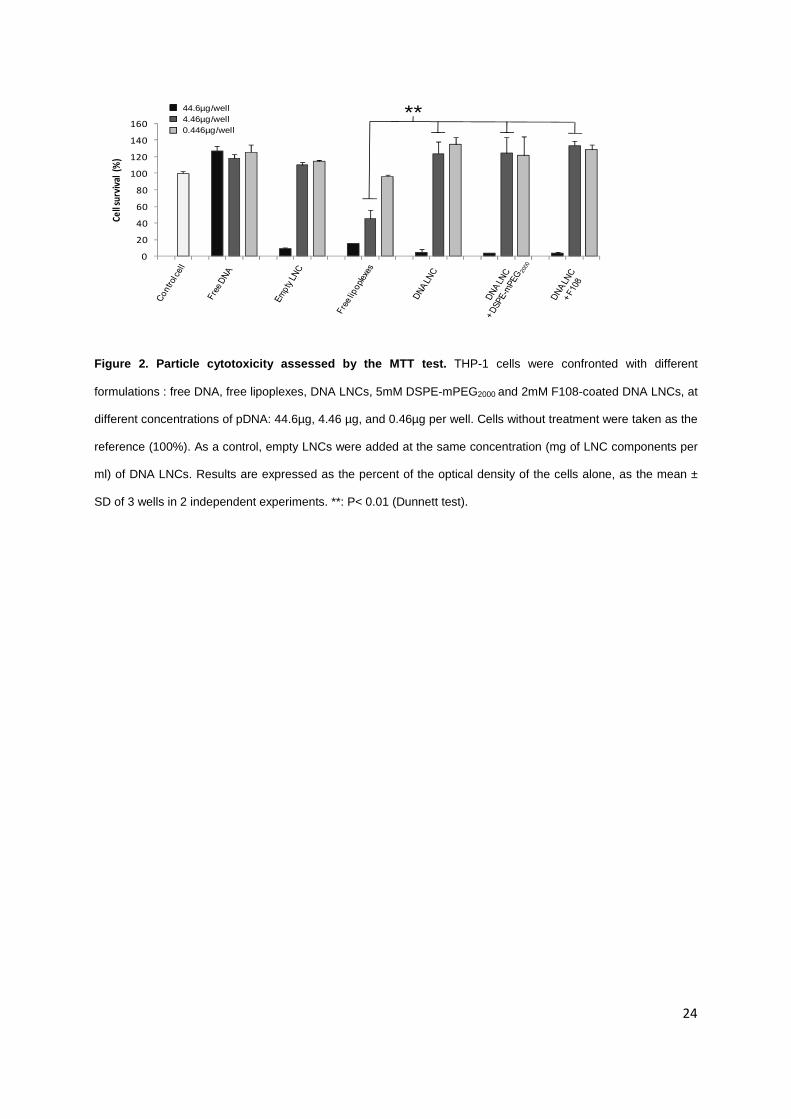
Figure 2. Particle cytotoxicity assessed by the MTT test. THP-1 cells were confronted with different
formulations : free DNA, free lipoplexes, DNA LNCs, 5mM DSPE-mPEG2000 and 2mM F108-coated DNA LNCs, at
different concentrations of pDNA: 44.6µg, 4.46 µg, and 0.46µg per well. Cells without treatment were taken as the
reference (100%). As a control, empty LNCs were added at the same concentration (mg of LNC components per
ml) of DNA LNCs. Results are expressed as the percent of the optical density of the cells alone, as the mean ±
SD of 3 wells in 2 independent experiments. **: P< 0.01 (Dunnett test).
25
B.
100 200 400 800 1600 3200 6400 128001
10
100
1000
10000
DNA LNC+LNC F108DNA LNC
DNA LNC+DSPE-PEG-CH3Blank LNC
Dilution 1:X
Nu
mb
er o
f LN
C-c
on
tain
ing
ves
icle
s DNA LNC
DNA LNC + DSPE-mPEG2000 5mMDNA LNC + F108 2mM
Empty LNC
A. DNA LNC
+ DSPE-mPEG 2000 5mM
Control Empty LNC
DNA LNC
i
iiiii
iv
v
DNA LNC
+ F108 2mM
ii
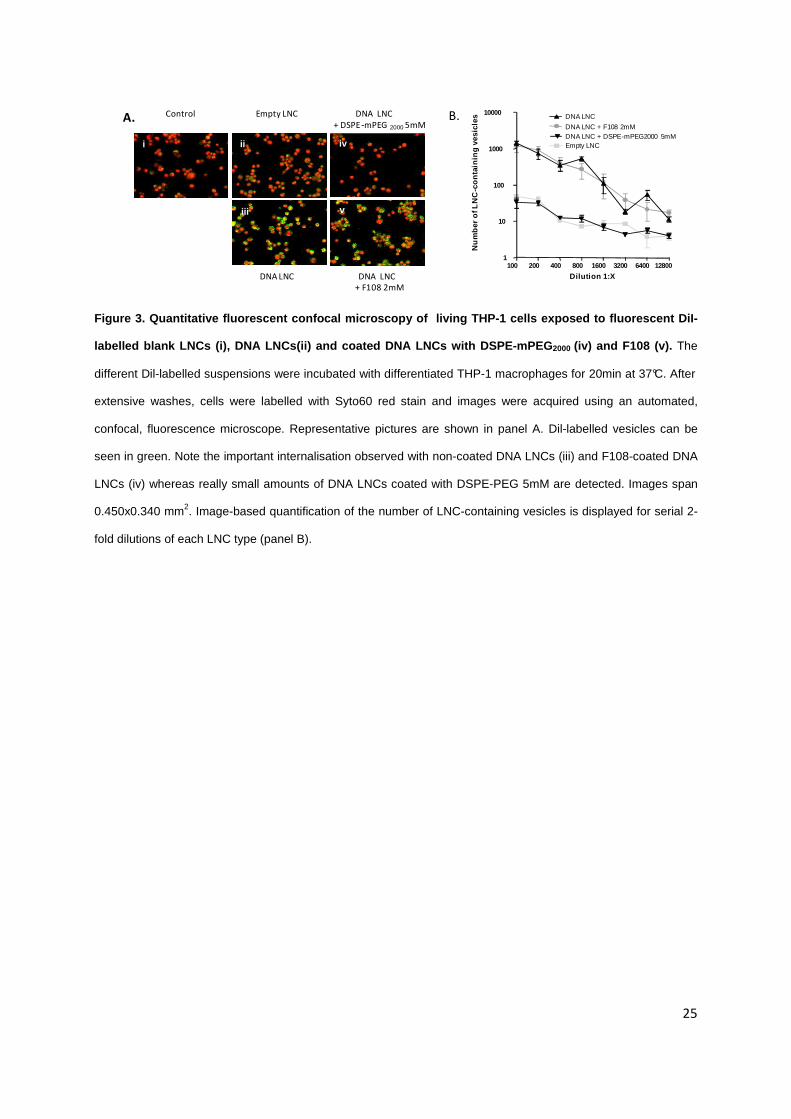
Figure 3. Quantitative fluorescent confocal microscopy of living THP-1 cells exposed to fluorescent DiI-
labelled blank LNCs (i), DNA LNCs(ii) and coated DNA LNCs with DSPE-mPEG2000 (iv) and F108 (v). The
different Dil-labelled suspensions were incubated with differentiated THP-1 macrophages for 20min at 37°C. After
extensive washes, cells were labelled with Syto60 red stain and images were acquired using an automated,
confocal, fluorescence microscope. Representative pictures are shown in panel A. Dil-labelled vesicles can be
seen in green. Note the important internalisation observed with non-coated DNA LNCs (iii) and F108-coated DNA
LNCs (iv) whereas really small amounts of DNA LNCs coated with DSPE-PEG 5mM are detected. Images span
0.450x0.340 mm2. Image-based quantification of the number of LNC-containing vesicles is displayed for serial 2-
fold dilutions of each LNC type (panel B).
26
A. B.
0
25
50
75
100
0 200 400 600 800 1000
CH
50
un
its
con
sum
pti
on
(%
)
Nanoparticle surface area (cm2/ml NHS)
Free lipoplexes
PMMA NP
Blank LNC
DNA LNC
DNA LNC + DSPE-PEG-CH3 2mM
DNA LNC + DSPE-PEG-CH3 5mM
DNA LNC + DSPE-PEG-CH3 10mM
Empty LNC
0
25
50
75
100
0 200 400 600 800 1000
CH
50
un
its
cun
sum
pti
on
(%)
Nanoparticle surface area (cm2/ml NHS)
Free lipoplexes
PMMA NP
Blank LNC
DNA LNC
DNA LNC + F108 1mM
DNA LNC + F108 2mM
DNA LNC + F108 3mM
Empty LNC
DNA LNC + DSPE-mPEG2000 2mM
DNA LNC + DSPE-mPEG2000 5mM
DNA LNC + DSPE-mPEG2000 10mM
Figure 4. Influence of DSPE-mPEG2000 (A) and F108 (B) on complement consumption by DNA LNCs. The
CH50 consumption was represented as a function of the nanoparticle surface area (cm2) representing an increase
in nanocapsule concentration. Suspensions of nanoparticles were incubated for 60min at 37°C in human se rum
diluted ¼ (v/v) in VBS2+. Complement consumption was evaluated as the lytic capacity of the serum (amount of
CH50 units) towards antibody-sensitised sheep erythrocytes after exposure to blank LNCs, DNA LNCs and DNA
LNCs coated with different concentrations of DSPE-mPEG2000 (A) and F108 (B). Each datum point represents the
group mean ± s.d. of the CH50 unit consumption.
27
0
20
40
60
80
100
120
0 5 10 15 20 25
Inje
cte
d d
ose
(%)
Time (h)
Blank LNC
DNA LNC
DNA LNC + DSPE-PEG 2mM
DNA LNC + DSPE-PEG 5mM
DNA LNC + DSPE-PEG 10mM
A.Empty LNC
0
20
40
60
80
100
120
0 5 10 15 20 25
Inje
cte
d d
ose
(%
)
Time (h)
Blank LNC
DNA LNC
DNA LNC + F108 1mM
DNA LNC + F108 2mM
DNA LNC + F108 3mM
B.Empty LNC
DNA LNC + DSPE-mPEG2000 2mM
DNA LNC + DSPE-mPEG2000 5mM
DNA LNC + DSPE-mPEG2000 10mM
Figure 5. Kinetic blood profiles of LNCs coated with various concentrations of DSPE-mPEG2000 (A) or F108
(B) following systemic injection in Swiss mice. The percentage of injected dose (3.35mg of DNA/kg of animal
weight) remaining in plasma following a single bolus injection is displayed as a function of time. Administration of
empty LNCs and DNA LNCs are shown as a control. Each datum point represents the group mean ± s.d. of the
percent injected dose.

28
3h
24h 48h
5h
+ DSPE-mPEG2000LNC ADN + DSPE-mPEG2000LNC ADN
+ DSPE-mPEG2000LNC ADN + DSPE-mPEG2000LNC ADN
Figure. 6 In vivo fluorescence imaging of athymic nude mice bearing U87MG tumors after intravenous
injection of DNA LNCs or DSPE-mPEG2000 coated DNA LNCs. Optical images of nude mice with 152mg/ml tail
vein injection of DNA LNCs or DSPE -mPEG2000 coated DNA LNCs (representing 46µg of pDNA per mice).
Coloured bar on the left or upper part of the picture indicates the signal efficient of the fluorescence emission
coming out from the animal. The tumor location is specified with a white arrow.
29
TABLES
LNC formulation Mean size (nm) Pdl Zeta potential (mV)
Empty LNC 48 ± 4 0.020 -14 ± 1
DNA LNC 117 ± 10 0.255 +30 ± 2
DNA LNC + DSPE-PEG 2000 2mM 131 ± 10 0.230 +23 ± 8
DNA LNC + DSPE-PEG 2000 5mM 139 ± 19 0.374 -12 ± 3
DNA LNC + DSPE-PEG 2000 10mM 142 ± 20 0.250 -41 ± 11
DNA LNC + F108 1mM 129 ± 2 0.209 +14 ± 2
DNA LNC + F108 2mM 129 ± 4 0.256 +17 ± 3
DNA LNC + F108 3mM 132 ± 3 0.248 +22 ± 1
Table 1. Influence of the incorporation of DSPE-mPEG2000 and F108 at the surface of DNA LNCs on size,
polydispersity and zeta potential. Results show the mean ± SD of at least 4 independent formulation
measurements and 3 measurements per sample.
30
Table 2. The main pharmacokinetic characteristics of various formulations of LNCs after a single i.v.
injection in Swiss mice. Plasma clearance of LNCs was measured over a 24h period in animals treated with
3.345mg of DNA/kg of mouse weight. The half lives were calculated as follows: t1/2=Log(2)/Lz. The Lz was
determined from linear regression using defined intervals (respectively 5h and 24h, for t1/2 distribution [0-5h], and
t1/2 elimination [0-24h]). The AUC was calculated following the trapezoidal rule during the whole experimental
period (1min to 24h) without extrapolation. The mean residence time was calculated from 1min to 5h, from the
following equation: MRT [0-5h] = AUMC [0-5h] / AUC [0-5h]. Each datum point represents the group mean ± s.d.
31
Non coated DNA LNC DSPE-mPEG2000 (mM) F108 (mM)
Solutol®*
PEG660-HS2 5 10 1 2 3
Number of molecules per
nanocapule14,046 1,297 3,254 6,509 648 1,297 1945
Surface density (molecules/nm2) 0.44 0.04 0.10 0.20 0.02 0.04 0.06
Surface area (nm2/molecule) 2.3 25 10 5 50 25 16
Distance between two molecules
(nm)1.5 5 3.16 2.23 7.07 5 4
Table 3. Theoretical calculation of coating characteristics of nanocapsules as a function of DSPE-mPEG2000 and F108 polymer concentration at their surface.
32
Figure Captions Figure 1. Encapsulation efficiency of DNA in LNCs and schematic representation of the different DNA
LNCs. The influence of coating on encapsulation efficiency was tested for all types of DNA LNC suspensions:
DSPE-mPEG2000-coated (lanes 4 to 9) and F108-coated DNA LNCs (lanes 10 to 15). No migration of DNA into the
gel indicates an efficient encapsulation. DNA molecules can not migrate once encapsulated in nanocapsules
(lane 2), contrary to free DNA (pCMVluc) (lane1). The incubation of nanocapsules with Triton® X100 (+T) led to
the release of DNA molecules that migrated into the gel (lanes 3,5,7,9,11,13 and 15).
Figure 2. Particle cytotoxicity assessed by the MTT test. THP-1 cells were confronted with different
formulations : free DNA, free lipoplexes, DNA LNCs, 5mM DSPE-mPEG2000 and 2mM F108-coated DNA LNCs, at
different concentrations of pDNA: 44.6µg, 4.46 µg, and 0.46µg per well. Cells without treatment were taken as the
reference (100%). As a control, empty LNCs were added at the same concentration (mg of LNC components per
ml) of DNA LNCs. Results are expressed as the percent of the optical density of the cells alone, as the mean ±
SD of 3 wells in 2 independent experiments. **: P< 0.01 (Dunnett test).
Figure 3. Quantitative fluorescent confocal microscopy of living THP-1 cells exposed to fluorescent DiI-
labelled blank LNCs (i), DNA LNCs(ii) and coated DNA LNCs with DSPE-mPEG2000 (iv) and F108 (v). The
different Dil-labelled suspensions were incubated with differentiated THP-1 macrophages for 20min at 37°C. After
extensive washes, cells were labelled with Syto60 red stain and images were acquired using an automated,
confocal, fluorescence microscope. Representative pictures are shown in panel A. Dil-labelled vesicles can be
seen in green. Note the important internalisation observed with non-coated DNA LNCs (iii) and F108-coated DNA
LNCs (iv) whereas really small amounts of DNA LNCs coated with DSPE-PEG 5mM are detected. Images span
0.450x0.340 mm2. Image-based quantification of the number of LNC-containing vesicles is displayed for serial 2-
fold dilutions of each LNC type (panel B).
Figure 4. Influence of DSPE-mPEG2000 (A) and F108 (B) on complement consumption by DNA LNCs. The
CH50 consumption was represented as a function of the nanoparticle surface area (cm2) representing an increase
in nanocapsule concentration. Suspensions of nanoparticles were incubated for 60min at 37°C in human se rum
diluted ¼ (v/v) in VBS2+. Complement consumption was evaluated as the lytic capacity of the serum (amount of
CH50 units) towards antibody-sensitised sheep erythrocytes after exposure to blank LNCs, DNA LNCs and DNA
LNCs coated with different concentrations of DSPE-mPEG2000 (A) and F108 (B). Each datum point represents the
group mean ± s.d. of the CH50 units consumption.
Figure 5. Kinetic blood profiles of LNCs coated with various concentrations of DSPE-mPEG2000 (A) or F108
(B) following systemic injection in Swiss mice. The percentage of injected dose (3.35mg of DNA/kg of animal
33
weight) remaining in plasma following a single bolus injection is displayed as a function of time. Administration of
empty LNCs and DNA LNCs are shown as a control. Each datum point represents the group mean ± s.d. of the
percent injected dose.
Figure. 6 In vivo fluorescence imaging of athymic nude mice bearing U87MG tumors after intraveinous
injection of DNA LNCs or DSPE-mPEG2000 coated DNA LNCs. Optical images of nude mice with 152mg/ml tail
vein injection of DNA LNCs or DSPE -mPEG2000 coated DNA LNCs (representing 46µg of pDNA per mice).
Coloured bar on the left or upper part of the picture indicates the signal efficient of the fluorescence emission
coming out from the animal. The tumor location is specified with a white arrow.
34
Table captions Table 1. Influence of the incorporation of DSPE-mPEG2000 and F108 at the surface of DNA LNCs on size,
polydispersity and zeta potential. Results show the mean ± SD of at least 4 independent formulation
measurements and 3 measurements per sample.
Table 2. The main pharmacokinetic characteristics of various formulations of LNCs after a single i.v
injection in Swiss mice. Plasma clearance of the LNCs was measured over a 24h period in animals treated with
3.345mg of DNA/kg of mouse weight. The half lives were calculated as follows: t1/2=Log(2)/Lz. The Lz was
determined from linear regression using defined intervals (respectively 5h and 24h, for t1/2 distribution [0-5h], and
t1/2 elimination [0-24h]). The AUC was calculated following the trapezoidal rule during the whole experimental
period (1min to 24h) without extrapolation. The mean residence time was calculated from 1min to 5h, from the
following equation: MRT [0-5h] = AUMC [0-5h] / AUC [0-5h]. Each datum point represents the group mean ± s.d.
Table 3. Theoretical calculation of coating characteristics of nanocapsules as a function of DSPE-
mPEG2000 and F108 polymer concentration at their surface.