Embed Size (px)
Citation preview

LOGOwww.themegallery.com
Gek Sintha M.J. Wika, S.E., M.Sc
The Theory of Individual BehaviorThe Theory of Individual Behavior

LOGOwww.themegallery.com
Overview

LOGO
Parents and Son
www.themegallery.com

LOGOwww.themegallery.com
Characterize Consumer Behavior
Consumer Opportunities
Consumer Preferences
Consumer Consumer BehaviorBehavior

LOGO
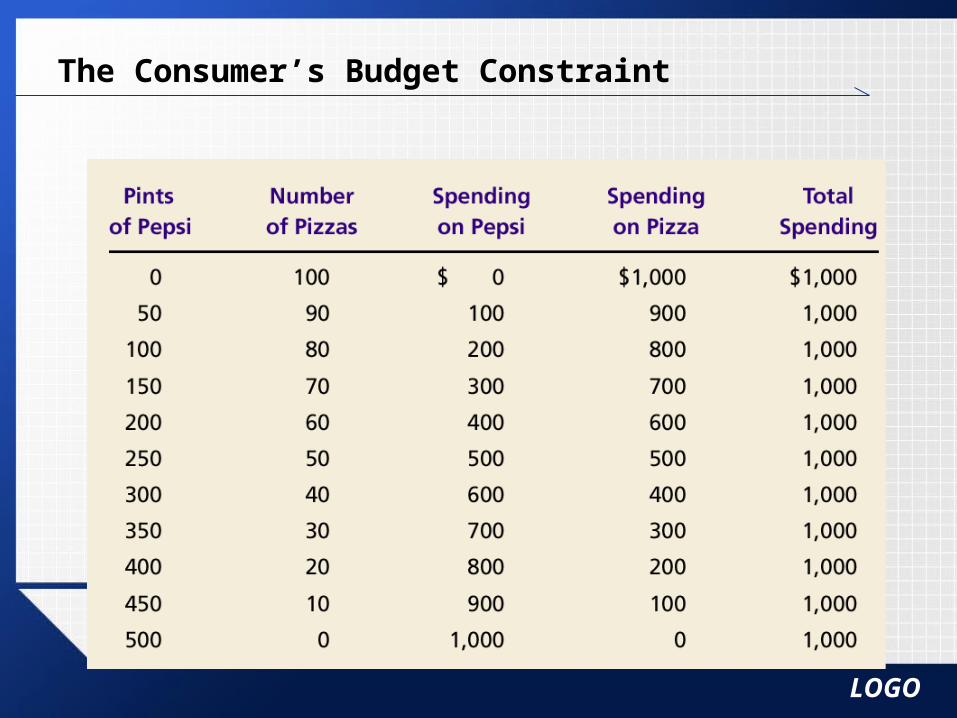
THE BUDGET CONSTRAINT: WHAT THE CONSUMER CAN AFFORD
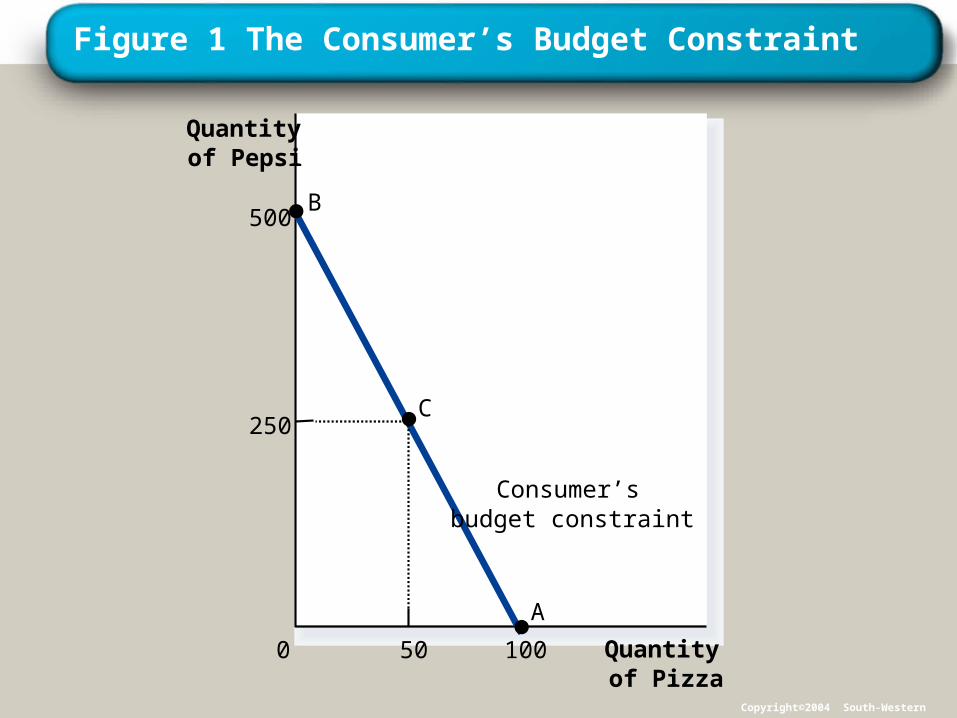
The budget constraint shows the various combinations of goods the consumer can afford given his or her income and the prices of the two goods.
LOGO
The Consumer’s Budget Constraint

LOGO
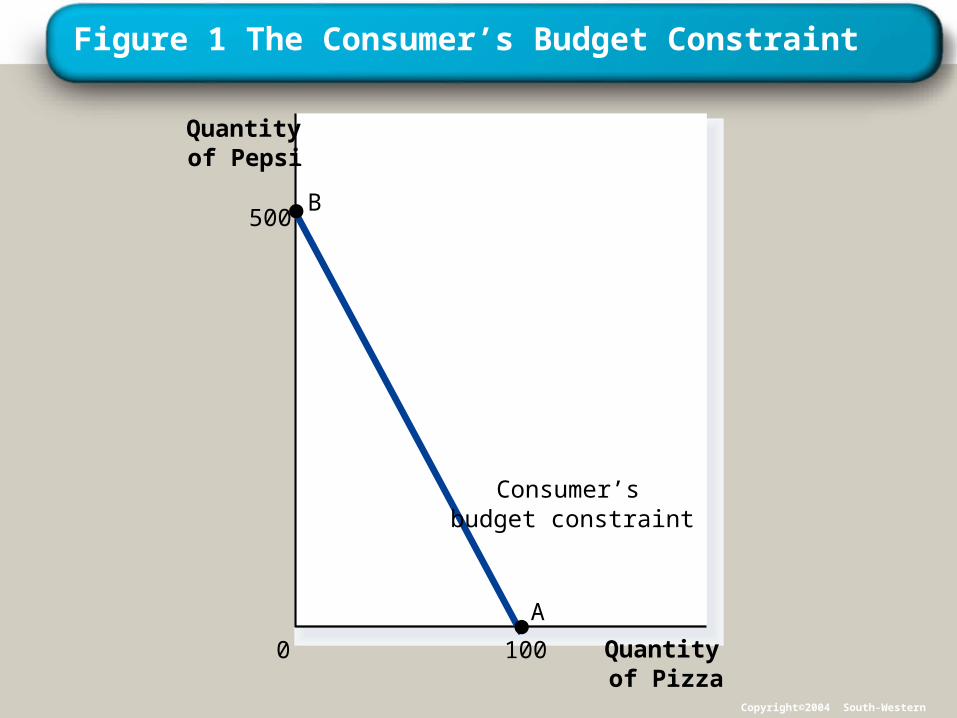
Figure 1 The Consumer’s Budget Constraint
Quantityof Pizza
Quantityof Pepsi
0
Consumer’sbudget constraint
500B
100
A
Copyright©2004 South-Western

LOGO
Figure 1 The Consumer’s Budget Constraint
Quantityof Pizza
Quantityof Pepsi
0
Consumer’sbudget constraint
500B
250
50
C
100
A
Copyright©2004 South-Western

LOGO
The Consumer’s Budget Constraint
LOGO
Figure 1 The Consumer’s Budget Constraint
Quantityof Pizza
Quantityof Pepsi
0
Consumer’sbudget constraint
500B
100
A
Copyright©2004 South-Western
LOGO
Figure 1 The Consumer’s Budget Constraint
Quantityof Pizza
Quantityof Pepsi
0
Consumer’sbudget constraint
500B
250
50
C
100
A
Copyright©2004 South-Western

LOGO
Aplikasi
www.themegallery.com
LOGO
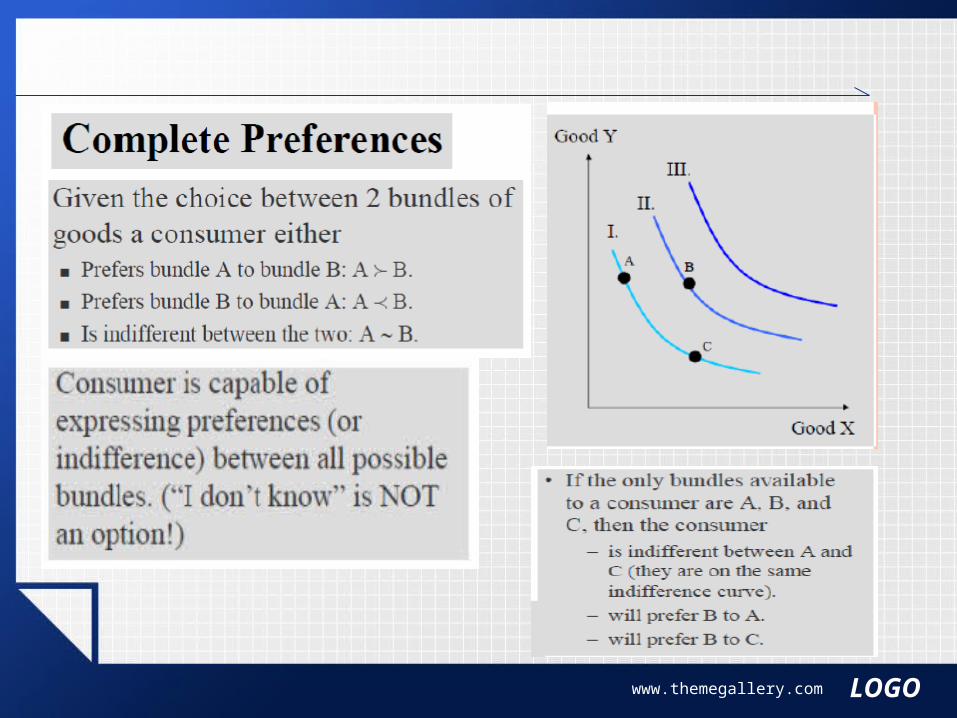
PREFERENCES: WHAT THE CONSUMER WANTS
A consumer’s preference among consumption bundles may be illustrated with indifference curves.
LOGO
Representing Preferences with Indifference Curves
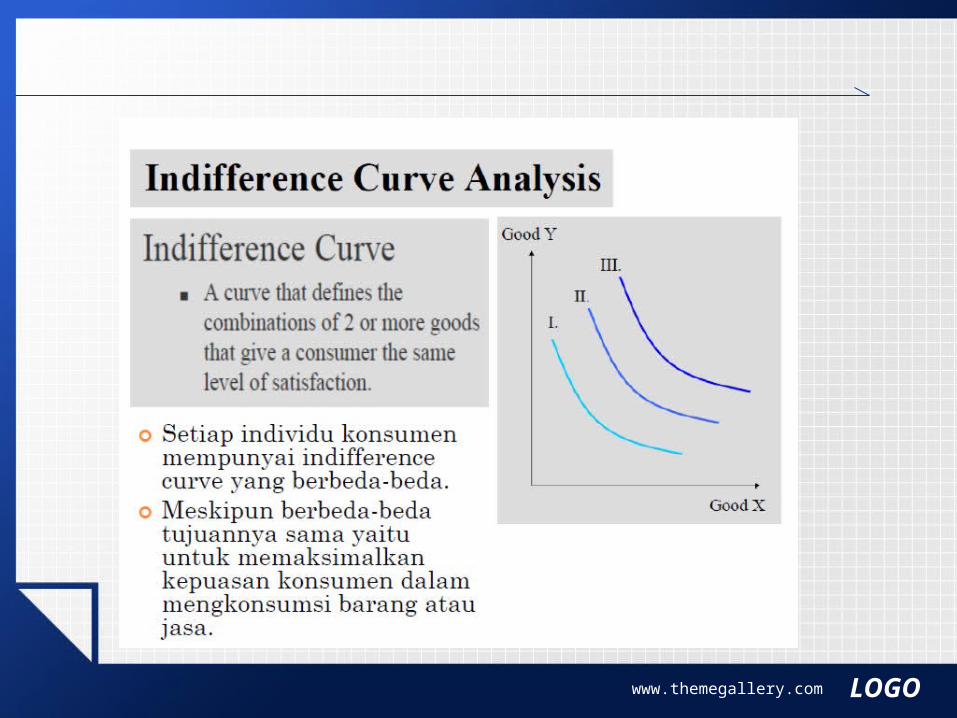
An indifference curve is a curve that shows consumption bundles that give the consumer the same level of satisfaction.

LOGO
Figure 2 The Consumer’s Preferences
Quantityof Pizza
Quantityof Pepsi
0
Indifferencecurve, I1
I2
C
B
A
D
Copyright©2004 South-Western

LOGO
Representing Preferences with Indifference Curves
The Consumer’s Preferences The consumer is indifferent, or equally happy, with the
combinations shown at points A, B, and C because they are all on the same curve.
The Marginal Rate of Substitution The slope at any point on an indifference curve is the marginal
rate of substitution.• It is the rate at which a consumer is willing to trade one good
for another.• It is the amount of one good that a consumer requires as
compensation to give up one unit of the other good.

LOGO
Figure 2 The Consumer’s Preferences
Quantityof Pizza
Quantityof Pepsi
0
Indifferencecurve, I1
I21
MRS
C
B
A
D
Copyright©2004 South-Western
LOGOwww.themegallery.com
LOGOwww.themegallery.com

LOGOwww.themegallery.com
LOGO
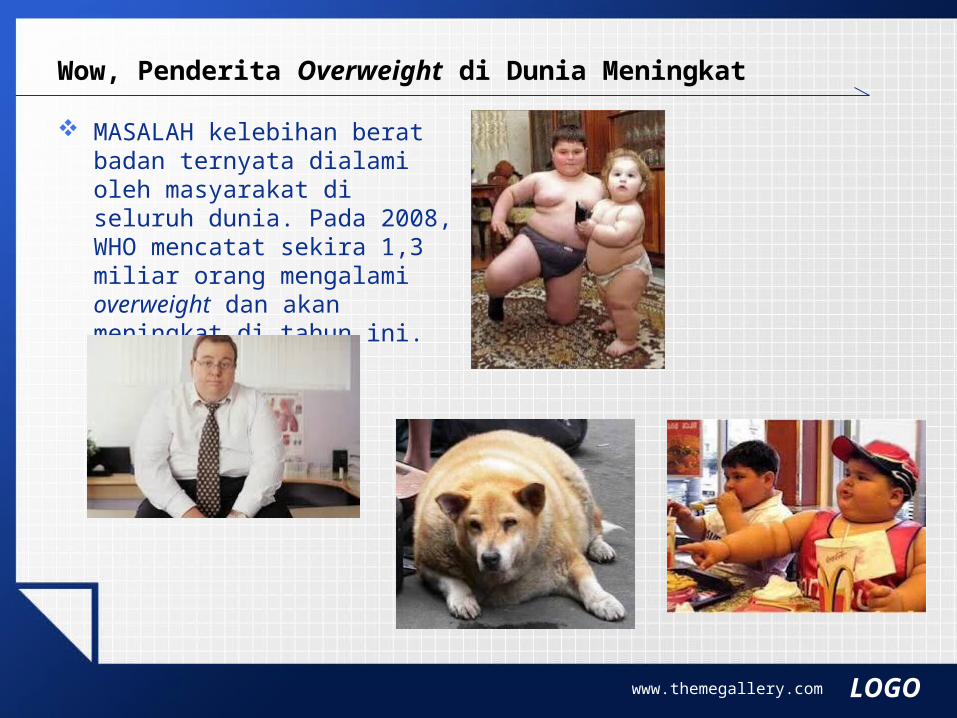
Wow, Penderita Overweight di Dunia Meningkat
MASALAH kelebihan berat badan ternyata dialami oleh masyarakat di seluruh dunia. Pada 2008, WHO mencatat sekira 1,3 miliar orang mengalami overweight dan akan meningkat di tahun ini.
www.themegallery.com

LOGO
Case Study
Lonjakan rasio kelas menengah Indonesia dari sekitar 20 persen jumlah penduduk pada tahun 2000 menjadi 56,5 persen pada 2010 (World Bank, 2013)
www.themegallery.com

LOGO
The Consumer’s Optimal ChoiceAt the consumer’s optimum, the
consumer’s valuation of the two goods equals the market’s valuation.

LOGO
Figure 6 The Consumer’s Optimum
Quantityof Pizza
Quantityof Pepsi
0
Budget constraint
I1
I2
I3
Optimum
AB
Copyright©2004 South-Western

LOGO
How Changes in Income Affect the Consumer’s ChoicesAn increase in income shifts the
budget constraint outward. The consumer is able to choose a better
combination of goods on a higher indifference curve.

LOGO
Figure 7 An Increase in Income
Quantityof Pizza
Quantityof Pepsi
0
New budget constraint
I1
I2
2. . . . raising pizza consumption . . .
3. . . . andPepsiconsumption.
Initialbudgetconstraint
1. An increase in income shifts thebudget constraint outward . . .
Initialoptimum
New optimum
Copyright©2004 South-Western

LOGOwww.themegallery.com

LOGOwww.themegallery.com

LOGO
Buy One Get One Free
www.themegallery.com