Embed Size (px)
Citation preview

US EPA LMOPUS EPA LMOPIntroduction and OverviewIntroduction and Overview
Pacific Island Energy ConferencePacific Island Energy ConferenceTom FrankiewiczTom Frankiewicz
U.S. Environmental Protection AgencyU.S. Environmental Protection AgencyLandfill Methane Outreach Program (LMOP)Landfill Methane Outreach Program (LMOP)
June 22, 2009June 22, 2009

Presentation OutlinePresentation Outline
LMOP/LFG 101LFG Project Costs & RevenuesState of LFGECase StudiesPartnering with LMOPOther Energy Partnerships and Services from EPA

EPAEPA’’s Landfill Methane s Landfill Methane Outreach ProgramOutreach Program
Established in 1994Voluntary program that creates alliances among states, energy users/providers, the landfill gas industry, and communities
Mission: To reduce methane emissions by lowering barriers and promoting the
development of cost-effective and environmentally beneficial landfill gas
energy (LFGE) projects.

Landfill Gas 101Landfill Gas 101
Landfill gas (LFG) is a by-product of the decomposition of municipal solid waste (MSW):
~50% methane (CH4)~50% carbon dioxide (CO2)<1% non-methane organic compounds (NMOCs)
If uncontrolled, LFG contributes to smog and global warming, and may cause health and safety concerns

Why EPA is Concerned Why EPA is Concerned about Landfill Gasabout Landfill Gas
Why is methane a greenhouse gas?Methane absorbs terrestrial infrared radiation (heat) that would otherwise escape to space (GHG characteristic)
Methane as GHG is over 20x more potent by weight than CO2
Methane is more abundant in the atmosphere now than anytime in the past 400,000 years and 150% higher than in the year 1750Landfills were the largest human-made source of methane in the United States in 2005, accounting for 24% generated
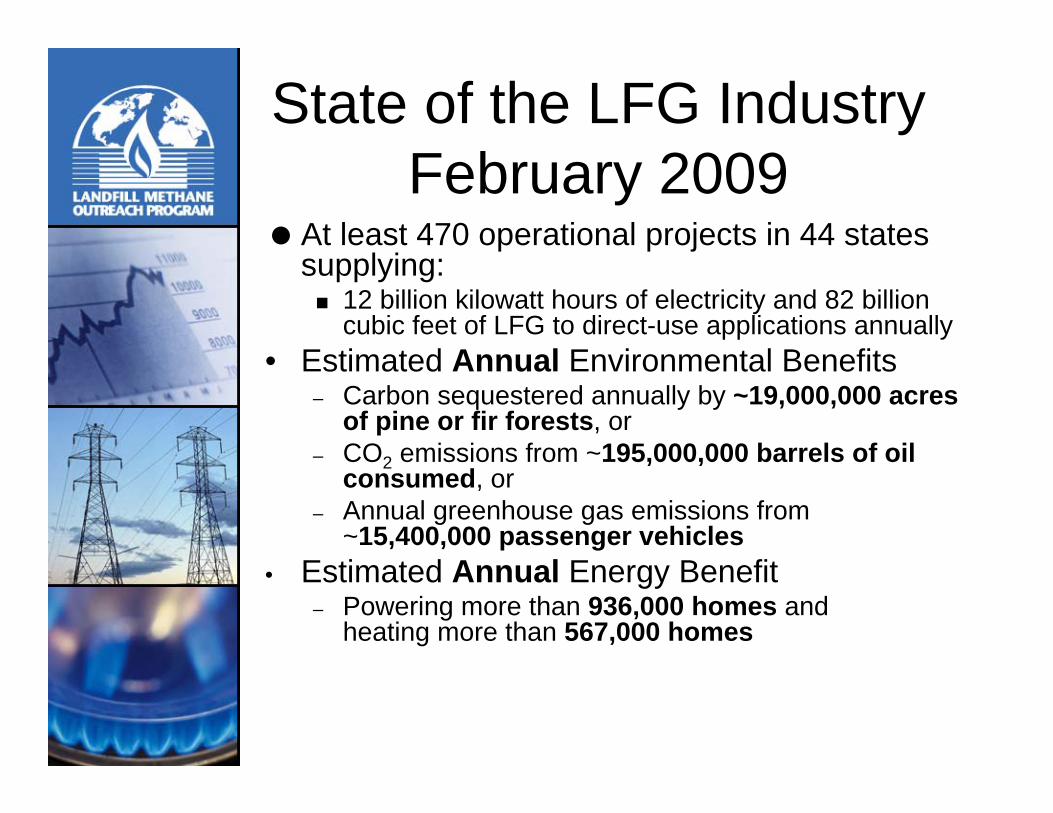
Landfill Gas and Green PowerLandfill Gas and Green PowerA Winning CombinationA Winning Combination
Dual benefit destroys methane and other organic compounds in LFGOffsets use of nonrenewable resources (coal, oil, gas) reducing emissions of
SO2, NOX, PM, CO2
LFG is a recognized renewable energy resource
Green-e, EPA Green Power Partnership, 28 states, Sierra Club, NRDC
LFG is generated 24/7 and projects have online reliability over 90%LFG can act as a long-term price and volatility hedge against fossil fuels

File Last Updated: February 2009
NOx1.94
NOx2.59
NOx2.25
SO2
0.17
SO2
5.26
SO2
7.14
Hg3.4
Hg35.9
Hg27.2
0
2
4
6
8
10
1 2 3
NOx
and
SO2 E
mis
sion
s (lb
/MW
h)
0
8
16
24
32
40
Hg
Emis
sion
s (1
0^6
lb/M
Wh)
LFG Electricity
Grid Average (Emitting)
Grid Average (All)
LFG Electricity Emission LFG Electricity Emission Reduction BenefitsReduction Benefits
Sources: LFG from AP-42 (1998); Grid averages from eGRID2007 V1.1
Weighted Average for
All LFG Electricity Generating
Technologies
National Grid Average for Emitting Sources
National Grid Average for All Sources

Jobs and Revenue Creation
• A typical 3 MW LFG electricity project is estimated to have the following benefits (direct, indirect, and induced) during the construction year:– Increase the output of the national
economy by ~$14 million ($3 million of which is a local benefit and mostly employee earnings)
– Employ nearly 70 people nationally (expressed in full-time equivalents [FTE] per year)

Jobs and Revenue Creation (cont.)
• A typical 1,040 scfm LFG direct-use project is estimated to have the following benefits (direct, indirect, and induced) during the construction year:
$12 million$6 millionIncrease output of national economy
People employed nationally (FTE)
Portion of national benefit at local level
$4 million$2 million
8043
10-mile pipeline5-mile pipeline

Typical Electric Project Components & Costs
• 3 MW engine project for 15 years:– Installed engine and gas treatment skids
• Installed capital cost = ~$5,100,000
– Interconnect• ~$250,000 (approximate – many variables at
play)
– Annual operation & maintenance• Cost = ~$570,000/year
• Total capital cost = ~$5.35 million• Total annual cost = ~$570,000
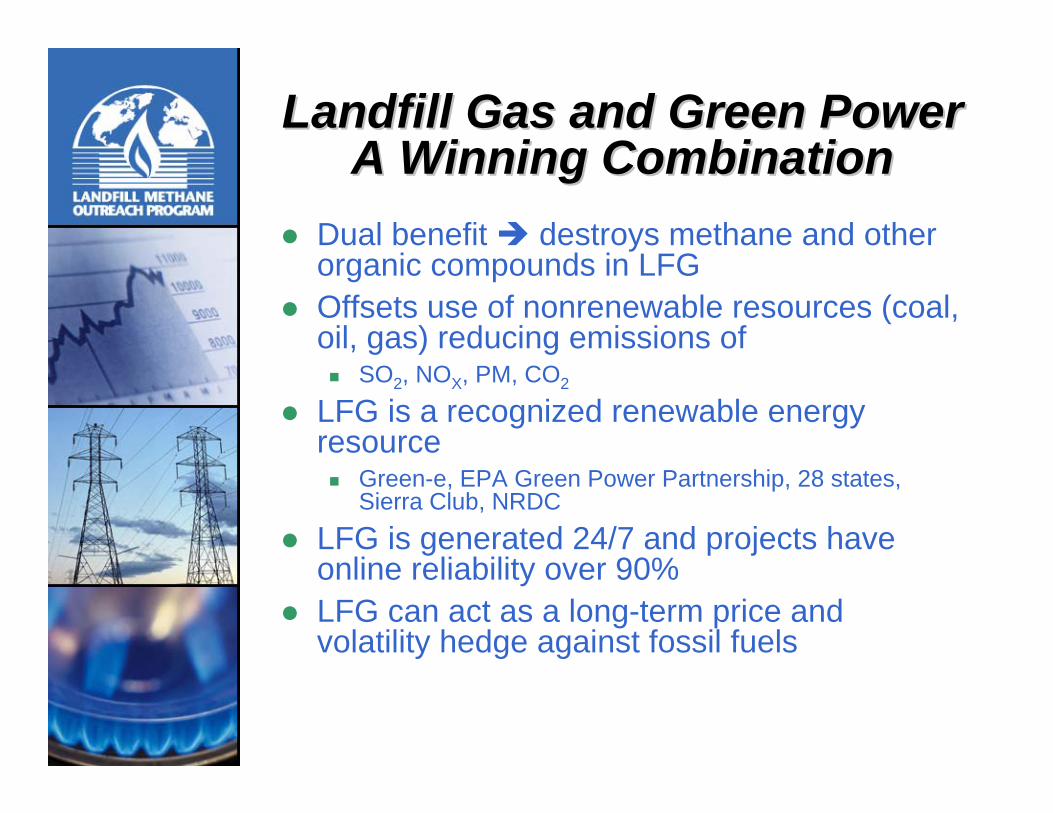
Typical Direct Use Components & Cost
• 800 scfm project for 15 years:– Gas compression & treatment
• Installed capital cost = ~$1,040,000– Pipeline
• Installed capital cost = ~$330,000/mile– Annual operation & maintenance
• Cost = ~$50,000/year– End-of-pipe combustion equipment
retrofits, if needed• Total capital cost (5-mile) = ~$2.69 million• Total O&M cost = ~$750,000

Potential LFG Revenue• Electric projects
– Sale of electricity (4 - 6 cents/kWh)– Sale of Renewable Energy Credits (RECs)– Premium pricing for renewables through
RPS/RPG or voluntary green power markets– Tax credits & incentives– Clean Renewable Energy Bonds (CREBs)
• Direct-use projects– Sale of LFG ($/MMBtu)
• Both– Greenhouse gas emissions trading– Energy cost savings– Other federal incentives (EECBG)
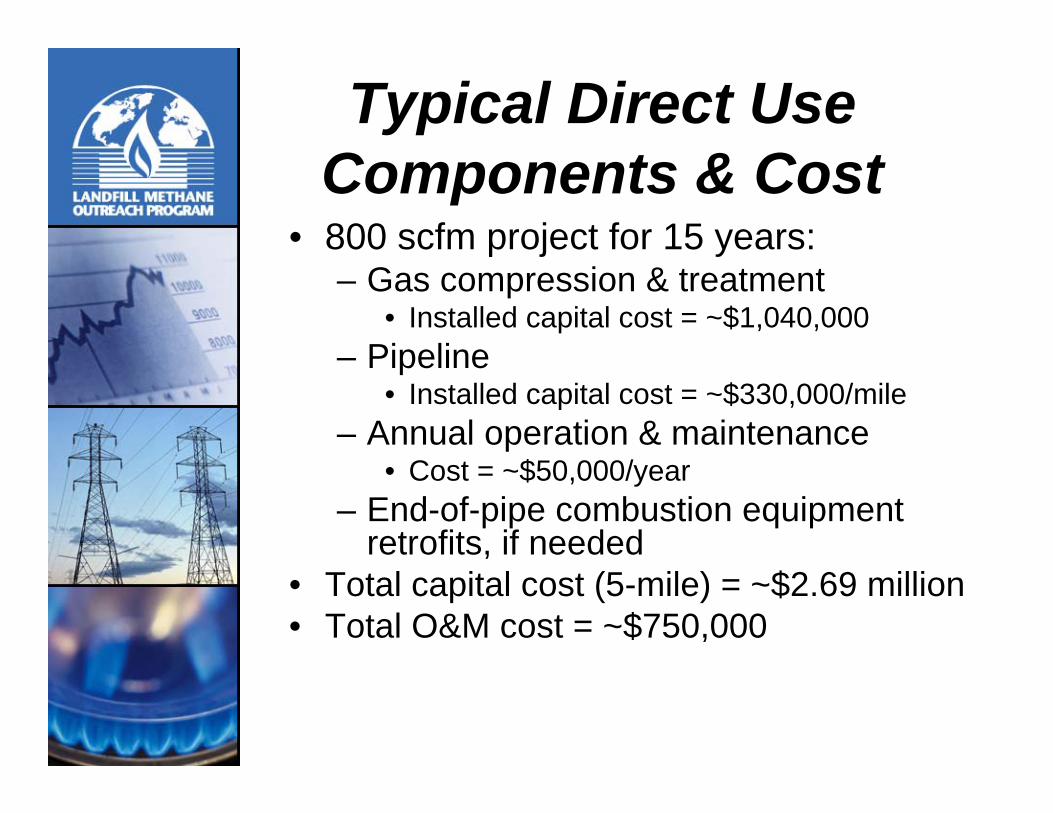
State of the LFG IndustryFebruary 2009
At least 470 operational projects in 44 states supplying:
12 billion kilowatt hours of electricity and 82 billion cubic feet of LFG to direct-use applications annually
• Estimated Annual Environmental Benefits– Carbon sequestered annually by ~19,000,000 acres
of pine or fir forests, or– CO2 emissions from ~195,000,000 barrels of oil
consumed, or– Annual greenhouse gas emissions from
~15,400,000 passenger vehicles• Estimated Annual Energy Benefit
– Powering more than 936,000 homes and heating more than 567,000 homes

Many Untapped LFG Resources
• Currently 520 candidate landfills with a total gas generation potential of 610 million standard cubic feet per day OR electric potential of 1,200 MW
• If projects were developed at all these landfills, estimated– Annual Environmental Benefit =
Planting 1.70 million acres of forest OR removing the emissions from 1.2 million vehicles on the road, and
– Annual Energy Benefit = Powering 763,000 homes per year

LFG Energy Projects LFG Energy Projects and Candidate Landfillsand Candidate Landfills

Federal Financial Federal Financial IncentivesIncentives
– Section 45 Tax Credit• Electricity generation – 1.0 cent/kWh• Placed in service by 12/31/13• 10-year payout period
– U.S. Treasury Grant Program– EECBG Program
• National allocation of $3.2 billion in FY’09

States with RPS or GoalStates with RPS or Goal
States with RPS
States with RPS Goals
Public and Private Entities Moving Public and Private Entities Moving to Reduce GHG Emissionsto Reduce GHG Emissions
Voluntary MarketsCurrently where most GHG activity occurs Examples – CCX, VCS
Compliance MarketsRapidly evolving, will become the dominant market Led by RGGI and CCAR (note Nov. deadline registering your project!)

Tracking TrendsTracking TrendsGHG trading markets continually evolve and mature….. new entries into the market- GE-AES, VCS, etc.State/regional initiatives taking the lead- RGGI did first auction September 08, went into effect January 2009; second auction plannedImpacts of Congressional legislation and potential landfill CH4 regulation – particularly cap and trade Three year tax credit extension and new CREBs allocation as part of American Recovery & Reinvestment ActNew state RPSs include LFGCorporate sector interest in LFG continues to growConsolidation in the waste sector
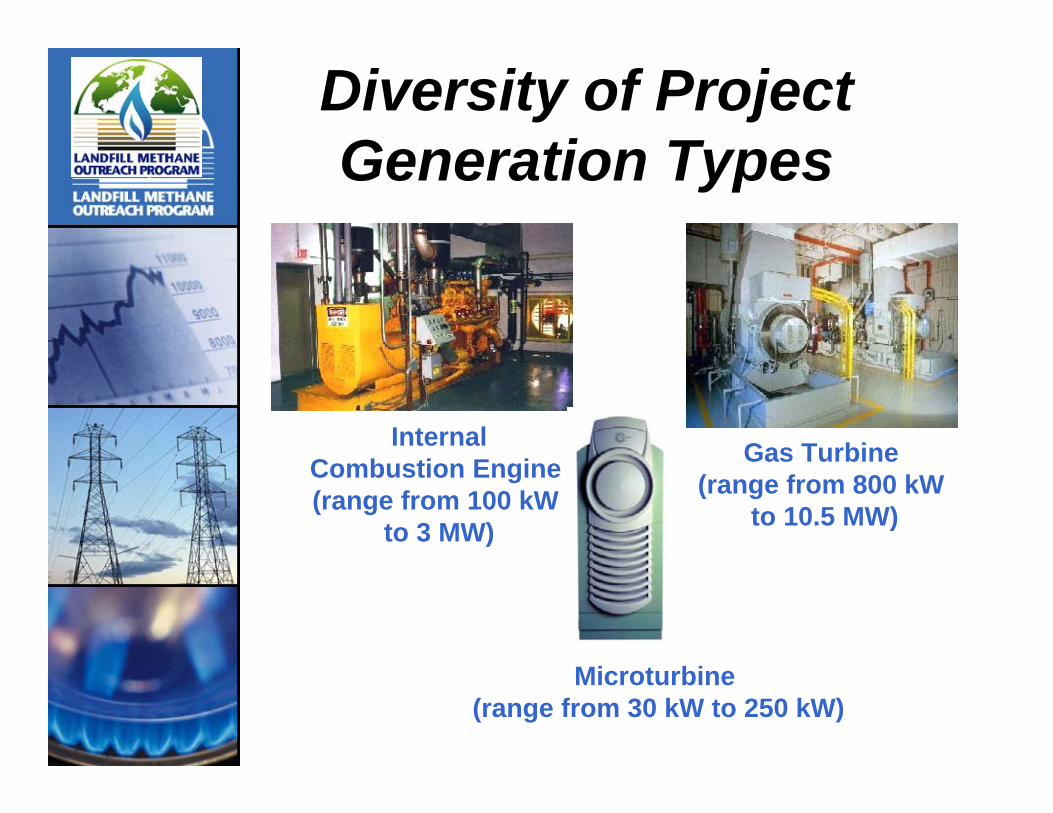
Diversity of Project Generation Types
InternalCombustion Engine (range from 100 kW
to 3 MW)
Gas Turbine (range from 800 kW
to 10.5 MW)
Microturbine (range from 30 kW to 250 kW)

Direct Use• Direct-use projects are growing!
– Boiler applications – replace natural gas, coal, fuel oil– Combined heat & power (CHP)– Direct thermal (dryers, kilns)– Natural gas pipeline injection
• Medium & high Btu– Greenhouse– Leachate evaporation– Vehicle fuel (LNG, CNG)– Artist studio– Hydroponics– Aquaculture (fish farming)
LFG-fired Boiler Ft. Wayne, IN
Greenhouse Burlington, NJ

Emerging Technologies: LFG for Vehicle Fuel
• Los Angeles, CA converts LFG into CNG to fuel landfill equipment (Puente Hills LF)
• Franklin Co, OH convents LFG to CNG to fuel 2 sedans and 4 pick-ups with plans to build commercial CNG facility in coming years
• Central LF, CA plans to convert LFG to CNG to fuel Sonoma County school buses
• Waste Management in CA plans to produce 10-20K gal LNG per day for garbage trucks


Look WhoLook Who’’s Talking about LFG!s Talking about LFG!

DirectDirect--Use Case StudyUse Case StudyMARS Snackfood USA and City MARS Snackfood USA and City
of Waco Landfillof Waco LandfillLFG from city landfill is piped
to MARS for use in boiler Replaces natural gasLFG replaced 60% of plant’s boiler fuel – 600 mmBTU/daySaves plant over $600,000/yearProject lifetime of at least 25 yearsReduced CO2 emissions by 10,000 tonnesEquivalent to 3% of MARS total energy use for U.S. factories
March 15, 2007
City of Waco Landfill
M F USA -Waco Plant
3 m ile pipeline
2008 LMOP Award Winner

Direct-Use Case StudyJackson County
Green Energy ParkSylva, NC
LMOP 2006
Project of the Year

LMOP Tools and ServicesLMOP Tools and Services• Network of 800+ Partners (and
growing)• Newsletter and listserv• Direct project assistance• Technical and outreach publications• Project and candidate landfill
database• Support for ribbon cuttings and other
public relations• Presentations at conferences• State training workshops• LMOP Annual Conference & Project
Expo

How Can We Work Together? How Can We Work Together? Direct Project AssistanceDirect Project Assistance
• Analyze landfill resource – gas modeling• Identify potential matches – LMOP
Locator• Assess landfill and end user facilities • Look at project possibilities
– Direct-use (boiler, heating, cooling, direct thermal)
– Combined Heat & Power (engine, turbine, microturbine)
– Electric (engine, turbine, microturbine)– Alternative Fuels (medium or high Btu, LNG,
CNG)• Initial feasibility analyses – LFGcost

Analyze Energy Potential Analyze Energy Potential from Landfillfrom Landfill
Indian River County Landfill
0
500
1000
1500
2000
2500
3000
1979 1989 1999 2009 2019 2029 2039
Year
LFG
Pro
duct
ion
and
Rec
over
y (s
cfm
)
Production
Recovery
2004

Identify Potential Matches

EPA Project ExpoEPA Project Expo
• Interested in an LFGE Project?• EPA features a select number of
landfills at the Annual LMOP Conference in January.
• LMOP will develop a “resume” for your landfill to feature at the conference.
• Contact me if interested!

Methane to Methane to MarketsMarkets PartnershipPartnershipEncourages development of cost-effective methane recovery and use opportunities in
coal mineslandfillsoil and gas systems and agriculture (manure waste management)
Private companies, multilateral development banks and other relevant organizations participate by joining the Project Network – over 790 organizations now participating29 Partner Governments
KazakhstanKoreaMexicoMongoliaNigeriaPakistanPhilippinesPolandRussiaThailandUkraineUnited KingdomUnited StatesVietnam
ArgentinaAustraliaBrazil BulgariaCanadaChileColombiaChina European Comm.Ecuador FinlandGermany IndiaItaly Japan

Tools and Services Tools and Services Offered to M2M PartnersOffered to M2M Partners
Hands-on Technical Assistance – assisting partners to identify and assess potential landfill energy projectsTraining and Outreach –reaching out to and training government officials, landfill owners and operators, and project developersDeveloping Tools and Resources – to identify, assess, and develop projects in partner countries

For More InformationFor More Informationwww.epa.gov/lmop
Tom [email protected], (202) 343-9232Chris [email protected], (202) 343-9391
Victoria [email protected], (202) 343-9291
Swarupa [email protected], (202) 343-9732
WAMT
IDOR
NV
CA
WY
UT CO
NMAZ
ND
TX
OK
KS
NE
SD
MN
IA
MO
IL
WI
MI
INOH
KY
TNAR
LA
MS AL GA
SC
NC
WV
PA
NY
ME
FL
VA
VT
MDDE
NJ
RI
MA
NH
PR
AK
HI
VI
CT
T3:Tom
T2:Victoria
T1:Chris
T4: Swarupa
Rachel [email protected](202) 343-9391

Climate – Clean Energy Framework: Multiple Benefits
Territorial Governments are looking for:Air quality improvementsGreenhouse gas emission reductionsEnergy security and reliabilityEconomic developmentPublic healthQuality of life
Clean Energy
Air Quality
Climate Change
Clean Energy: Energy Efficiency, Renewable Energy, Combined Heat and Power

Roles for State / Local Governments in Addressing Climate Change
State / Local experience to date includes:Clean Energy/Climate Action Plans (32 states)Regional cap-and-trade (RGGI, WCI, MWA)Energy efficiency programs Renewable Portfolio Standards (RPS) / RE promotionTransportation
Regulatory authority will continue in areas critical for climate:
Utility regulation Building code development and enforcementAppliance efficiency standardsLand use decisions (incl. siting)Transportation

State Government Work is Dispersed; Local Gov’ts Range from Complex to All-in-One
Territorial GovernmentLegislature/Governor
Utility Commissions
(PUCs)
Energy Offices
EconomicDevelopment
EnvironAgencies
PublicInfrastructure

Leverage EPA’s Climate / Clean Energy Programs
CPPD
CCD
OTAQ
Help State and Local Governments:Learn from Best PracticesEmphasize Co-BenefitsIntegrate PlanningPrioritize EE as a Resource
Offer:Direct Technical SupportPeer ExchangeTools and Guidance
OW

Contact Us
State Climate - Clean Energy Programswww.epa.gov/cleanenergy/energy-programs/state-
and-local/stateLocal Climate - Clean Energy Programs
www.epa.gov/cleanenergy/energy-programs/state-and-local/local
Danielle Sass [email protected], 202-343-9282
Neelam [email protected], 202-343-9384
LMOPLMOPContact InformationContact Information
Tom FrankiewiczProgram ManagerU.S. EPA LMOP(202) 343-9232

Useful Links for More Info.Useful Links for More Info.U.S. EPA LMOP
www.epa.gov/lmop
LMOP Funding Guidehttp://www.epa.gov/landfill/res/guide/
LMOP Database of Projectshttp://www.epa.gov/lmop/proj/index.htm
Database of State Incentives for Renewable Energy (DSIRE)www.dsireusa.org
DOE – Energy Efficiency & Conservation Block Grants Programhttp://apps1.eere.energy.gov/wip/block_grants.cfm