Embed Size (px)
Citation preview

Soil Horizons p. 1 of 11
Measuring the Total and Sequestered Organic Matter Contents of Grassland and Forest Soil Profiles in the National Ecological Observatory Network InitiativeElham A. Ghabbour,* Geoffrey Davies, Abeer A. Sayeed, Millicent T. Croman, Brittney A. Hoehing, and Edward Ayres
The National Soil Project (NSP) at Northeastern University has been measuring the total and sequestered soil organic matter (SOM) contents of more than 2000 soil horizons from all 50 US states since 2008. The sequestration data establish a baseline SOM content of a soil and are a measure of its quality and health. In this paper, on behalf of the National Ecological Observatory Network (NEON)–NSP collaboration we report the total and sequestered SOM contents of 11 grassland and forest profiles in eight US states at elevations of 25 to 1548 m and 7 soil orders to depths of 200 cm. Such soils serve (i) as standards with which other soils can be compared and (ii) as benchmarks for NEON measurements. Total SOM was measured by optimized loss-on-ignition (LOI) of dried soil samples at 650°C for 12 h. Sequestered SOM is represented by long-lived humic substances (HS) in the form of humic acids (HA), fulvic acids (FA), and sequestered dissolved organic carbon (DOC). Humic acids were measured gravimetrically; FA and sequestered DOC were measured by visible and UV spectrophotometry, respectively. Major findings are: (i) the data are mostly reproducible; (ii) carbon sequestration drops sharply below the A horizons; (iii) there are three profile types (in six Type A profiles the percentage HA exhibits a minimum with increasing depth, whereas no minimum is evident in the four Type B profiles investigated, and the Jornada profile labeled C features increasing percentage HA with increasing depth due to a carbonate barrier at 78 cm depth); (iv) decreasing FA/HA ratios with increasing percentage humification indicates FA as precursors of HA; (v) regression of FA against HA for all Type B profiles has a slope of 0.38 (cf. 0.29 for Maine profiles) and is a measure of the sequestration status of those soils; and (vi) HA in four of the profiles retain about three times more water than their total SOM, as observed previously for soil profiles in northern Maine.
Peer Reviewed
Papers
The National Ecological Observatory Network (NEON) is a continental-scale observation system for examining multiple
ecological issues in the long term. NEON gathers and correlates data on the impacts of climate change, land use change, and invasive species on natural resources. Data are being collected from 81 sites (47 terrestrial and 34 aquatic) across the United States, including Alaska, Hawaii, and Puerto Rico, using sensor measurements and field sampling. The sites were selected to rep-resent different regions of vegetation, landforms, climate, and ecosystem characteristics. NEON will combine site-based data with remotely sensed and existing continent-scale datasets (e.g.,
satellite data) to generate a range of scaled data products that can be used to describe changes in the nation’s ecosystems through space and time.
Climate change is one of the five NEON focus areas. Since soils are by far the greatest terrestrial carbon storage sinks (Post et al., 1982; Lal et al., 1998; Campbell et al., 2001; Metz et al., 2007; Scharlemann et al., 2014), NEON is monitoring SOC contents as a function of climate, vegetation, land use, invasive species, and time. Dry soil combustion analysis is a measure of the total SOC (by CO2 measurement) or total SOM (by LOI measurement) in a soil sample. These analytical approaches make no distinc-tion between labile, short-lived components (e.g., corn stover, grass clippings, dead leaves, straw) and HS, which for several likely reasons are much less accessible to microbes as sources of energy (e.g., Campbell et al., 1967; Paul et al., 1997, 2001; Piccolo et al., 1999; Campbell et al., 2001; Six and Jastrow, 2006; Sollins et
Elham A. Ghabbour, Geoffrey Davies, Abeer A. Sayeed, Millicent T. Croman, and Brittney A. Hoehing, National Soil Project, Dep. of Chemistry & Chemical Biology, Northeastern Univ., Boston, MA 02115-5000. Edward Ayres, National Ecological Observatory Network, 1685 38th St., Suite 100, Boulder, CO 80301. *Corre-sponding author ([email protected]).
doi:10.2136/sh15-07-0014A peer-reviewed contribution published in Soil Horizons (2015).Received 1 July 2015. Accepted 14 Sept. 2015.
© Soil Science Society of America 5585 Guilford Rd., Madison, WI 53711 USA.All rights reserved.
Abbreviations: DOC, dissolved organic carbon; FA, fulvic acids; HA, humic acids; HS, humic substances; IHSS, International Humic Substances Society; LOI, loss on ignition; NEON, National Ecological Observatory Network; NRCS/KSSL, NRCS Kellogg Soil Survey Laboratory; NSP, National Soil Project; SOC, total soil organic carbon; SOM, soil organic matter; UV, ultraviolet.
Published December 3, 2015

Soil Horizons p. 2 of 11
al., 2007; Semenov et al., 2013; Vogel et al., 2014; Averill et al., 2014; Khalaf et al., 2014). These stabilized soil fractions are not immune to decomposition: they are linked to the carbon cycle through the action of root exudates, such as oxalic acid, which chelate metal ions that anchor the often dominant HS fraction called humic acids (HA) on mineral surfaces (Keiluweit et al., 2015). However, because they are so much longer-lived, HS measurements pro-vide a steady baseline for assessing the influence of SOM on soil characteristics and properties. Knowledge of HA contents also can facilitate carbon cycle modeling (National Soil Carbon Net-work, 2012), where the proportions of labile and HS pools have to be known (Post et al., 1982; Stevenson and Cole, 1999; Semenov et al., 2013).
Since 2008, the National Soil Project (NSP) at Northeastern Uni-versity has been measuring the HS contents of conventional and organic farm soil horizons. The results express the baseline status of each soil. Measured are total SOM by optimized LOI (Ghabbour et al., 2014) and HA by gravimetry (Ghabbour et al., 2012). The FA and sequestered DOC are measured from a sam-ple’s visible (Ghabbour and Davies, 2009) and ultra-violet (UV) (Carter et al., 2012) solution absorption spectra, respectively, after HS fractionation.
The NSP–NEON collaboration has a common goal to study eco-systems over a long time period as a means of learning how to sustain the Earth and satisfy the growing need for food and envi-ronmental security. This collaboration provides benchmark and reference data to aid interpretation of NEON databases. Here we report the total and sequestered SOM contents of 11 grassland and forest profiles in 8 US states at elevations of 25 to 1548 m and 7 soil orders at depths to 200 cm. The samples contain a wide range of carbonate, clay, sand, and silt. These soils are standards against which other soils can be compared.
Major findings of this collaboration are: (i) the data are mostly reproducible; (ii) sequestered carbon drops sharply below the A horizon; (iii) there are three profile types (in six Type A profiles the percentage HA exhibits a minimum with increasing depth, whereas no minimum is evident in the four Type B profiles inves-tigated, and the Jornada profile labeled C features increasing percentage HA with increasing depth due to a carbonate bar-rier at 78 cm depth); (iv) decreasing FA/HA ratios with percent humification indicate FA as precursors of HA; (v) regression of FA against HA for all Type B profiles has a slope of 0.38 (cf. 0.29 for Maine profiles) and is a measure of the sequestration status of that soil; and (vi) HA in four of the profiles retain about three times more water than the total SOM, as observed previously for soil profiles in northern Maine.
Materials and MethodsTable 1 lists site locations and descriptions of the soils sampled from the eight US states investigated in this study. Three are forest soils, six are grassland, one is a regenerating old field, and
one is in plowed cropland. Four of the 11 sites (Harvard, Ordway, Woodworth, and CPER) were selected by NEON to be broadly representative of wildlands in different US ecoregions. The remaining seven sites were selected to have contrasting land use and/or climate relative to the wildland sites. Keller et al. (2008) gave further information on site selection.
Soil samples ranging from fine frigid to coarse thermic were collected by NEON from a single temporary soil pit at each site. The soil pit location was selected to represent NEON’s instru-mented soil plots, which are located on the locally dominant or codominant soil type in an approximately 2-km2 area around each NEON tower (Loescher et al., 2014). Each pit was dug with a motorized front loader. Soil samples were taken using standard methods from each soil horizon to a depth of 200 cm or bedrock, whichever was shallower (Ayres et al., 2014).
The samples for archiving were air dried, and mineral soil was passed through a 2-mm sieve before storage in sealed glass containers at room temperature (NEON Megapit Soil Archive, 2013). Organic soil samples were air dried, mixed by hand, and archived in the same manner. Biogeochemical and physical properties were measured on additional samples by the NRCS Kellogg Soil Survey Laboratory (NRCS/KSSL) in Lincoln, NE. At the NSP laboratory the air-dried samples from the NEON archive were subjected to an air-conditioned laboratory air flow of 396.4 L/min (14 ft3/min) in a large porcelain basin for 24 h and then dried overnight at 105°C as a measure of their ability to retain water (Ghabbour et al., 2013).
At NSP, the total SOM of each soil sample was measured by opti-mized LOI of dried samples at 650°C for 12 h (Ghabbour et al., 2014). Soil samples were fractionated at room temperature as previously described (Ghabbour et al., 2012). Briefly, a dried soil sample (3.9–4.1 g, precisely weighed) was shaken with 100 mL of 0.1 M HCl in a closed, horizontally configured 250-mL centrifuge bottle for 24 h, and then centrifuged (19,700 g at 4°C) for 30 min. The residue was treated three more times in the same manner with a fresh charge of 0.1 M HCl each time. The residue next was washed twice for 24 h with 100 mL of water with fresh water in the second cycle. It was then extracted twice with 100 mL of 0.1 M NaOH, with fresh 0.1 M NaOH added to the residue in the second cycle. The residue was discarded and the supernatants from the 0.1 M NaOH extractions were combined, reduced to pH 1.6 with concentrated HCl and left undisturbed for 24 h. The pre-cipitated HA gel was separated from the supernatant FA, washed with water by centrifugation, dried at 105°C, and weighed to con-stant mass with a microbalance.
Spectrophotometric analysis of FA supernatants was based on three International Humic Substances Society (IHSS) FA stan-dards that have exponential visible spectra. The FA concentration ([FA], g L−1) was calculated from the sample absorbance at 350 nm using the average absorptivity 5.3 ± 0.3 L cm g−1 of these three

Soil Horizons p. 3 of 11
Tabl
e 1.
Site
s an
d so
il de
scrip
tions
.N
EON
pro
file
nam
eEl
evat
ion
Stat
eC
ount
yLa
titud
eLo
ngitu
deSe
ries
Fam
ilySu
bgro
upG
reat
gro
upSu
bord
erO
rder
Ecos
yste
m ty
pe
m
Har
vard
For
est
373
MA
Wor
cest
er42
.535
62–7
2.17
562
Henn
iker
, ta
xaju
nct
coar
se lo
amy
over
san
dy,
mix
ed, s
emi-
activ
e, f
rigid
Oxy
aqui
c D
ystr
udep
tsD
ystr
udep
tsU
dept
sIn
cept
isols
Tem
pera
te
deci
duou
s fo
rest
Blan
dy17
7VA
Cla
rke
39.0
6044
–78.
0711
5Po
plim
ento
, ta
xaju
nct
fine,
mix
ed,
suba
ctiv
e,
mes
ic
Ulti
c H
aplu
-da
lfsH
aplu
dalfs
Ulti
cA
lfiso
lsRe
gene
ratin
g ol
d fie
ld
Jone
s49
GA
Bake
r31
.196
08–8
4.46
647
Lucy
loam
y, k
aolin
-iti
c, th
erm
icA
reni
c Ka
ndi-
udul
tsKa
ndiu
dults
Are
nic
Ulti
sols
Tem
pera
te
coni
fero
us
fore
st
Disn
ey25
FLO
sceo
la28
.129
19–8
1.43
394
Smyr
nasa
ndy,
sili
ceou
s, hy
pert
herm
icA
eric
Ala
quod
sA
laqu
ods
Aqu
ods
Spod
osol
sG
rass
land
(R
egen
erat
ing
long
leaf
pin
e-w
iregr
ass)
Ord
way
55FL
Putn
am29
.688
19–8
1.99
345
Asta
tula
hype
rthe
rmic
, un
coat
edTy
pic
Qua
rtz-
ipsa
mm
ents
Qua
rtzi
psam
-m
ents
Psam
men
tsEn
tisol
sTe
mpe
rate
co
nife
rous
fo
rest
(lon
glea
f pi
ne-w
iregr
ass)
Woo
dwor
th58
8N
DSt
utsm
an47
.128
33–9
9.23
907
Man
ning
coar
se, l
oam
y ov
er s
andy
, m
ixed
, sup
er-
activ
e fr
igid
Typi
c H
aplu
s-to
llsH
aplu
stol
lsU
stol
lsM
ollis
ols
Gra
ssla
nd
Dak
ota
Cot
eau
571
ND
Stut
sman
47.1
5919
–99.
1125
1M
axFi
ne-lo
amy,
m
ixed
, sup
er-
activ
e m
esic
Typi
c H
aplu
s-to
llsH
aplu
stol
lsU
stol
lsM
ollis
ols
Gra
ssla
nd
(sea
sona
l gr
azin
g)
CPE
R15
48C
OW
eld
40.8
1297
–104
.744
55As
calo
nFi
ne-s
ilty,
m
ixed
, sup
er-
activ
e, m
esic
Arid
ic A
rgi-
usto
llsA
rgiu
stol
lsU
stol
lsM
ollis
ols
Gra
ssla
nd
(sho
rtgr
ass
step
pe)
Ster
ling
1369
CO
Loga
n40
.459
84–1
03.0
3008
Gosh
enFi
ne-s
ilty,
m
ixed
, sup
er-
activ
e, m
esic
Pach
ic A
rgi-
usto
llsH
aplu
step
tsU
stol
lsM
ollis
ols
Plow
ed c
rop-
land
Klem
me
515
OK
Was
hita
35.4
1062
–99.
0604
4Co
rdel
l, ta
xa-
junc
tLo
amy,
mix
ed,
activ
e, th
erm
icLi
thic
Hap
lus-
tept
sH
aplu
step
tsU
step
tsIn
cept
isols
Gra
ssla
nd
(gra
zed)
Jour
nada
1327
NM
Don
a A
na32
.590
52–1
06.8
4377
Nati
ons
Coa
rse,
loam
y,
mix
ed, s
uper
-ac
tive
ther
mic
Typi
c Pe
tro-
calc
ids
Petro
calc
ids
Cal
cids
Arid
isols
Gra
ssla
nd
Soil Horizons p. 4 of 11
IHSS FA standards (Ghabbour and Davies, 2009). A recently discovered approach was followed to measure the sequestered dissolved organic carbon concentration ([DOC], g L−1) of each FA solution. The approach is based on a parameterized two-component model for the ratio of optical absorbances at two wavelengths in the UV spectrum of a FA solution (Carter et al., 2012). One validity test is that neither fraction fA nor fB of the two fit components A and B (where fA + fB = 1) is greater than unity and/or negative. A second criterion is that the calculated [DOC] (g L−1) is independent of the UV wavelengths used as input. The measured [FA] values (g L−1) from this spectral analysis were multiplied by the respective sample volumes (L) to give the mass of FA in each soil sample and hence its FA percentage, %FA. All percentages of soil components reported here are expressed as percent (w/w) on a dry sample basis. All chemicals used were reagent grade, and doubly deionized water was used throughout.
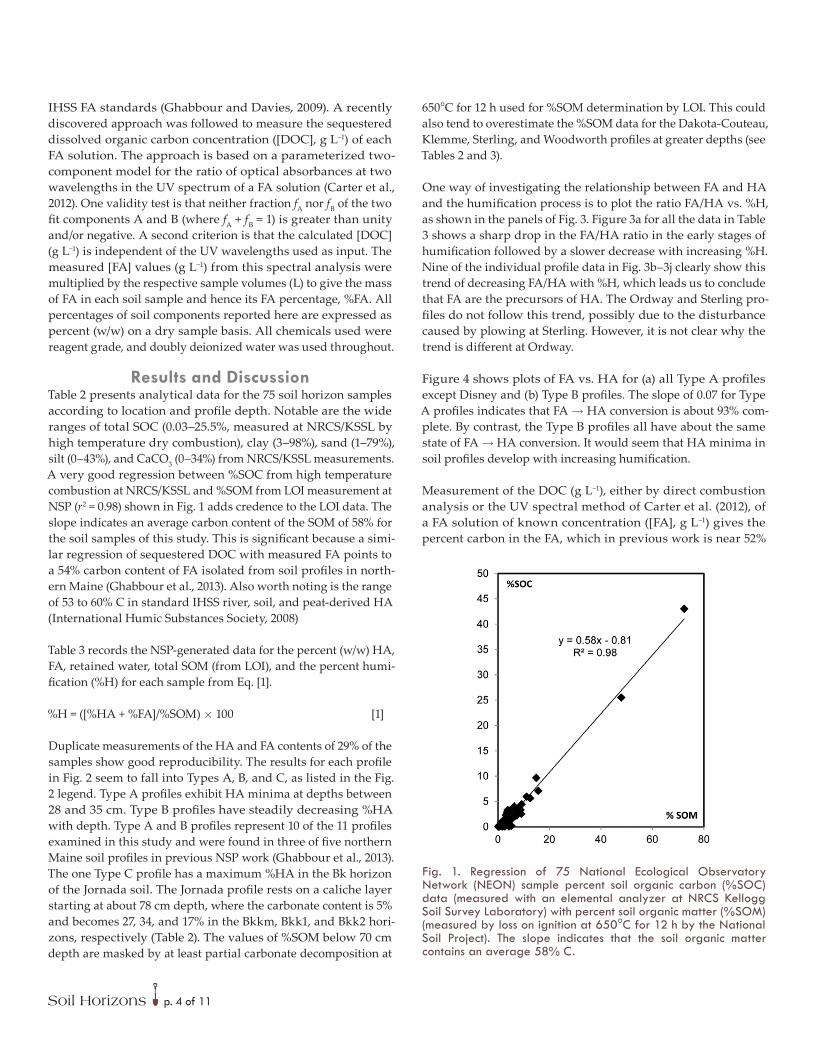
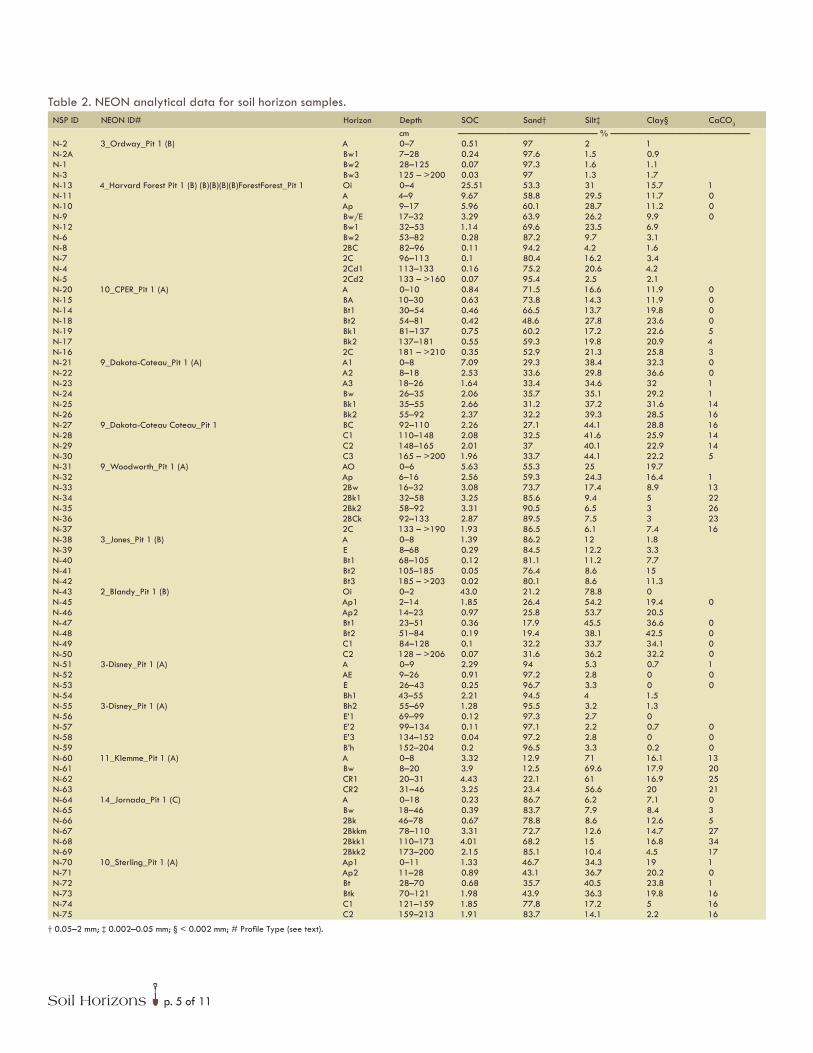
Results and DiscussionTable 2 presents analytical data for the 75 soil horizon samples according to location and profile depth. Notable are the wide ranges of total SOC (0.03–25.5%, measured at NRCS/KSSL by high temperature dry combustion), clay (3–98%), sand (1–79%), silt (0–43%), and CaCO3 (0–34%) from NRCS/KSSL measurements. A very good regression between %SOC from high temperature combustion at NRCS/KSSL and %SOM from LOI measurement at NSP (r2 = 0.98) shown in Fig. 1 adds credence to the LOI data. The slope indicates an average carbon content of the SOM of 58% for the soil samples of this study. This is significant because a simi-lar regression of sequestered DOC with measured FA points to a 54% carbon content of FA isolated from soil profiles in north-ern Maine (Ghabbour et al., 2013). Also worth noting is the range of 53 to 60% C in standard IHSS river, soil, and peat-derived HA (International Humic Substances Society, 2008)
Table 3 records the NSP-generated data for the percent (w/w) HA, FA, retained water, total SOM (from LOI), and the percent humi-fication (%H) for each sample from Eq. [1].
%H = ([%HA + %FA]/%SOM) ´ 100 [1]
Duplicate measurements of the HA and FA contents of 29% of the samples show good reproducibility. The results for each profile in Fig. 2 seem to fall into Types A, B, and C, as listed in the Fig. 2 legend. Type A profiles exhibit HA minima at depths between 28 and 35 cm. Type B profiles have steadily decreasing %HA with depth. Type A and B profiles represent 10 of the 11 profiles examined in this study and were found in three of five northern Maine soil profiles in previous NSP work (Ghabbour et al., 2013). The one Type C profile has a maximum %HA in the Bk horizon of the Jornada soil. The Jornada profile rests on a caliche layer starting at about 78 cm depth, where the carbonate content is 5% and becomes 27, 34, and 17% in the Bkkm, Bkk1, and Bkk2 hori-zons, respectively (Table 2). The values of %SOM below 70 cm depth are masked by at least partial carbonate decomposition at
650°C for 12 h used for %SOM determination by LOI. This could also tend to overestimate the %SOM data for the Dakota-Couteau, Klemme, Sterling, and Woodworth profiles at greater depths (see Tables 2 and 3).
One way of investigating the relationship between FA and HA and the humification process is to plot the ratio FA/HA vs. %H, as shown in the panels of Fig. 3. Figure 3a for all the data in Table 3 shows a sharp drop in the FA/HA ratio in the early stages of humification followed by a slower decrease with increasing %H. Nine of the individual profile data in Fig. 3b–3j clearly show this trend of decreasing FA/HA with %H, which leads us to conclude that FA are the precursors of HA. The Ordway and Sterling pro-files do not follow this trend, possibly due to the disturbance caused by plowing at Sterling. However, it is not clear why the trend is different at Ordway.
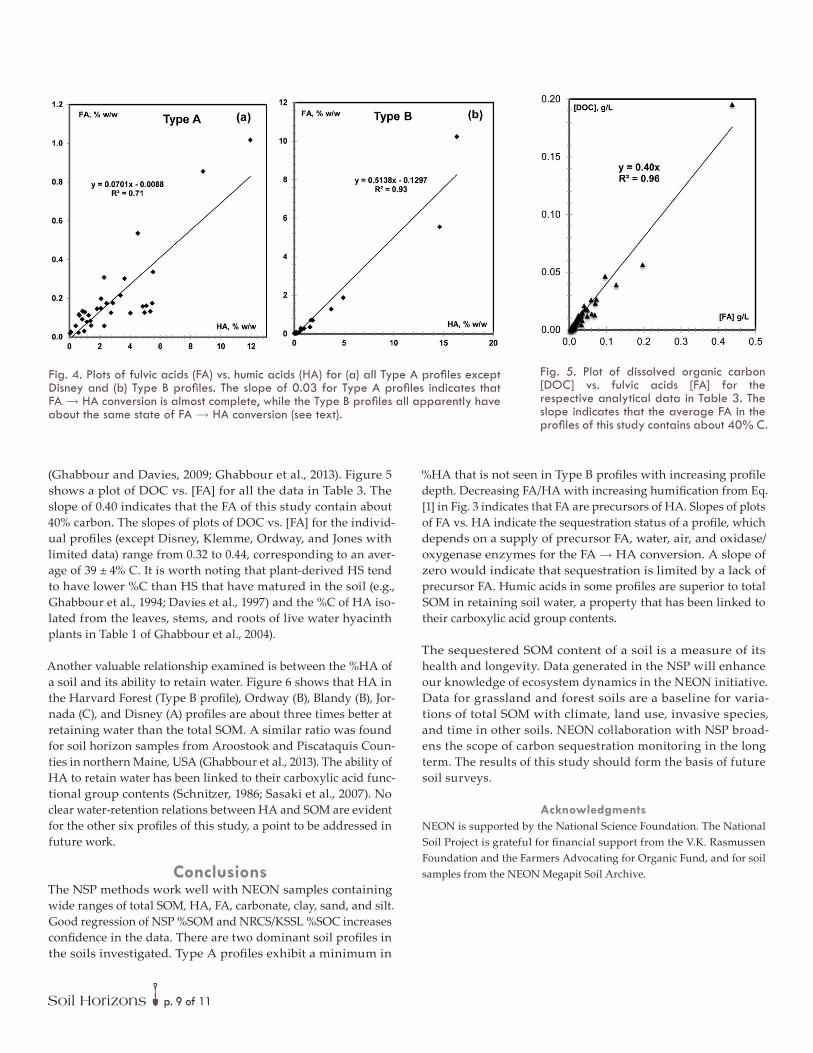
Figure 4 shows plots of FA vs. HA for (a) all Type A profiles except Disney and (b) Type B profiles. The slope of 0.07 for Type A profiles indicates that FA ® HA conversion is about 93% com-plete. By contrast, the Type B profiles all have about the same state of FA ® HA conversion. It would seem that HA minima in soil profiles develop with increasing humification.
Measurement of the DOC (g L−1), either by direct combustion analysis or the UV spectral method of Carter et al. (2012), of a FA solution of known concentration ([FA], g L−1) gives the percent carbon in the FA, which in previous work is near 52%
Fig. 1. Regression of 75 National Ecological Observatory Network (NEON) sample percent soil organic carbon (%SOC) data (measured with an elemental analyzer at NRCS Kellogg Soil Survey Laboratory) with percent soil organic matter (%SOM) (measured by loss on ignition at 650°C for 12 h by the National Soil Project). The slope indicates that the soil organic matter contains an average 58% C.
Soil Horizons p. 5 of 11
Table 2. NEON analytical data for soil horizon samples.NSP ID NEON ID# Horizon Depth SOC Sand† Silt‡ Clay§ CaCO3
cm ——————————————— % ———————————————N-2 3_Ordway_Pit 1 (B) A 0–7 0.51 97 2 1N-2A Bw1 7–28 0.24 97.6 1.5 0.9N-1 Bw2 28–125 0.07 97.3 1.6 1.1N-3 Bw3 125 – >200 0.03 97 1.3 1.7N-13 4_Harvard Forest Pit 1 (B) (B)(B)(B)(B)ForestForest_Pit 1 Oi 0–4 25.51 53.3 31 15.7 1N-11 A 4–9 9.67 58.8 29.5 11.7 0N-10 Ap 9–17 5.96 60.1 28.7 11.2 0N-9 Bw/E 17–32 3.29 63.9 26.2 9.9 0N-12 Bw1 32–53 1.14 69.6 23.5 6.9N-6 Bw2 53–82 0.28 87.2 9.7 3.1N-8 2BC 82–96 0.11 94.2 4.2 1.6N-7 2C 96–113 0.1 80.4 16.2 3.4N-4 2Cd1 113–133 0.16 75.2 20.6 4.2N-5 2Cd2 133 – >160 0.07 95.4 2.5 2.1N-20 10_CPER_Pit 1 (A) A 0–10 0.84 71.5 16.6 11.9 0N-15 BA 10–30 0.63 73.8 14.3 11.9 0N-14 Bt1 30–54 0.46 66.5 13.7 19.8 0N-18 Bt2 54–81 0.42 48.6 27.8 23.6 0N-19 Bk1 81–137 0.75 60.2 17.2 22.6 5N-17 Bk2 137–181 0.55 59.3 19.8 20.9 4N-16 2C 181 – >210 0.35 52.9 21.3 25.8 3N-21 9_Dakota-Coteau_Pit 1 (A) A1 0–8 7.09 29.3 38.4 32.3 0N-22 A2 8–18 2.53 33.6 29.8 36.6 0N-23 A3 18–26 1.64 33.4 34.6 32 1N-24 Bw 26–35 2.06 35.7 35.1 29.2 1N-25 Bk1 35–55 2.66 31.2 37.2 31.6 14N-26 Bk2 55–92 2.37 32.2 39.3 28.5 16N-27 9_Dakota-Coteau Coteau_Pit 1 BC 92–110 2.26 27.1 44.1 28.8 16N-28 C1 110–148 2.08 32.5 41.6 25.9 14N-29 C2 148–165 2.01 37 40.1 22.9 14N-30 C3 165 – >200 1.96 33.7 44.1 22.2 5N-31 9_Woodworth_Pit 1 (A) AO 0–6 5.63 55.3 25 19.7N-32 Ap 6–16 2.56 59.3 24.3 16.4 1N-33 2Bw 16–32 3.08 73.7 17.4 8.9 13N-34 2Bk1 32–58 3.25 85.6 9.4 5 22N-35 2Bk2 58–92 3.31 90.5 6.5 3 26N-36 2BCk 92–133 2.87 89.5 7.5 3 23N-37 2C 133 – >190 1.93 86.5 6.1 7.4 16N-38 3_Jones_Pit 1 (B) A 0–8 1.39 86.2 12 1.8N-39 E 8–68 0.29 84.5 12.2 3.3N-40 Bt1 68–105 0.12 81.1 11.2 7.7N-41 Bt2 105–185 0.05 76.4 8.6 15N-42 Bt3 185 – >203 0.02 80.1 8.6 11.3N-43 2_Blandy_Pit 1 (B) Oi 0–2 43.0 21.2 78.8 0N-45 Ap1 2–14 1.85 26.4 54.2 19.4 0N-46 Ap2 14–23 0.97 25.8 53.7 20.5N-47 Bt1 23–51 0.36 17.9 45.5 36.6 0N-48 Bt2 51–84 0.19 19.4 38.1 42.5 0N-49 C1 84–128 0.1 32.2 33.7 34.1 0N-50 C2 128 – >206 0.07 31.6 36.2 32.2 0N-51 3-Disney_Pit 1 (A) A 0–9 2.29 94 5.3 0.7 1N-52 AE 9–26 0.91 97.2 2.8 0 0N-53 E 26–43 0.25 96.7 3.3 0 0N-54 Bh1 43–55 2.21 94.5 4 1.5N-55 3-Disney_Pit 1 (A) Bh2 55–69 1.28 95.5 3.2 1.3N-56 E’1 69–99 0.12 97.3 2.7 0N-57 E’2 99–134 0.11 97.1 2.2 0.7 0N-58 E’3 134–152 0.04 97.2 2.8 0 0N-59 B’h 152–204 0.2 96.5 3.3 0.2 0N-60 11_Klemme_Pit 1 (A) A 0–8 3.32 12.9 71 16.1 13N-61 Bw 8–20 3.9 12.5 69.6 17.9 20N-62 CR1 20–31 4.43 22.1 61 16.9 25N-63 CR2 31–46 3.25 23.4 56.6 20 21N-64 14_Jornada_Pit 1 (C) A 0–18 0.23 86.7 6.2 7.1 0N-65 Bw 18–46 0.39 83.7 7.9 8.4 3N-66 2Bk 46–78 0.67 78.8 8.6 12.6 5N-67 2Bkkm 78–110 3.31 72.7 12.6 14.7 27N-68 2Bkk1 110–173 4.01 68.2 15 16.8 34N-69 2Bkk2 173–200 2.15 85.1 10.4 4.5 17N-70 10_Sterling_Pit 1 (A) Ap1 0–11 1.33 46.7 34.3 19 1N-71 Ap2 11–28 0.89 43.1 36.7 20.2 0N-72 Bt 28–70 0.68 35.7 40.5 23.8 1N-73 Btk 70–121 1.98 43.9 36.3 19.8 16N-74 C1 121–159 1.85 77.8 17.2 5 16N-75 C2 159–213 1.91 83.7 14.1 2.2 16
† 0.05–2 mm; ‡ 0.002–0.05 mm; § < 0.002 mm; # Profile Type (see text).

Soil Horizons p. 6 of 11
Table 3. NSP analytical data for soil horizon samples.
NSP ID NEON ID Depth HA†HA† Avg. CV‡ FA† FA† Avg. CV‡
Retained water† SOM %H§
cm ———————————————————————— % ——————————————————————N-2 3_Ordway_Pit 1 0–7 A 0.2 0.2 0.07 0.07 0.17 1.03 29N-2A 7–28 Bw1 0.1 0.1 0.05 0.05 0.07 0.55 35N-1 28–125 Bw2 0.1 0.1 0.05 0.05 0.07 0.38 46N-3 125–200 Bw3 0.1 0.1 0.02 0.02 0.13 0.46 26N-13 4_Harvard Forest_Pit 1 0–4 Oi 13.8, 15.4 14.6 0.06
0.024.9, 6.2 5.55 0.12 5.8 47.9 42
N-11 4–9 A 4.8, 5.0 4.9 1.8, 1.9 1.9 0.03 3.1 14.9 46N-10 9–17 Ap 4.0, 3.4 3.7 0.08 1.1, 1.4 1.3 0.10 2.8 11.2 45N-9 17–32 Bw/E 1.7, 1.7 1.7 0.01 0.55, 0.87 0.71 0.22 2.6 6.8 35N-12 32–53 Bw1 0.7 0.7 0.28 0.28 3.1 3.4 28N-6 53–82 Bw2 0.1 0.1 0.06 0.06 0.74 1.32 15N-8 82–96 2BC 0.1 0.1 0.03 0.03 0.34 0.69 25N-7 96–113 2C 0.2 0.2 0.03 0.03 0.31 0.61 39N-4 113–133 2Cd1 0.3 0.3 0.04 0.04 0.51 0.92 38N-5 133–160 2Cd2 0.2 0.2 0.05 0.05 0.30 0.76 29N-20 10_CPER_Pit 1 0–10 A 0.9, 0.8 0.85 0.08 0.11, 0.14 0.13 0.09 1.2 2.6 30N-15 10–30 BA 0.7 0.7 0.11 0.11 1.4 2.5 31N-14 30–54 Bt1 0.9 0.9 0.13 0.13 2.1 2.2 46N-18 54–81 Bt2 1.6, 2.1 1.8 0.13 0.11, 0.19 0.15 0.28 2.4 2.5 80N-19 81–137 Bk1 1.4 1.4 0.06 0.06 2.6 4.2 36N-17 137–181 Bk2 0.1 0.1 0.03 0.03 2.4 3.0 4N-16 181–200 2C 0.05 0.05 0.02 0.02 1.4 2.7 3N-21 9_Dakota Coteau_Pit 1 0–8 A1 10.5, 13.5 11.9 0.12 0.97, 1.1 1.0 0.05 3.7 15.7 83N-22 8–18 A2 4.9, 4.2 4.5 0.08 0.52, 0.55 0.54 0.03 3.0 7.3 69N-23 18–26 A3 2.3 2.3 0.31 0.31 2.9 5.6 46N-24 9_Dakota Coteau_Pit 1 26–35 Bw1 3.7, 3.5 3.6 0.03 0.24, 0.36 0.30 0.19 2.7 6.0 65N-25 35–55 Bk1 4.9, 6.0 5.5 0.10 0.17, 0.18 0.18 0.03 2.6 7.9 71N-26 55–92 Bk2 3.8, 6.4 5.1 0.26 0.15, 0.17 0.16 0.08 2.4 6.8 77N-27 92–110 BC 4.8, 4.9 4.8 0.01 0.14, 0.18 0.16 0.11 2.5 7.4 68N-28 110–148 C1 4.7, 6.0 5.3 0.12 0.13, 0.14 0.13 0.05 2.3 6.6 83N-29 148–165 C2 3.6, 4.5 4.0 0.11 0.12, 0.13 0.12 0.03 1.9 5.6 74N-30 165–200 C3 4.5, 5.4 5.0 0.09 0.13, 0.12 0.13 0.04 2.2 5.9 87N-31 9_Woodworth_Pit 1 0–6 AO 9.5, 8.2 8.8 0.08 0.79, 0.92 0.86 0.08 2.7 12.6 77N-32 6–16 Ap 6.0, 5.1 5.5 0.08 0.30, 0.37 0.34 0.11 1.9 9.1 64N-33 16–32 2Bw 3.6, 3.1 3.4 0.08 0.19, 0.24 0.21 0.11 1.6 7.1 50N-34 32–58 2Bk1 0.8 0.8 0.09 0.09 0.86 4.8 20N-35 58–92 2Bk2 1.2 1.2 0.08 0.08 0.69 3.8 32N-36 92–133 2BCk 0.4 0.4 0.06 0.06 1.1 3.6 13N-37 133–200 2C 0.6 0.6 0.12 0.12 1.3 3.8 20N-38 3_Jones_Pit 1 0–8 A 1.0 1.0 0.28 0.28 0.57 2.4 53N-39 8–68 E 0.5 0.5 0.07 0.07 0.54 1.3 42N-40 68–105 Bt1 0.1 0.1 0.03 0.03 0.67 1.6 11N-41 105–185 Bt2 0.02 0.02 0.03 0.03 1.0 2.7 2N-42 185–200 Bt3 0.03 0.03 0.02 0.02 0.59 1.8 3N-43 2_Blandy_Pit 1 0–2 Oi 16.6, 16.0 16.3 0.02 8.8, 11.7 10.2 0.14 10.7 72.4 37N-45 2–14 Ap1 1.9 1.9 0.69 0.69 1.7 5.8 44N-46 14–23 Ap2 1.6, 1.6 1.6 0.01 0.33, 0.36 0.35 0.04 1.4 4.1 47N-47 23–51 Bt1 0.7 0.7 0.18 0.18 2.0 4.9 18N-48 51–84 Bt2 0.1 0.1 0.06 0.06 1.9 5.2 2N-49 84–128 C1 0.1 0.1 0.04 0.04 1.6 4.4 3N-50 128–200 C2 0.0 0.0 0.02 0.02 1.6 4.3 1N-51 3-Disney_Pit 1 0–9 A 1.1 1.1 0.34 0.34 0.57 3.1 47N-52 9–26 AE 0.5 0.5 0.12 0.12 0.23 1.4 47N-53 26–43 E 0.2 0.2 0.06 0.06 0.13 0.50 60N-54 43–55 Bh1 0.8 0.8 0.41 0.41 0.77 3.6 35N-55 55–69 Bh2 0.4 0.4 0.19 0.19 0.94 2.7 22N-56 69–99 E’1 0.1 0.1 0.04 0.04 0.10 0.35 41N-57 99–134 E’2 0.2 0.2 0.04 0.04 0.20 0.42 47N-58 134–152 E’3 0.1 0.1 0.03 0.03 0.07 0.16 55N-59 152–200 B’h 0.2 0.2 0.19 0.19 0.23 0.55 65N-60 11_Klemme_Pit 1 0–8 A 2.9, 2.9 2.9 0.01 0.21, 0.14 0.18 0.18 2.1 8.8 35N-61 8–20 Bw 1.3 1.3 0.11 0.11 2.1 8.3 17N-62 20–31 CR1 1.0 1.0 0.13 0.13 2.1 9.2 12N-63 31–46 Bw 1.8, 1.0 1.4 0.26 0.08 0.08 2.4 7.4 25N-64 14_Jornada_Pit 1 0–18 A 0.4 0.4 0.04 0.04 0.84 1.4 35N-65 18–46 Bw 1.5 1.5 0.05 0.05 0.74 1.9 81N-66 46–78 Bk 2.4 2.4 0.07 0.07 1.5 3.3 74N-67 78–110 Bkkm 0.3 0.3 0.03 0.03 0.85 5.0 6N-68 110–173 Bkk1 0.4 0.4 0.02 0.02 1.0 6.4 7N-69 173–200 Bkk2 2.0 2.0 0.04 0.04 2.1 6.5 32N-70 10_Sterling_Pit 1 0–11 Ap1 2.5 2.5 0.18 0.18 2.4 3.7 71N-71 11–28 Ap2 2.1 2.1 0.20 0.20 2.7 3.2 71N-72 28–70 Bt 2.1 2.1 0.15 0.15 3.2 2.8 80N-73 70–121 Btk 2.3 2.3 0.06 0.06 2.4 5.8 40N-74 121–159 C1 1.0 1.0 0.03 0.03 1.2 3.5 29N-75 159–200 C2 0.6 0.6 0.02 0.02 1.0 3.4 18
† % of dry sample mass; ‡ coefficient of variance; § %H from Eq. [1].

Soil Horizons p. 7 of 11
Fig. 2. Percentage of humic acids (HA) and fulvic acids (FA) in (a) Woodworth (Type A), (b) Klemme (A), (c) CPER (A), (d) Dakota Coteau (A), (e) Disney (A), (f) Sterling (A), (g) Harvard Forest (Type B), (h) Ordway (B), (i) Jones (B), (j) Blandy (B) and (k) Jornada (C) profiles. The Jordana soil profile rises from a carbonate sublayer at the 78-cm depth, as indicated by the CaCO3 data in Table 2.

Soil Horizons p. 8 of 11
Fig. 3. The ratios humic acids/fulvic acids (FA/HA) vs. percent humification (%H) from Eq. [1] for (a) all 75 soil profiles and (b–j) the respective labeled profiles. The curves are power functions intended to direct attention to the trends of decreasing FA/HA with increasing %H. The data above the trend line in Fig. 3a represent too high FA/HA values for humification of 20–60% for 19 horizon samples. The simplest explanation for these data is that the FA ® HA conversion (an oxidative process) is retarded by lack of one or more of O2, water or enzymes needed for humification to proceed. The average %H in Eq. [1] is 41 for all 75 horizon samples. The Ordway and Sterling profiles in Fig. 3k and 3l exhibit the reverse trends for unknown reasons (see text).
Soil Horizons p. 9 of 11
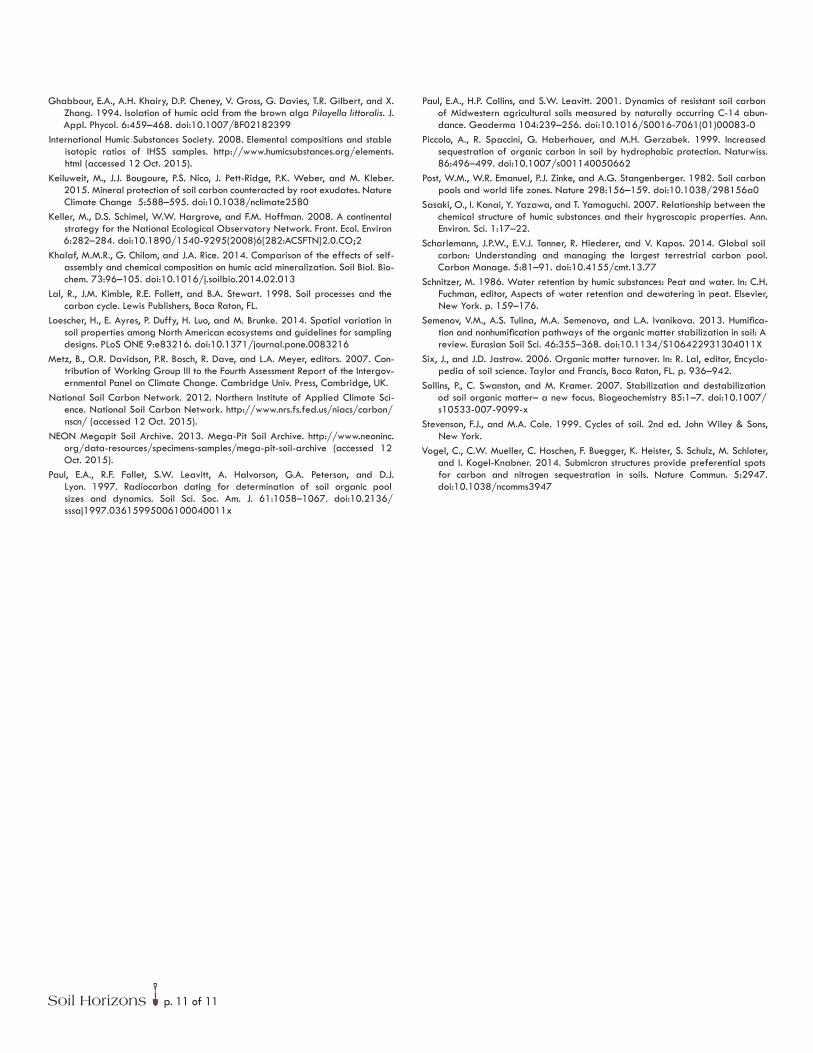
(Ghabbour and Davies, 2009; Ghabbour et al., 2013). Figure 5 shows a plot of DOC vs. [FA] for all the data in Table 3. The slope of 0.40 indicates that the FA of this study contain about 40% carbon. The slopes of plots of DOC vs. [FA] for the individ-ual profiles (except Disney, Klemme, Ordway, and Jones with limited data) range from 0.32 to 0.44, corresponding to an aver-age of 39 ± 4% C. It is worth noting that plant-derived HS tend to have lower %C than HS that have matured in the soil (e.g., Ghabbour et al., 1994; Davies et al., 1997) and the %C of HA iso-lated from the leaves, stems, and roots of live water hyacinth plants in Table 1 of Ghabbour et al., 2004).
Another valuable relationship examined is between the %HA of a soil and its ability to retain water. Figure 6 shows that HA in the Harvard Forest (Type B profile), Ordway (B), Blandy (B), Jor-nada (C), and Disney (A) profiles are about three times better at retaining water than the total SOM. A similar ratio was found for soil horizon samples from Aroostook and Piscataquis Coun-ties in northern Maine, USA (Ghabbour et al., 2013). The ability of HA to retain water has been linked to their carboxylic acid func-tional group contents (Schnitzer, 1986; Sasaki et al., 2007). No clear water-retention relations between HA and SOM are evident for the other six profiles of this study, a point to be addressed in future work.
ConclusionsThe NSP methods work well with NEON samples containing wide ranges of total SOM, HA, FA, carbonate, clay, sand, and silt. Good regression of NSP %SOM and NRCS/KSSL %SOC increases confidence in the data. There are two dominant soil profiles in the soils investigated. Type A profiles exhibit a minimum in
%HA that is not seen in Type B profiles with increasing profile depth. Decreasing FA/HA with increasing humification from Eq. [1] in Fig. 3 indicates that FA are precursors of HA. Slopes of plots of FA vs. HA indicate the sequestration status of a profile, which depends on a supply of precursor FA, water, air, and oxidase/oxygenase enzymes for the FA ® HA conversion. A slope of zero would indicate that sequestration is limited by a lack of precursor FA. Humic acids in some profiles are superior to total SOM in retaining soil water, a property that has been linked to their carboxylic acid group contents.
The sequestered SOM content of a soil is a measure of its health and longevity. Data generated in the NSP will enhance our knowledge of ecosystem dynamics in the NEON initiative. Data for grassland and forest soils are a baseline for varia-tions of total SOM with climate, land use, invasive species, and time in other soils. NEON collaboration with NSP broad-ens the scope of carbon sequestration monitoring in the long term. The results of this study should form the basis of future soil surveys.
AcknowledgmentsNEON is supported by the National Science Foundation. The National Soil Project is grateful for financial support from the V.K. Rasmussen Foundation and the Farmers Advocating for Organic Fund, and for soil samples from the NEON Megapit Soil Archive.
Fig. 4. Plots of fulvic acids (FA) vs. humic acids (HA) for (a) all Type A profiles except Disney and (b) Type B profiles. The slope of 0.03 for Type A profiles indicates that FA ® HA conversion is almost complete, while the Type B profiles all apparently have about the same state of FA ® HA conversion (see text).
Fig. 5. Plot of dissolved organic carbon [DOC] vs. fulvic acids [FA] for the respective analytical data in Table 3. The slope indicates that the average FA in the profiles of this study contains about 40% C.

Soil Horizons p. 10 of 11
ReferencesAverill, C.M., B.L. Turner, and A.C. Finzi. 2014. Mycorrhiza-mediated competi-
tion between plants and decomposers drives soil carbon storage. Nature 505:543–545. doi:10.1038/nature12901.
Ayres, E., R. Zulueta, D. Smith, and J. Roberti. 2014. TIS soil pit sampling protocol. NEON.DOC.001307. National Ecological Observatory Network, Boulder, CO.
Campbell, C.A., E.G. Gregorich, W. Smith, R.P. Zentner, B.C. Liang, B.G. McConkey, G. Rolloff, H.H. Janzen, and K. Paustian. 2001. Carbon sequestration on the Canadian prairies—Quantification of short-term dynamics. In: R. Lal, editor, Soil carbon sequestration and the greenhouse effect. SSSA Spec. Publ. 57. SSSA, Madison, WI. p. 93–114.
Campbell, C.A., E.A. Paul, D.A. Rennie, and P. McCullum. 1967. Applicability of the carbon-dating method of analysis to soil humus studies. Soil Sci. 104:217–224. doi:10.1097/00010694-196709000-00010
Carter, H.T., E. Tipping, J.-F. Koprivnjak, M.P. Miller, B. Cookson, and J. Hamilton-Taylor. 2012. Freshwater DOM quantity and quality from a two-component model of UV absorbance. Water Res. 46:4532–4542. doi:10.1016/j.watres.2012.05.021
Davies, G., A. Fataftah, A. Radwan, R.F. Raffauf, E.A. Ghabbour, and S.A. Jansen. 1997. Isolation of humic acid from the terrestrial plant Brugmansia sanguinea. Sci. Total Environ. 201:79–87. doi:10.1016/S0048-9697(97)84054-5
Ghabbour, E.A., and G. Davies. 2009. Spectrophotometric analysis of fulvic acid solutions: A second look. Ann. Environ. Sci. 3:131–138.
Ghabbour, E.A., G. Davies, N.P. Cuozzo, and R.O. Miller. 2014. Optimized condi-tions for determination of total soil organic matter by mass loss on ignition. J. Plant Nutr. Soil Sci. 177:914–919. doi:10.1002/jpln.201400326
Ghabbour, E.A., G. Davies, J.L. Daggett, Jr., C.A. Worgul, G.A. Wyant, and M.-M. Sayedbagheri. 2012. Measuring the humic acids content of commercial lignites and agricultural top soils in the National Soil Project. Ann. Environ. Sci. 6:1–12. http://hdl.handle.net/2047/d20002124 (accessed 12 Oct. 2015).
Ghabbour, E.A., G. Davies, Y.-Y. Lam, and M.E. Vozzella. 2004. Metal bind-ing by humic acids isolated from water hyacinth plants (Eichhornia crassipes [Mart.] Solm-Laubach: Pontedericae) from the Nile Delta, Egypt. Environ. Pollut. 131:445–451. doi:10.1016/j.envpol.2004.02.013
Ghabbour, E.A., G. Davies, A.A. Sayeed, and T. Jenkins. 2013. Measuring the retained water and sequestered organic carbon contents of soil profiles in Aroostook and Piscataquis Counties, Maine, USA. Soil Horiz. 54:1–7. doi:10.2136/sh13-05-0012.
Fig. 6. Humic acids (HA) in the Harvard Forest, Blandy, Jornada, and Disney profiles are about three times better at retaining water than the total SOM. A similar ratio was found for the soil horizon samples from Aristook and Picataquis Counties in northern Maine, USA (Ghabbour et al., 2013).
Soil Horizons p. 11 of 11
Ghabbour, E.A., A.H. Khairy, D.P. Cheney, V. Gross, G. Davies, T.R. Gilbert, and X. Zhang. 1994. Isolation of humic acid from the brown alga Pilayella littoralis. J. Appl. Phycol. 6:459–468. doi:10.1007/BF02182399
International Humic Substances Society. 2008. Elemental compositions and stable isotopic ratios of IHSS samples. http://www.humicsubstances.org/elements.html (accessed 12 Oct. 2015).
Keiluweit, M., J.J. Bougoure, P.S. Nico, J. Pett-Ridge, P.K. Weber, and M. Kleber. 2015. Mineral protection of soil carbon counteracted by root exudates. Nature Climate Change 5:588–595. doi:10.1038/nclimate2580
Keller, M., D.S. Schimel, W.W. Hargrove, and F.M. Hoffman. 2008. A continental strategy for the National Ecological Observatory Network. Front. Ecol. Environ 6:282–284. doi:10.1890/1540-9295(2008)6[282:ACSFTN]2.0.CO;2
Khalaf, M.M.R., G. Chilom, and J.A. Rice. 2014. Comparison of the effects of self-assembly and chemical composition on humic acid mineralization. Soil Biol. Bio-chem. 73:96–105. doi:10.1016/j.soilbio.2014.02.013
Lal, R., J.M. Kimble, R.E. Follett, and B.A. Stewart. 1998. Soil processes and the carbon cycle. Lewis Publishers, Boca Raton, FL.
Loescher, H., E. Ayres, P. Duffy, H. Luo, and M. Brunke. 2014. Spatial variation in soil properties among North American ecosystems and guidelines for sampling designs. PLoS ONE 9:e83216. doi:10.1371/journal.pone.0083216
Metz, B., O.R. Davidson, P.R. Bosch, R. Dave, and L.A. Meyer, editors. 2007. Con-tribution of Working Group III to the Fourth Assessment Report of the Intergov-ernmental Panel on Climate Change. Cambridge Univ. Press, Cambridge, UK.
National Soil Carbon Network. 2012. Northern Institute of Applied Climate Sci-ence. National Soil Carbon Network. http://www.nrs.fs.fed.us/niacs/carbon/nscn/ (accessed 12 Oct. 2015).
NEON Megapit Soil Archive. 2013. Mega-Pit Soil Archive. http://www.neoninc.org/data-resources/specimens-samples/mega-pit-soil-archive (accessed 12 Oct. 2015).
Paul, E.A., R.F. Follet, S.W. Leavitt, A. Halvorson, G.A. Peterson, and D.J. Lyon. 1997. Radiocarbon dating for determination of soil organic pool sizes and dynamics. Soil Sci. Soc. Am. J. 61:1058–1067. doi:10.2136/sssaj1997.03615995006100040011x
Paul, E.A., H.P. Collins, and S.W. Leavitt. 2001. Dynamics of resistant soil carbon of Midwestern agricultural soils measured by naturally occurring C-14 abun-dance. Geoderma 104:239–256. doi:10.1016/S0016-7061(01)00083-0
Piccolo, A., R. Spaccini, G. Haberhauer, and M.H. Gerzabek. 1999. Increased sequestration of organic carbon in soil by hydrophobic protection. Naturwiss. 86:496–499. doi:10.1007/s001140050662
Post, W.M., W.R. Emanuel, P.J. Zinke, and A.G. Stangenberger. 1982. Soil carbon pools and world life zones. Nature 298:156–159. doi:10.1038/298156a0
Sasaki, O., I. Kanai, Y. Yazawa, and T. Yamaguchi. 2007. Relationship between the chemical structure of humic substances and their hygroscopic properties. Ann. Environ. Sci. 1:17–22.
Scharlemann, J.P.W., E.V.J. Tanner, R. Hiederer, and V. Kapos. 2014. Global soil carbon: Understanding and managing the largest terrestrial carbon pool. Carbon Manage. 5:81–91. doi:10.4155/cmt.13.77
Schnitzer, M. 1986. Water retention by humic substances: Peat and water. In: C.H. Fuchman, editor, Aspects of water retention and dewatering in peat. Elsevier, New York. p. 159–176.
Semenov, V.M., A.S. Tulina, M.A. Semenova, and L.A. Ivanikova. 2013. Humifica-tion and nonhumification pathways of the organic matter stabilization in soil: A review. Eurasian Soil Sci. 46:355–368. doi:10.1134/S106422931304011X
Six, J., and J.D. Jastrow. 2006. Organic matter turnover. In: R. Lal, editor, Encyclo-pedia of soil science. Taylor and Francis, Boca Raton, FL. p. 936–942.
Sollins, P., C. Swanston, and M. Kramer. 2007. Stabilization and destabilization od soil organic matter– a new focus. Biogeochemistry 85:1–7. doi:10.1007/s10533-007-9099-x
Stevenson, F.J., and M.A. Cole. 1999. Cycles of soil. 2nd ed. John Wiley & Sons, New York.
Vogel, C., C.W. Mueller, C. Hoschen, F. Buegger, K. Heister, S. Schulz, M. Schloter, and I. Kogel-Knabner. 2014. Submicron structures provide preferential spots for carbon and nitrogen sequestration in soils. Nature Commun. 5:2947. doi:10.1038/ncomms3947