Embed Size (px)
Citation preview

Romanian financial system – recent developments and perspectives
Liviu Voinea Deputy Governor
Bucharest, 9 March 2016
2
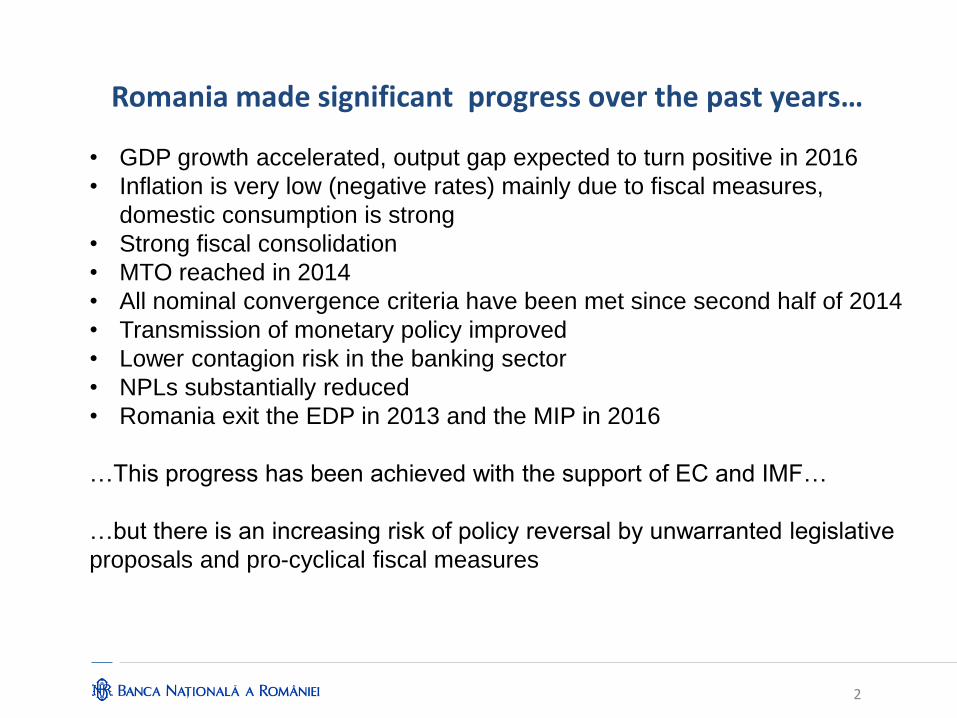
Romania made significant progress over the past years…
• GDP growth accelerated, output gap expected to turn positive in 2016
• Inflation is very low (negative rates) mainly due to fiscal measures,
domestic consumption is strong
• Strong fiscal consolidation
• MTO reached in 2014
• All nominal convergence criteria have been met since second half of 2014
• Transmission of monetary policy improved
• Lower contagion risk in the banking sector
• NPLs substantially reduced
• Romania exit the EDP in 2013 and the MIP in 2016
…This progress has been achieved with the support of EC and IMF…
…but there is an increasing risk of policy reversal by unwarranted legislative
proposals and pro-cyclical fiscal measures
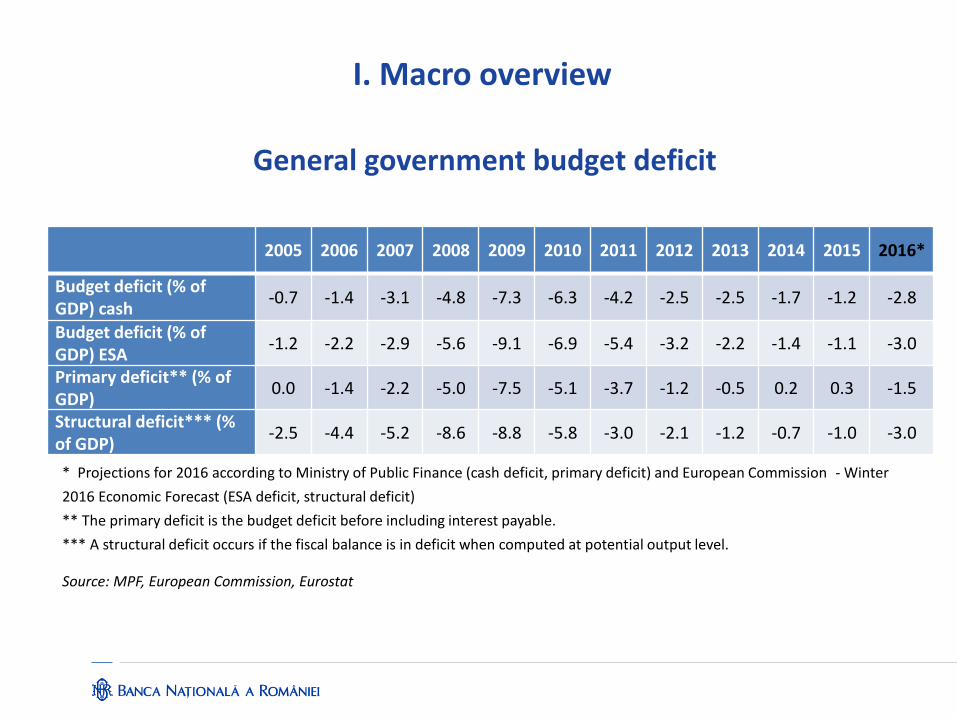
2005 2006 2007 2008 2009 2010 2011 2012 2013 2014 2015 2016*
Budget deficit (% of GDP) cash
-0.7 -1.4 -3.1 -4.8 -7.3 -6.3 -4.2 -2.5 -2.5 -1.7 -1.2 -2.8
Budget deficit (% of GDP) ESA
-1.2 -2.2 -2.9 -5.6 -9.1 -6.9 -5.4 -3.2 -2.2 -1.4 -1.1 -3.0
Primary deficit** (% of GDP)
0.0 -1.4 -2.2 -5.0 -7.5 -5.1 -3.7 -1.2 -0.5 0.2 0.3 -1.5
Structural deficit*** (% of GDP)
-2.5 -4.4 -5.2 -8.6 -8.8 -5.8 -3.0 -2.1 -1.2 -0.7 -1.0 -3.0
* Projections for 2016 according to Ministry of Public Finance (cash deficit, primary deficit) and European Commission - Winter
2016 Economic Forecast (ESA deficit, structural deficit)
** The primary deficit is the budget deficit before including interest payable.
*** A structural deficit occurs if the fiscal balance is in deficit when computed at potential output level.
Source: MPF, European Commission, Eurostat
General government budget deficit
I. Macro overview

External balance improved
The current account deficit narrowed significantly since 2009, but resumed growth in 2015 as domestic
consumption expands
The surplus for trade in services widen over the past years, driven by transport and IT
Current account balance
Source: NBR
4
-25
-20
-15
-10
-5
0
5
10
20
07
20
08
20
09
20
10
20
11
20
12
20
13
20
14
20
15
Goods Services Income Current account/GDP
balance, EUR billions/ percent
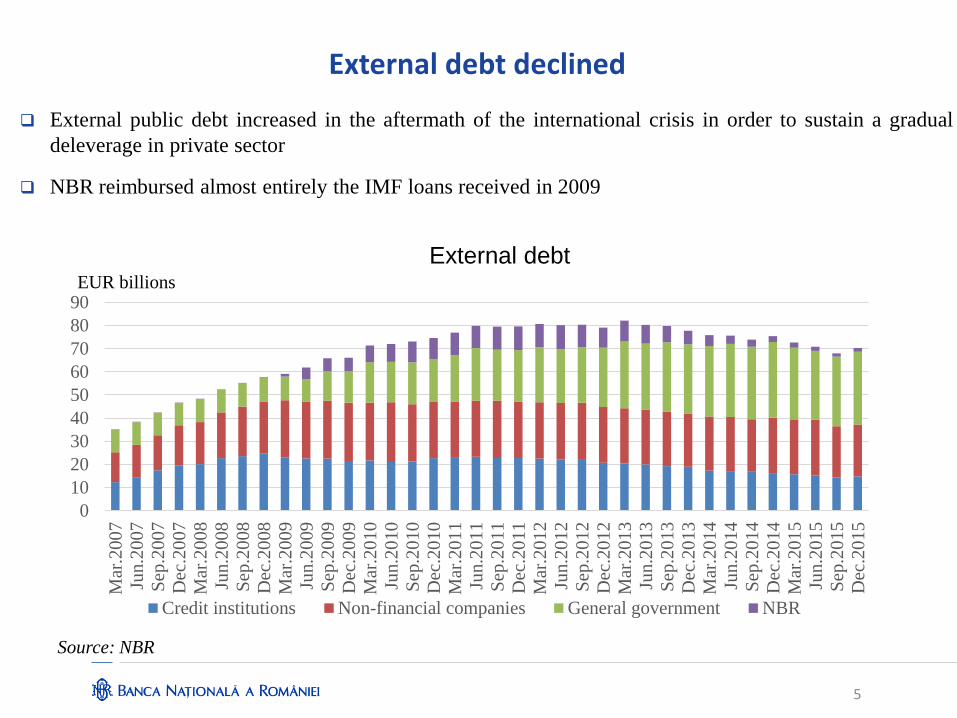
External debt declined
External public debt increased in the aftermath of the international crisis in order to sustain a gradual
deleverage in private sector
NBR reimbursed almost entirely the IMF loans received in 2009
Source: NBR
0
10
20
30
40
50
60
70
80
90
Mar
.200
7
Jun.2
007
Sep
.2007
Dec
.20
07
Mar
.200
8
Jun.2
008
Sep
.2008
Dec
.20
08
Mar
.200
9
Jun.2
009
Sep
.2009
Dec
.20
09
Mar
.201
0
Jun.2
010
Sep
.2010
Dec
.20
10
Mar
.201
1Ju
n.2
011
Sep
.2011
Dec
.20
11
Mar
.201
2Ju
n.2
012
Sep
.2012
Dec
.20
12
Mar
.201
3Ju
n.2
013
Sep
.2013
Dec
.20
13
Mar
.201
4
Jun.2
014
Sep
.2014
Dec
.20
14
Mar
.201
5
Jun.2
015
Sep
.2015
Dec
.20
15
Credit institutions Non-financial companies General government NBR
EUR billions
External debt
5
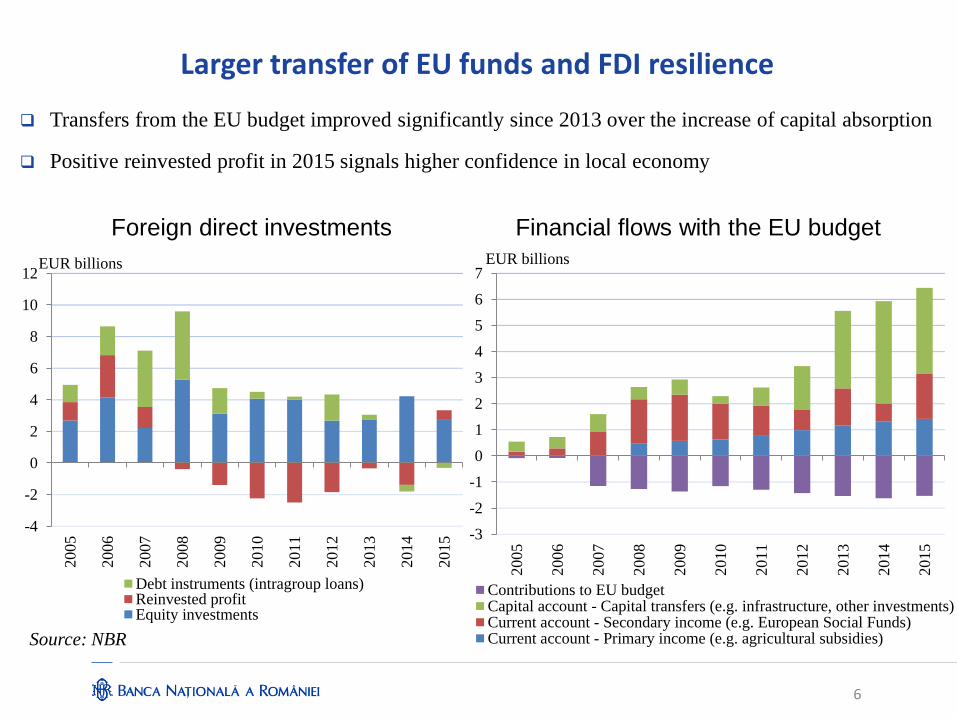
Larger transfer of EU funds and FDI resilience
Transfers from the EU budget improved significantly since 2013 over the increase of capital absorption
Positive reinvested profit in 2015 signals higher confidence in local economy
Foreign direct investments Financial flows with the EU budget
Source: NBR
-4
-2
0
2
4
6
8
10
12
2005
2006
2007
2008
2009
2010
2011
2012
2013
2014
2015
Debt instruments (intragroup loans)Reinvested profitEquity investments
EUR billions
-3
-2
-1
0
1
2
3
4
5
6
7
2005
2006
2007
2008
2009
2010
2011
2012
2013
2014
2015
Contributions to EU budgetCapital account - Capital transfers (e.g. infrastructure, other investments)Current account - Secondary income (e.g. European Social Funds)Current account - Primary income (e.g. agricultural subsidies)
EUR billions
6
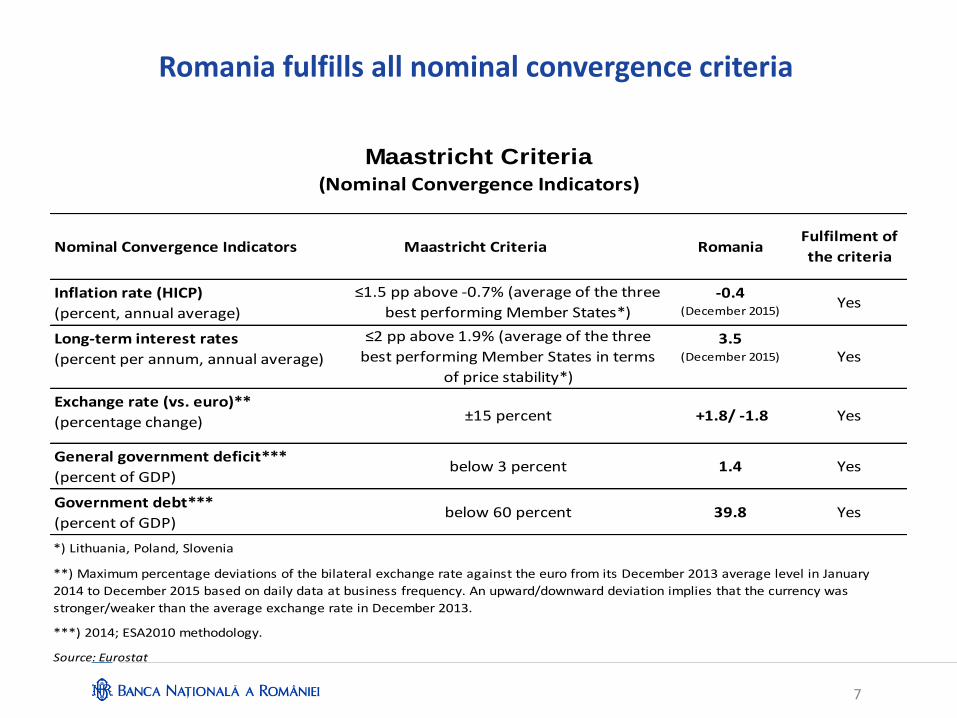
Romania fulfills all nominal convergence criteria
7
Inflation rate (HICP) -0.4
(percent, annual average) (December 2015)
Long-term interest rates 3.5
(percent per annum, annual average) (December 2015)
Exchange rate (vs. euro)**
(percentage change)
General government deficit***
(percent of GDP)
Government debt***
(percent of GDP)
Source: Eurostat
Maastricht Criteria
(Nominal Convergence Indicators)
Nominal Convergence Indicators Maastricht Criteria RomaniaFulfilment of
the criteria
≤1.5 pp above -0.7% (average of the three
best performing Member States*) Yes
≤2 pp above 1.9% (average of the three
best performing Member States in terms
of price stability*)
Yes
±15 percent +1.8/ -1.8 Yes
below 3 percent 1.4 Yes
**) Maximum percentage deviations of the bilateral exchange rate against the euro from its December 2013 average level in January
2014 to December 2015 based on daily data at business frequency. An upward/downward deviation implies that the currency was
stronger/weaker than the average exchange rate in December 2013.
***) 2014; ESA2010 methodology.
below 60 percent 39.8 Yes
*) Lithuania, Poland, Slovenia
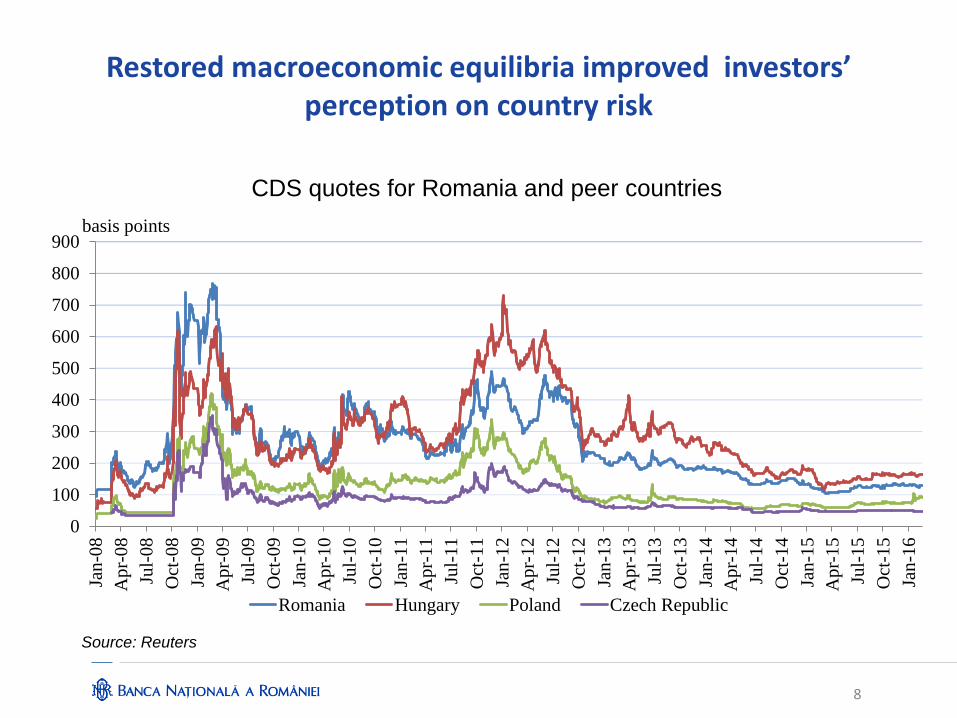
Restored macroeconomic equilibria improved investors’ perception on country risk
8
CDS quotes for Romania and peer countries
Source: Reuters
0
100
200
300
400
500
600
700
800
900
Jan
-08
Ap
r-0
8
Jul-
08
Oct
-08
Jan
-09
Ap
r-0
9
Jul-
09
Oct
-09
Jan
-10
Ap
r-1
0
Jul-
10
Oct
-10
Jan
-11
Ap
r-1
1
Jul-
11
Oct
-11
Jan
-12
Ap
r-1
2
Jul-
12
Oct
-12
Jan
-13
Ap
r-1
3
Jul-
13
Oct
-13
Jan
-14
Ap
r-1
4
Jul-
14
Oct
-14
Jan
-15
Ap
r-1
5
Jul-
15
Oct
-15
Jan
-16
Romania Hungary Poland Czech Republic
basis points
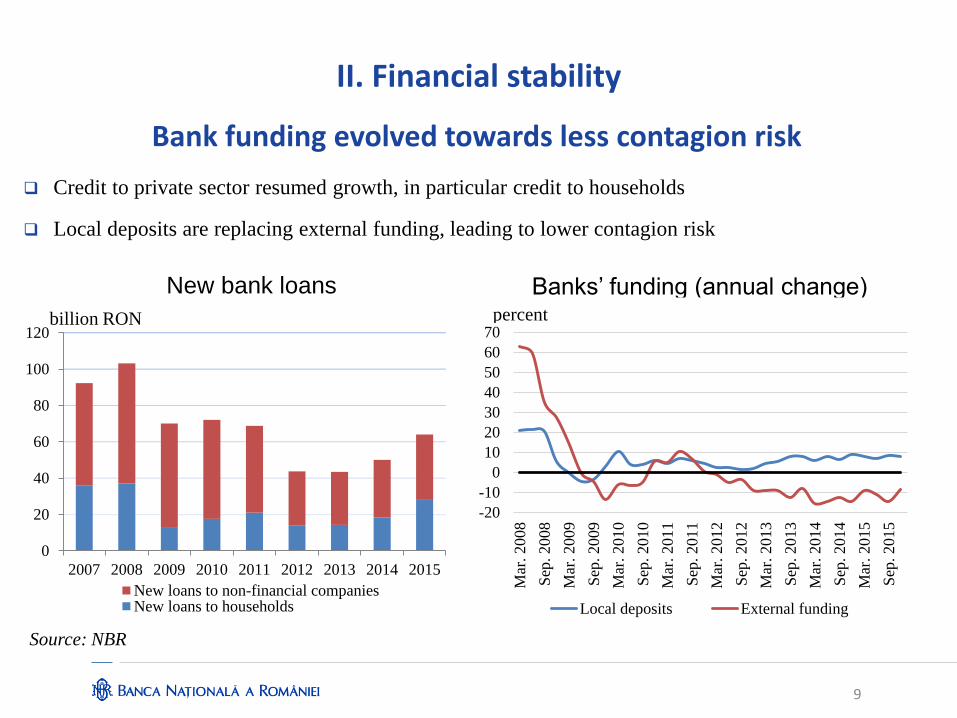
Bank funding evolved towards less contagion risk
Credit to private sector resumed growth, in particular credit to households
Local deposits are replacing external funding, leading to lower contagion risk
New bank loans Banks’ funding (annual change)
Source: NBR
9
II. Financial stability
0
20
40
60
80
100
120
2007 2008 2009 2010 2011 2012 2013 2014 2015
New loans to non-financial companiesNew loans to households
billion RON
-20
-10
0
10
20
30
40
50
60
70
Mar
. 2008
Sep
. 2008
Mar
. 2009
Sep
. 2009
Mar
. 2010
Sep
. 2010
Mar
. 2011
Sep
. 2011
Mar
. 2012
Sep
. 2012
Mar
. 2013
Sep
. 2013
Mar
. 2014
Sep
. 2014
Mar
. 2
015
Sep
. 2015
Local deposits External funding
percent
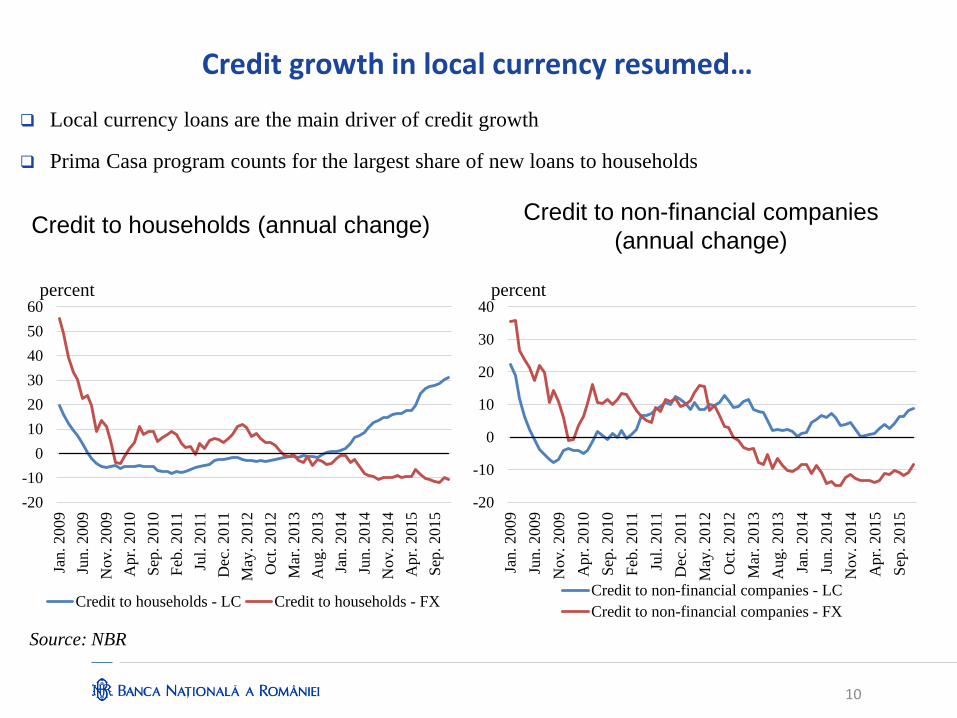
Credit growth in local currency resumed…
Local currency loans are the main driver of credit growth
Prima Casa program counts for the largest share of new loans to households
Credit to households (annual change) Credit to non-financial companies
(annual change)
Source: NBR
10
-20
-10
0
10
20
30
40
50
60
Jan.
2009
Jun. 2009
Nov. 2009
Apr.
2010
Sep
. 2010
Feb
. 2011
Jul.
2011
Dec
. 2011
May
. 2012
Oct
. 2012
Mar
. 2013
Aug. 2013
Jan.
2014
Jun. 2014
Nov. 2014
Apr.
2015
Sep
. 2015
Credit to households - LC Credit to households - FX
percent
-20
-10
0
10
20
30
40
Jan.
2009
Jun. 2009
Nov. 2009
Apr.
2010
Sep
. 2010
Feb
. 2011
Jul.
2011
Dec
. 2011
May
. 2012
Oct
. 2012
Mar
. 2013
Aug. 2013
Jan.
2014
Jun. 2014
Nov. 2014
Ap
r. 2
015
Sep
. 2015
Credit to non-financial companies - LC
Credit to non-financial companies - FX
percent
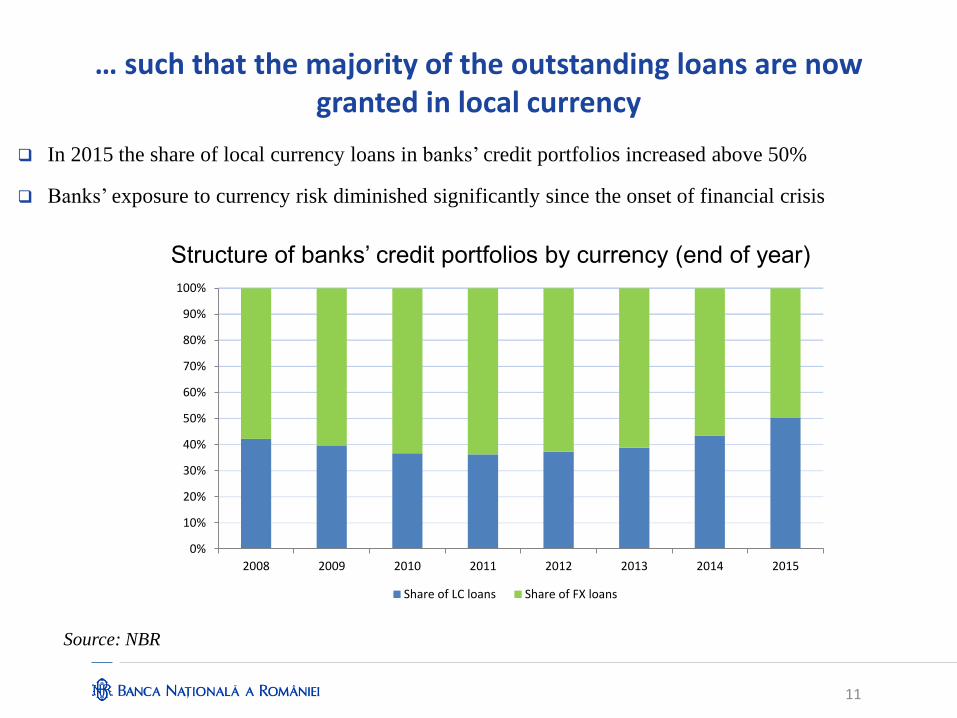
… such that the majority of the outstanding loans are now granted in local currency
In 2015 the share of local currency loans in banks’ credit portfolios increased above 50%
Banks’ exposure to currency risk diminished significantly since the onset of financial crisis
Structure of banks’ credit portfolios by currency (end of year)
Source: NBR
11
0%
10%
20%
30%
40%
50%
60%
70%
80%
90%
100%
2008 2009 2010 2011 2012 2013 2014 2015
Share of LC loans Share of FX loans
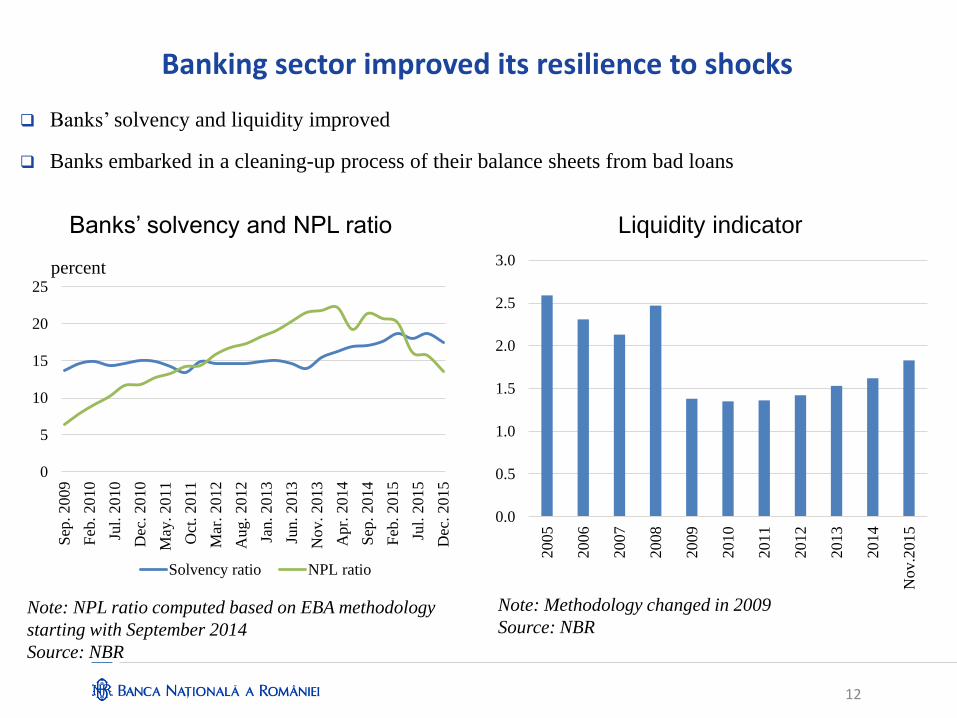
Banking sector improved its resilience to shocks
Banks’ solvency and liquidity improved
Banks embarked in a cleaning-up process of their balance sheets from bad loans
Banks’ solvency and NPL ratio Liquidity indicator
Note: NPL ratio computed based on EBA methodology
starting with September 2014
Source: NBR
0.0
0.5
1.0
1.5
2.0
2.5
3.0
20
05
20
06
20
07
20
08
20
09
20
10
20
11
20
12
20
13
20
14
Nov.2
015
12
0
5
10
15
20
25
Sep
. 2009
Feb
. 2010
Jul.
2010
Dec
. 2010
May
. 2011
Oct
. 2011
Mar
. 2012
Aug. 2012
Jan. 2013
Jun. 2013
Nov. 2013
Apr.
2014
Sep
. 2014
Feb
. 2015
Jul.
2015
Dec
. 2015
Solvency ratio NPL ratio
percent
Note: Methodology changed in 2009
Source: NBR
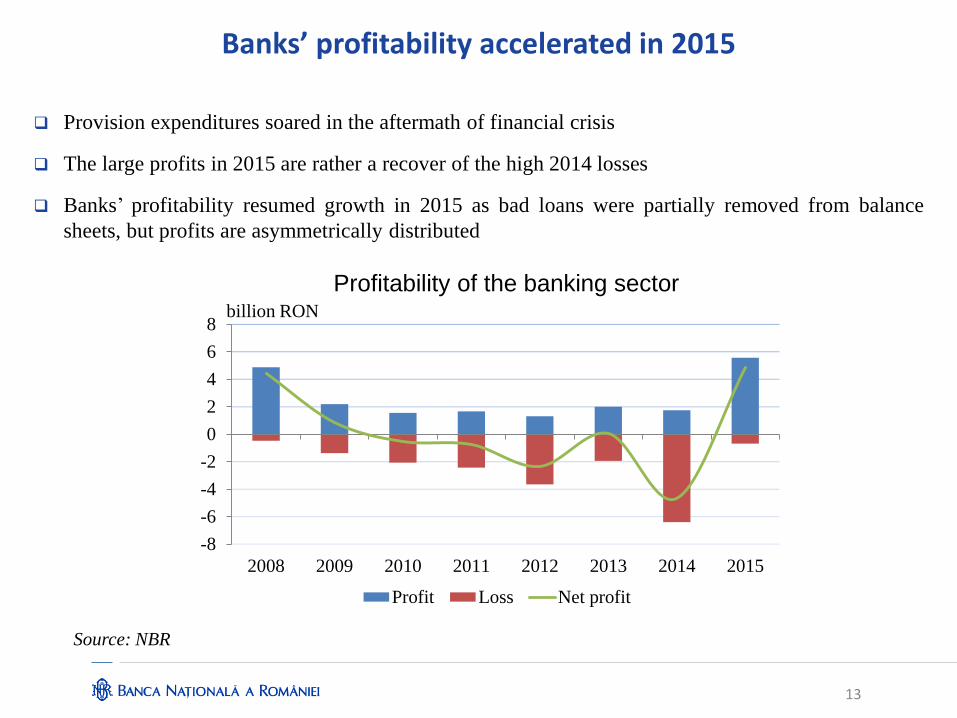
Banks’ profitability accelerated in 2015
Provision expenditures soared in the aftermath of financial crisis
The large profits in 2015 are rather a recover of the high 2014 losses
Banks’ profitability resumed growth in 2015 as bad loans were partially removed from balance
sheets, but profits are asymmetrically distributed
Profitability of the banking sector
Source: NBR
13
-8
-6
-4
-2
0
2
4
6
8
2008 2009 2010 2011 2012 2013 2014 2015
Profit Loss Net profit
billion RON
Main threat to financial stability: legislative
initiatives leading to uncertainty
• BNR defends price stability, financial stability, exchange rate stability
• Some legislative initiatives are aimed at changing terms of contracts already signed, creating instability and uncertainty.
• “Datio in solutum” law was approved by Parliament – then the President sent it to reexamination.
• The European Central Bank and the European Commission warned of threats to financial stability if this law is passed in its original form.
• BNR intervenes in this debate because it answers to the requests from the Presidency and Parliament.
• We are making proposals with the aim to answer the requests of the Presidency.
14
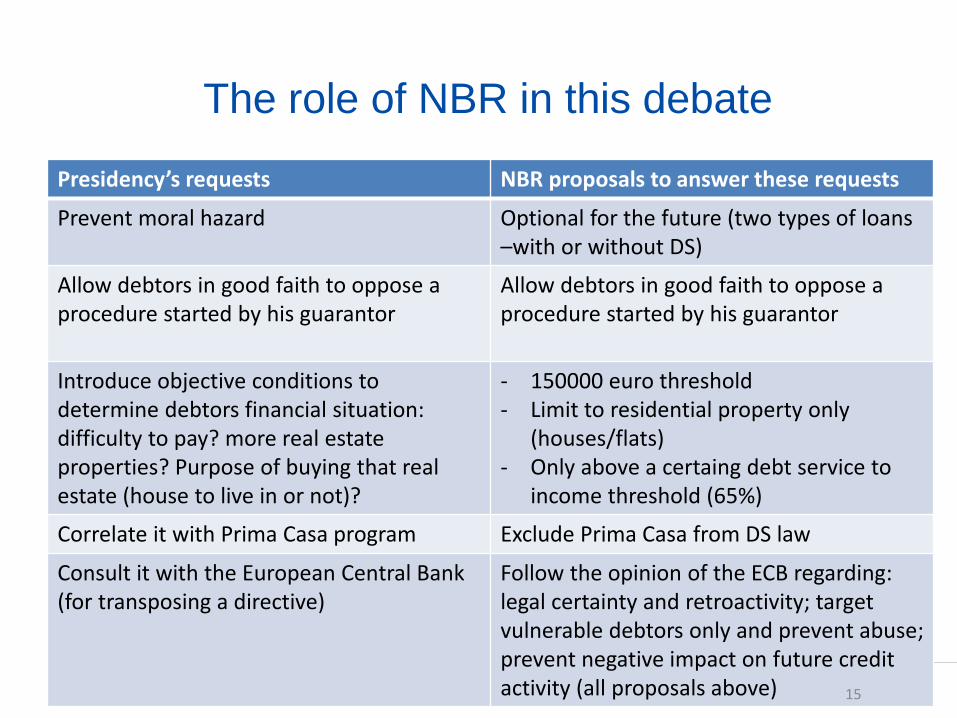
The role of NBR in this debate
Presidency’s requests NBR proposals to answer these requests
Prevent moral hazard Optional for the future (two types of loans –with or without DS)
Allow debtors in good faith to oppose a procedure started by his guarantor
Allow debtors in good faith to oppose a procedure started by his guarantor
Introduce objective conditions to determine debtors financial situation: difficulty to pay? more real estate properties? Purpose of buying that real estate (house to live in or not)?
- 150000 euro threshold - Limit to residential property only
(houses/flats) - Only above a certaing debt service to
income threshold (65%)
Correlate it with Prima Casa program Exclude Prima Casa from DS law
Consult it with the European Central Bank (for transposing a directive)
Follow the opinion of the ECB regarding: legal certainty and retroactivity; target vulnerable debtors only and prevent abuse; prevent negative impact on future credit activity (all proposals above) 15
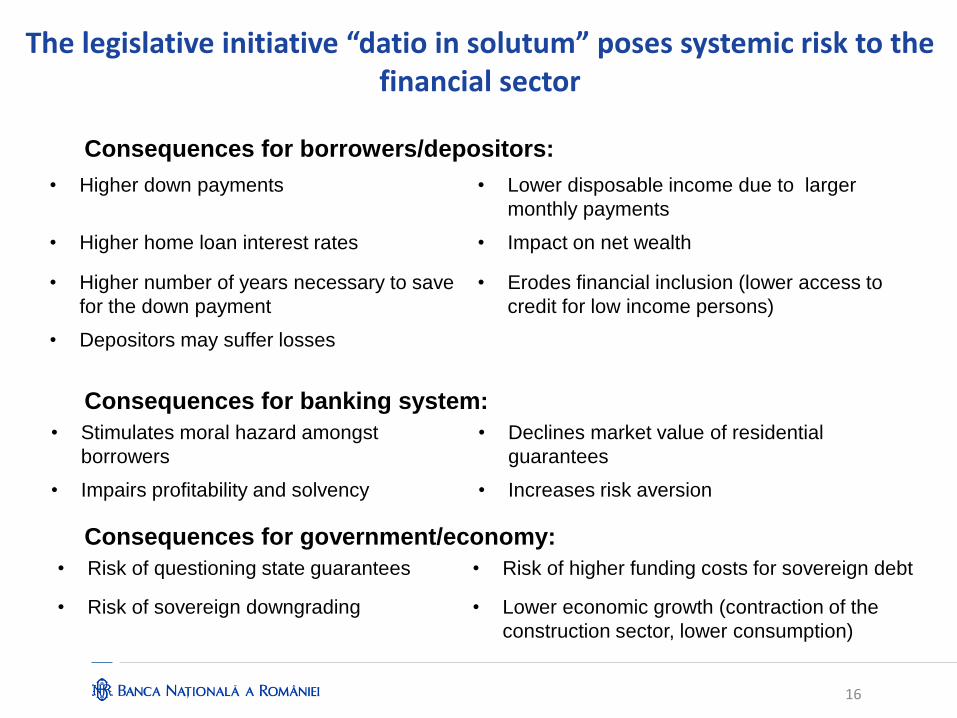
The legislative initiative “datio in solutum” poses systemic risk to the financial sector
Consequences for borrowers/depositors:
Consequences for banking system:
Consequences for government/economy:
• Higher down payments • Lower disposable income due to larger
monthly payments
• Higher home loan interest rates • Impact on net wealth
• Higher number of years necessary to save
for the down payment
• Erodes financial inclusion (lower access to
credit for low income persons)
• Depositors may suffer losses
• Stimulates moral hazard amongst
borrowers
• Declines market value of residential
guarantees
• Impairs profitability and solvency • Increases risk aversion
• Risk of questioning state guarantees • Risk of higher funding costs for sovereign debt
• Risk of sovereign downgrading • Lower economic growth (contraction of the
construction sector, lower consumption)
16
European Commission’s position
• Country Report Romania (26.2.2016) - risks from unwarranted legislative developments - DS: Not transposing Directive 17/2014 (voluntary vs. mandatory) - Major concern on retroactive applicability - Concern on wide applicability - Several provisions of the draft law, if applied without further
amendments, are likely to undermine payment discipline and investor sentiment going forward
- Impacts credit activity - Generate systemic risk - Challenge to financial stability • Communication from the Commission to European Parliament, Council,
ECB and Eurogroup (8.3.2016): - Banking sector is now well capitalized and liquid but several currently discussed legislative initiatives pose a risk to its stability.
17

The legislative initiative “datio in solutum” will deteriorate the access to credit
Number of years necessary to save
for the down payment Increase of monthly payments
Source: NBR
1.3
3.8
7.9
0
1
2
3
4
5
6
7
8
9
Prima Casa, down
payment=15%
Mortgage loan, down
payment=15%
Mortgage loan, down
payment=35%
number of years
679
807
978
1142
0
200
400
600
800
1000
1200
RON EUR RON EUR
Before After
RON
Note: results obtained for 2 person household, average
income, saving ratio=25%, house value=EUR 60,000,
residential price decline=10%
Note: results obtained for average loans, maturity=30
years, interest rate increase=150 b.p., maturity
decline=10 years
Source: NBR
18
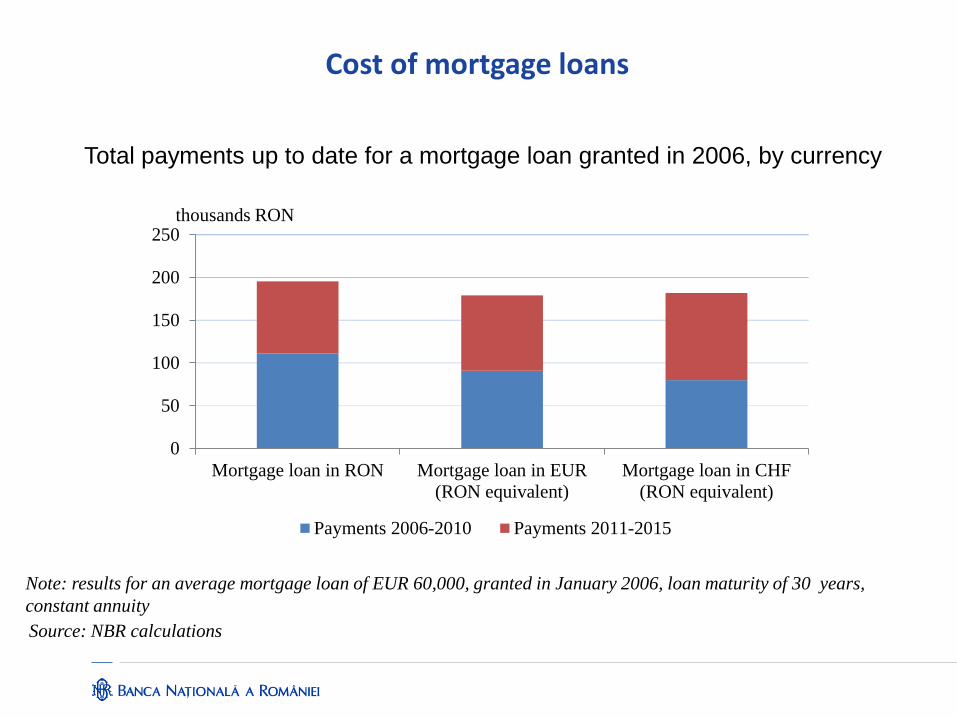
Total payments up to date for a mortgage loan granted in 2006, by currency
Note: results for an average mortgage loan of EUR 60,000, granted in January 2006, loan maturity of 30 years,
constant annuity
Cost of mortgage loans
Source: NBR calculations
0
50
100
150
200
250
Mortgage loan in RON Mortgage loan in EUR
(RON equivalent)
Mortgage loan in CHF
(RON equivalent)
Payments 2006-2010 Payments 2011-2015
thousands RON
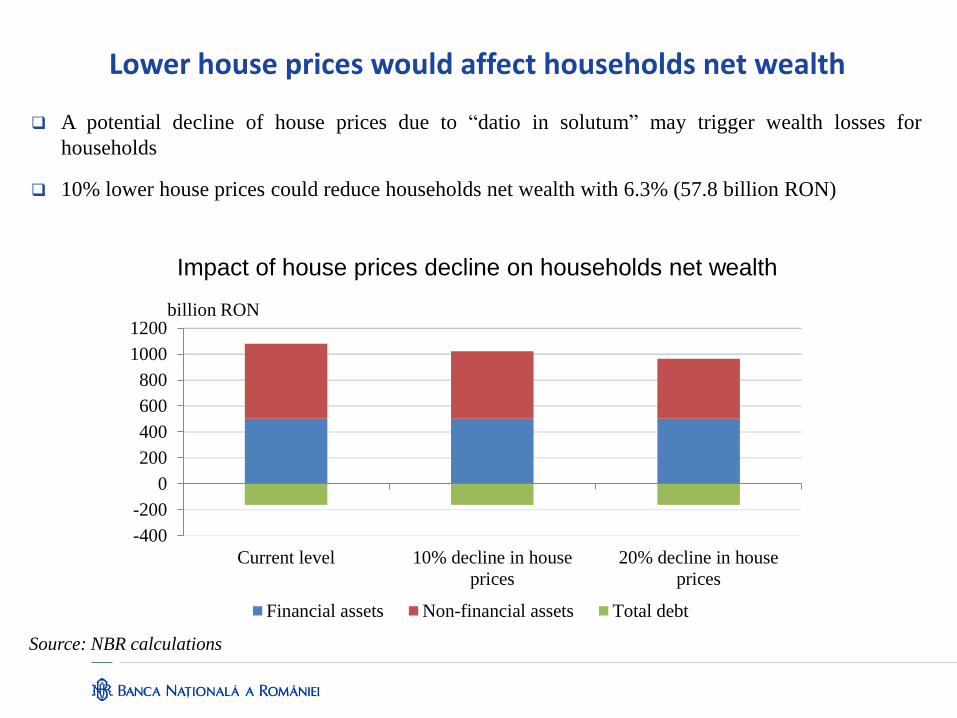
Impact of house prices decline on households net wealth
Lower house prices would affect households net wealth
Source: NBR calculations
-400
-200
0
200
400
600
800
1000
1200
Current level 10% decline in house
prices
20% decline in house
prices
Financial assets Non-financial assets Total debt
billion RON
A potential decline of house prices due to “datio in solutum” may trigger wealth losses for
households
10% lower house prices could reduce households net wealth with 6.3% (57.8 billion RON)
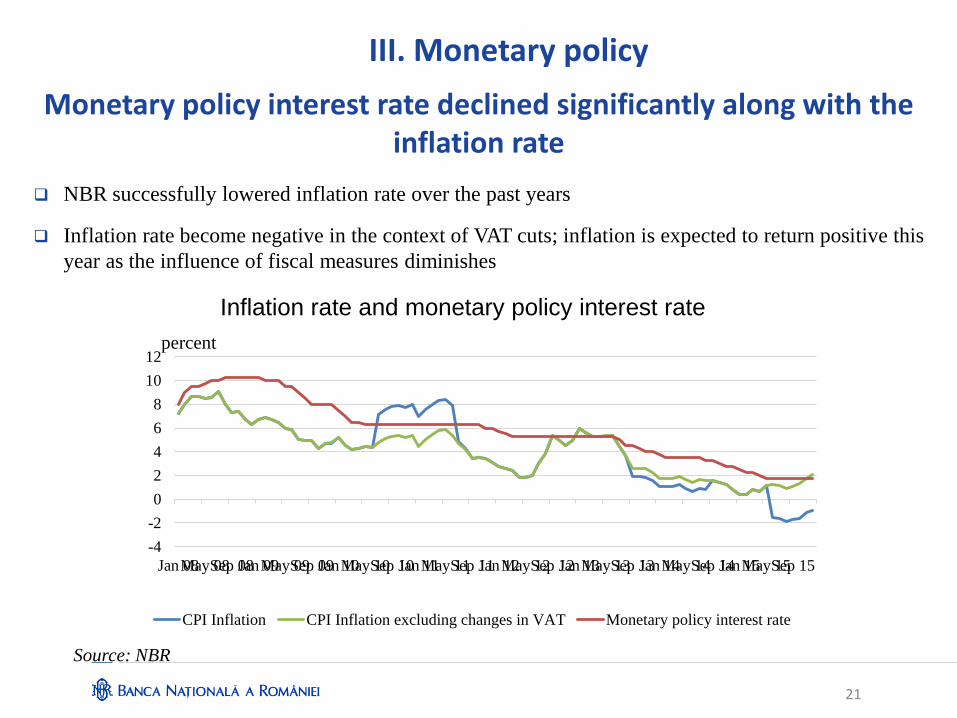
Monetary policy interest rate declined significantly along with the inflation rate
NBR successfully lowered inflation rate over the past years
Inflation rate become negative in the context of VAT cuts; inflation is expected to return positive this
year as the influence of fiscal measures diminishes
Inflation rate and monetary policy interest rate
Source: NBR
21
III. Monetary policy
-4
-2
0
2
4
6
8
10
12
Jan 08May 08Sep 08Jan 09May 09Sep 09Jan 10May 10Sep 10Jan 11May 11Sep 11Jan 12May 12Sep 12Jan 13May 13Sep 13Jan 14May 14Sep 14Jan 15May 15Sep 15
CPI Inflation CPI Inflation excluding changes in VAT Monetary policy interest rate
percent
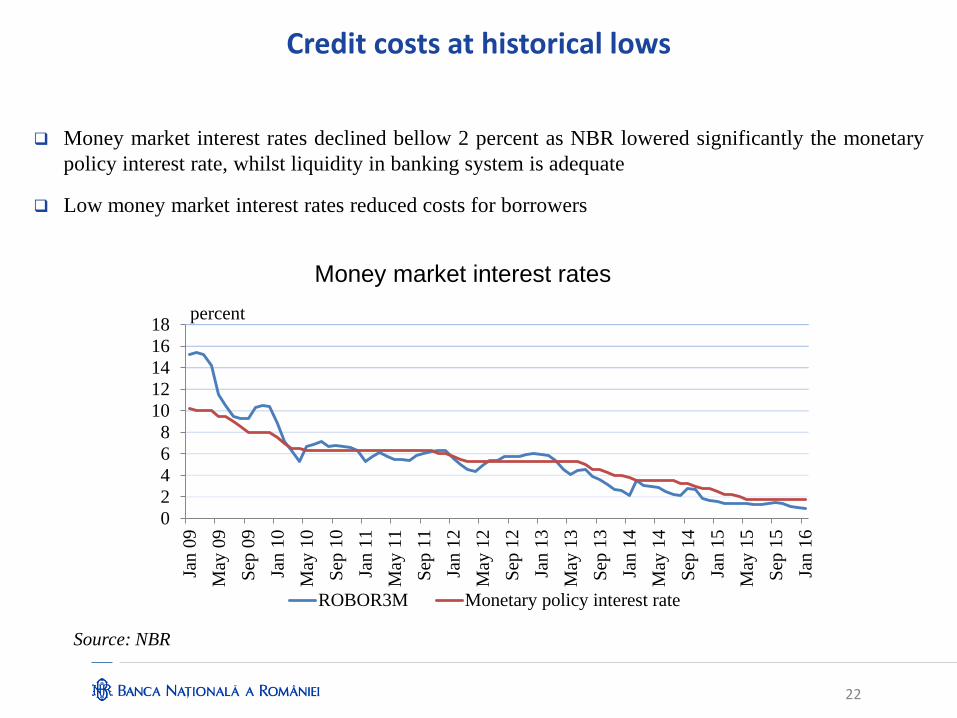
Credit costs at historical lows
Money market interest rates declined bellow 2 percent as NBR lowered significantly the monetary
policy interest rate, whilst liquidity in banking system is adequate
Low money market interest rates reduced costs for borrowers
Money market interest rates
Source: NBR
22
0
2
4
6
8
10
12
14
16
18
Jan
09
May
09
Sep
09
Jan
10
May
10
Sep
10
Jan
11
May
11
Sep
11
Jan
12
May
12
Sep
12
Jan
13
May
13
Sep
13
Jan
14
May
14
Sep
14
Jan
15
May
15
Sep
15
Jan
16
ROBOR3M Monetary policy interest rate
percent
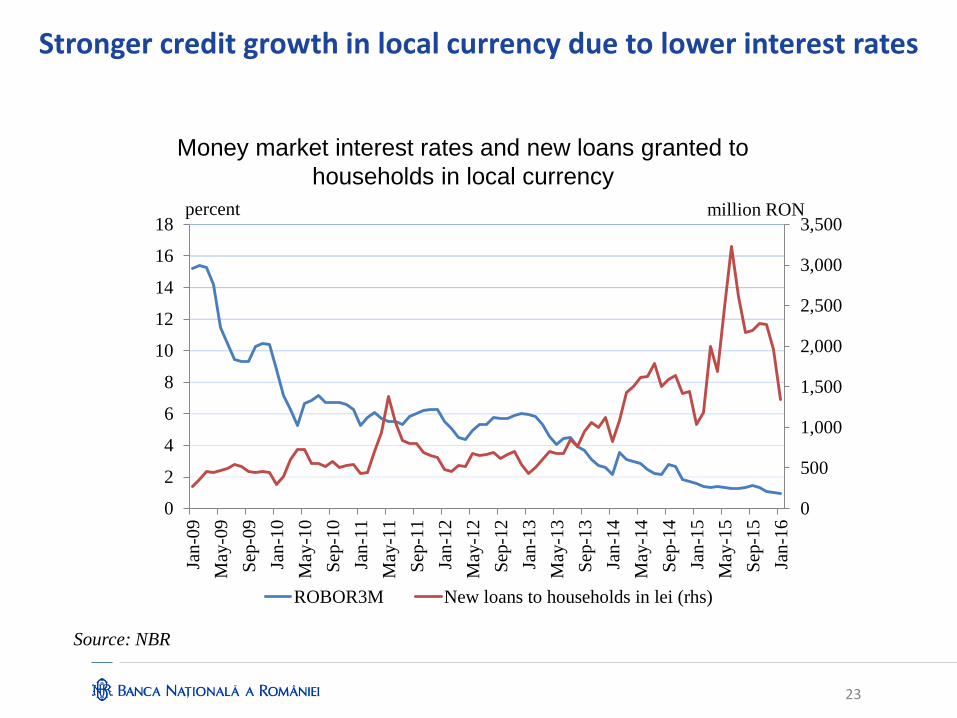
Stronger credit growth in local currency due to lower interest rates
Money market interest rates and new loans granted to
households in local currency
Source: NBR
23
0
500
1,000
1,500
2,000
2,500
3,000
3,500
0
2
4
6
8
10
12
14
16
18
Jan
-09
May
-09
Sep
-09
Jan
-10
May
-10
Sep
-10
Jan
-11
May
-11
Sep
-11
Jan
-12
May
-12
Sep
-12
Jan
-13
May
-13
Sep
-13
Jan
-14
May
-14
Sep
-14
Jan
-15
May
-15
Sep
-15
Jan
-16
ROBOR3M New loans to households in lei (rhs)
percent million RON
24
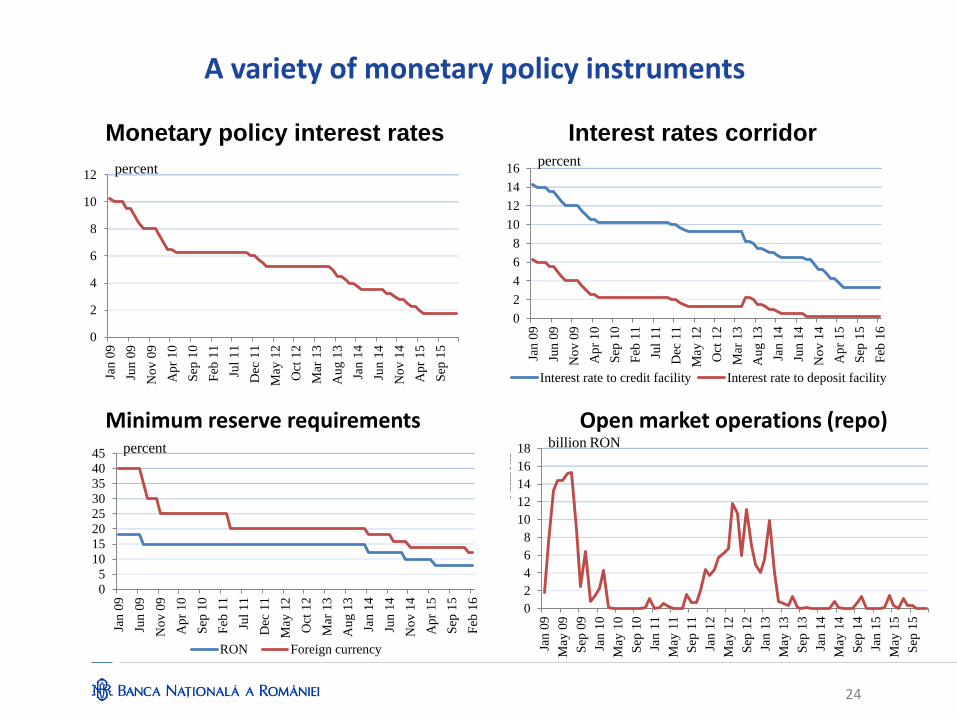
A variety of monetary policy instruments
Monetary policy interest rates
Interest rates corridor
Minimum reserve requirements
Open market operations (repo)
0
2
4
6
8
10
12
Jan
09
Jun
09
No
v 0
9
Ap
r 1
0
Sep
10
Feb
11
Jul
11
Dec
11
May
12
Oct
12
Mar
13
Au
g 1
3
Jan
14
Jun
14
No
v 1
4
Ap
r 1
5
Sep
15
percent
0
2
4
6
8
10
12
14
16
Jan
09
Jun
09
No
v 0
9
Ap
r 1
0
Sep
10
Feb
11
Jul
11
Dec
11
May
12
Oct
12
Mar
13
Au
g 1
3
Jan
14
Jun
14
No
v 1
4
Ap
r 1
5
Sep
15
Feb
16
Interest rate to credit facility Interest rate to deposit facility
percent
0
5
10
15
20
25
30
35
40
45
Jan
09
Jun
09
No
v 0
9
Ap
r 1
0
Sep
10
Feb
11
Jul
11
Dec
11
May
12
Oct
12
Mar
13
Au
g 1
3
Jan
14
Jun
14
No
v 1
4
Ap
r 1
5
Sep
15
Feb
16
RON Foreign currency
percent
0
2
4
6
8
10
12
14
16
18
Jan
09
May
09
Sep
09
Jan
10
May
10
Sep
10
Jan
11
May
11
Sep
11
Jan
12
May
12
Sep
12
Jan
13
May
13
Sep
13
Jan
14
May
14
Sep
14
Jan
15
May
15
Sep
15
Mil
lio
ns
billion RON
25
Challenges ahead
External challenges
• Brexit, refugees crisis and sluggish economic growth in the euro area increase
uncertainty in the EU
• Divergent monetary policy in the United States and the euro area pose risks to
emerging markets
• Low commodity prices: assimetric consequences for companies, households and
commodity producers
Domestic challenges
• Risk of policy reversal by pro-cyclical fiscal measures
• Legislative unpredictability

Thank you