Embed Size (px)
Citation preview

2/7/2019 Exhibit 140-1 FCIC-Appendix III LIVESTOCK GROSS MARGIN (LGM)
LIABILITY/PREMIUM CALCULATIONS Edit Description
Approved 140-1 - 1 RY 2017
Livestock Gross Margin (LGM) (Insurance Plan Code 82)
(Cattle and Swine) GROSS MARGIN GUARANTEE EXPECTED GROSS MARGIN = (TARGET_MARKET_2 * EXP_GROSS_MARGIN_2) + (Internal) (field 7) (field 37)
(TARGET_MARKET_3 * EXP_GROSS_MARGIN_3) + (TARGET_MARKET_4 * (field 8) (field 38) (field 9)
EXP_GROSS_MARGIN_4) + (TARGET_MARKET_5 * EXP_GROSS_MARGIN_5) + (field 39) (field 10) (field 40) (TARGET_MARKET_6 * EXP_GROSS_MARGIN_6) + (TARGET_MARKET_7 * (field 11) (field 41) (field 12) EXP_GROSS_MARGIN_7) + (TARGET_MARKET_8 * EXP_GROSS_MARGIN_8) + (field 42) (field 13) (field 43) (TARGET_MARKET_9 * EXP_GROSS_MARGIN_9) * (TARGET_MARKET_10 * (field 14) (field 44) (field 15) EXP_GROSS_MARGIN_10) + (TARGET_MARKET_11 * EXP_GROSS_MARGIN_11) (field 45) (field 16) (field 46) GROSS_MARGIN_GUAR = EXPECTED GROSS MARGIN - (DEDUCTIBLE * (field 48) (Internal) (field 47) TOTAL TARGET MARKETINGS) (Internal) Note: Gross margin guarantee can be negative. LIABILITY FOR CATTLE Yearling Finishing (Type 808): LIABILITY = AVG CME PRICE * 12.5 * TOTAL TARGET MARKETINGS (field 49) (Internal) (Internal) FOR CATTLE Calf Finishing (Type 807): LIABILITY = AVG CME PRICE * 11.5 * TOTAL TARGET MARKETINGS (field 49) (Internal) (Internal) FOR SWINE: LIABILITY = AVG CME PRICE * .74 * 2.6 * TOTAL TARGET MARKETINGS (field 49) (Internal) (Internal)

2/7/2019 Exhibit 140-1 FCIC-Appendix III LIVESTOCK GROSS MARGIN (LGM)
LIABILITY/PREMIUM CALCULATIONS Edit Description
Approved 140-1 - 2 RY 2017
SIMULATED LOSSES SIMULATED GROSS MARGINS(i) = (Internal) (SECOND MONTH GROSS MARGIN DRAW(i) * TARGET_MARKET_2) + (Internal) (field 7) (THIRD MONTH GROSS MARGIN DRAW(i) * TARGET_MARKET_3) + (Internal) (field 8) (FOURTH MONTH GROSS MARGIN DRAW(i) * TARGET_MARKET_4) + (Internal) (field 9) (FIFTH MONTH GROSS MARGIN DRAW(i) * TARGET_MARKET_5) + (Internal) (field 10) (SIXTH MONTH GROSS MARGIN DRAW(i) * TARGET_MARKET_6) + (Internal) (field 11) (SEVENTH MONTH GROSS MARGIN DRAW(i) * TARGET_MARKET_7) + (Internal) (field 12) (EIGHTH MONTH GROSS MARGIN DRAW(i) * TARGET_MARKET_8) + (Internal) (field 13) (NINTH MONTH GROSS MARGIN DRAW(i) * TARGET_MARKET_9) + (Internal) (field 14) (TENTH MONTH GROSS MARGIN DRAW(i) * TARGET_MARKET_10) + (Internal) (field 15) (ELEVENTH MONTH GROSS MARGIN DRAW(i) * TARGET_MARKET_11) (Internal) (field 16) Note: (i) = 1,2,…, 5000 SIMULATED_LOSSES = ∑ (MAX (GROSS_MARGIN_GUAR - SIMULATED GROSS MARGINS(i), 0)) (field 50) (field 48) (Internal) Note: Negative simulated gross margins will be included. TOTAL PREMIUM TOTAL_PREMIUM = 1.03 * (1/5,000) * SIMULATED_LOSSES (field 51) (field 50)

2/7/2019 Exhibit 140-1 FCIC-Appendix III LIVESTOCK GROSS MARGIN (LGM)
LIABILITY/PREMIUM CALCULATIONS Edit Description
Approved 140-1 - 3 RY 2017
PRODUCER PREMIUM PRODUCER_PREMIUM = TOTAL_PREMIUM (field 57) (field 51) Note: Subsidy not applicable for LGM. A&O EXPENSE SUBSIDY AOEXPENSE_SUBSIDY = TOTAL_PREMIUM * AOExpense Subsidy Percent (field 58) (field 51) (Internal)

2/7/2019 Exhibit 140-1 FCIC-Appendix III LIVESTOCK GROSS MARGIN (LGM)
LIABILITY/PREMIUM CALCULATIONS Edit Description
Approved 140-1 - 4 RY 2017
Tag
No.
Picture
Rounding
Description
<TARGET_MARKET_2>
7 9(06) whole number Number of swine or cattle the insured expects to market in the second month of the insurance period.
<EXP_GROSS_ MARGIN_2>
37 ( + / - ) 9(08).9999
per ADM Expected Gross Margin per swine or cattle for Second Month from A00600. Only the negative symbol ( - ) will appear if applicable.
<TARGET_MARKET_3>
8 9(06) whole number Number of swine or cattle the insured expects to market in the third month of the insurance period.
<EXP_GROSS_ MARGIN_3>
38 ( + / - ) 9(08).9999
per ADM
Expected Gross Margin per swine or cattle for Third Month from A00600. Only the negative symbol ( - ) will appear if applicable.
<TARGET_MARKET_4>
9 9(06) whole number Number of swine or cattle the insured expects to market in the fourth month of the insurance period.
<EXP_GROSS_ MARGIN_4>
39 ( + / - ) 9(08).9999
per ADM Expected Gross Margin per swine or cattle for Fourth Month from A00600. Only the negative symbol ( - ) will appear if applicable.
<TARGET_MARKET_5>
10 9(06) whole number Number of swine or cattle the insured expects to market in the fifth month of the insurance period.
<EXP_GROSS_ MARGIN_5>
40 ( + / - ) 9(08).9999
per ADM Expected Gross Margin per swine or cattle for Fifth Month from A00600. Only the negative symbol ( - ) will appear if applicable.
<TARGET_MARKET_6>
11 9(06) whole number Number of swine or cattle the insured expects to market in the sixth month of the insurance period.
<EXP_GROSS_ MARGIN_6>
41 ( + / - ) 9(08).9999
per ADM Expected Gross Margin per swine or cattle for Sixth Month from A00600. Only the negative symbol ( - ) will appear if applicable.
<TARGET_MARKET_7>
12 9(06) whole number Number of cattle the insured expects to market in the seventh month of the insurance period. Not applicable for swine.

2/7/2019 Exhibit 140-1 FCIC-Appendix III LIVESTOCK GROSS MARGIN (LGM)
LIABILITY/PREMIUM CALCULATIONS Edit Description
Approved 140-1 - 5 RY 2017
Tag
No.
Picture
Rounding
Description
<EXP_GROSS_ MARGIN_7>
42 ( + / - ) 9(08).9999
per ADM Expected Gross Margin per cattle for Seventh Month from A00600. Only the negative symbol ( - ) will appear if applicable. Not applicable for swine.
<TARGET_MARKET_8>
13 9(06) whole number Number of cattle the insured expects to market in the eighth month of the insurance period. Not applicable for swine.
<EXP_GROSS_ MARGIN_8>
43 ( + / - ) 9(08).9999
per ADM Expected Gross Margin per cattle for Eighth Month from A00600. Only the negative symbol ( - ) will appear if applicable. Not applicable for swine.
<TARGET_MARKET_9>
14 9(06) whole number Number of cattle the insured expects to market in the ninth month of the insurance period. Not applicable for swine.
<EXP_GROSS_ MARGIN_9>
44 ( + / - ) 9(08).9999
per ADM Expected Gross Margin per cattle for Ninth Month from A00600. Only the negative symbol ( - ) will appear if applicable. Not applicable for swine.
<TARGET_MARKET_10>
15 9(06) whole number Number of cattle the insured expects to market in the tenth month of the insurance period. Not applicable for swine.
<EXP_GROSS_ MARGIN_10>
45 ( + / - ) 9(08).9999
per ADM Expected Gross Margin per cattle for Tenth Month from A00600. Only the negative symbol ( - ) will appear if applicable. Not applicable for swine.
<TARGET_MARKET_11>
16 9(06) whole number Number of cattle the insured expects to market in the eleventh month of the insurance period. Not applicable for swine.
<EXP_GROSS_ MARGIN_11>
46 ( + / - ) 9(08).9999
per ADM Expected Gross Margin per cattle for Eleventh Month from A00600. Only the negative symbol ( - ) will appear if applicable. Not applicable for swine.
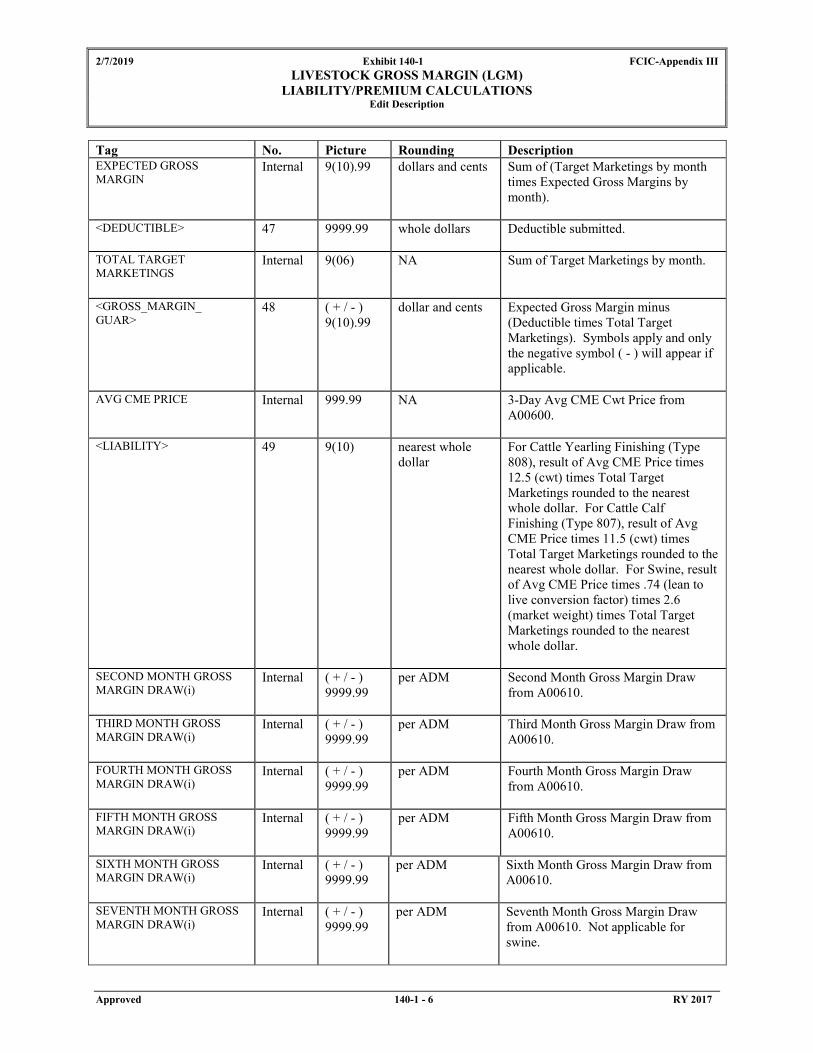
2/7/2019 Exhibit 140-1 FCIC-Appendix III LIVESTOCK GROSS MARGIN (LGM)
LIABILITY/PREMIUM CALCULATIONS Edit Description
Approved 140-1 - 6 RY 2017
Tag
No.
Picture
Rounding
Description
EXPECTED GROSS MARGIN
Internal 9(10).99 dollars and cents Sum of (Target Marketings by month times Expected Gross Margins by month).
<DEDUCTIBLE> 47 9999.99 whole dollars Deductible submitted.
TOTAL TARGET MARKETINGS
Internal 9(06) NA Sum of Target Marketings by month.
<GROSS_MARGIN_ GUAR>
48 ( + / - ) 9(10).99
dollar and cents Expected Gross Margin minus (Deductible times Total Target Marketings). Symbols apply and only the negative symbol ( - ) will appear if applicable.
AVG CME PRICE Internal 999.99 NA 3-Day Avg CME Cwt Price from A00600.
<LIABILITY>
49 9(10) nearest whole dollar
For Cattle Yearling Finishing (Type 808), result of Avg CME Price times 12.5 (cwt) times Total Target Marketings rounded to the nearest whole dollar. For Cattle Calf Finishing (Type 807), result of Avg CME Price times 11.5 (cwt) times Total Target Marketings rounded to the nearest whole dollar. For Swine, result of Avg CME Price times .74 (lean to live conversion factor) times 2.6 (market weight) times Total Target Marketings rounded to the nearest whole dollar.
SECOND MONTH GROSS MARGIN DRAW(i)
Internal ( + / - ) 9999.99
per ADM Second Month Gross Margin Draw from A00610.
THIRD MONTH GROSS MARGIN DRAW(i)
Internal ( + / - ) 9999.99
per ADM Third Month Gross Margin Draw from A00610.
FOURTH MONTH GROSS MARGIN DRAW(i)
Internal ( + / - ) 9999.99
per ADM Fourth Month Gross Margin Draw from A00610.
FIFTH MONTH GROSS MARGIN DRAW(i)
Internal ( + / - ) 9999.99
per ADM Fifth Month Gross Margin Draw from A00610.
SIXTH MONTH GROSS MARGIN DRAW(i)
Internal ( + / - ) 9999.99
per ADM Sixth Month Gross Margin Draw from A00610.
SEVENTH MONTH GROSS MARGIN DRAW(i)
Internal ( + / - ) 9999.99
per ADM Seventh Month Gross Margin Draw from A00610. Not applicable for swine.

2/7/2019 Exhibit 140-1 FCIC-Appendix III LIVESTOCK GROSS MARGIN (LGM)
LIABILITY/PREMIUM CALCULATIONS Edit Description
Approved 140-1 - 7 RY 2017
Tag
No.
Picture
Rounding
Description
EIGHTH MONTH GROSS MARGIN DRAW(i)
Internal ( + / - ) 9999.99
per ADM Eighth Month Gross Margin Draw from A00610. Not applicable for swine.
NINTH MONTH GROSS MARGIN DRAW(i)
Internal ( + / - ) 9999.99
per ADM Ninth Month Gross Margin Draw from A00610. Not applicable for swine.
TENTH MONTH GROSS MARGIN DRAW(i)
Internal ( + / - ) 9999.99
per ADM Tenth Month Gross Margin Draw from A00610. Not applicable for swine.
ELEVENTH MONTH GROSS MARGIN DRAW(i)
Internal ( + / - ) 9999.99
per ADM Eleventh Month Gross Margin Draw A00610. Not applicable for swine.
SIMULATED GROSS MARGINS(i)
Internal 9(10).99 dollars and cents Simulated Gross Margins(i) is the sum of (Gross Margin Draws(i) times Target Marketings by month).
<SIMULATED_ LOSSES>
50 9(12).99 dollars and cents Sum of (MAX (Gross Margin Guarantee minus Simulated Gross Margins(i)), 0).
<TOTAL_PREMIUM>
51 9(10) nearest whole dollar
The result of 1.03 times (1/5,000) times Simulated Losses.
<PRODUCER_PREMIUM>
57 9(10) nearest whole dollar
Producer Premium equals Total Premium.
AOExpense Subsidy Percent Internal .999 3 decimal places A&O Expense Subsidy Percent <AOEXPENSE_SUBSIDY>
58 9(10).99 Dollar and cents Total Premium multiplied by AOExpense Subsidy Percent.
Note: (i) = 1,2,…, 5000

2/7/2019 Exhibit 140-1 FCIC-Appendix III LIVESTOCK GROSS MARGIN (LGM)
LIABILITY/PREMIUM CALCULATIONS Edit Description
Approved 140-1 - 8 RY 2017
Livestock Gross Margin (LGM) (Insurance Plan Code 82)
(Dairy)
EXPECTED FEED COST EXPECTED FEED COST 2 = (CORN_EQUIVALENT_2 * (2000/56) * CORN PRICE 2) (Internal) (field 17) (Internal) + (SOYM_EQUIVALENT_2 * SOYBEAN MEAL PRICE 2) (field 27) (Internal) EXPECTED FEED COST 3 = (CORN_EQUIVALENT_3 * (2000/56) * CORN PRICE 3) (Internal) (field 18) (Internal) + (SOYM_EQUIVALENT_3 * SOYBEAN MEAL PRICE 3) (field 28) (Internal) EXPECTED FEED COST 4 = (CORN_EQUIVALENT_4 * (2000/56) * CORN PRICE 4) (Internal) (field 19) (Internal) + (SOYM_EQUIVALENT_4 * SOYBEAN MEAL PRICE 4) (field 29) (Internal) EXPECTED FEED COST 5 = (CORN_EQUIVALENT_5 * (2000/56) * CORN PRICE 5) (Internal) (field 20) (Internal) + (SOYM_EQUIVALENT_5 * SOYBEAN MEAL PRICE 5) (field 30) (Internal) EXPECTED FEED COST 6 = (CORN_EQUIVALENT_6 * (2000/56) * CORN PRICE 6) (Internal) (field 21) (Internal) + (SOYM_EQUIVALENT_6 * SOYBEAN MEAL PRICE 6) (field 31) (Internal) EXPECTED FEED COST 7 = (CORN_EQUIVALENT_7 * (2000/56) * CORN PRICE 7) (Internal) (field 22) (Internal) + (SOYM_EQUIVALENT_7 * SOYBEAN MEAL PRICE 7) (field 32) (Internal) EXPECTED FEED COST 8 = (CORN_EQUIVALENT_8 * (2000/56) * CORN PRICE 8) (Internal) (field 23) (Internal) + (SOYM_EQUIVALENT_8 * SOYBEAN MEAL PRICE 8) (field 33) (Internal)

2/7/2019 Exhibit 140-1 FCIC-Appendix III LIVESTOCK GROSS MARGIN (LGM)
LIABILITY/PREMIUM CALCULATIONS Edit Description
Approved 140-1 - 9 RY 2017
EXPECTED FEED COST 9 = (CORN_EQUIVALENT_9 * (2000/56) * CORN PRICE 9) (Internal) (field 24) (Internal) + (SOYM_EQUIVALENT_9 * SOYBEAN MEAL PRICE 9) (field 34) (Internal) EXPECTED FEED COST 10 = (CORN_EQUIVALENT_10 * (2000/56) * CORN PRICE 10) (Internal) (field 25) (Internal) + (SOYM_EQUIVALENT_10 * SOYBEAN MEAL PRICE 10) (field 35) (Internal) EXPECTED FEED COST 11 = (CORN_EQUIVALENT_11 * (2000/56) * CORN PRICE 11) (Internal) (field 26) (Internal) + (SOYM_EQUIVALENT_11 * SOYBEAN MEAL PRICE 11) (field 36) (Internal) GROSS MARGIN GUARANTEE EXP_GROSS_ MARGIN_2 = TARGET_MARKET_2 * MILK PRICE 2 - EXPECTED FEED COST 2 (field 37) (field 7) (Internal) (Internal) EXP_GROSS_MARGIN_3 = TARGET_MARKET_3 * MILK PRICE 3 - EXPECTED FEED COST 3
(field 38) (field 8) (Internal) (Internal) EXP_GROSS_MARGIN_4 = TARGET_MARKET_4 * MILK PRICE 4 - EXPECTED FEED COST 4
(field 39) (field 9) (Internal) (Internal)
EXP_GROSS_MARGIN_5 = TARGET_MARKET_5 * MILK PRICE 5 - EXPECTED FEED COST 5 (field 40) (field 10) (Internal) (Internal)
EXP_GROSS_MARGIN_6 = TARGET_MARKET_6 * MILK PRICE 6 - EXPECTED FEED COST 6
(field 41) (field 11) (Internal) (Internal) EXP_GROSS_MARGIN_7 = TARGET_MARKET_7 * MILK PRICE 7 - EXPECTED FEED COST 7
(field 42) (field 12) (Internal) (Internal)

2/7/2019 Exhibit 140-1 FCIC-Appendix III LIVESTOCK GROSS MARGIN (LGM)
LIABILITY/PREMIUM CALCULATIONS Edit Description
Approved 140-1 - 10 RY 2017
EXP_GROSS_MARGIN_8 = TARGET_MARKET_8 * MILK PRICE 8 - EXPECTED FEED COST 8
(field 43) (field 13) (Internal) (Internal) EXP_GROSS_MARGIN_9 = TARGET_MARKET_9 * MILK PRICE 9 - EXPECTED FEED COST 9
(field 44) (field 14) (Internal) (Internal) EXP_GROSS_MARGIN_10 = TARGET_MARKET_10 * MILK PRICE 10 - EXPECTED FEED COST 10
(field 45) (field 15) (Internal) (Internal) EXP_GROSS_MARGIN_11 = TARGET_MARKET_11 * MILK PRICE 11 - EXPECTED FEED COST 11 (field 46) (field 16) (Internal) (Internal) EXPECTED GROSS MARGIN = ∑ (EXP_GROSS_MARGIN 2 thru 11) (Internal) GROSS_MARGIN_GUAR = EXPECTED GROSS MARGIN - (DEDUCTIBLE * (field 48) (Internal) (field 47) TOTAL TARGET MARKETINGS) (Internal) LIABILITY LIABILITY = LIABILITY MILK PRICE * TOTAL TARGET MARKETINGS (field 49) (Internal) (Internal)

2/7/2019 Exhibit 140-1 FCIC-Appendix III LIVESTOCK GROSS MARGIN (LGM)
LIABILITY/PREMIUM CALCULATIONS Edit Description
Approved 140-1 - 11 RY 2017
FEED COST DRAWS FEED COST DRAW 2 = (CORN_EQUIVALENT_2 * (2000/56) * CORN DRAW 2(i)) (Internal) (field 17) (Internal) + (SOYM_EQUIVALENT_2 * SOYBEAN MEAL DRAW 2(i)) (field 27) (Internal) FEED COST DRAW 3 = (CORN_EQUIVALENT_3 * (2000/56) * CORN DRAW 3(i)) (Internal) (field 18) (Internal) + (SOYM_EQUIVALENT_3 * SOYBEAN MEAL DRAW 3(i)) (field 28) (Internal) FEED COST DRAW 4 = (CORN_EQUIVALENT_4 * (2000/56) * CORN DRAW 4(i)) (Internal) (field 19) (Internal) + (SOYM_EQUIVALENT_4 * SOYBEAN MEAL DRAW 4(i)) (field 29) (Internal) FEED COST DRAW 5 = (CORN_EQUIVALENT_5 * (2000/56) * CORN DRAW 5(i)) (Internal) (field 20) (Internal) + (SOYM_EQUIVALENT_5 * SOYBEAN MEAL DRAW 5(i)) (field 30) (Internal) FEED COST DRAW 6 = (CORN_EQUIVALENT_6 * (2000/56) * CORN DRAW 6(i)) (Internal) (field 21) (Internal) + (SOYM_EQUIVALENT_6 * SOYBEAN MEAL DRAW 6(i)) (field 31) (Internal) FEED COST DRAW 7 = (CORN_EQUIVALENT_7 * (2000/56) * CORN DRAW 7(i)) (Internal) (field 22) (Internal) + (SOYM_EQUIVALENT_7 * SOYBEAN MEAL DRAW 7(i)) (field 32) (Internal) FEED COST DRAW 8 = (CORN_EQUIVALENT_8 * (2000/56) * CORN DRAW 8(i)) (Internal) (field 23) (Internal) + (SOYM_EQUIVALENT_8 * SOYBEAN MEAL DRAW 8(i)) (field 33) (Internal)
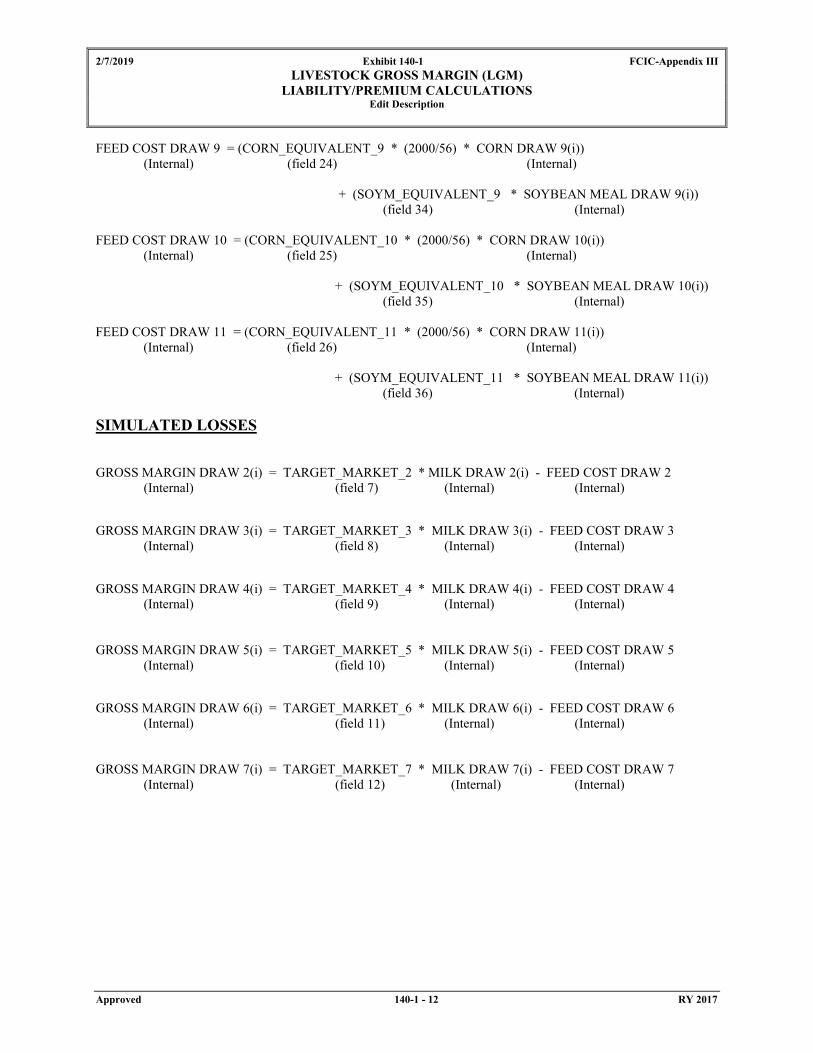
2/7/2019 Exhibit 140-1 FCIC-Appendix III LIVESTOCK GROSS MARGIN (LGM)
LIABILITY/PREMIUM CALCULATIONS Edit Description
Approved 140-1 - 12 RY 2017
FEED COST DRAW 9 = (CORN_EQUIVALENT_9 * (2000/56) * CORN DRAW 9(i)) (Internal) (field 24) (Internal) + (SOYM_EQUIVALENT_9 * SOYBEAN MEAL DRAW 9(i)) (field 34) (Internal) FEED COST DRAW 10 = (CORN_EQUIVALENT_10 * (2000/56) * CORN DRAW 10(i)) (Internal) (field 25) (Internal) + (SOYM_EQUIVALENT_10 * SOYBEAN MEAL DRAW 10(i)) (field 35) (Internal) FEED COST DRAW 11 = (CORN_EQUIVALENT_11 * (2000/56) * CORN DRAW 11(i)) (Internal) (field 26) (Internal) + (SOYM_EQUIVALENT_11 * SOYBEAN MEAL DRAW 11(i)) (field 36) (Internal) SIMULATED LOSSES GROSS MARGIN DRAW 2(i) = TARGET_MARKET_2 * MILK DRAW 2(i) - FEED COST DRAW 2 (Internal) (field 7) (Internal) (Internal) GROSS MARGIN DRAW 3(i) = TARGET_MARKET_3 * MILK DRAW 3(i) - FEED COST DRAW 3 (Internal) (field 8) (Internal) (Internal) GROSS MARGIN DRAW 4(i) = TARGET_MARKET_4 * MILK DRAW 4(i) - FEED COST DRAW 4 (Internal) (field 9) (Internal) (Internal) GROSS MARGIN DRAW 5(i) = TARGET_MARKET_5 * MILK DRAW 5(i) - FEED COST DRAW 5 (Internal) (field 10) (Internal) (Internal) GROSS MARGIN DRAW 6(i) = TARGET_MARKET_6 * MILK DRAW 6(i) - FEED COST DRAW 6 (Internal) (field 11) (Internal) (Internal) GROSS MARGIN DRAW 7(i) = TARGET_MARKET_7 * MILK DRAW 7(i) - FEED COST DRAW 7 (Internal) (field 12) (Internal) (Internal)

2/7/2019 Exhibit 140-1 FCIC-Appendix III LIVESTOCK GROSS MARGIN (LGM)
LIABILITY/PREMIUM CALCULATIONS Edit Description
Approved 140-1 - 13 RY 2017
GROSS MARGIN DRAW 8(i) = TARGET_MARKET_8 * MILK DRAW 8(i) - FEED COST DRAW 8 (Internal) (field 13) (Internal) (Internal) GROSS MARGIN DRAW 9(i) = TARGET_MARKET_9 * MILK DRAW 9(i) - FEED COST DRAW 9 (Internal) (field 14) (Internal) (Internal) GROSS MARGIN DRAW 10(i) = TARGET_MARKET_10 * MILK DRAW 10(i) - FEED COST DRAW 10 (Internal) (field 15) (Internal) (Internal) GROSS MARGIN DRAW 11(i) = TARGET_MARKET_11 * MILK DRAW 11(i) - FEED COST DRAW 11 (Internal) (field 16) (Internal) (Internal) SIMULATED GROSS MARGIN(i) = ∑ (GROSS MARGIN DRAW 2 thru 11) (Internal) (Internal) SIMULATED_LOSSES(i) = ∑ (MAX (GROSS_MARGIN_GUAR - SIMULATED GROSS MARGINS(i), 0)) (field 50) (field 48) (Internal) Note: Negative simulated gross margins will be included. TOTAL PREMIUM TOTAL_PREMIUM = 1.03 * (1/5,000) * SIMULATED_LOSSES(i) (field 51) (field 50) PRODUCER PREMIUM SUBSIDY = TOTAL_PREMIUM * Subsidy Factor (field 52) (field 51) (Internal*) PRODUCER_PREMIUM = TOTAL_PREMIUM - SUBSIDY (field 57) (field 51) (field 52) Note: Subsidy based on number of months and deductible. Subsidy not applicable for other LGM commodities. BEGINNING FARMER AND RANCHER (BFR) SUBSIDY CALCULATIONS Base Subsidy = TOTAL_PREMIUM * Subsidy Factor (Internal) (field 51) (Internal*) BFR_SUBSIDY = TOTAL_PREMIUM * 0.10 (field 59) (field 51) SUBSIDY = Base Subsidy + BFR_SUBSIDY (field 52) (Internal) (field 59)

2/7/2019 Exhibit 140-1 FCIC-Appendix III LIVESTOCK GROSS MARGIN (LGM)
LIABILITY/PREMIUM CALCULATIONS Edit Description
Approved 140-1 - 14 RY 2017
PRODUCER_PREMIUM = TOTAL_PREMIUM - SUBSIDY (field 57) (field 51) (field 52) CONSERVATION COMPLIANCE SUBSIDY CALCULATIONS Base Subsidy = TOTAL_PREMIUM * Subsidy Factor (Internal) (field 20) (Internal*) CC_SUB_RED_AMT = Base Subsidy Amount * CC_SUB_RED_PCT (field 61) (Internal) (field 60) SUBSIDY = Base Subsidy - CC_SUB_RED_AMT (field 21) (Internal) (field 61) PRODUCER_PREMIUM = TOTAL_PREMIUM - SUBSIDY (field 26) (field 20) (field 21) CONSERVATION COMPLIANCE/BEGINNING FARMER RANCHER SUBSIDY CALCULATIONS Base Subsidy = TOTAL_PREMIUM * Subsidy Factor (Internal) (field 20) (Internal*) CC_SUB_RED_AMT = Base Subsidy Amount * CC_SUB_RED_PCT (field 61) (Internal) (field 60) BFR_SUBSIDY = TOTAL_PREMIUM * 0.10 * (1 - CC_SUB_RED_PCT) (field 28) (field 20) (field 60) SUBSIDY = Base Subsidy + BFR_SUBSIDY - CC_SUB_RED_AMT (field 21) (Internal) (field 28) (field 61) PRODUCER_PREMIUM = TOTAL_PREMIUM - SUBSIDY (field 26) (field 20) (field 21) A&O EXPENSE SUBSIDY AOEXPENSE_SUBSIDY = TOTAL_PREMIUM * AOExpense Subsidy Percent (field 58) (field 51) (Internal)

2/7/2019 Exhibit 140-1 FCIC-Appendix III LIVESTOCK GROSS MARGIN (LGM)
LIABILITY/PREMIUM CALCULATIONS Edit Description
Approved 140-1 - 15 RY 2017
Tag No.
Picture
Rounding
Description
CORN PRICE (2 thru 11) Internal 999.99 per ADM From A00600.
SOYBEAN MEAL PRICE (2 thru 11)
Internal 999.99 per ADM From A00600.
EXPECTED FEED COST (2 thru 11)
Internal ( + / - ) 9999.99
dollars and cents Expected Feed Cost is the result of (corn equivalent times (2000/56) times corn price) plus (soybean meal equivalent times soybean meal price) by month.
<CORN_EQUIVALENT_2> 17 9999.9(06) NA Corn or corn equivalent in tons that the insured expects to feed in the second month of the insurance period.
<SOYM_EQUIVALENT_2> 27 9999.9(06) NA Soybean Meal or soybean meal equivalent in tons that the insured expects to feed in the second month of the insurance period.
<CORN_EQUIVALENT_3> 18 9999.9(06) NA Corn or corn equivalent in tons that the insured expects to feed in the third month of the insurance period.
<SOYM_EQUIVALENT_3> 28 9999.9(06) NA Soybean Meal or soybean meal equivalent in tons that the insured expects to feed in the third month of the insurance period.
<CORN_EQUIVALENT_4> 19 9999.9(06) NA Corn or corn equivalent in tons that the insured expects to feed in the fourth month of the insurance period.
<SOYM_EQUIVALENT_4> 29 999.9(06) NA Soybean Meal or soybean meal equivalent in tons that the insured expects to feed in the fourth month of the insurance period.
<CORN_EQUIVALENT_5> 20 9999.9(06) NA Corn or corn equivalent in tons that the insured expects to feed in the fifth month of the insurance period.
2/7/2019 Exhibit 140-1 FCIC-Appendix III LIVESTOCK GROSS MARGIN (LGM)
LIABILITY/PREMIUM CALCULATIONS Edit Description
Approved 140-1 - 16 RY 2017
Tag No.
Picture
Rounding
Description
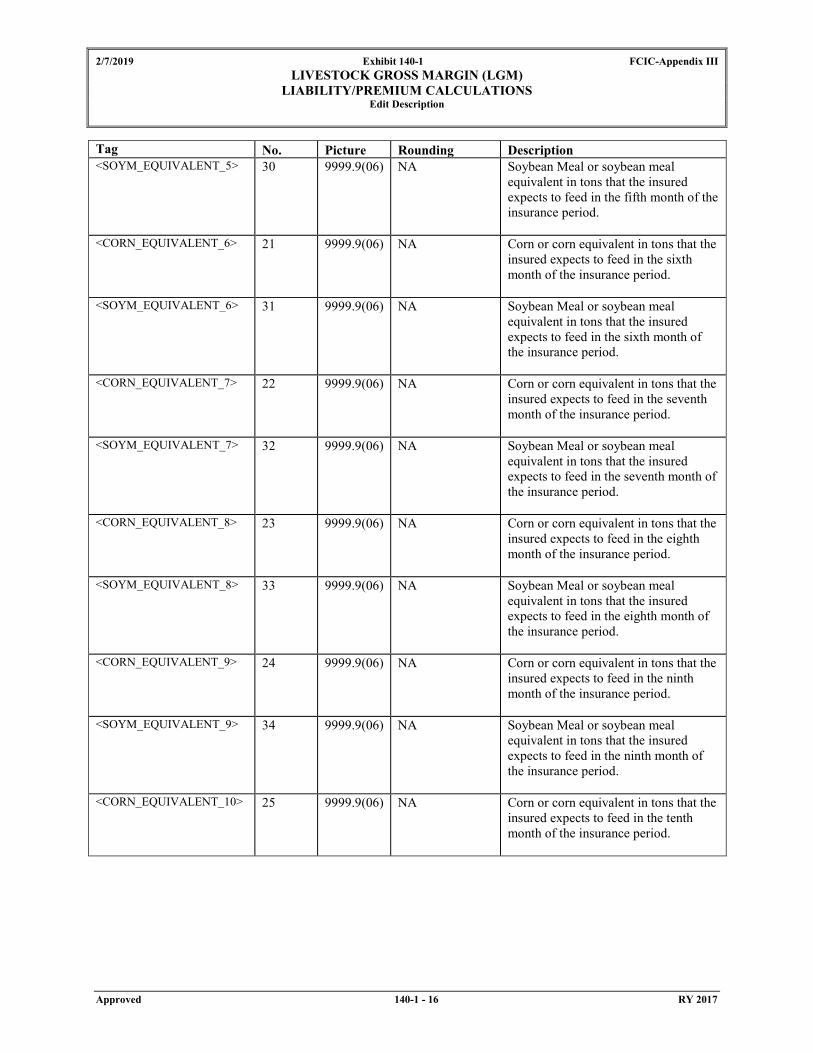
<SOYM_EQUIVALENT_5> 30 9999.9(06) NA Soybean Meal or soybean meal equivalent in tons that the insured expects to feed in the fifth month of the insurance period.
<CORN_EQUIVALENT_6> 21 9999.9(06) NA Corn or corn equivalent in tons that the insured expects to feed in the sixth month of the insurance period.
<SOYM_EQUIVALENT_6> 31 9999.9(06) NA Soybean Meal or soybean meal equivalent in tons that the insured expects to feed in the sixth month of the insurance period.
<CORN_EQUIVALENT_7> 22 9999.9(06) NA Corn or corn equivalent in tons that the insured expects to feed in the seventh month of the insurance period.
<SOYM_EQUIVALENT_7> 32 9999.9(06) NA Soybean Meal or soybean meal equivalent in tons that the insured expects to feed in the seventh month of the insurance period.
<CORN_EQUIVALENT_8> 23 9999.9(06) NA Corn or corn equivalent in tons that the insured expects to feed in the eighth month of the insurance period.
<SOYM_EQUIVALENT_8> 33 9999.9(06) NA Soybean Meal or soybean meal equivalent in tons that the insured expects to feed in the eighth month of the insurance period.
<CORN_EQUIVALENT_9> 24 9999.9(06) NA Corn or corn equivalent in tons that the insured expects to feed in the ninth month of the insurance period.
<SOYM_EQUIVALENT_9> 34 9999.9(06) NA Soybean Meal or soybean meal equivalent in tons that the insured expects to feed in the ninth month of the insurance period.
<CORN_EQUIVALENT_10> 25 9999.9(06) NA Corn or corn equivalent in tons that the insured expects to feed in the tenth month of the insurance period.

2/7/2019 Exhibit 140-1 FCIC-Appendix III LIVESTOCK GROSS MARGIN (LGM)
LIABILITY/PREMIUM CALCULATIONS Edit Description
Approved 140-1 - 17 RY 2017
Tag No.
Picture
Rounding
Description
<SOYM_EQUIVALENT_10> 35 9999.9(06) NA Soybean Meal or soybean meal equivalent in tons that the insured expects to feed in the tenth month of the insurance period.
<CORN_EQUIVALENT_11> 26 9999.9(06) NA Corn or corn equivalent in tons that the insured expects to feed in the eleventh month of the insurance period.
<SOYM_EQUIVALENT_11> 36 9999.9(06) NA Soybean Meal or soybean meal equivalent in tons that the insured expects to feed in the eleventh month of the insurance period.
MILK PRICE (2 thru 11) Internal 999.99 per ADM From A00600.
<TARGET_MARKET_2>
7 9(06) whole number Hundredweight (CWT) of milk for dairy the insured expects to market in the second month of the insurance period.
<EXP_GROSS_ MARGIN_2>
37 ( + / - ) 9(08).9999
dollars and cents Expected Gross Margin for dairy is the result of target marketings times milk price minus expected feed cost for the second month. Only the negative symbol ( - ) will appear if applicable.
<TARGET_MARKET_3>
8 9(06) whole number Hundredweight (CWT) of milk for dairy insured expects to market in the third month of the insurance period.
<EXP_GROSS_ MARGIN_3>
38 ( + / - ) 9(08).9999
dollars and cents Expected Gross Margin for dairy is the result of target marketings times milk price minus expected feed cost for the third month. Only the negative symbol ( - ) will appear if applicable.
<TARGET_MARKET_4>
9 9(06) whole number Hundredweight (CWT) of milk for dairy the insured expects to market in the fourth month of the insurance period.

2/7/2019 Exhibit 140-1 FCIC-Appendix III LIVESTOCK GROSS MARGIN (LGM)
LIABILITY/PREMIUM CALCULATIONS Edit Description
Approved 140-1 - 18 RY 2017
Tag No.
Picture
Rounding
Description
<EXP_GROSS_ MARGIN_4>
39 ( + / - ) 9(08).9999
dollars and cents Expected Gross Margin for dairy is the result of target marketings times milk price minus expected feed cost for the fourth month. Only the negative symbol ( - ) will appear if applicable.
<TARGET_MARKET_5>
10 9(06) whole number Hundredweight (CWT) of milk for dairy the insured expects to market in the fifth month of the insurance period.
<EXP_GROSS_ MARGIN_5>
40 ( + / - ) 9(08).9999
dollars and cents Expected Gross Margin for dairy is the result of target marketings times milk price minus expected feed cost for the fifth month. Only the negative symbol ( - ) will appear if applicable.
<TARGET_MARKET_6>
11 9(06) whole number Hundredweight (CWT) of milk for dairy the insured expects to market in the sixth month of the insurance period.
<EXP_GROSS_ MARGIN_6>
41 ( + / - ) 9(08).9999
dollars and cents Expected Gross Margin for dairy is the result of target marketings times milk price minus expected feed cost for the sixth month. Only the negative symbol ( - ) will appear if applicable.
<TARGET_MARKET_7>
12 9(06) whole number Hundredweight (CWT) of milk for dairy the insured expects to market in the seventh month of the insurance period.
<EXP_GROSS_ MARGIN_7>
42 ( + / - ) 9(08).9999
dollars and cents Expected Gross Margin for dairy is the result of target marketings times milk price minus expected feed cost for the seventh month. Only the negative symbol ( - ) will appear if applicable.
<TARGET_MARKET_8>
13 9(06) whole number Hundredweight (CWT) of milk for dairy the insured expects to market in the eighth month of the insurance period.

2/7/2019 Exhibit 140-1 FCIC-Appendix III LIVESTOCK GROSS MARGIN (LGM)
LIABILITY/PREMIUM CALCULATIONS Edit Description
Approved 140-1 - 19 RY 2017
Tag No. Picture Rounding Description <EXP_GROSS_ MARGIN_8>
43 ( + / - ) 9(08).9999
dollars and cents Expected Gross Margin for dairy is the result of target marketings times milk price minus expected feed cost for the eighth month. Only the negative symbol ( - ) will appear if applicable.
<TARGET_MARKET_9>
14 9(06) whole number Hundredweight (CWT) of milk for dairy the insured expects to market in the ninth month of the insurance period.
<EXP_GROSS_ MARGIN_9>
44 ( + / - ) 9(08).9999
dollars and cents Expected Gross Margin for dairy is the result of target marketings times milk price minus expected feed cost for the ninth month. Only the negative symbol ( - ) will appear if applicable.
<TARGET_MARKET_10>
15 9(06) whole number Hundredweight (CWT) of milk for dairy the insured expects to market in the tenth month of the insurance period.
<EXP_GROSS_ MARGIN_10>
45 ( + / - ) 9(08).9999
dollars and cents Expected Gross Margin for dairy is the result of target marketings times milk price minus expected feed cost for the tenth month. Only the negative symbol ( - ) will appear if applicable.
<TARGET_MARKET_11>
16 9(06) whole number Hundredweight (CWT) of milk for dairy the insured expects to market in the eleventh month of the insurance period.
<EXP_GROSS_ MARGIN_11>
46 ( + / - ) 9(08).9999
dollars and cents Expected Gross Margin for dairy is the result of target marketings times milk price minus expected feed cost for the eleventh month. Only the negative symbol ( - ) will appear if applicable.
EXPECTED GROSS MARGIN
Internal 9(10).99 dollars and cents Sum of Expected Gross Margins 2 thru 11.
<DEDUCTIBLE> 47 9999.99 dollar and cents Deductible submitted.
TOTAL TARGET MARKETINGS
Internal 9(06) NA Sum of Target Marketings by month.

2/7/2019 Exhibit 140-1 FCIC-Appendix III LIVESTOCK GROSS MARGIN (LGM)
LIABILITY/PREMIUM CALCULATIONS Edit Description
Approved 140-1 - 20 RY 2017
Tag No. Picture Rounding Description <GROSS_MARGIN_ GUAR>
48 ( + / - ) 9(10).99
dollar and cents Expected Gross Margin minus (Deductible times Total Target Marketings). Symbols apply and only the negative symbol ( - ) will appear if applicable.
LIABILITY MILK PRICE Internal 999.99 NA Liability Milk Price from A00600.
<LIABILITY>
49 9(10) nearest whole dollar
For Dairy, result of Liability Milk Price times Total Target Marketings rounded to the nearest whole dollar.
CORN DRAW(i) (2 thru 11) Internal 999.99 per ADM From A00610.
SOYBEAN MEAL DRAW(i) (2 thru 11)
Internal 9999.99 per ADM From A00610.
FEED COST DRAW (2 thru 11)
Internal ( + / - ) 9999.99
dollars and cents Feed Cost Draw is the result of (corn equivalent times (2000/56) times corn draw(i)) plus (soybean meal equivalent times soybean meal draw(i)) by month.
MILK DRAW(i) (2 thru 11) Internal 999.99 per ADM From A00610.
GROSS MARGIN DRAW(i) (2 thru 11)
Internal ( + / - ) 9999.99
dollars and cents Gross Margin Draw for dairy is the result of target marketings times milk draw minus feed cost draw by month. Only the negative symbol ( - ) will appear if applicable.
SIMULATED GROSS MARGINS(i)
Internal 9(10).99 dollars and cents Sum of Gross Margin Draws(i) 2 thru 11.
<SIMULATED_ LOSSES>
50 9(12).99 dollars and cents Sum of (MAX (Gross Margin Guarantee minus Simulated Gross Margins(i)), 0).
<TOTAL_PREMIUM>
51 9(10) nearest whole dollar
The result of 1.03 times (1/5,000) times Simulated Losses.
Subsidy Factor
Internal .999 3 decimal places Subsidy Factor for Dairy based on number of months and deductibles. Subsidy percent converted to factor.
<SUBSIDY>
52 9(10) nearest whole dollar
Total Premium multiplied by Subsidy Factor. If Beginning Farmer Rancher is applicable, this amount contains the +10% increase in subsidy added to the base subsidy.
<PRODUCER_PREMIUM>
57 9(10) nearest whole dollar
Premium after Subsidy. Total Premium minus Subsidy.

2/7/2019 Exhibit 140-1 FCIC-Appendix III LIVESTOCK GROSS MARGIN (LGM)
LIABILITY/PREMIUM CALCULATIONS Edit Description
Approved 140-1 - 21 RY 2017
Tag No. Picture Rounding Description Base Subsidy Internal 9(10) nearest whole
dollar The subsidy would have been without alterations due to BFR.
<BFR_SUBSIDY> 59 9(10) nearest whole dollar
Beginning Farmer and Rancher Subsidy. 0.10 (10%) of the total premium.
<CC_SUB_RED_PCT> 60 9.9999 4 decimal places Share reduction of the policy that is in violation of Conservation Compliance.
<CC_SUB_RED_AMT> 61 9(10) Nearest whole dollar
Subsidy reduction for conservation compliance based on the CC_SUB_RED_PCT.
AOExpense Subsidy Percent Internal .999 3 decimal places A&O Expense Subsidy Percent <AOEXPENSE_SUBSIDY>
58 9(10).99 dollar and cents Total Premium multiplied by AOExpense Subsidy Percent.
Note: (i) = 1,2,…, 5000 Number of tons of corn per month must be between 0.00364 and 0.0381 tons per hundredweight of milk. Number of tons of soybean meal per month must be between 0.000805 and 0.013 tons per hundredweight of milk.