Embed Size (px)
Citation preview
Livestock and Rural Household Food Security:
The Case of Small Farmers of the Punjab, Pakistan
Muhammad Khalid Bashirab*
, Steven Schilizzia, and Ram Pandit
a
aSchool of Agricultural and Resource Economics, The University of Western Australia,
Crawley, WA 6009, Australia bUniversity of Agriculture, Faisalabad, Pakistan
*E-mail address: [email protected]
June 2012
Working Paper 1207
School of Agricultural and Resource Economics
http://www.are.uwa.edu.au
Citation: Bashir, M.K., Schilizzi, S. and Pandit, R. (2012) Livestock and rural household food security: The
Case of small farmers of the Punjab, Pakistan, Working Paper 1207, School of Agricultural and Resource
Economics, University of Western Australia, Crawley, Australia.
© Copyright remains with the authors of this document.
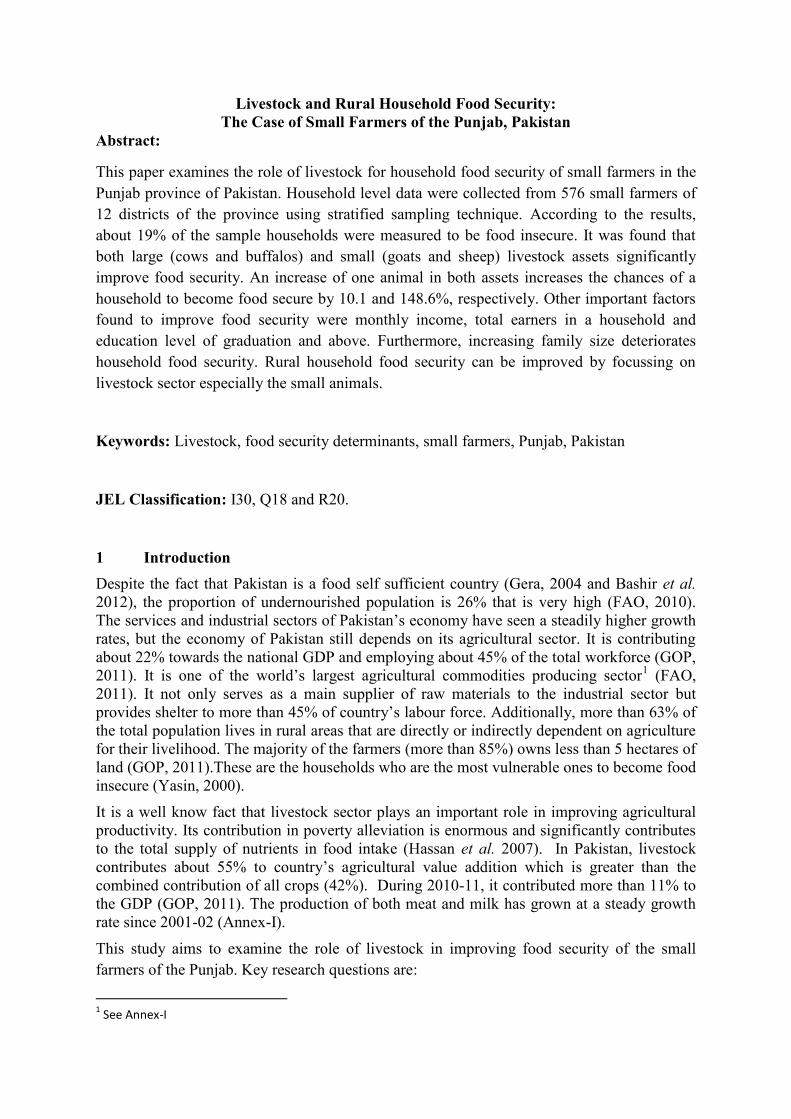
Livestock and Rural Household Food Security:
The Case of Small Farmers of the Punjab, Pakistan
Abstract:
This paper examines the role of livestock for household food security of small farmers in the
Punjab province of Pakistan. Household level data were collected from 576 small farmers of
12 districts of the province using stratified sampling technique. According to the results,
about 19% of the sample households were measured to be food insecure. It was found that
both large (cows and buffalos) and small (goats and sheep) livestock assets significantly
improve food security. An increase of one animal in both assets increases the chances of a
household to become food secure by 10.1 and 148.6%, respectively. Other important factors
found to improve food security were monthly income, total earners in a household and
education level of graduation and above. Furthermore, increasing family size deteriorates
household food security. Rural household food security can be improved by focussing on
livestock sector especially the small animals.
Keywords: Livestock, food security determinants, small farmers, Punjab, Pakistan
JEL Classification: I30, Q18 and R20.
1 Introduction
Despite the fact that Pakistan is a food self sufficient country (Gera, 2004 and Bashir et al.
2012), the proportion of undernourished population is 26% that is very high (FAO, 2010).
The services and industrial sectors of Pakistan’s economy have seen a steadily higher growth
rates, but the economy of Pakistan still depends on its agricultural sector. It is contributing
about 22% towards the national GDP and employing about 45% of the total workforce (GOP,
2011). It is one of the world’s largest agricultural commodities producing sector1 (FAO,
2011). It not only serves as a main supplier of raw materials to the industrial sector but
provides shelter to more than 45% of country’s labour force. Additionally, more than 63% of
the total population lives in rural areas that are directly or indirectly dependent on agriculture
for their livelihood. The majority of the farmers (more than 85%) owns less than 5 hectares of
land (GOP, 2011).These are the households who are the most vulnerable ones to become food
insecure (Yasin, 2000).
It is a well know fact that livestock sector plays an important role in improving agricultural
productivity. Its contribution in poverty alleviation is enormous and significantly contributes
to the total supply of nutrients in food intake (Hassan et al. 2007). In Pakistan, livestock
contributes about 55% to country’s agricultural value addition which is greater than the
combined contribution of all crops (42%). During 2010-11, it contributed more than 11% to
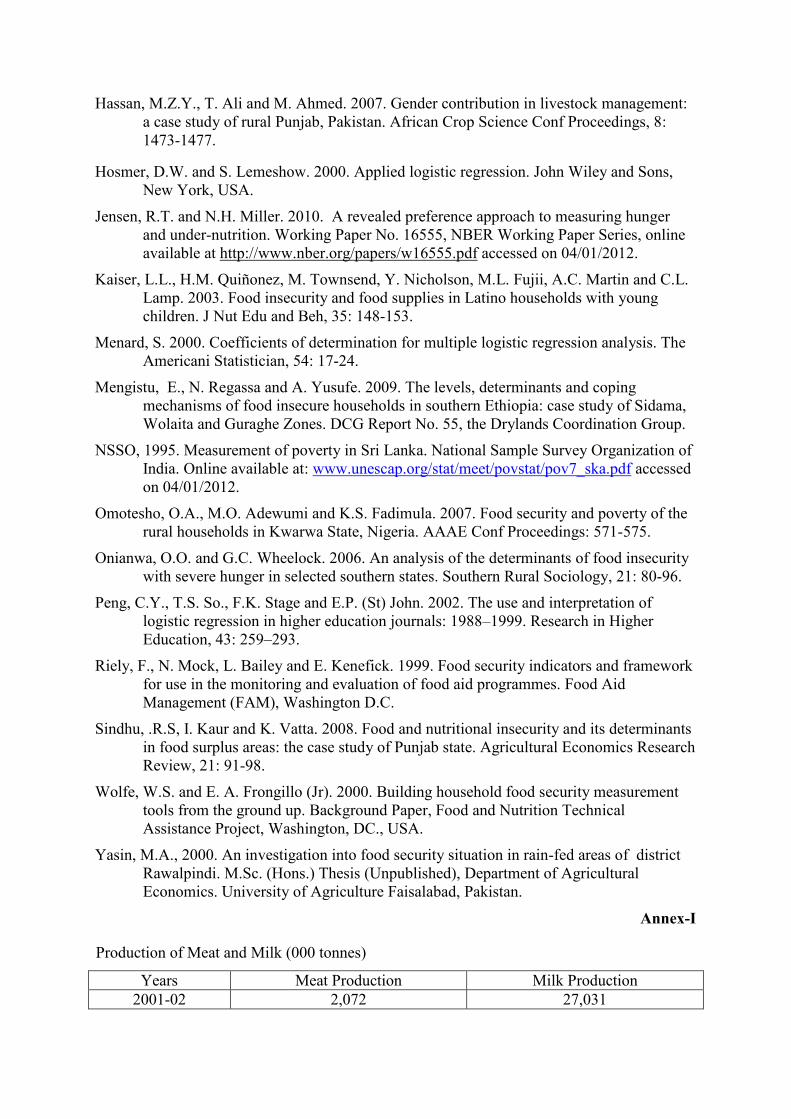
the GDP (GOP, 2011). The production of both meat and milk has grown at a steady growth
rate since 2001-02 (Annex-I).
This study aims to examine the role of livestock in improving food security of the small
farmers of the Punjab. Key research questions are:
1 See Annex-I
1. What levels of food security are experienced by small farmers?
2. How livestock assets affect their food security?
3. Which other socio-economic factors correlate with and best explain the levels of
their food security?
The rest of the paper is organized as follows: section 2 discusses the methodology; section 3
presents the results and their discussion; and section 4 concludes the paper.
2 Methodology
Primary data were collected from 12 districts of the Punjab province. There are 36 districts in
the province that were divided into three sub-regions (strata) on the basis of their geography:
South, Central and North Punjab. The sub-regions were not symmetrical in terms of the
number of districts i.e. there were 11, 17 and 8 districts in South, Central and North Punjab,
respectively. It was decided to include one third of the districts in the sample to better
represent the province. For this purpose a proportionate sampling procedure was adopted and
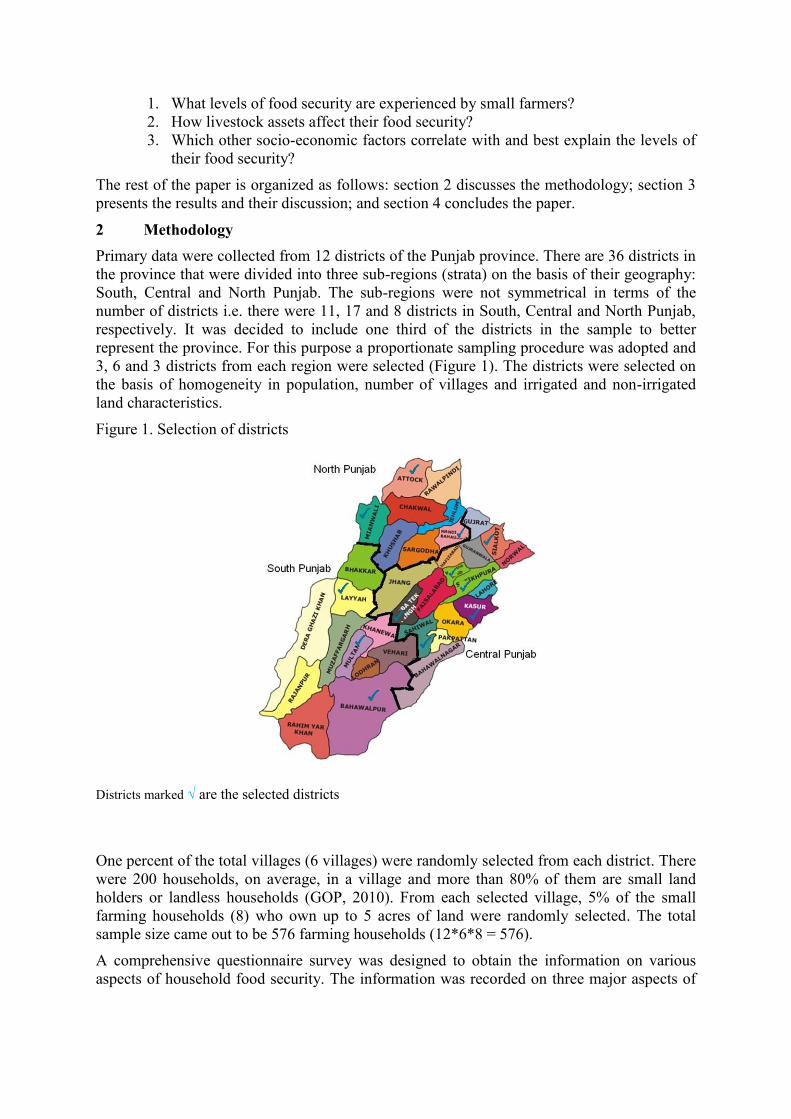
3, 6 and 3 districts from each region were selected (Figure 1). The districts were selected on
the basis of homogeneity in population, number of villages and irrigated and non-irrigated
land characteristics.
Figure 1. Selection of districts
Districts marked √ are the selected districts
One percent of the total villages (6 villages) were randomly selected from each district. There
were 200 households, on average, in a village and more than 80% of them are small land
holders or landless households (GOP, 2010). From each selected village, 5% of the small
farming households (8) who own up to 5 acres of land were randomly selected. The total
sample size came out to be 576 farming households (12*6*8 = 576).
A comprehensive questionnaire survey was designed to obtain the information on various
aspects of household food security. The information was recorded on three major aspects of
household characteristics: general and demographic information, the consumption of different
food items on weekly basis, and information on socio-economic factors.
Data analysis
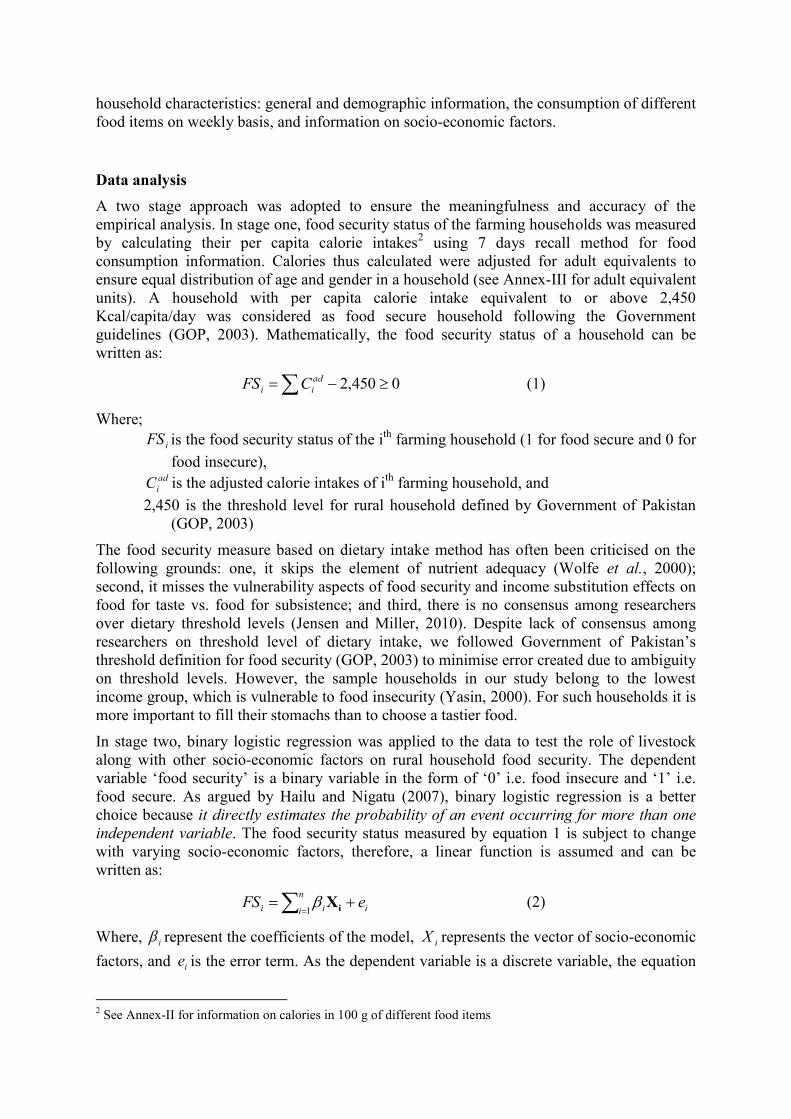
A two stage approach was adopted to ensure the meaningfulness and accuracy of the
empirical analysis. In stage one, food security status of the farming households was measured
by calculating their per capita calorie intakes2 using 7 days recall method for food
consumption information. Calories thus calculated were adjusted for adult equivalents to
ensure equal distribution of age and gender in a household (see Annex-III for adult equivalent
units). A household with per capita calorie intake equivalent to or above 2,450
Kcal/capita/day was considered as food secure household following the Government
guidelines (GOP, 2003). Mathematically, the food security status of a household can be
written as:
0450,2 ad
ii CFS (1)
Where;
iFS is the food security status of the ith
farming household (1 for food secure and 0 for
food insecure), ad
iC is the adjusted calorie intakes of ith
farming household, and
2,450 is the threshold level for rural household defined by Government of Pakistan
(GOP, 2003)
The food security measure based on dietary intake method has often been criticised on the
following grounds: one, it skips the element of nutrient adequacy (Wolfe et al., 2000);
second, it misses the vulnerability aspects of food security and income substitution effects on
food for taste vs. food for subsistence; and third, there is no consensus among researchers
over dietary threshold levels (Jensen and Miller, 2010). Despite lack of consensus among
researchers on threshold level of dietary intake, we followed Government of Pakistan’s
threshold definition for food security (GOP, 2003) to minimise error created due to ambiguity
on threshold levels. However, the sample households in our study belong to the lowest
income group, which is vulnerable to food insecurity (Yasin, 2000). For such households it is
more important to fill their stomachs than to choose a tastier food.
In stage two, binary logistic regression was applied to the data to test the role of livestock
along with other socio-economic factors on rural household food security. The dependent
variable ‘food security’ is a binary variable in the form of ‘0’ i.e. food insecure and ‘1’ i.e.
food secure. As argued by Hailu and Nigatu (2007), binary logistic regression is a better
choice because it directly estimates the probability of an event occurring for more than one
independent variable. The food security status measured by equation 1 is subject to change
with varying socio-economic factors, therefore, a linear function is assumed and can be
written as:
n
i iii eFS1 iX (2)
Where, i represent the coefficients of the model, iX represents the vector of socio-economic
factors, and ie is the error term. As the dependent variable is a discrete variable, the equation
2 See Annex-II for information on calories in 100 g of different food items
2 can be re-written in terms of the probability of a household becoming food secure as:
)|1( iiii xXFS , where, i is the probability of ith
household becoming food secure
and ix is the vector of socio-economic factors. The general form of logit can be written for
equation 2 as:
iii xit 0)(log (3)
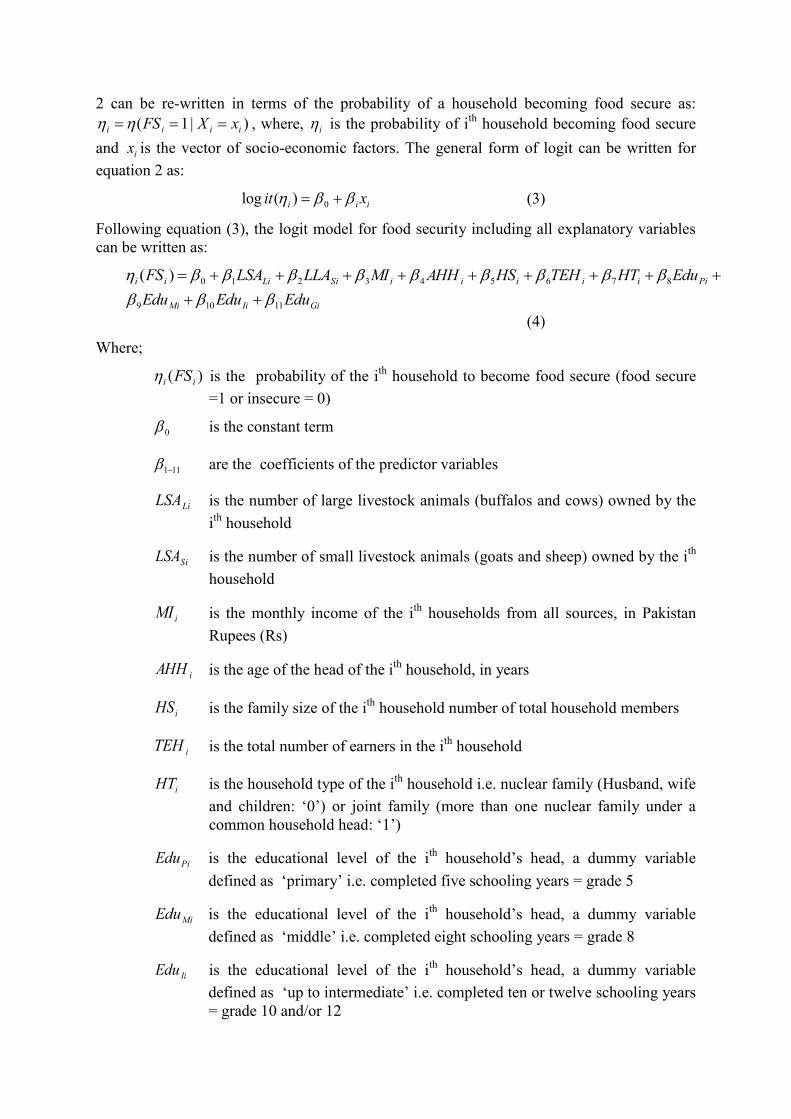
Following equation (3), the logit model for food security including all explanatory variables
can be written as:
GiIiMi
PiiiiiiSiLiii
EduEduEdu
EduHTTEHHSAHHMILLALSAFS
11109
876543210)(
(4)
Where;
)( ii FS is the probability of the ith
household to become food secure (food secure
=1 or insecure = 0)
0 is the constant term
111 are the coefficients of the predictor variables
LiLSA is the number of large livestock animals (buffalos and cows) owned by the
ith
household
SiLSA is the number of small livestock animals (goats and sheep) owned by the ith
household
iMI is the monthly income of the ith
households from all sources, in Pakistan
Rupees (Rs)
iAHH is the age of the head of the ith
household, in years
iHS is the family size of the ith
household number of total household members
iTEH is the total number of earners in the ith
household
iHT is the household type of the ith
household i.e. nuclear family (Husband, wife
and children: ‘0’) or joint family (more than one nuclear family under a
common household head: ‘1’)
PiEdu is the educational level of the ith
household’s head, a dummy variable
defined as ‘primary’ i.e. completed five schooling years = grade 5
MiEdu is the educational level of the ith
household’s head, a dummy variable
defined as ‘middle’ i.e. completed eight schooling years = grade 8
IiEdu is the educational level of the ith
household’s head, a dummy variable
defined as ‘up to intermediate’ i.e. completed ten or twelve schooling years
= grade 10 and/or 12
GiEdu is the educational level of the ith
household’s head, a dummy variable
defined as ‘graduation (2 years of college) or above’
3 Results and Discussion
The incidence of household food insecurity and descriptive analysis
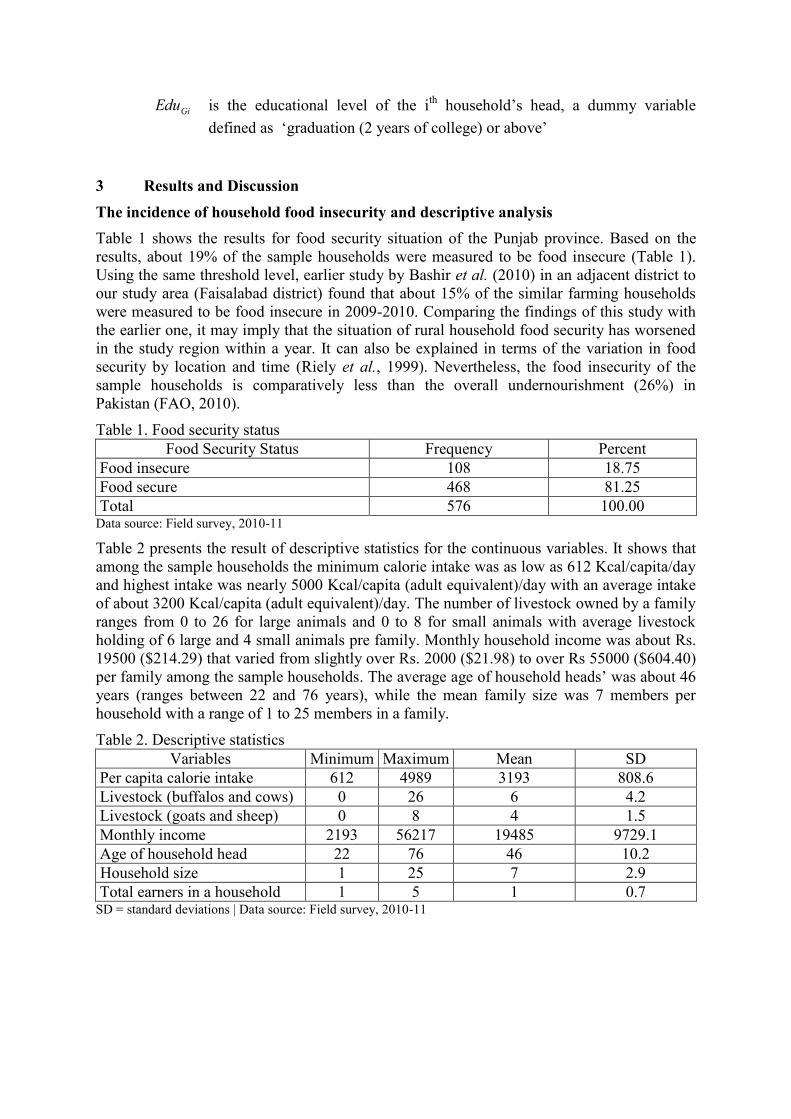
Table 1 shows the results for food security situation of the Punjab province. Based on the
results, about 19% of the sample households were measured to be food insecure (Table 1).
Using the same threshold level, earlier study by Bashir et al. (2010) in an adjacent district to
our study area (Faisalabad district) found that about 15% of the similar farming households
were measured to be food insecure in 2009-2010. Comparing the findings of this study with
the earlier one, it may imply that the situation of rural household food security has worsened
in the study region within a year. It can also be explained in terms of the variation in food
security by location and time (Riely et al., 1999). Nevertheless, the food insecurity of the
sample households is comparatively less than the overall undernourishment (26%) in
Pakistan (FAO, 2010).
Table 1. Food security status
Food Security Status Frequency Percent
Food insecure 108 18.75
Food secure 468 81.25
Total 576 100.00 Data source: Field survey, 2010-11
Table 2 presents the result of descriptive statistics for the continuous variables. It shows that
among the sample households the minimum calorie intake was as low as 612 Kcal/capita/day
and highest intake was nearly 5000 Kcal/capita (adult equivalent)/day with an average intake
of about 3200 Kcal/capita (adult equivalent)/day. The number of livestock owned by a family
ranges from 0 to 26 for large animals and 0 to 8 for small animals with average livestock
holding of 6 large and 4 small animals pre family. Monthly household income was about Rs.
19500 ($214.29) that varied from slightly over Rs. 2000 ($21.98) to over Rs 55000 ($604.40)
per family among the sample households. The average age of household heads’ was about 46
years (ranges between 22 and 76 years), while the mean family size was 7 members per
household with a range of 1 to 25 members in a family.
Table 2. Descriptive statistics
Variables Minimum Maximum Mean SD
Per capita calorie intake 612 4989 3193 808.6
Livestock (buffalos and cows) 0 26 6 4.2
Livestock (goats and sheep) 0 8 4 1.5
Monthly income 2193 56217 19485 9729.1
Age of household head 22 76 46 10.2
Household size 1 25 7 2.9
Total earners in a household 1 5 1 0.7 SD = standard deviations | Data source: Field survey, 2010-11
Determinants of household food security for small farmers
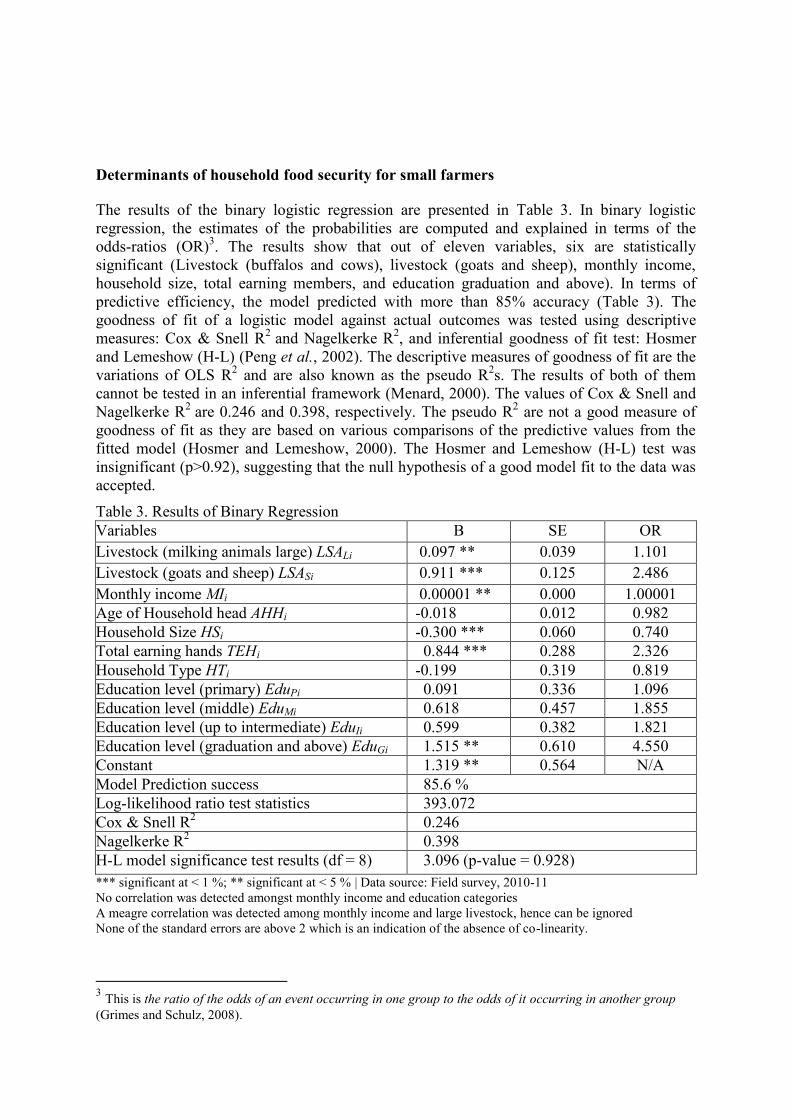
The results of the binary logistic regression are presented in Table 3. In binary logistic
regression, the estimates of the probabilities are computed and explained in terms of the
odds-ratios (OR)3. The results show that out of eleven variables, six are statistically
significant (Livestock (buffalos and cows), livestock (goats and sheep), monthly income,
household size, total earning members, and education graduation and above). In terms of
predictive efficiency, the model predicted with more than 85% accuracy (Table 3). The
goodness of fit of a logistic model against actual outcomes was tested using descriptive
measures: Cox & Snell R2
and Nagelkerke R2, and inferential goodness of fit test: Hosmer
and Lemeshow (H-L) (Peng et al., 2002). The descriptive measures of goodness of fit are the
variations of OLS R2 and are also known as the pseudo R
2s. The results of both of them
cannot be tested in an inferential framework (Menard, 2000). The values of Cox & Snell and
Nagelkerke R2
are 0.246 and 0.398, respectively. The pseudo R2 are not a good measure of
goodness of fit as they are based on various comparisons of the predictive values from the
fitted model (Hosmer and Lemeshow, 2000). The Hosmer and Lemeshow (H-L) test was
insignificant (p>0.92), suggesting that the null hypothesis of a good model fit to the data was
accepted.
Table 3. Results of Binary Regression
Variables Β SE OR
Livestock (milking animals large) LSALi 0.097 ** 0.039 1.101
Livestock (goats and sheep) LSASi 0.911 *** 0.125 2.486
Monthly income MIi 0.00001 ** 0.000 1.00001
Age of Household head AHHi -0.018 0.012 0.982
Household Size HSi -0.300 *** 0.060 0.740
Total earning hands TEHi 0.844 *** 0.288 2.326
Household Type HTi -0.199 0.319 0.819
Education level (primary) EduPi 0.091 0.336 1.096
Education level (middle) EduMi 0.618 0.457 1.855
Education level (up to intermediate) EduIi 0.599 0.382 1.821
Education level (graduation and above) EduGi 1.515 ** 0.610 4.550
Constant 1.319 ** 0.564 N/A
Model Prediction success 85.6 %
Log-likelihood ratio test statistics 393.072
Cox & Snell R2 0.246
Nagelkerke R2 0.398
H-L model significance test results (df = 8) 3.096 (p-value = 0.928)
*** significant at < 1 %; ** significant at < 5 % | Data source: Field survey, 2010-11
No correlation was detected amongst monthly income and education categories
A meagre correlation was detected among monthly income and large livestock, hence can be ignored
None of the standard errors are above 2 which is an indication of the absence of co-linearity.
3 This is the ratio of the odds of an event occurring in one group to the odds of it occurring in another group
(Grimes and Schulz, 2008).
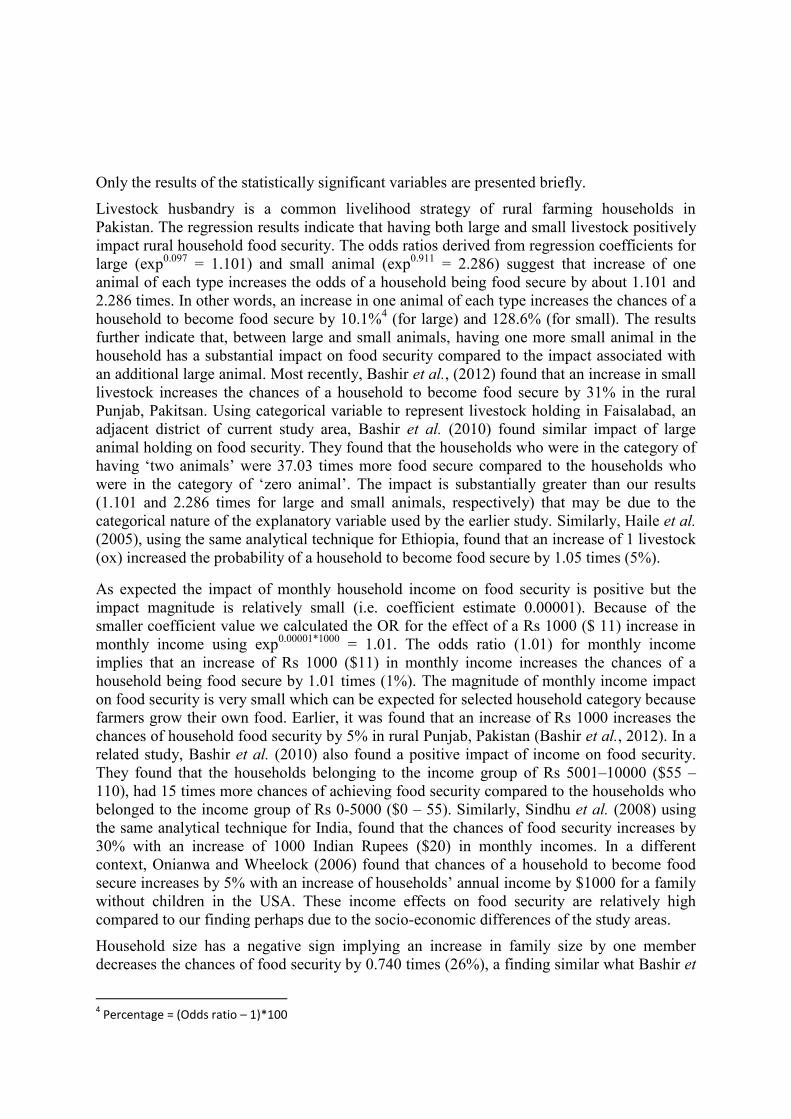
Only the results of the statistically significant variables are presented briefly.
Livestock husbandry is a common livelihood strategy of rural farming households in
Pakistan. The regression results indicate that having both large and small livestock positively
impact rural household food security. The odds ratios derived from regression coefficients for
large (exp0.097
= 1.101) and small animal (exp0.911
= 2.286) suggest that increase of one
animal of each type increases the odds of a household being food secure by about 1.101 and
2.286 times. In other words, an increase in one animal of each type increases the chances of a
household to become food secure by 10.1%4 (for large) and 128.6% (for small). The results
further indicate that, between large and small animals, having one more small animal in the
household has a substantial impact on food security compared to the impact associated with
an additional large animal. Most recently, Bashir et al., (2012) found that an increase in small
livestock increases the chances of a household to become food secure by 31% in the rural
Punjab, Pakitsan. Using categorical variable to represent livestock holding in Faisalabad, an
adjacent district of current study area, Bashir et al. (2010) found similar impact of large
animal holding on food security. They found that the households who were in the category of
having ‘two animals’ were 37.03 times more food secure compared to the households who
were in the category of ‘zero animal’. The impact is substantially greater than our results
(1.101 and 2.286 times for large and small animals, respectively) that may be due to the
categorical nature of the explanatory variable used by the earlier study. Similarly, Haile et al.
(2005), using the same analytical technique for Ethiopia, found that an increase of 1 livestock
(ox) increased the probability of a household to become food secure by 1.05 times (5%).
As expected the impact of monthly household income on food security is positive but the
impact magnitude is relatively small (i.e. coefficient estimate 0.00001). Because of the
smaller coefficient value we calculated the OR for the effect of a Rs 1000 ($ 11) increase in
monthly income using exp0.00001*1000
= 1.01. The odds ratio (1.01) for monthly income
implies that an increase of Rs 1000 ($11) in monthly income increases the chances of a
household being food secure by 1.01 times (1%). The magnitude of monthly income impact
on food security is very small which can be expected for selected household category because
farmers grow their own food. Earlier, it was found that an increase of Rs 1000 increases the
chances of household food security by 5% in rural Punjab, Pakistan (Bashir et al., 2012). In a
related study, Bashir et al. (2010) also found a positive impact of income on food security.
They found that the households belonging to the income group of Rs 5001–10000 ($55 –
110), had 15 times more chances of achieving food security compared to the households who
belonged to the income group of Rs 0-5000 ($0 – 55). Similarly, Sindhu et al. (2008) using
the same analytical technique for India, found that the chances of food security increases by
30% with an increase of 1000 Indian Rupees ($20) in monthly incomes. In a different
context, Onianwa and Wheelock (2006) found that chances of a household to become food
secure increases by 5% with an increase of households’ annual income by $1000 for a family
without children in the USA. These income effects on food security are relatively high
compared to our finding perhaps due to the socio-economic differences of the study areas.
Household size has a negative sign implying an increase in family size by one member
decreases the chances of food security by 0.740 times (26%), a finding similar what Bashir et
4 Percentage = (Odds ratio – 1)*100
al. (2012) found in an earlier study. They found that an increase of one household member
decreases the chances of household food security by 31%. Similarly, Bashir et al., (2010)
found using a categorical variable that households with large families of up to 9 members in
the household were about half food insecure compared to the household with smaller family
size of 4 to 6 members. In India, however, Sindhu et al. (2008) found that an increase in one
family member increases the chances of a household becoming food insecure by 49%.
Increase in one income earner in the household increases the chances of household food
security by 2.326 times (132%). Similar relationship was found by Bashir et al. (2010) for an
adjacent district of our study area. They found that households with three earning members
were 20 times more likely to become food secure as opposed to households with one earning
member. The difference in the impact is due to the difference in the nature of explanatory
variable used. Earlier study included number of earners as a categorical variable while we
considered it as a continuous variable.
Education level of graduation had a positive impact on household food security. It increases
the chances of food security by 4.55 times (355%), because those household heads that have
graduate level education are in a better position to improve their farm production. Education
level helps them to understand the latest production technologies and the use of available
information through extension services regarding new crop varieties. Earlier, Bashir et al.,
(2012) found that households whose heads have up to intermediate level of education have
133% more chance to become food secure. Similar effect of education was found by Bashir et
al. (2010) for graduation level that increased the odds of a household to become food secure
by 21 times. Again the coefficient magnitude is very high compared to our study due to the
use of a categorical explanatory variable. Other studies have also pointed out the positive
effect of higher education on decreasing chances of household food insecurity (i.e. improving
chances of food security) by 0.408 times (59%) in Nigeria (Amaza et al., 2006) and 0.712
times (29%) in the USA (Kaiser et al., 2003). The difference of the magnitudes in earlier
studies and the current study may be due to the socio-geographical situations of the study
areas.
4 Conclusion
From the above discussion it may be concluded that food insecurity is on the rise in rural
areas of Pakistan i.e. about 19% food insecure households compared to earlier estimates of
15% (Bashir et al., 2010). Both types of livestock animals: large and small improve the
household food security of rural families significantly (P < 0.05 and 0.01, respectively).
Additionally, monthly income, number of earners and graduate level of education positively
impact household food security while the household size had a negative impact which is
understandable.
On the basis of the above findings, it may be suggested that by giving special emphasis to
education for every member of the household, livestock production especially of small
animals and family planning programmes, the household food security of small farmers can
be improved.
References
AIOU, 2001. Food composition table for Pakistan. Allama Iqbal Open University, Islamabad,
Pakistan.
Amaza, P.S., J.C. Umeh, J. Helsen and A.O. Adejobi. 2006. Determinants and measurement
of food insecurity in Nigeria: some empirical policy guide. Presented at international
association of agricultural economists annual meeting, August 12-18, Queensland,
Australia, online available at
http://ageconsearch.umn.edu/bitstream/25357/1/pp060591.pdf accessed on
04/01/2012.
Babatunde, R.O., O.A. Omotesho and O.S. Sholotan. 2007. Socio-economic characteristics
and food security status of farming households in Kwara State, North-Central Nigeria.
Pak J Nut, 6: 49-58.
Bashir, M.K., M.K. Naeem and S.A.K. Niazi. 2010. Rural and peri-urban food security: a
case of district Faisalabad of Pakistan. WASJ, 9: 403-411.
Bashir M.K., S. Steven and R. Pandit. 2012. The determinants of rural household food
security in the Punjab, Pakistan: an econometric analysis. Working paper 1203,
School of Agricultural and Resource Economics, University of Western Australia,
Crawley, Australia online available at
http://ageconsearch.umn.edu/bitstream/122526/2/working%20paper%201203.pdf.
FAO, 2010. The state of food insecurity in the world: addressing food insecurity in protracted
crises. Food and Agriculture Organization of the United Nations, Rome.
FAO, 2011. Country rank in the world, by commodity. Food and Agriculture Organization of
United Nations, Statistics Division, online available at:
http://faostat.fao.org/site/339/default.aspx accessed on 03/01/2012.
Feleke, S., R.L. Kilmer and C. Gladwin. 2005. Determinants of food security in Southern
Ethiopia. Agri Econ, 33: 351–363.
Gera, N. 2004. Food security under structural adjustment in Pakistan. Asian Survey, 44: 353-
368.
GOP, 1998. Population census of Pakistan. Population Census Organization, Statistics
Division, Government of Pakistan.
GOP, 2003. Economic survey of Pakistan 2002-03. Finance Division, Ministry of Finance,
Government of Pakistan.
GOP, 2010. Economic survey of Pakistan 2009-10. Finance Division, Ministry of Finance,
Government of Pakistan.
GOP, 2011. Economic survey of Pakistan 2010-11. Finance Division, Ministry of Finance,
Government of Pakistan.
Haile, H.K., Z.G. Alemu and G. Kudhlande, 2005. Causes of household food insecurity in
Koredegaga Peasant Association, Oromiya Zone, Ethiopia. Working paper,
Department of Agricultural Economics, Faculty of Natural and Agricultural Sciences
at the University of the Free State.
Hailu, A. and R. Nigatu. 2007. Correlates of household food security in densely populated
areas of Southern Ethiopia: does the household structure matter? Stud. Home Comm.
Sci., 1: 85-91.
Hassan, M.Z.Y., T. Ali and M. Ahmed. 2007. Gender contribution in livestock management:
a case study of rural Punjab, Pakistan. African Crop Science Conf Proceedings, 8:
1473-1477.
Hosmer, D.W. and S. Lemeshow. 2000. Applied logistic regression. John Wiley and Sons,
New York, USA.
Jensen, R.T. and N.H. Miller. 2010. A revealed preference approach to measuring hunger
and under-nutrition. Working Paper No. 16555, NBER Working Paper Series, online
available at http://www.nber.org/papers/w16555.pdf accessed on 04/01/2012.
Kaiser, L.L., H.M. Quiñonez, M. Townsend, Y. Nicholson, M.L. Fujii, A.C. Martin and C.L.
Lamp. 2003. Food insecurity and food supplies in Latino households with young
children. J Nut Edu and Beh, 35: 148-153.
Menard, S. 2000. Coefficients of determination for multiple logistic regression analysis. The
Americani Statistician, 54: 17-24.
Mengistu, E., N. Regassa and A. Yusufe. 2009. The levels, determinants and coping
mechanisms of food insecure households in southern Ethiopia: case study of Sidama,
Wolaita and Guraghe Zones. DCG Report No. 55, the Drylands Coordination Group.
NSSO, 1995. Measurement of poverty in Sri Lanka. National Sample Survey Organization of
India. Online available at: www.unescap.org/stat/meet/povstat/pov7_ska.pdf accessed
on 04/01/2012.
Omotesho, O.A., M.O. Adewumi and K.S. Fadimula. 2007. Food security and poverty of the
rural households in Kwarwa State, Nigeria. AAAE Conf Proceedings: 571-575.
Onianwa, O.O. and G.C. Wheelock. 2006. An analysis of the determinants of food insecurity
with severe hunger in selected southern states. Southern Rural Sociology, 21: 80-96.
Peng, C.Y., T.S. So., F.K. Stage and E.P. (St) John. 2002. The use and interpretation of
logistic regression in higher education journals: 1988–1999. Research in Higher
Education, 43: 259–293.
Riely, F., N. Mock, L. Bailey and E. Kenefick. 1999. Food security indicators and framework
for use in the monitoring and evaluation of food aid programmes. Food Aid
Management (FAM), Washington D.C.
Sindhu, .R.S, I. Kaur and K. Vatta. 2008. Food and nutritional insecurity and its determinants
in food surplus areas: the case study of Punjab state. Agricultural Economics Research
Review, 21: 91-98.
Wolfe, W.S. and E. A. Frongillo (Jr). 2000. Building household food security measurement
tools from the ground up. Background Paper, Food and Nutrition Technical
Assistance Project, Washington, DC., USA.
Yasin, M.A., 2000. An investigation into food security situation in rain-fed areas of district
Rawalpindi. M.Sc. (Hons.) Thesis (Unpublished), Department of Agricultural
Economics. University of Agriculture Faisalabad, Pakistan.
Annex-I
Production of Meat and Milk (000 tonnes)
Years Meat Production Milk Production
2001-02 2,072 27,031

2002-03 2,132 27,811
2003-04 2,185 28,624
2004-05 2,238 29,438
2005-06 2,515 31,970
2006-07 2,618 32,996
2007-08 2,728 34,064
2008-09 2,843 35,160
2009-10 2,965 36,299
2010-11 3,094 37,475 Data Source: GOP, 2011
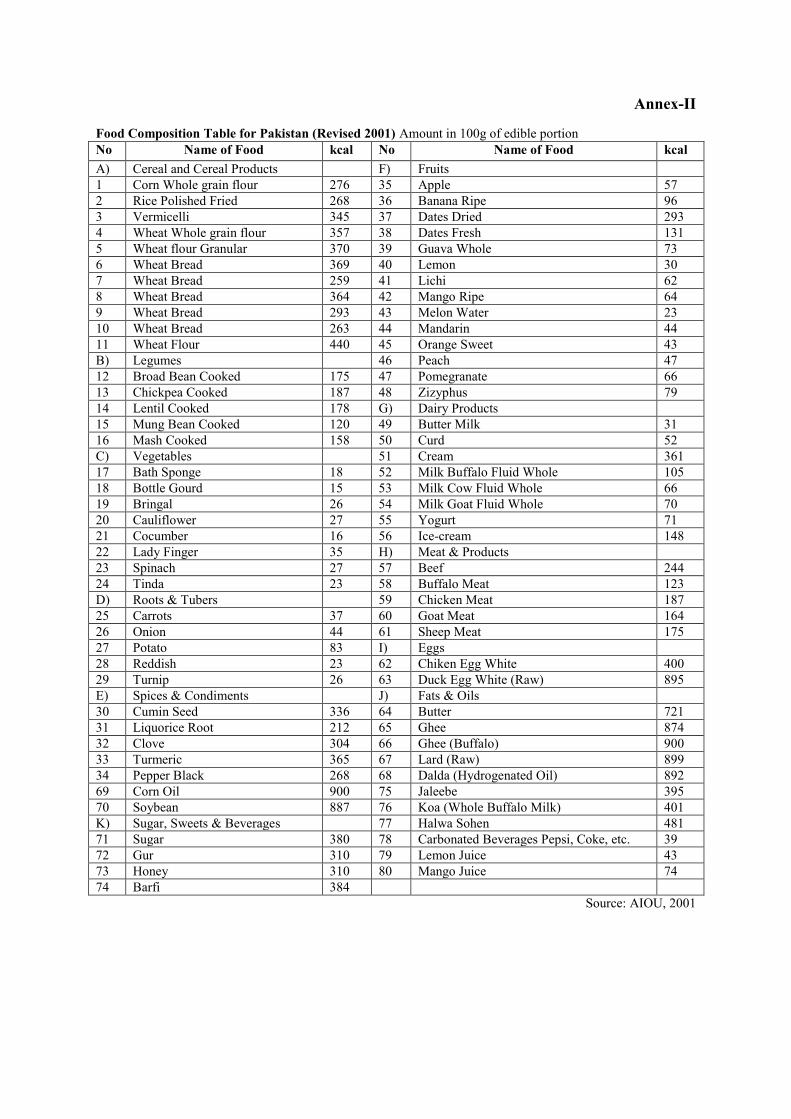
Annex-II
Food Composition Table for Pakistan (Revised 2001) Amount in 100g of edible portion
No Name of Food kcal No Name of Food kcal
A) Cereal and Cereal Products F) Fruits
1 Corn Whole grain flour 276 35 Apple 57
2 Rice Polished Fried 268 36 Banana Ripe 96
3 Vermicelli 345 37 Dates Dried 293
4 Wheat Whole grain flour 357 38 Dates Fresh 131
5 Wheat flour Granular 370 39 Guava Whole 73
6 Wheat Bread 369 40 Lemon 30
7 Wheat Bread 259 41 Lichi 62
8 Wheat Bread 364 42 Mango Ripe 64
9 Wheat Bread 293 43 Melon Water 23
10 Wheat Bread 263 44 Mandarin 44
11 Wheat Flour 440 45 Orange Sweet 43
B) Legumes 46 Peach 47
12 Broad Bean Cooked 175 47 Pomegranate 66
13 Chickpea Cooked 187 48 Zizyphus 79
14 Lentil Cooked 178 G) Dairy Products
15 Mung Bean Cooked 120 49 Butter Milk 31
16 Mash Cooked 158 50 Curd 52
C) Vegetables 51 Cream 361
17 Bath Sponge 18 52 Milk Buffalo Fluid Whole 105
18 Bottle Gourd 15 53 Milk Cow Fluid Whole 66
19 Bringal 26 54 Milk Goat Fluid Whole 70
20 Cauliflower 27 55 Yogurt 71
21 Cocumber 16 56 Ice-cream 148
22 Lady Finger 35 H) Meat & Products
23 Spinach 27 57 Beef 244
24 Tinda 23 58 Buffalo Meat 123
D) Roots & Tubers 59 Chicken Meat 187
25 Carrots 37 60 Goat Meat 164
26 Onion 44 61 Sheep Meat 175
27 Potato 83 I) Eggs
28 Reddish 23 62 Chiken Egg White 400
29 Turnip 26 63 Duck Egg White (Raw) 895
E) Spices & Condiments J) Fats & Oils
30 Cumin Seed 336 64 Butter 721
31 Liquorice Root 212 65 Ghee 874
32 Clove 304 66 Ghee (Buffalo) 900
33 Turmeric 365 67 Lard (Raw) 899
34 Pepper Black 268 68 Dalda (Hydrogenated Oil) 892
69 Corn Oil 900 75 Jaleebe 395
70 Soybean 887 76 Koa (Whole Buffalo Milk) 401
K) Sugar, Sweets & Beverages 77 Halwa Sohen 481
71 Sugar 380 78 Carbonated Beverages Pepsi, Coke, etc. 39
72 Gur 310 79 Lemon Juice 43
73 Honey 310 80 Mango Juice 74
74 Barfi 384
Source: AIOU, 2001
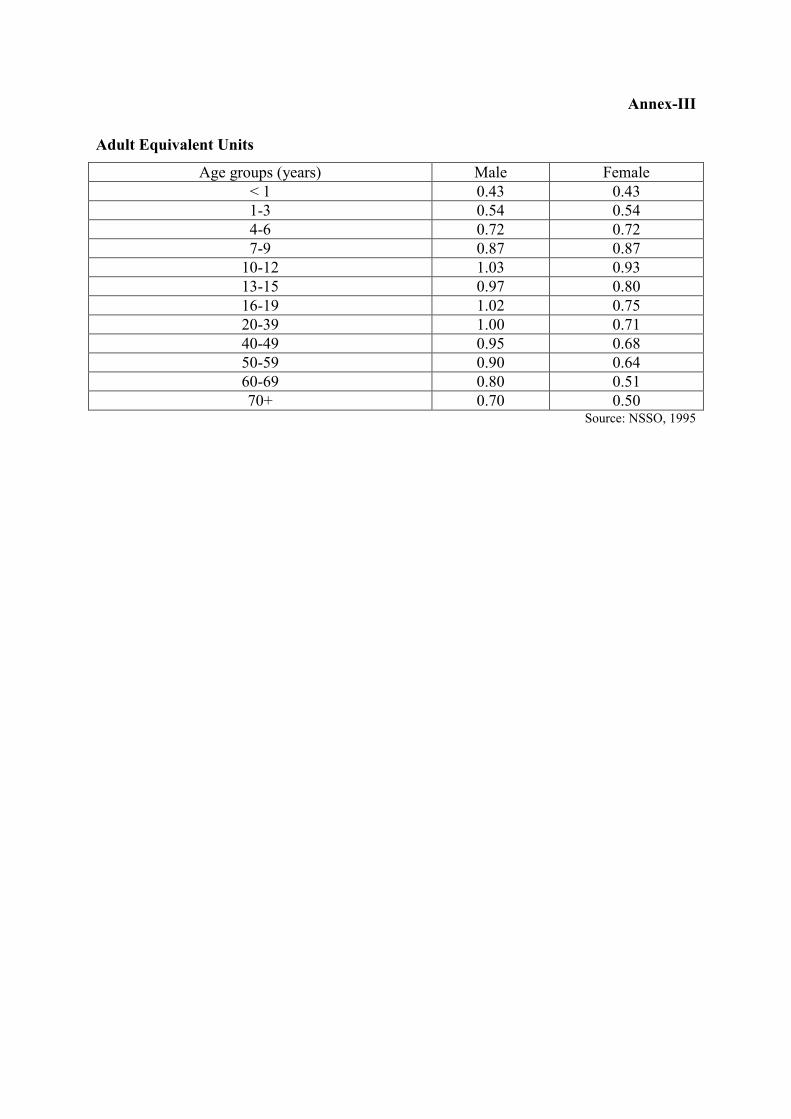
Annex-III
Adult Equivalent Units
Age groups (years) Male Female
< 1 0.43 0.43
1-3 0.54 0.54
4-6 0.72 0.72
7-9 0.87 0.87
10-12 1.03 0.93
13-15 0.97 0.80
16-19 1.02 0.75
20-39 1.00 0.71
40-49 0.95 0.68
50-59 0.90 0.64
60-69 0.80 0.51
70+ 0.70 0.50 Source: NSSO, 1995