Embed Size (px)
Citation preview
Available online at www.worldscientificnews.com
WSN 34 (2016) 1-33 EISSN 2392-2192
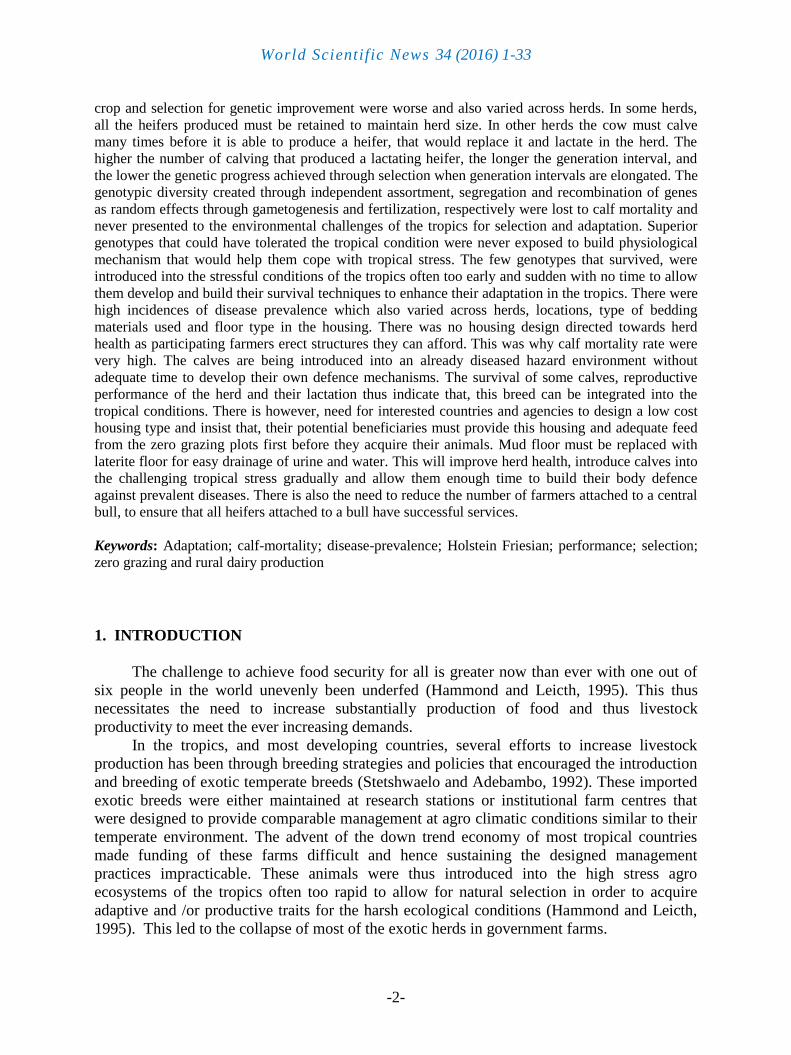
Diversifying Rural Livestock Production by the
Introduction of Holstein Friesian on Zero Grazing for Rural Dairy Production, Employment, Poverty Alleviation and Food Security in the Tropics
D. S. Gwaza1,*, A. I. Okwori2, E. M. Fombah2
1Department of Animal Breeding and Physiology, University of Agriculture, Makurdi, Nigeria
2Department of Animal Production, University of Agriculture, Makurdi, Nigeria
*E-mail address: [email protected]
ABSTRACT
The review was conducted from studies/reports of the performance of Holstein Friesian
routinely kept by Heifer Project International (HPI) Farmer groups on imported Holstein Friesian
herds on zero grazing in the western highland region of Cameroon. The review provides insight to the
reports of the studied area, its climatic conditions, management of the animals and the methodology
adopted by the researchers. Their findings and recommendations were also highlighted in order to
inform policy makers and agencies with the responsibility to design programmes for rural
development and youth empowment in tropical countries, the potentials of this technology to alleviate
poverty, hunger, rural-urban migration and unemployment. The mean age at first calving was higher
compared to other reports. The additive genetic variance of the sire that sired the dam of the heifer, the
breeding techniques of maintaining a central bull for several farmers and other management
techniques employed elongated age at first calving. Calving interval and calf birth weight were
appreciable, though longer and lower respectively compared to existing reports. They were greatly
affected by the management techniques employed by the farmers. The mean gestation length was low
despite the poor management indicating that, this breed with improved management can be integrated
into the tropical conditions. The percentage calf mortalities were very high. It varied across herd,
indicating that there was no standard routine management practice adopted at the herds locations. The
herd with better management recorded lower calf mortality. The effect of calf mortality rate on calf
World Scientific News 34 (2016) 1-33
-2-
crop and selection for genetic improvement were worse and also varied across herds. In some herds,
all the heifers produced must be retained to maintain herd size. In other herds the cow must calve
many times before it is able to produce a heifer, that would replace it and lactate in the herd. The
higher the number of calving that produced a lactating heifer, the longer the generation interval, and
the lower the genetic progress achieved through selection when generation intervals are elongated. The
genotypic diversity created through independent assortment, segregation and recombination of genes
as random effects through gametogenesis and fertilization, respectively were lost to calf mortality and
never presented to the environmental challenges of the tropics for selection and adaptation. Superior
genotypes that could have tolerated the tropical condition were never exposed to build physiological
mechanism that would help them cope with tropical stress. The few genotypes that survived, were
introduced into the stressful conditions of the tropics often too early and sudden with no time to allow
them develop and build their survival techniques to enhance their adaptation in the tropics. There were
high incidences of disease prevalence which also varied across herds, locations, type of bedding
materials used and floor type in the housing. There was no housing design directed towards herd
health as participating farmers erect structures they can afford. This was why calf mortality rate were
very high. The calves are being introduced into an already diseased hazard environment without
adequate time to develop their own defence mechanisms. The survival of some calves, reproductive
performance of the herd and their lactation thus indicate that, this breed can be integrated into the
tropical conditions. There is however, need for interested countries and agencies to design a low cost
housing type and insist that, their potential beneficiaries must provide this housing and adequate feed
from the zero grazing plots first before they acquire their animals. Mud floor must be replaced with
laterite floor for easy drainage of urine and water. This will improve herd health, introduce calves into
the challenging tropical stress gradually and allow them enough time to build their body defence
against prevalent diseases. There is also the need to reduce the number of farmers attached to a central
bull, to ensure that all heifers attached to a bull have successful services.
Keywords: Adaptation; calf-mortality; disease-prevalence; Holstein Friesian; performance; selection;
zero grazing and rural dairy production
1. INTRODUCTION
The challenge to achieve food security for all is greater now than ever with one out of
six people in the world unevenly been underfed (Hammond and Leicth, 1995). This thus
necessitates the need to increase substantially production of food and thus livestock
productivity to meet the ever increasing demands.
In the tropics, and most developing countries, several efforts to increase livestock
production has been through breeding strategies and policies that encouraged the introduction
and breeding of exotic temperate breeds (Stetshwaelo and Adebambo, 1992). These imported
exotic breeds were either maintained at research stations or institutional farm centres that
were designed to provide comparable management at agro climatic conditions similar to their
temperate environment. The advent of the down trend economy of most tropical countries
made funding of these farms difficult and hence sustaining the designed management
practices impracticable. These animals were thus introduced into the high stress agro
ecosystems of the tropics often too rapid to allow for natural selection in order to acquire
adaptive and /or productive traits for the harsh ecological conditions (Hammond and Leicth,
1995). This led to the collapse of most of the exotic herds in government farms.
World Scientific News 34 (2016) 1-33
-3-
There is little or no information on attempts by prospective countries to integrate these
exotic breeds into their local production systems to allow the animals go through the process
of natural selection in order to help them acquire adaptive and / or productive traits for the
diverse ecological conditions found in their respective countries (Ailmando, 1986).
Heifer Production International (HPI), a non-governmental organization, under the
“acronym” (passing on the gifts), imports live Friesian cattle into Cameroon. These animals
were given to resource limited farm families for milk production under the zero grazing
production system. The scheme has become so successful that, aside proving the ability of the
Holstein Friesian to survive under local management in the tropics, had also generated
employment opportunities to most able-bodied farmers, turn barren land that were not suitable
for grain production to pasture production.
The performance of Holstein Friesian under zero grazing at the Western highland
regions of Cameroon is a potential lead to the possibility that this breed can be integrated in
the tropics. These animals have, over the years, acquired adaptive features for tropical
conditions. It is no doubt that, aside the tropical harsh conditions, the poor management
practices employed by the local farmers will often affect the productivity and calf crop of
these animals. Calf mortality is of economic importance in dairy enterprise as this affects the
number of calves that will survive to weaning age.
In temperate regions, calf losses due to poor management and inadequate housing
facilities (James et al., 1984; Martin et al., 1975), environmental influences (Azzam et al.,
1998) and birth weight (Johanson and Berger, 2003) are quite high. In the tropics, calf losses
of Holstein Friesian herds are perhaps higher. Ogata et al. (1999) explained the genetic cause
for the inability of a calf to survive to pre-weaning age. Thus, information on the effect of calf
mortality on selection intensity and generation interval is necessary in evaluation of genetic
progress of Holstein Friesian herds which are managed by local farmers in the tropics. There
is dearth of information on calf survival especially of Holstein Friesian herds introduced into
the highland regions of Cameroon.
This project has become a major contributor of animal protein to the total animal
protein sources available to the average Cameroonian, as the high cost of meat put it above
the reach of most low income earners in Cameroon (Tambi, 1991).
The scheme in addition to increasing fresh milk production in the country has generated
employment opportunities. It has also led to effective utilization of crop residues and agro-
industrial by-products, as well as increased living standard of most farm families.
The challenges observed and mitigation strategies to cushion the experience at the
Western highland region of Cameroon are also highlighted for potential policy makers,
agencies, individuals, organisations and Agricultural rural development agencies to note while
adopting the technology in order to improve its efficiency.
The potentials of this technology to improve living standards, provide employment,
cushion risk of crop failures and diversify rural livestock production of rural farming
communities, must not be overlooked. It is, no doubt that its success at the Western highland
region can be duplicated in other tropical countries with similar or even better climatic
conditions than those at the highland regions of Cameroon. This technology if adopted, and
responses are directed to mitigate the observed challenges, will not only provide massive jobs,
but may also help in stimulating the interest of the youths in agriculture for self employment
and thus arrest the mentality of job seeking.
World Scientific News 34 (2016) 1-33
-4-
This review intends to provide information on:
- the reproductive and dairy performance potentials of Holstein Friesian and their
adaptation under harsh tropical condition and substandard management practices by
local farmers
- calf mortality and its effect on selection for genetic improvement of imported Holstein
Friesian herds under local farmers in tropical regions,
- prevalent diseases and factors affecting disease incidences under the existing
management practices adopted under tropical conditions, and
- the potentials of the Holstein Friesian (HF) to be integrated into the rural dairy
production on zero grazing.
2. LOCATION
Western highland region of Cameroon is located between latitude 5°20‟ and 7° North
and longitude 9°40‟ and 11°10‟ East of the Equator. The rainfall ranges from 1,300-3,000 mm
with a mean of 2,000 mm. The minimum and maximum daily temperature means of 15.50 °C
and 24.50 °C respectively. The climate is marked by dry season (November – March) and a
rainy season (April – October). The region is free from tsetse flies.
One hundred and thirty-seven calving records on age at first calving, calving interval,
gestation length, calf birth weight and daily lactation yield of imported Holstein Friesian in
the Western highland regions of Cameroon were obtained from records routinely kept by HPI
farmer groups from 1986 to 2004 (Gwaza et al., 2007a).
The animals were housed in houses made of dwarf mud walls, wooden walls, or cement
block walls. The roofs were either thatched or made of zinc roofs. In all, the milking parlours
were cemented, but the stable areas (sections) were either mud floored, or cemented or laterite
on mud floored. The cow dung and used fodders are carried on wheelbarrows to pits and
stable cleared. The animals were maintained on zero-grazing system where cut and carry
fodders (zero grazing) are fed in the rainy season. The fodder materials were Pennisetum
purpureum, Brachiaria decumbens, Guatemala desmodium, Stylosanthes spp., Calliandra
spp, Acacia, cowpea leaves, groundnut leaves and haulms, sweet potato and plantain leaves.
In the dry season, hay, crop residues and fresh grass got from riversides and valleys
supplemented with concentrate feed compounded from cotton seed cake, corn wheat or rice
bran, palm kernel cake, bone meal, salt and limestone. The concentrate feed is fed twice daily
(morning and evening) and water was provided adlibitum (Okwori et al., 2007).
The animals were routinely de-wormed four times a year with Albendazol and sprayed
for ecto-parasites. They were also routinely vaccinated against contagious bovine pleuro-
pneumonia (CBPP), hemorrhagic septicaemia and black quarter diseases. Veriben and other
antibiotics were given as prophylactic treatment at the beginning of rainy season for haemo-
parasites and other bacterial infections or used to treat animals with disease symptoms.
Mating of dams was done through synchronization and artificial insemination. Calving takes
place in the staple area. The calf is kept in cubicles and is housed individually until they are
weaned after six months of age. The calf is not allowed to suckle directly but is bucket-fed.
Two or three litres of milk are given to the calf from a plastic container for the first few days;
the farmer uses his finger in the plastic container to serve as dam‟s teat. This is to continue
until the calf is able to drink milk.
World Scientific News 34 (2016) 1-33
-5-
3. DATA ANALYSIS
The data generated were subjected to Analysis of Variance according to the procedure
adopted by Steele and Torrie (1980). The effect of sire, dam, year and sex of calf (for birth
weight) were tested at 0.01 and 0.05 per cent probability levels. The mean sum of squares was
equated to their expected mean sum of squares (EMS) to estimate the variance components
due to error, sire and dam (Gwaza et al., 2007b).
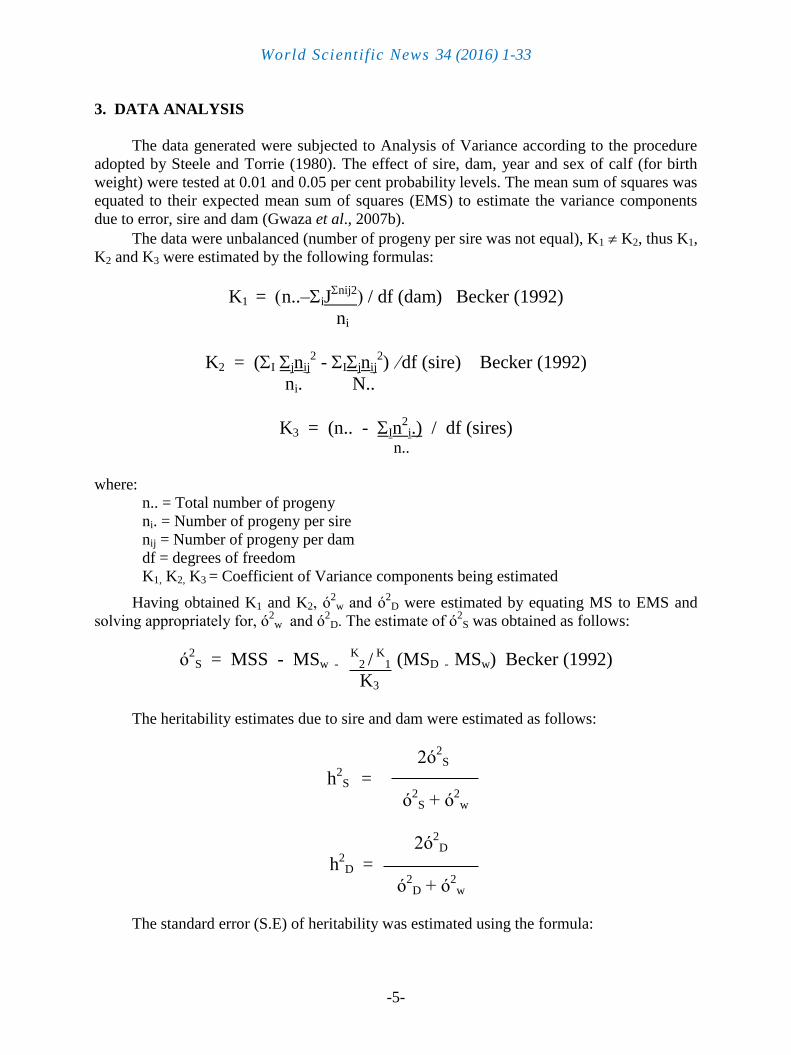
The data were unbalanced (number of progeny per sire was not equal), K1 K2, thus K1,
K2 and K3 were estimated by the following formulas:
K1 = n..–iJnij2
/ df (dam) Becker (1992)
ni
K2 = (I jnij2 - Ijnij
2) df (sire) Becker (1992)
ni. N..
K3 = (n.. - In2
i.) / df (sires) n..
where:
n.. = Total number of progeny
ni. = Number of progeny per sire
nij = Number of progeny per dam
df = degrees of freedom
K1, K2, K3 = Coefficient of Variance components being estimated
Having obtained K1 and K2, ó2
w and ó2
D were estimated by equating MS to EMS and
solving appropriately for, ó2
w and ó2
D. The estimate of ó2
S was obtained as follows:
ó2
S = MSS - MSw - K
2 / K
1 (MSD - MSw) Becker (1992)
K3
The heritability estimates due to sire and dam were estimated as follows:
2ó2
S
h2
S =
ó2
S + ó2
w
2ó2
D
h2
D = ó
2D + ó
2w
The standard error (S.E) of heritability was estimated using the formula:
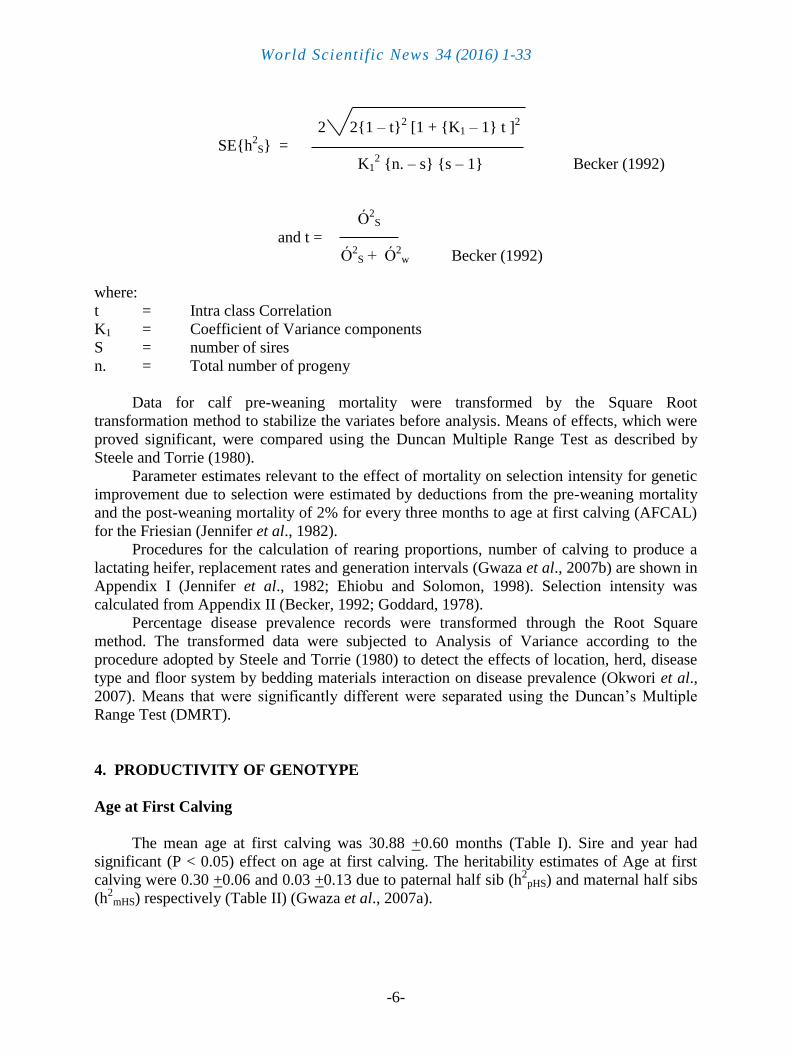
World Scientific News 34 (2016) 1-33
-6-
2 2{1 – t}2 [1 + {K1 – 1} t ]
2
SE{h2S} =
K12 {n. – s} {s – 1} Becker (1992)
Ó2
S
and t =
Ó2
S + Ó2
w Becker (1992)
where:
t = Intra class Correlation
K1 = Coefficient of Variance components
S = number of sires
n. = Total number of progeny
Data for calf pre-weaning mortality were transformed by the Square Root
transformation method to stabilize the variates before analysis. Means of effects, which were
proved significant, were compared using the Duncan Multiple Range Test as described by
Steele and Torrie (1980).
Parameter estimates relevant to the effect of mortality on selection intensity for genetic
improvement due to selection were estimated by deductions from the pre-weaning mortality
and the post-weaning mortality of 2% for every three months to age at first calving (AFCAL)
for the Friesian (Jennifer et al., 1982).
Procedures for the calculation of rearing proportions, number of calving to produce a
lactating heifer, replacement rates and generation intervals (Gwaza et al., 2007b) are shown in
Appendix I (Jennifer et al., 1982; Ehiobu and Solomon, 1998). Selection intensity was
calculated from Appendix II (Becker, 1992; Goddard, 1978).
Percentage disease prevalence records were transformed through the Root Square
method. The transformed data were subjected to Analysis of Variance according to the
procedure adopted by Steele and Torrie (1980) to detect the effects of location, herd, disease
type and floor system by bedding materials interaction on disease prevalence (Okwori et al.,
2007). Means that were significantly different were separated using the Duncan‟s Multiple
Range Test (DMRT).
4. PRODUCTIVITY OF GENOTYPE
Age at First Calving
The mean age at first calving was 30.88 +0.60 months (Table I). Sire and year had
significant (P < 0.05) effect on age at first calving. The heritability estimates of Age at first
calving were 0.30 +0.06 and 0.03 +0.13 due to paternal half sib (h2
pHS) and maternal half sibs
(h2
mHS) respectively (Table II) (Gwaza et al., 2007a).
World Scientific News 34 (2016) 1-33
-7-
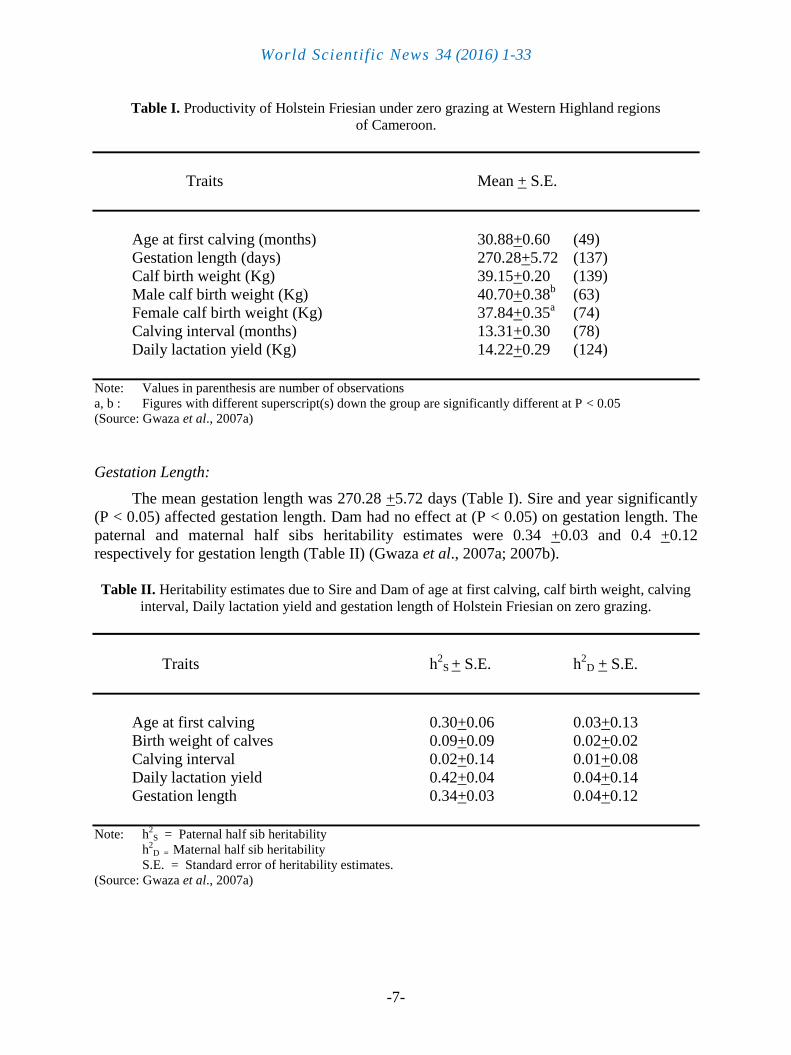
Table I. Productivity of Holstein Friesian under zero grazing at Western Highland regions
of Cameroon.
Traits Mean + S.E.
Age at first calving (months) 30.88+0.60 (49)
Gestation length (days) 270.28+5.72 (137)
Calf birth weight (Kg) 39.15+0.20 (139)
Male calf birth weight (Kg) 40.70+0.38b (63)
Female calf birth weight (Kg) 37.84+0.35a (74)
Calving interval (months) 13.31+0.30 (78)
Daily lactation yield (Kg) 14.22+0.29 (124)
Note: Values in parenthesis are number of observations
a, b : Figures with different superscript(s) down the group are significantly different at P < 0.05
(Source: Gwaza et al., 2007a)
Gestation Length:
The mean gestation length was 270.28 +5.72 days (Table I). Sire and year significantly
(P < 0.05) affected gestation length. Dam had no effect at (P < 0.05) on gestation length. The
paternal and maternal half sibs heritability estimates were 0.34 +0.03 and 0.4 +0.12
respectively for gestation length (Table II) (Gwaza et al., 2007a; 2007b).
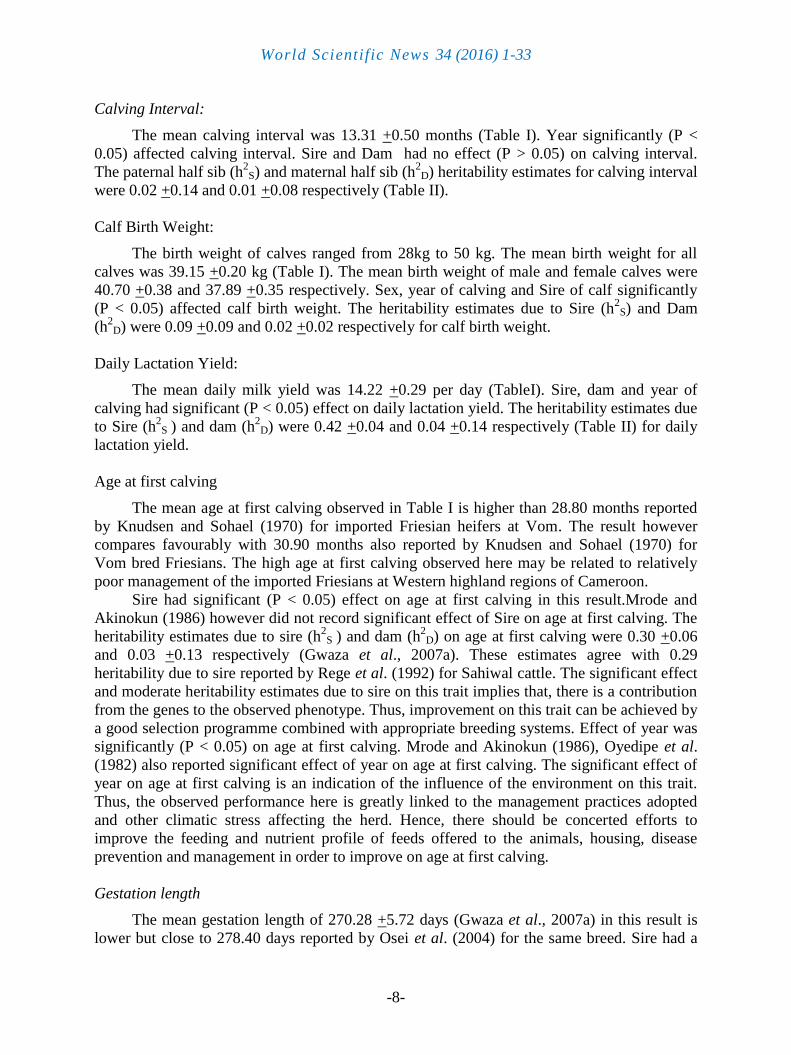
Table II. Heritability estimates due to Sire and Dam of age at first calving, calf birth weight, calving
interval, Daily lactation yield and gestation length of Holstein Friesian on zero grazing.
Traits h2
S + S.E. h2
D + S.E.
Age at first calving 0.30+0.06 0.03+0.13
Birth weight of calves 0.09+0.09 0.02+0.02
Calving interval 0.02+0.14 0.01+0.08
Daily lactation yield 0.42+0.04 0.04+0.14
Gestation length 0.34+0.03 0.04+0.12
Note: h2
S = Paternal half sib heritability
h2D = Maternal half sib heritability
S.E. = Standard error of heritability estimates.
(Source: Gwaza et al., 2007a)
World Scientific News 34 (2016) 1-33
-8-
Calving Interval:
The mean calving interval was 13.31 +0.50 months (Table I). Year significantly (P <
0.05) affected calving interval. Sire and Dam had no effect (P > 0.05) on calving interval.
The paternal half sib (h2
S) and maternal half sib (h2
D) heritability estimates for calving interval
were 0.02 +0.14 and 0.01 +0.08 respectively (Table II).
Calf Birth Weight:
The birth weight of calves ranged from 28kg to 50 kg. The mean birth weight for all
calves was 39.15 +0.20 kg (Table I). The mean birth weight of male and female calves were
40.70 +0.38 and 37.89 +0.35 respectively. Sex, year of calving and Sire of calf significantly
(P < 0.05) affected calf birth weight. The heritability estimates due to Sire (h2
S) and Dam
(h2
D) were 0.09 +0.09 and 0.02 +0.02 respectively for calf birth weight.
Daily Lactation Yield:
The mean daily milk yield was 14.22 +0.29 per day (TableI). Sire, dam and year of
calving had significant (P < 0.05) effect on daily lactation yield. The heritability estimates due
to Sire (h2
S ) and dam (h2
D) were 0.42 +0.04 and 0.04 +0.14 respectively (Table II) for daily
lactation yield.
Age at first calving
The mean age at first calving observed in Table I is higher than 28.80 months reported
by Knudsen and Sohael (1970) for imported Friesian heifers at Vom. The result however
compares favourably with 30.90 months also reported by Knudsen and Sohael (1970) for
Vom bred Friesians. The high age at first calving observed here may be related to relatively
poor management of the imported Friesians at Western highland regions of Cameroon.
Sire had significant (P < 0.05) effect on age at first calving in this result.Mrode and
Akinokun (1986) however did not record significant effect of Sire on age at first calving. The
heritability estimates due to sire (h2
S ) and dam (h2
D) on age at first calving were 0.30 +0.06
and 0.03 +0.13 respectively (Gwaza et al., 2007a). These estimates agree with 0.29
heritability due to sire reported by Rege et al. (1992) for Sahiwal cattle. The significant effect
and moderate heritability estimates due to sire on this trait implies that, there is a contribution
from the genes to the observed phenotype. Thus, improvement on this trait can be achieved by
a good selection programme combined with appropriate breeding systems. Effect of year was
significantly (P < 0.05) on age at first calving. Mrode and Akinokun (1986), Oyedipe et al.
(1982) also reported significant effect of year on age at first calving. The significant effect of
year on age at first calving is an indication of the influence of the environment on this trait.
Thus, the observed performance here is greatly linked to the management practices adopted
and other climatic stress affecting the herd. Hence, there should be concerted efforts to
improve the feeding and nutrient profile of feeds offered to the animals, housing, disease
prevention and management in order to improve on age at first calving.
Gestation length
The mean gestation length of 270.28 +5.72 days (Gwaza et al., 2007a) in this result is
lower but close to 278.40 days reported by Osei et al. (2004) for the same breed. Sire had a
World Scientific News 34 (2016) 1-33
-9-
significant (P <0.05) effect on gestation length in this result. This agrees with the report of
Brakel et al. (1952), Joubert (1961) who reported significant effect of sire on gestation length
in Holstein Friesian and South African Friesian cattle respectively. This indicates the
contribution of the genes to the observed gestation length.
The heritability estimates due to sire on gestation length of 0.34 +0.03 (Gwaza et al.,
2007a) agrees with 0.32 +0.83 reported by Singha and Singh (1958). Wheat and Riggs (1958)
reported 0.22 +0.50 heritability estimate due to dam higher than 0.04 +0.12 obtained in this
result. The lower estimate obtained in this study may have arisen from common maternal and
environmental effects due to dam.
The moderate heritability estimate due to sire on gestation length means that the animals
genotype also influences the gestation length. Thus selection for this trait will lead to an
improvement in gestation length.
Calving Interval:
The mean calving interval (13.13 +0.50 months) (399 days) (Gwaza et al., 2007a)
observed here is higher than 12.29 months and 11.74 months reported by Knudsen and Sohael
(1970); Mbap and Ngere (1988) respectively for imported Friesian at Vom. The high calving
interval obtained here may be related to varied management practices and other
environmental stress that could affect the animals return to oestrus, heat detection, serving and
conception at the
Western highland regions of Cameroon.
Year effect significantly affected calving interval in this result. Oyedipe et al. (1982)
also reported significant effect of year on calving interval. The significant effect of year on
calving interval show that there is a high contribution of the environment to the observed
calving interval. Thus, poor management and other environmental stress may affect calving
interval. Dam effect was also significant (P < 0.05) on calving interval. Mbap (1996) also
reported significant effect of dam on calving interval. The heritability estimates due to sire
(h2
S) and dam (h2
D) on calving interval were 0.02 +0.14 and 0.01 +0.08 respectively (Gwaza
et al., 2007a). Akinokun (1970) also reported heritability estimate due to sire of 0.12 +0.11
for N‟dama cattle. Mrode and Akinokun (1986) also reported low heritability estimates of
0.28 +0.80 for White Fulani cattle. The low heritability estimates on calving interval indicate
little genetic contribution to this trait. Thus, the significant effect of dam on calving interval
may be due to maternal effects and common environmental factors due to dam like early
return to oestrus, oestrus detection and servicing which are non genetic but may affect calving
interval.
Birth weight:
The mean birth weight of calves (39.15 +0.20kg) observed in this study (Gwaza et al.,
2007a) is higher than that reported by Mbap and Ngere (1988); Mrode (1988). The higher
birth weight observed here might be related to the influence of the genotype on birth weight
which is consistent even under poor management.
Year had a significant (P < 0.05) effect on birth weight of calves. This was also noted
by Ehoche (1992). This is an indication of the effect of management practices, housing,
disease prevention and management, feeding and nutrient content of feed offered to the
World Scientific News 34 (2016) 1-33
-10-
animals during gestation. Significant effect of sex of calf was also apparent in this result.
Male and female calves weighed 40.70 +0.38 and 37.84 +0.35 kg at birth respectively. This
result agrees with the report of Rachnefeed et al. (1980); Ehoche et al. (1992); Vesely and
Robinson (1971) who also reported that male calves, significantly weighed heavier than
female calves at birth. This observation may be due to the fact that male foetuses grow faster
during gestation and will have higher weight at birth than female calves.
Effect of sire on birth weight of calves was also significant (P < 0.05) in this result. This
was also reported by Ehoche et al. (1992) and Rachnefeed et al. (1980). The heritability
estimates due to sire (h2
S) and dam (h2
D) in this result were low 0.09 +0.09 and 0.02 +0.02
respectively. Oni et al. (1989) reported heritability estimate of 0.33 for Bunaji cattle. The low
heritability estimate observed in this result may have been influenced by the large error
variance. However, the significant effect of sire on birth weight implies considerable genetic
contribution to this trait. Appropriate selection programmes combined with good mating
systems will yield good result.
Daily Lactation Yields:
The mean daily lactation yield of 14.22 +0.29 kg (Gwaza et al., 2007a) recorded in this
study, is lower than 16.47 +0.46 kg reported by Knudsen and Sohael (1970) for the same
breed at Vom. The lower value obtained here could have been influenced by varied
management practices. This is supported by the significant (P < 0.05) effect of year observed
in this study. Mrode (1988) also reported significant year effect on daily lactation yields of
White Fulani cattle.
Sire effect was significant (P < 0.05) on daily lactation yield in this study. Knudsen and
Sohael (1970) also observed significant effect of sire on daily lactation yields. The heritability
estimate due to sire was 0.42 +0.04 on this trait. The significant effect of sire coupled with the
high heritability estimate due to sire point to the fact that, a though, the bull does not produce
milk, it contributes genetically to the daily performance of the cow offspring. Consequently,
adequate selective measures should therefore be taken for selecting a breeding bull in dairy
herds for economic productivity.
The effect of dam was also significant (P < 0.05) in this result. Bailey and Booster
(1954) also reported significant effect of dam on daily lactation yield. The heritability
estimates due to dam was 0.04 +0.14 on this trait. The significant effect of the dam on this
trait while recording low h2
D seems to indicate that aside the dam genotypic effect, other
maternal effects like dams body condition, nutritional status, age of dam at calving and other
common maternal environmental factors which are non genetic but affect the dams daily milk
yield. This considerable attention should be given to the dam after each lactation before
rebreeding it.
Application of Heritability Estimate to Selection for Genetic Improvement and Adaptation of
Holstein Friesian in the Tropics.
The application of heritability estimate to the low herds through selection for genetic
improvement will also increase the tolerance level of the breeds to environmental challenges
of the tropics. Applying heritability estimates to selection on the following performance
indices will be a welcome effort.
World Scientific News 34 (2016) 1-33
-11-
Age at First Calving
The heritability estimates due to sire (h2s) moderate (0.30 +0.06). This indicated that
selecting superior sires as heifers dam, sires will greatly shorten age at first calving. If this is
combined effectively with appropriate breeding system with due regards to factors that allow
the heifer to attain target weight early, this trait will be improved and improve the adaptation
of Holstein Freisian cows on zero grazing in the tropics.
Birth Weight of Calves
The heritability estimates due to sire and dam were low (0.09 +0.09, and 0.02 +0.02)
respectively. This implied that environmental factors like nutrition, dam‟s body condition
during gestation, fitness and health status of the dam exert greater influence on this trait and
must be given proper attention in order to improve on this trait. There is need to train the
farmers to use simple but standard management techniques during gestation to improve calf
birth weight. This will allow the calves to develop immunity to the tropical challenges and
become fit, stabilized and adapted to the tropical conditions.
Calving Interval
The heritability estimates due to sire and dam were 0.02 +0.14 and 0.01 +0.08
respectively. These low heritability estimates indicated that family selection must be applied
to the cow herd in order to improve calving interval. The environment of the animal also
exerted significant effect on calving interval. There is therefore, need to employ techniques
that improves the herd environment and management practices. Family selection alone will
effect low selection response because of the high environmental influence on the trait.
Daily Lactation Yield
The heritability estimates due to sire and dam were 0.42 +0.04 and 0.04 +0.14
respectively. The high heritability estimates due to sire indicated that the sire exert greater
effect on the dairy performance of is heifer. Selecting superior sires as breeding bulls will
significantly improve dairy performance of their heifers.
The low heritability estimates due to type, other non genetic factors of maternal effect
like the dam‟s body condition, udder conditions, health status of the dam, nutrition and
management practices adopted exerted great influence on dairy performance of the dam. It is
important therefore, to pay special attention to these non genetic factors affecting the dam;
this will ensure that the dams are introduced into the tropical challenges slowly, to enable
them build their defence mechanisms against the tropical challenges. This will improve their
tolerance, adaptation to the challenges of the tropics and dairy performance under tropical
conditions.
Gestation Length
The heritability estimates due to sire and dam on gestation length were 0.34 +0.03 and
0.04 +0.12 respectively (Gwaza et al., 2007a). The additive genetic effect of the sire enhances
shorter gestation length. Selecting superior sires in this trait will greatly reduce gestation
length of the dams. Maternal environment of the dam, nutrition and other management
techniques that support the physiological conditions of the dam during gestation will enhance
World Scientific News 34 (2016) 1-33
-12-
early parturition and reduced gestation length. Gwaza et al. (2007a) had reported significant
effect of maternal effect on reproductive performance of Holstein Friesian on zero grazing in
the western highland regions of Cameroon.
Calf mortality
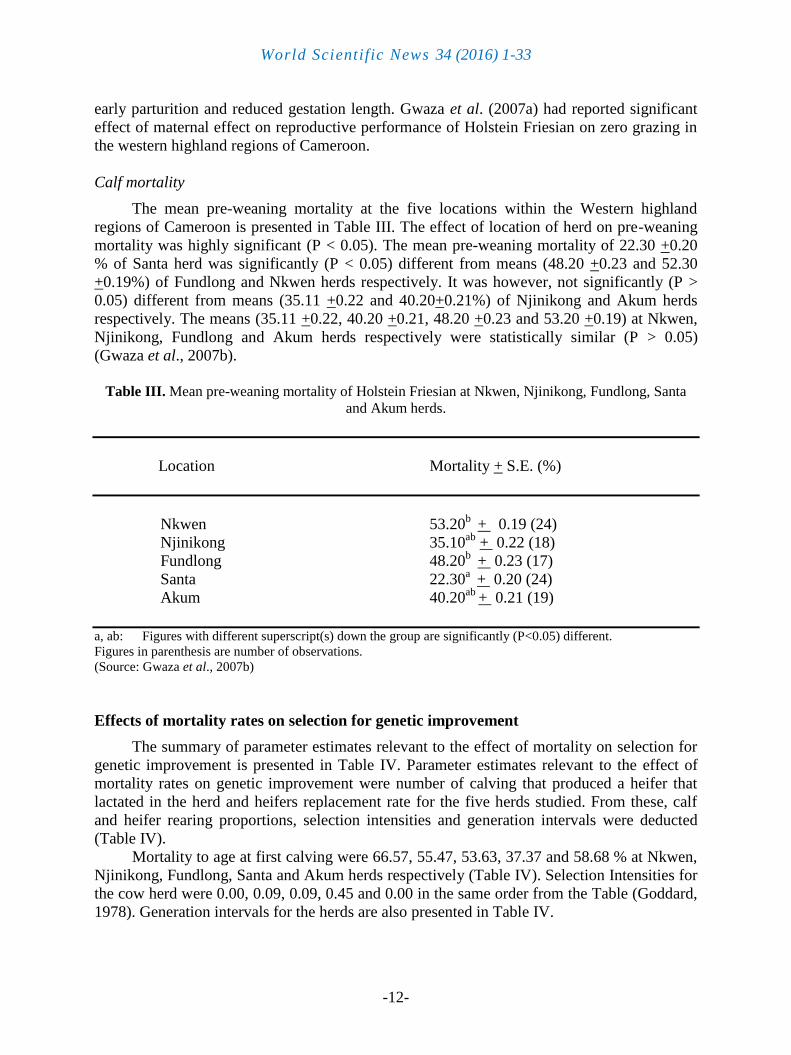
The mean pre-weaning mortality at the five locations within the Western highland
regions of Cameroon is presented in Table III. The effect of location of herd on pre-weaning
mortality was highly significant (P < 0.05). The mean pre-weaning mortality of 22.30 +0.20
% of Santa herd was significantly (P < 0.05) different from means (48.20 +0.23 and 52.30
+0.19%) of Fundlong and Nkwen herds respectively. It was however, not significantly (P >
0.05) different from means (35.11 +0.22 and 40.20+0.21%) of Njinikong and Akum herds
respectively. The means (35.11 +0.22, 40.20 +0.21, 48.20 +0.23 and 53.20 +0.19) at Nkwen,
Njinikong, Fundlong and Akum herds respectively were statistically similar (P > 0.05)
(Gwaza et al., 2007b).
Table III. Mean pre-weaning mortality of Holstein Friesian at Nkwen, Njinikong, Fundlong, Santa
and Akum herds.
Location Mortality + S.E. (%)
Nkwen 53.20b
+ 0.19 (24)
Njinikong 35.10ab
+ 0.22 (18)
Fundlong 48.20b
+ 0.23 (17)
Santa 22.30a + 0.20 (24)
Akum 40.20ab
+ 0.21 (19)
a, ab: Figures with different superscript(s) down the group are significantly (P<0.05) different.
Figures in parenthesis are number of observations.
(Source: Gwaza et al., 2007b)
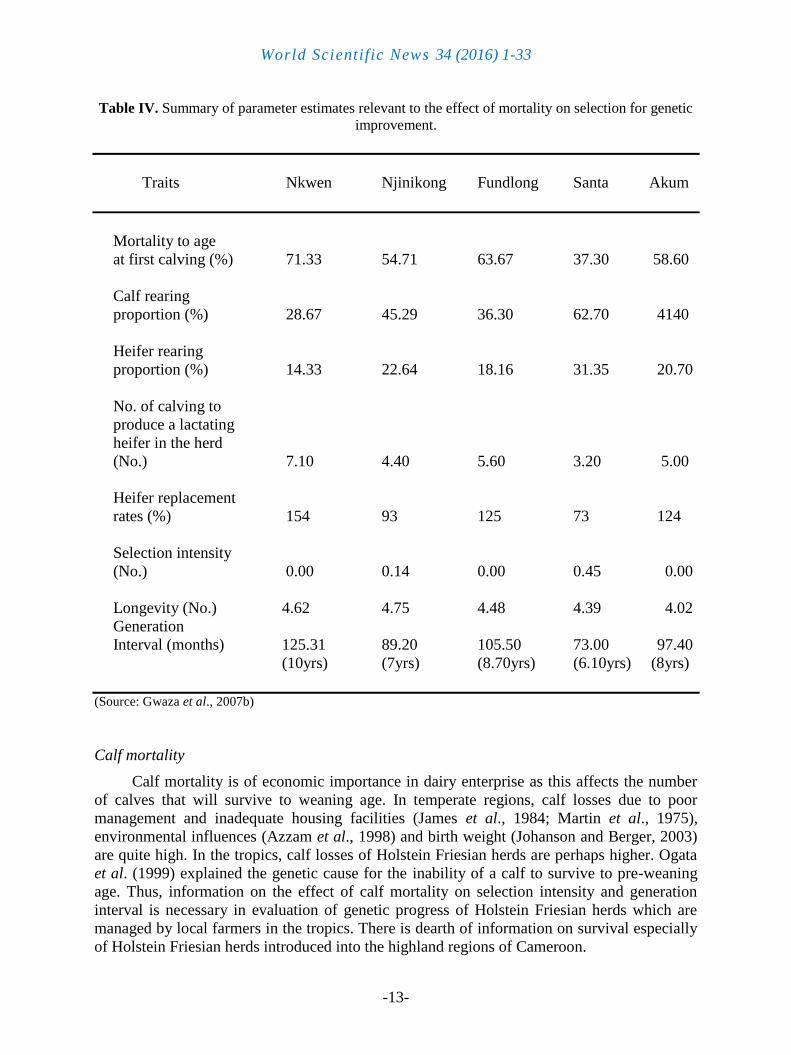
Effects of mortality rates on selection for genetic improvement
The summary of parameter estimates relevant to the effect of mortality on selection for
genetic improvement is presented in Table IV. Parameter estimates relevant to the effect of
mortality rates on genetic improvement were number of calving that produced a heifer that
lactated in the herd and heifers replacement rate for the five herds studied. From these, calf
and heifer rearing proportions, selection intensities and generation intervals were deducted
(Table IV).
Mortality to age at first calving were 66.57, 55.47, 53.63, 37.37 and 58.68 % at Nkwen,
Njinikong, Fundlong, Santa and Akum herds respectively (Table IV). Selection Intensities for
the cow herd were 0.00, 0.09, 0.09, 0.45 and 0.00 in the same order from the Table (Goddard,
1978). Generation intervals for the herds are also presented in Table IV.
World Scientific News 34 (2016) 1-33
-13-
Table IV. Summary of parameter estimates relevant to the effect of mortality on selection for genetic
improvement.
Traits Nkwen Njinikong Fundlong Santa Akum
Mortality to age
at first calving (%) 71.33 54.71 63.67 37.30 58.60
Calf rearing
proportion (%) 28.67 45.29 36.30 62.70 4140
Heifer rearing
proportion (%) 14.33 22.64 18.16 31.35 20.70
No. of calving to
produce a lactating
heifer in the herd
(No.) 7.10 4.40 5.60 3.20 5.00
Heifer replacement
rates (%) 154 93 125 73 124
Selection intensity
(No.) 0.00 0.14 0.00 0.45 0.00
Longevity (No.) 4.62 4.75 4.48 4.39 4.02
Generation
Interval (months) 125.31 89.20 105.50 73.00 97.40
(10yrs) (7yrs) (8.70yrs) (6.10yrs) (8yrs)
(Source: Gwaza et al., 2007b)
Calf mortality
Calf mortality is of economic importance in dairy enterprise as this affects the number
of calves that will survive to weaning age. In temperate regions, calf losses due to poor
management and inadequate housing facilities (James et al., 1984; Martin et al., 1975),
environmental influences (Azzam et al., 1998) and birth weight (Johanson and Berger, 2003)
are quite high. In the tropics, calf losses of Holstein Friesian herds are perhaps higher. Ogata
et al. (1999) explained the genetic cause for the inability of a calf to survive to pre-weaning
age. Thus, information on the effect of calf mortality on selection intensity and generation
interval is necessary in evaluation of genetic progress of Holstein Friesian herds which are
managed by local farmers in the tropics. There is dearth of information on survival especially
of Holstein Friesian herds introduced into the highland regions of Cameroon.
World Scientific News 34 (2016) 1-33
-14-
Mortality rates differed significantly (P < 0.05) across the locations studied. This may imply
that, there was no routine management practices adopted at these locations. The calves are
therefore being exposed into the challenging tropical environment too sudden that, they have
too little or no time to develop immunity that would assist them cope with the environmental
stress of the tropical conditions.
A well designed management practice, routinely followed, will not only provide
protection to the calves at their early fragile life, but will also introduce them gradually into
the tropical environmental stress. This will provide the calves enough time to develop
immunity to the common environmental challenges of the tropics. Calves exposed gradually
to the tropical stress that survived to age at first calving would be better adapted to the tropical
conditions than their dams. This underscores the need to adopt a uniform routine management
technique at all locations that would protect the calves and expose them gradually, to allow
them develop immunity for common environmental stress of the tropics.
The pre-weaning calf mortality observed in this result is higher than the report of Osei
et al. (2004) and Stephen (2000) who reported 17.80 and 14.90 % calf mortality of tropical
breeds in Ghana and Tanzania respectively. The finding of Payne (1951) of 19.70 % mortality
of Friesian calves at Fiji is low compared to this report.
The high pre-weaning mortality observed in this result may be due to diseases and
nutritional deficiencies arising from poor management. This is consistent with the
observations of McDoweil (1972) and Rendel (1972) who reported that hostile climate, poor
feeding and diseases are the major causes of calf death in the tropics.
Effect of herd location on calf mortality
The effect of location of herd on calf mortality was highly significant (P < 0.05). Kilfaro
(1995) also reported that calf mortality varies significantly from herd to herd depending on
the management practices adopted. This indicates that there is no standard routine
management practice as regards quality of feed fed to the animals, sanitary conditions in the
pens, disease prevention and management, the hygiene of feeding utensils and milk bucket-
fed to the calves at all the locations. Perhaps this explains the varying disease incidences and
calf mortality as observed at all the locations.
The mean pre-weaning mortality at Santa, Nkwen and Fundlong (Table I) were
significantly (P < 0.05) different. Kilfaro (1995) also reported that calf mortality varies
significantly (P < 0.05) from herds due to differences in herd management. The mean calf
mortality at Santa was least (22.30 +0.02%). This could be so, because of the better feeding
and health care attention given to these animals. The floor system, “cemented floor and
laterite on mud” will also allow for easy drainage of urine and water. Roughages fed to the
animals will be less contaminated by urine and stagnant water. The sanitary conditions in
pens at Santa location will be better compared to those at Nkwen and Fundlong.
Consequently, there will be less multiplication of disease causing pathogens, less disease
incidence and hence lower calf mortality as observed.
Calf mortality at Nkwen was highest followed by Fundlong (Table I) where the
management practices were very poor. The mud floor system will not help matters, as
animals foot print will become water logged with urine, water and faeces; making drainage
difficult. Hence, there will be high multiplication of disease causing organisms, high
incidence of diseases, which will cause more calf death as observed in this study.
World Scientific News 34 (2016) 1-33
-15-
The degree of calf mortality at each location will also be influenced by nutrition, disease
prevention and other management techniques. This appears to vary, as Nkwen, Akum and
Njinikong on the same floor system recorded numerical differences of average calf death. The
management practices were worst at Nkwen, worse at Fundlong followed by Akum
respectively (Table I). Santa with the least pre-weaning mortality (22.30 +0.20 %) has the
best management system in place followed by Njinikong with (35.10 +0.20 %) calf death
respectively.
Effect of herd location on adaptation of Holstein Friesian on zero grazing
Mortality rates differed significantly (P < 0.05) across the locations studied. This may
imply that there was no routine management practices adopted at these locations. The calves
were therefore being exposed to the challenging tropical environment too sudden that they
have too little or no time to develop immunity that would assist them cope with the
environmental stress of the tropical conditions. A well designed management practice
routinely followed, will not only provide protection to the calves at their early fragile life, but
will also introduce them gradually into the tropical environmental stress. This will provide the
calves enough immunity to the common environmental challenges of the tropics. Calves
exposed gradually to the tropical stress that survived to age at first calving would be better
adapted to the tropical conditions their dams. This underscores the need to adopt a routine
management technique at all locations that would protect the calves and expose them
gradually, to allow them develop immunity for common environmental stress of thetropics.
Effects of mortality rates on selection for genetic improvement
Mortality to age at first calving in respect of the five herds (Gwaza et al., 2007b) were
higher than the 38 % reported by Ehiobu and Solomon (1998) for Holstein Friesian at Vom in
Nigeria. The higher values obtained here may be related to high pre-weaning calf mortality
arising from poor management and other environmental stress on the herds. Approximately
154, 93, 125, 73 and 124 % female calves will be available as replacement to maintain herd
size at Nkwen, Njinikong, Fundlong, Santa and Akum. These are higher than the 47 % heifer
replacement rate reported by Ehiobu and Solomon (1998) for Friesian herd at Vom in Nigeria.
Selecting 154, 93, 125, 73 and 124% heifers for replacement at Nkwen, Njinikong,
Fundlong, Santa and Akum herds respectively gives selection intensities of 0.00, 0.14, 0.00,
0.45 and 0.00 in the same order. These are lower than 0.80 selection intensity reported by
Ehiobu and Solomon (1998) in a Friesian herd at Vom in Nigeria. The lower selection
intensities observed in this study could be due to the large proportion of heifers that must be
retained to maintain herd size. The effect of the very low selection pressures of 0.00, 7.00,
0.00, 27.10 and 0.00 % at Nkwen, Njinikong, Fundlong, Santa and Akum herds respectively
on selection intensity could be another reason for the observed low selection intensities. The
larger the proportion of animals selected, or the smaller the selection pressure, the lower the
selection intensity. On the other hand, the smaller the proportion of animals selected, or the
larger the selection pressure, the higher the selection intensity (Gwaza et al., 2007b).
Effect of calf mortality rate on generation interval
The observed generation intervals of 9.10, 7.70, 7.30 and 7.90 years for Nkwen,
Njinikong, Fundlong and Akum were also higher than the reports of Fall et al. (1982) and
World Scientific News 34 (2016) 1-33
-16-
Ehiobu and Solomon (1998). This is could be because the heifers rearing proportion are low
(14.33, 22.64, 18.16 and 20.70) in the locations respectively. The cows at these herds will
have to calve for many times before they can produce a heifer that would lactate in the herd.
The higher the number of calving that produce a heifer that lactate in he herd, the higher
would be the generation interval. And the longer the generation interval, the lower the
selection response achieved through selection. This is further compounded when the calving
interval is very high. The generation interval of the herd at Santa (6.10 years) which was the
least agrees with the report of Ehiobu and Solomon (1998) who noted 6.10 years generation
interval for Holstein Friesian at Vom. This could be due to the fact that, the heifers rearing
proportion for Santa herd is high (31.35) and the number of calving to produce a lactating
heifer in the herd is low (3.20). In general, the observed generation interval in this study is
higher than 6.70 to 7 years generation length reported as normal for cattle breeds in the tropics
(Fall et al., 1982). Again, the high number of calving before a lactating heifer could be
produced along with low heifers rearing proportion caused by high pre-weaning calf mortality
is responsible for this observation.
Effect of calf mortality rate on genetic improvement through selection
Genetic gain due to selection at Nkwen, Fundlong and Akum herds is not possible. The
heifers replacement rates in these herds is so low that more than 100 % of the heifers
produced must be retained in order to maintain herd size. It is not possible to employ selection
for genetic improvement, hence the selection intensities at the three herds is 0.00. The
elongated generation intervals of 10.00, 8.70 and 8.00 years further ruled out the possibility of
genetic improvement through selection (Gwaza et al., 2007b). At Njinikong 93.00% of the
heifers produced for replacement must be retained to maintain herd size. The selection
pressure is so low (7.00 %). The larger the number of animals selected, the lower the selection
intensity. Thus, selecting 93% of the heifers gives low selection intensities of 0.14. The low
selection intensities, coupled with the effect of elongated generation intervals of 7.00 years
will undo the little progress made through selection for genetic improvement. At Santa herds,
72.90 % of the heifers will be needed to maintain herd size. The number of calving that
produces a heifer that lactates in the herd is low (3.20). Thus, cows in this herd will be able to
produce more heifers that lactate in the herd than are needed for replacement. The selection
pressure (27.10%) is high compared to the other herds. Thus, selecting 72.90% of the heifers
gives a selection intensity of 0.45. The effect of generation interval of 6.10 years on selection
response will also be low. Hence genetic gain due to selection can be achieved at Santa herd,
because more cow calves survived to lactating age than are required for replacement. The low
performing heifers (27.10%) could be culled from the herd (Gwaza et al., 2007b).
Effects of calf mortality rates on selection for genetic improvement on adaptation of the
Friesian in the tropics
Gwaza et al. (2007b) observed that the effects of calf mortality rates on selection for
genetic improvement indicated that, approximately 154, 93, 125, 73 and 124 percent female
calves will be required as replacement in order to maintain herd size at Nkem, Njinikong,
Fundlong, Santa and Akum respectively. This implied that the cows at Nkem, Fundlong and
Akum will have to produce 154, 125, and 124 percent heifers in order to maintain herd size at
these locations respectively. All the heifers produced must be retained in order to maintain
herd size, no heifer will be rejected, and as such the selection pressures at these herds were
World Scientific News 34 (2016) 1-33
-17-
0.00, 0.00, and 0.00 respectively. The very low selection pressures (0.00) exerted at these herd
would also give selection intensities of 0.00, 0.00, and 0.00 at these herds respectively. Thus
genetic variability that was created through independent assortment of genes segregation and
recombination as random effects gametogenesis and fertilization respectively, were lost to
mortality and never presented to the environmental challenges of the tropics for selection and
adaptation (Gwaza et al., 2007b). This implied that the processes of genetic improvement
through adaptation of the Holstein Freisian in the tropics would be very difficult at these
locations. However, improved management may reverse this trend.
At Njinikong and Santa, where the selection pressures were 7.00 and 27.00 percent
respectively, with corresponding selection intensities of 0.14 and 0.45 respectively. Gwaza et
al. (2007b) noted that genetic improvement through adaptation is possible especially at Santa
herd. Giving low calf mortality, diverse genotype of Holstein Friesian would be presented to
the environmental stress of tropical conditions, superior genotype would then be selected,
improved and become adapted to tropical conditions. This is only possible if the calves are
given maximum protection at early life and are exposed gradually to the tropical challenges
through improved management, giving them adequate time to develop immunity against these
challenges.
Disease prevalence and adaptation of Holstein Friesian cattle on zero grazing in the western
highland regions of Cameroon
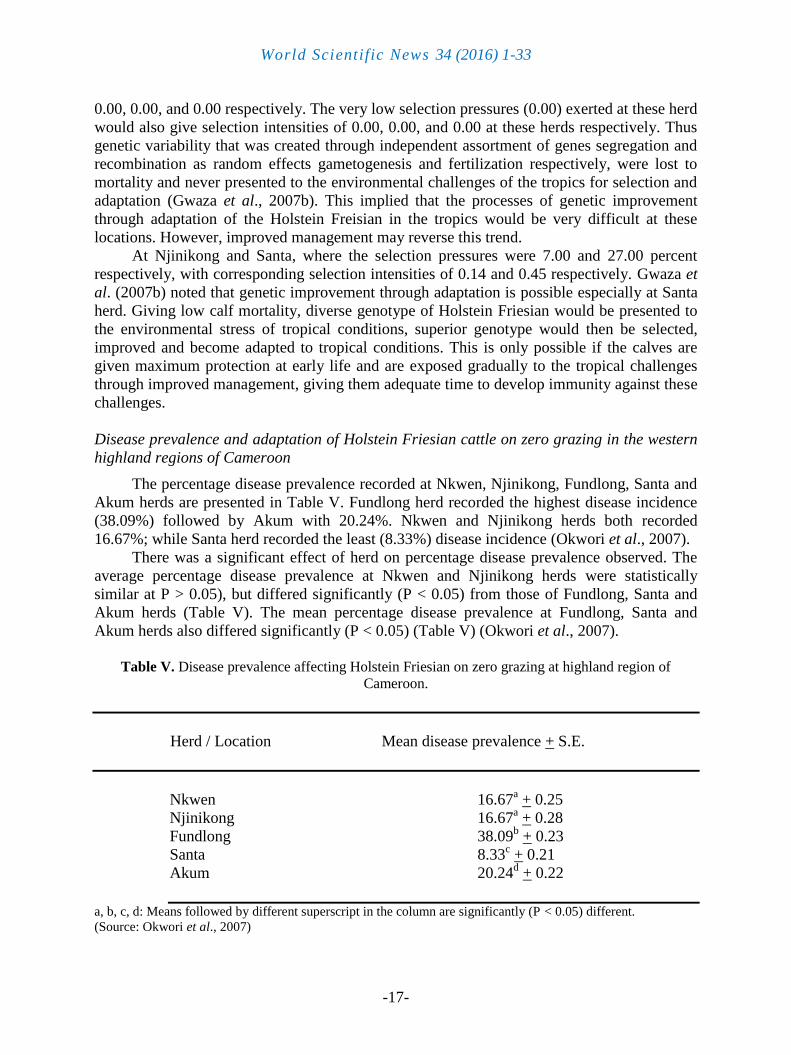
The percentage disease prevalence recorded at Nkwen, Njinikong, Fundlong, Santa and
Akum herds are presented in Table V. Fundlong herd recorded the highest disease incidence
(38.09%) followed by Akum with 20.24%. Nkwen and Njinikong herds both recorded
16.67%; while Santa herd recorded the least (8.33%) disease incidence (Okwori et al., 2007).
There was a significant effect of herd on percentage disease prevalence observed. The
average percentage disease prevalence at Nkwen and Njinikong herds were statistically
similar at P > 0.05), but differed significantly (P < 0.05) from those of Fundlong, Santa and
Akum herds (Table V). The mean percentage disease prevalence at Fundlong, Santa and
Akum herds also differed significantly (P < 0.05) (Table V) (Okwori et al., 2007).
Table V. Disease prevalence affecting Holstein Friesian on zero grazing at highland region of
Cameroon.
Herd / Location Mean disease prevalence + S.E.
Nkwen 16.67a + 0.25
Njinikong 16.67a + 0.28
Fundlong 38.09b + 0.23
Santa 8.33c + 0.21
Akum 20.24d + 0.22
a, b, c, d: Means followed by different superscript in the column are significantly (P < 0.05) different.
(Source: Okwori et al., 2007)
World Scientific News 34 (2016) 1-33
-18-
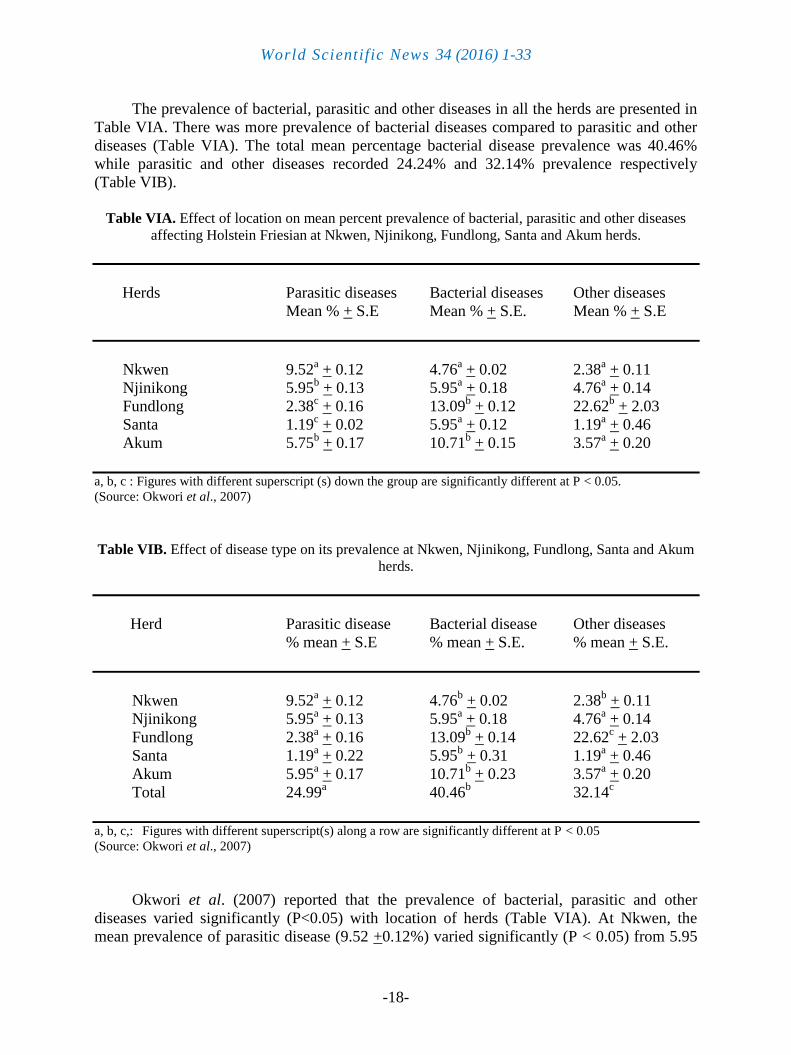
The prevalence of bacterial, parasitic and other diseases in all the herds are presented in
Table VIA. There was more prevalence of bacterial diseases compared to parasitic and other
diseases (Table VIA). The total mean percentage bacterial disease prevalence was 40.46%
while parasitic and other diseases recorded 24.24% and 32.14% prevalence respectively
(Table VIB).
Table VIA. Effect of location on mean percent prevalence of bacterial, parasitic and other diseases
affecting Holstein Friesian at Nkwen, Njinikong, Fundlong, Santa and Akum herds.
Herds Parasitic diseases Bacterial diseases Other diseases
Mean % + S.E Mean % + S.E. Mean % + S.E
Nkwen 9.52a + 0.12 4.76
a + 0.02 2.38
a + 0.11
Njinikong 5.95b + 0.13 5.95
a + 0.18 4.76
a + 0.14
Fundlong 2.38c + 0.16 13.09
b + 0.12 22.62
b + 2.03
Santa 1.19c + 0.02 5.95
a + 0.12 1.19
a + 0.46
Akum 5.75b + 0.17 10.71
b + 0.15 3.57
a + 0.20
a, b, c : Figures with different superscript (s) down the group are significantly different at P < 0.05.
(Source: Okwori et al., 2007)
Table VIB. Effect of disease type on its prevalence at Nkwen, Njinikong, Fundlong, Santa and Akum
herds.
Herd Parasitic disease Bacterial disease Other diseases
% mean + S.E % mean + S.E. % mean + S.E.
Nkwen 9.52a + 0.12 4.76
b + 0.02 2.38
b + 0.11
Njinikong 5.95a + 0.13 5.95
a + 0.18 4.76
a + 0.14
Fundlong 2.38a + 0.16 13.09
b + 0.14 22.62
c + 2.03
Santa 1.19a + 0.22 5.95
b + 0.31 1.19
a + 0.46
Akum 5.95a + 0.17 10.71
b + 0.23 3.57
a + 0.20
Total 24.99a 40.46
b 32.14
c
a, b, c,: Figures with different superscript(s) along a row are significantly different at P < 0.05
(Source: Okwori et al., 2007)
Okwori et al. (2007) reported that the prevalence of bacterial, parasitic and other
diseases varied significantly (P<0.05) with location of herds (Table VIA). At Nkwen, the
mean prevalence of parasitic disease (9.52 +0.12%) varied significantly (P < 0.05) from 5.95
World Scientific News 34 (2016) 1-33
-19-
+0.13% at Njinikong. The mean prevalence of bacterial and other diseases at these two
locations were however statistically similar (P > 0.05). At Fundlong and Santa, the mean
prevalence of parasitic diseases was statistically similar (P > 0.05). The average prevalence of
bacterial and other diseases were significantly (P < 0.05) different at the two locations. At
Akum the prevalence of parasitic disease was statistically similar (P > 0.05) to that at
Njinikong but differed significantly (P < 0.05) from others. The bacterial disease prevalence
was also similar (P > 0.05) to that at Fundlong, but also differed significantly (P < 0.05) from
the other locations. The prevalence of other diseases was similar (P > 0.05) at all locations
except Fundlong (Table VIA).
The effect of disease type on its prevalence at the five herds is presented in Table VIB.
At Nkwen the prevalence of parasitic diseases significantly (P < 0.05) differed from bacterial
and other diseases prevalence. The last two were statistically similar (P > 0.05). The
prevalence of all the disease types was statistically similar (P > 0.05) at Njinikong. The
prevalence of all disease types varied significantly (P < 0.05) at Fundlong; the other diseases
recorded the highest mean percent (22.62 +2.03); while bacterial and parasitic diseases
recorded 13.09 +0.14 % and 2.38 +0.16% respectively (Table VIB). Bacterial diseases
significantly (P < 0.05) recorded higher incidence than parasitic and other diseases at Santa
herd. The prevalence of parasitic and other diseases were statistically similar (P > 0.05) at
Santa and Akum respectively (Table VIB).
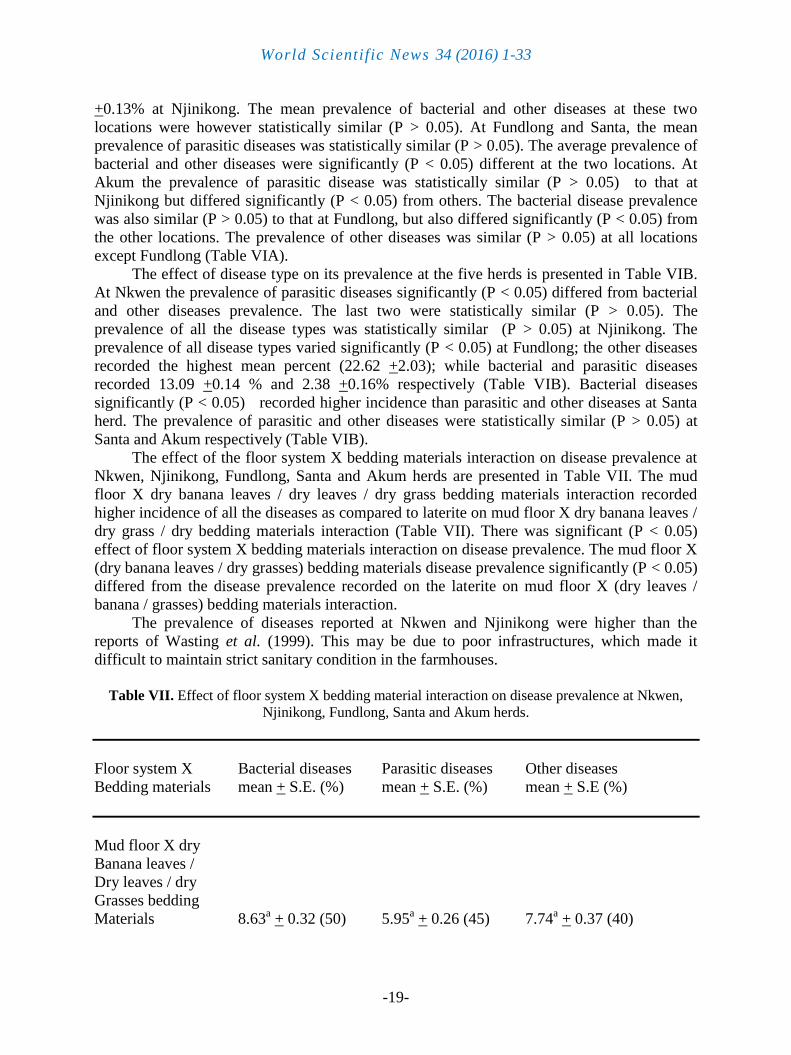
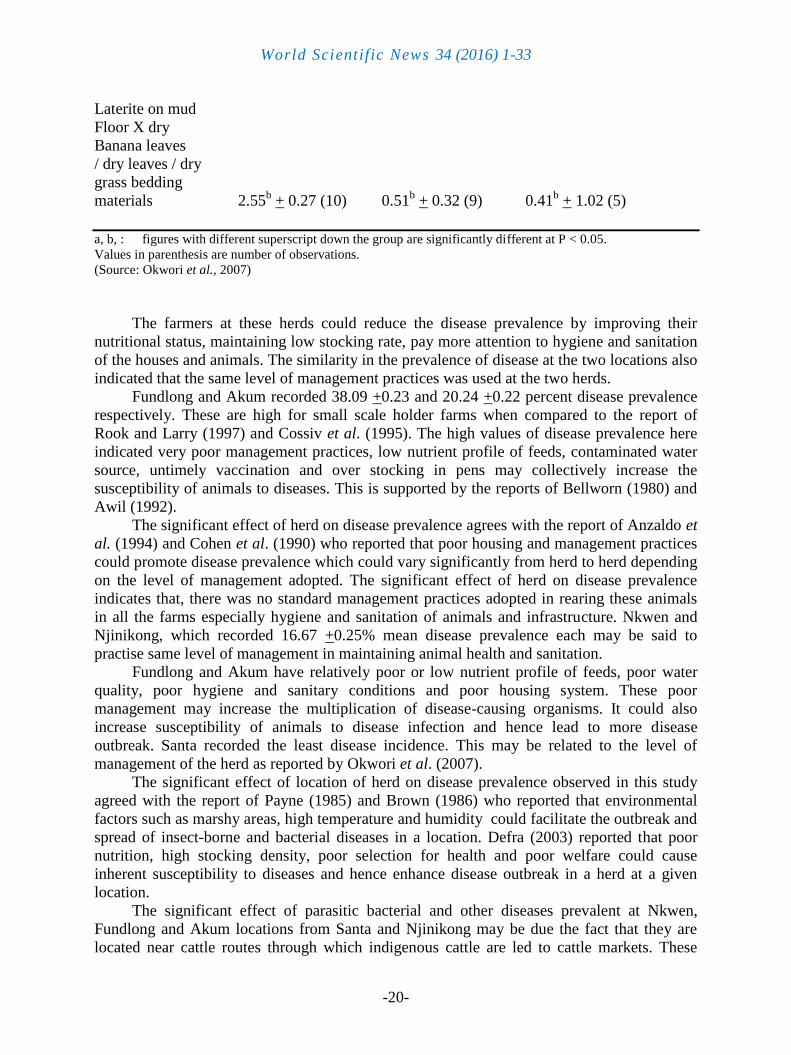
The effect of the floor system X bedding materials interaction on disease prevalence at
Nkwen, Njinikong, Fundlong, Santa and Akum herds are presented in Table VII. The mud
floor X dry banana leaves / dry leaves / dry grass bedding materials interaction recorded
higher incidence of all the diseases as compared to laterite on mud floor X dry banana leaves /
dry grass / dry bedding materials interaction (Table VII). There was significant (P < 0.05)
effect of floor system X bedding materials interaction on disease prevalence. The mud floor X
(dry banana leaves / dry grasses) bedding materials disease prevalence significantly (P < 0.05)
differed from the disease prevalence recorded on the laterite on mud floor X (dry leaves /
banana / grasses) bedding materials interaction.
The prevalence of diseases reported at Nkwen and Njinikong were higher than the
reports of Wasting et al. (1999). This may be due to poor infrastructures, which made it
difficult to maintain strict sanitary condition in the farmhouses.
Table VII. Effect of floor system X bedding material interaction on disease prevalence at Nkwen,
Njinikong, Fundlong, Santa and Akum herds.
Floor system X Bacterial diseases Parasitic diseases Other diseases
Bedding materials mean + S.E. (%) mean + S.E. (%) mean + S.E (%)
Mud floor X dry
Banana leaves /
Dry leaves / dry
Grasses bedding
Materials 8.63a + 0.32 (50) 5.95
a + 0.26 (45) 7.74
a + 0.37 (40)
World Scientific News 34 (2016) 1-33
-20-
Laterite on mud
Floor X dry
Banana leaves
/ dry leaves / dry
grass bedding
materials 2.55b + 0.27 (10) 0.51
b + 0.32 (9) 0.41
b + 1.02 (5)
a, b, : figures with different superscript down the group are significantly different at P < 0.05.
Values in parenthesis are number of observations.
(Source: Okwori et al., 2007)
The farmers at these herds could reduce the disease prevalence by improving their
nutritional status, maintaining low stocking rate, pay more attention to hygiene and sanitation
of the houses and animals. The similarity in the prevalence of disease at the two locations also
indicated that the same level of management practices was used at the two herds.
Fundlong and Akum recorded 38.09 +0.23 and 20.24 +0.22 percent disease prevalence
respectively. These are high for small scale holder farms when compared to the report of
Rook and Larry (1997) and Cossiv et al. (1995). The high values of disease prevalence here
indicated very poor management practices, low nutrient profile of feeds, contaminated water
source, untimely vaccination and over stocking in pens may collectively increase the
susceptibility of animals to diseases. This is supported by the reports of Bellworn (1980) and
Awil (1992).
The significant effect of herd on disease prevalence agrees with the report of Anzaldo et
al. (1994) and Cohen et al. (1990) who reported that poor housing and management practices
could promote disease prevalence which could vary significantly from herd to herd depending
on the level of management adopted. The significant effect of herd on disease prevalence
indicates that, there was no standard management practices adopted in rearing these animals
in all the farms especially hygiene and sanitation of animals and infrastructure. Nkwen and
Njinikong, which recorded 16.67 +0.25% mean disease prevalence each may be said to
practise same level of management in maintaining animal health and sanitation.
Fundlong and Akum have relatively poor or low nutrient profile of feeds, poor water
quality, poor hygiene and sanitary conditions and poor housing system. These poor
management may increase the multiplication of disease-causing organisms. It could also
increase susceptibility of animals to disease infection and hence lead to more disease
outbreak. Santa recorded the least disease incidence. This may be related to the level of
management of the herd as reported by Okwori et al. (2007).
The significant effect of location of herd on disease prevalence observed in this study
agreed with the report of Payne (1985) and Brown (1986) who reported that environmental
factors such as marshy areas, high temperature and humidity could facilitate the outbreak and
spread of insect-borne and bacterial diseases in a location. Defra (2003) reported that poor
nutrition, high stocking density, poor selection for health and poor welfare could cause
inherent susceptibility to diseases and hence enhance disease outbreak in a herd at a given
location.
The significant effect of parasitic bacterial and other diseases prevalent at Nkwen,
Fundlong and Akum locations from Santa and Njinikong may be due the fact that they are
located near cattle routes through which indigenous cattle are led to cattle markets. These
World Scientific News 34 (2016) 1-33
-21-
herds could be infected from cut forages from the infected pasture or contaminated water. Air
borne diseases could be carried easily to these herds. The reports of Anne et al. (2004), Payne
(1985) and Carrey and Fletcheri (1985) that contact of local breeds with exotic breeds could
increase disease prevalence affecting the exotic breed support this view. The variation in
disease prevalence within these three locations is related to different level of management at
each location. Farmers in these locations may reduce prevalence of diseases by avoiding
pasture and water sources contaminated by indigenous cattle breeds. Strict hygiene and
sanitation should be maintained always.
The prevalence of diseases at Santa and Njinikong locations are low although the
prevalence of parasitic and other diseases at Njinikong differed significantly from that at
Santa, the prevalence of bacterial diseases were statistically similar (P > 0.05). This may be
due to that fact that Santa and Njinikong are situated away from the main cattle routes. The
risk of being infected from infected pasture and contaminated water are thus minimized. At
Santa, the village head banned the rearing of indigenous cattle within the village. This could
further reduce the risk of disease transmission from the local breeds; hence the low disease
prevalence observed.
In general, the disease prevalence observed at these two locations does not show good
management. Attention should be given to hygiene and sanitary condition of herds and
infrastructure in order to reduce disease prevalence.
The effect of disease type was significant (P < 0.05) on disease prevalence. The
prevalence of bacterial diseases significantly differed from the prevalence of parasitic and
other diseases. This agrees with the report of Rook and Carrey (1997), Defra (2003) who
reported that poor management will lead to an increase in bacterial diseases like mastitis, foot
and mouth diseases etc. The significant effect of bacterial diseases is an indicator that there is
relatively poor hygiene and sanitation in all the herds. This encourages the multiplication of
bacterial diseases. The significant effect of floor system by bedding materials interaction on
disease prevalence was also reported by Ann et al. (2001) who noted that soiled and dirty
bedding materials could cause high disease prevalence.
Okwori et al. (2007) reported that mud floor X dry banana / grass / leaves bedding
materials interaction recorded higher disease incidence than laterite on mud floor by dry /
banana / grass / leaves bedding materials interaction. This is understandable since muddy
floor could hardly drain water and urine properly as footprints of animals will become
waterlogged. The bedding materials on this floor type could be soiled and dirty either with
urine or over-turned water. This could create enabling environment for multiplication of
disease causing microorganisms. On the other hand, the laterite floor will easily drain water as
it is more compact, hardy and less absorbent than the mud floor. The floor will thus retain less
water and bedding materials on this floor will be relatively drier and less favourable for
multiplication of disease causing microorganisms. This floor system by bedding materials
interaction will therefore record lesser incidence of diseases as observed by Okwori et al.
(2007).
The laterite floor will be easier to maintain than the mud floor. Farmers could therefore
put a layer of laterite on the muddy floors to exploit this advantage. In general, drainages must
be created properly on this floor to allow water and urine drain properly. Bedding materials
must be changed and replaced daily.
World Scientific News 34 (2016) 1-33
-22-
Zero grazing
Zero grazing is a system of feeding ruminant and pseudo-ruminant animals whereby the
animals are not allowed to go to the pasture to graze directly, rather the forage materials from
the pasture are harvested and fed to the animals in their stalls
Under the zero-grazing system, cattle are confined in one place where feed and water are
brought to them. Other animal husbandry activities such as animal health, are also carried out
under this system.
Zero-grazing is a good system for keeping dairy cattle in densely populated, high
potential areas, where land per farm family is small to allow open grazing.
Other dairy cattle rearing systems which also require housing are semi-zero grazing and free
grazing. Different dairy cattle rearing systems have different requirements for housing
although they share some common needs (Ibrahim, 1988).
Climatic differences between the Coastal/hot humid areas and the highland areas
necessitates that there will be slight modifications of the unit depending on where the dairy
cattle are reared. Thus in Coastal and hot humid conditions, more open units which allow for
air circulation will be appropriate.
Generally, the main advantages of the zero-grazing system include the following:
- Cows are confined and therefore use most of the energy from feeds for growth and
milk production.
- Saves land for other enterprises by allowing the use of high yielding forage crops like
Napier grass (Pennisetum purpureum), gamba grass (Andropogon gayanus), ruzi grass
(Brachiaria ruziziensis), Rhodes grass (Chloris gayana), kikuyu grass (Pennisetum
clandestinum), etc.
- Enables on farm clean milk production.
- Good calf rearing is possible
- Manure can be easily collected for the benefit of fodder crops
- The animals are better protected against diseases, especially tick-borne diseases.
- Close observation of the animals is possible, making heat detection and attendance to
animals easier and faster.
- The animals are kept inside which is more secure and protect them from attack by
predators
- Little or no time is spent on herding the animals. Therefore labour for other farm tasks
is saved.
However, there are some disadvantages which include the following:
- Much labour is required to take feed and water to the animals.
- Much capital is required for construction of a „zero-grazing unit.
- The possibility that animals are stressed because of too much confinement inside the
zero grazing unit
- Much labour is needed to clean pens of feed left-over and faeces.
In this review, explanations are given about the layout and construction of a zero-
grazing unit. The guidelines contained here are mainly for farmer-families. The zero grazing
housing system has various areas some of which are essential and therefore must be included
in the structure while others are optional and need not necessarily be part of the unit.
Accordingly, these parts or areas are as follows:
World Scientific News 34 (2016) 1-33
-23-
Basic parts: (These are the very essential parts for better practice of zero grazing)
1. The cubicles (the unit that holds the animal)
2. The walking area (an area for easy movement of both animal and operator)
3. The feed and water troughs (for holding the feed and water for the animal)
4. The milking palour (where are kept and milked)
5. The calf pen (where calves are kept after parturition)
6. The fodder chopping area (where the cut forage materials are put and cut to size for the
animal)
Basic optional Parts: (These parts are optional but if the farmer can afford them, they are also
necessary)
1. The store (where to put materials that are not in immediate use, concentrates milk
utensils, etc.)
2. The manure storage (where the cleared feed left-over and faeces are put before
evacuation to the farm, a dug-out pit)
3. Fodder cutter (instrument for chopping the forage materials)
4. Roof water catchment (a roof construction for water harvest to tide over period of water
scarcity)
5. Water tank (for storage of water)
6. A holding crush (for easy handling of the animal especially during treatment)
Zero-grazing system requires intensive (i.e. a lot of) labour for cutting and carrying
forage crops (e.g. Pennisetum purpureum; which is very bulky), milking and carrying water
and other feed materials to the animals. This means that the tasks of some of the farm-family
members may increase. Proper planning is therefore required before starting a zero-grazing
system. This will enable the farmer to appreciate the high financial and labour demands of
zero-grazing before getting involved (Ibrahim, 1988).
Because zero-grazing requires a lot of initial capital for the construction of the unit, it
can be done in phases by first constructing the essential parts of a zero-grazing unit. The
optional parts can then be added as money becomes available.
One option is starting with semi-zero grazing as a first phase before turning to full zero-
grazing unit. This can be the case where farm size is large enough to allow for free grazing.
The basic parts in a semi-zero-grazing system are the feed and water troughs and the milking
place. The cubicles and walking area are optional.
These options, in zero-grazing and semi zero-grazing, are necessary when you have
inadequate fund and cannot meet the labour and high skills demanded by zero-grazing
immediately.
The following are strongly-recommended as considerations during construction of a
unit:
1. Ensure that the correct site, considering the direction of wind, is chosen for the unit.
The choice of site influences the security and protection of animals from rain, sunshine
and other weather effects.
2. The unit should be closer to the house and on the opposite side of the wind. The
location of the unit in relation to the house should ensure minimal smell from manure
World Scientific News 34 (2016) 1-33
-24-
pit. It should be noted that it is more important to protect an animal from the rain than
from wind or sunshine.
3. Ensure that the person carrying out the construction work is properly supervised by a
Livestock Extension Officer. This is necessary because some parts (i.e. walking area,
troughs) once constructed are permanent. Mistakes made during construction can be
very costly.
4. Use of local materials for construction of the unit will reduce cost.
5. Finally, one should as much as possible, carry out regular maintenance of the zero-
grazing unit while in use. This is usually very important for the walking area.
The health of the animal at any point in time is very important and should be adequately
provided for particularly that the animals are not allowed to move out. This is because a
milking cow that is happy and content with no stress will produce the highest amount of milk.
If cows weren't content living in free-stall barns, then the volume of milk would not be near as
high. Also, quality of milk is determined by the rations that cows are fed. By controlling the
rations and making a mixed ration served to cow, the farmer is not only producing high
quality milk, but also keeping his or her cows as healthy as possible. The quality is not
determined solely by the rations, or solely by the habitat. Both are very important.
This system can allow for the utilization of once inaccessible land, reduce damage to
soils, extend the grazing season and increase grass intake, resulting in higher milk production.
Less concentrates can be used in feed, arguably due to the increase of quality grass in the
forage, which can be a huge money saver and catalyst toward higher profits.
This system can lead to diversification in the farming system. This can be possible as
individuals who cannot afford to own cows can go into producing good quality forage crops
and sell these to the animal farmers who may not be able to combine the cropping of forage
crops and, at the same time keep animals. Or who may not have access to enough land the
way the forage crop farmers may have.
Potentials of the holstein friesian on zero grazing for diversification of rural livestock
production, rural dairy production, employment, poverty alleviation and food security
in the tropics
Inferring from the performance and values from the rural dairy production reports from
the highland regions of Cameroon, it is evident that this technology can be adopted by other
countries under similar tropical conditions for integration into their rural livestock production
programmes. This, if achieved, will not only diversify rural livestock production, but may
also provide employment for the rural youths (rural dairy producers, fodder crop producers,
milk and milk product vendors, feeders, etc. to modernized dairy enterprises or industries).
This may also assist in improving the nutritional status of the rural populace. Proceeds
from the rural dairies may also stabilise rural farmers during crop failures or may provide
additional support to increase crop production for food security. The sum total of these will
improve the economy and standard of living of the rural dwellers thereby reducing poverty.
This may not only improve on the socio-cultural lives of the rural people, but may over time,
grow to attract further development and draw other social amenities closer to the rural
dwellers.
World Scientific News 34 (2016) 1-33
-25-
5. CONCLUSIONS AND RECOMMENDATION
Conclusions
The mean age at first calving were higher due to sire effects, the breeding techniques of
maintaining a central bull for several farmers and other management techniques employed.
Calving interval and calf birth weight were appreciable, they were however affected by the
poor management techniques employed by the farmers. The mean gestation length was low;
despite the poor management. The percentage calf mortalities were high, varied across herds
indicating the absence of routine uniform management techniques. In some herds, the cow
must calve many times before it is able to produce a heifer that would replace it. In others, all
the heifers produced must be retained in order to maintain herd size. The generation intervals
were elongated due to the several calving a cow must have before it is able to produce a
replacement for itself. The genotypic diversity created through independent assortment,
segregation and recombination of genes as random effects through gametogenesis and
fertilization respectively were lost to calf mortality and never presented to the environmental
challenges of the tropics for selection and adaptation. The few genotypes that survived were
introduced into the stressful (harsh climatic, poor housing, high disease prevalence)
environmental conditions of the tropics often too early and sudden, with no time to allow
them develop resistance techniques to enhance their survival and adaptation in the tropics.
There were high incidences of disease prevalence which also varied across herds, locations,
types of bedding materials used and follr type in the housing. The reproductive performance
of the herds the survival of some calves and the lactation of the dams did indicate that this
breed can be integrated into the tropical conditions.
Recommendations
There is need for interested countries, agencies, organizations and individuals interested
in this technology to review and redesign a low cost housing type directed towards
maintaining herd health and insist that their beneficial farmer families provide this housing
first, before they acquire their animals. This will improve herd health; introduce the calves
into the challenging tropical conditions gradually allowing them time to build their immunity
to prevalent stress and increase calf crop.
There is also need to design standard but affordable routine management techniques and
train all beneficial farmer families and ensure thorough extension services and supervision
that these management techniques are followed. This will provide an initial protection
especially to the calves at their early fragile life and give them room to react to the tropical
stress gradually to evolve their adaptive strategy for fitness, stabilization and integration.
The zero grazing system can lead to diversification in the farming system and should be
encouraged. This is because individuals who cannot afford to own cows can go into
producing good quality forage crops and sell these to the animal farmers.
Quality of milk is determined by the rations that cows are fed. By controlling the rations
and making a mixed ration served to cow, the farmer is not only producing high quality milk,
but also keeping his or her cows as healthy as possible. The quality is not determined solely
by the rations, nor solely by the habitat. Both are very important.
There is need to review and reduce the number of farmer groups attached to a central
bull. This will ensure that all heifers attached to a bull have successful services. This will
World Scientific News 34 (2016) 1-33
-26-
reduce the high age at first calving observed due to loss of heat periods arising from services
that do not produce conception or inability of the bull to serve.
There is need for policy makers, agencies and Agricultural Authorities in tropical
countries to take advantage of the potentials of this laudable programme. This can be done by
identifying locations in each deserving country with more favourable climatic conditions for
this breed, introduce the rural farmers to a cheap but well-designed housing system, provide
extension services for good management and disease control.
References
[1] Akinokun, J.O. (1970). Genetics in the improvement of livestock production; Nigerian
Journal of Genetics. 1: 28-37.
[2] Almando, T.P. (1986). Conservation of Animal genetic resources, Brazil National
Programme, In: FAO Animal Production and health paper No. 06. Animal genetic
resource, strategies for improved use and conservation, 165-175.
[3] Animal welfare information Centre (AWIC) (1992). Environmental enrichment
information resource for Non-human primates. AWIC News 5(4) 1-2, 8.
[4] Anne Schuchal, Tami, E., Elizabeth, Z.R. and Lee, H. (2001). Tick and tick-borne
bacterial diseases, Vol.7, No. 1.
[5] Anzaldo, A.J., Harison, P.C., Maghirang, G.L. and Gonyou, H.W. (1994). Increasing
welfare of laboratory Rats with help of spatially enhanced cages. AWIC News 5(3): 1-2,
5.
[6] Azzam, S.M., Kinder, J.E., Nieisen, M.K., Werth, L.A., Gregory, K.E., Cundiff, L.V.
and Roch, R.M. (1993). Environmental effects on neonatal mortality of beef calves. J.
Anim. Sci. 71: 282-290.
[7] Bailey, G.L. and Boister, W.H. 1954. The influence of live weight on milk production
during the first lactation. J. of Dairy Research 2: 5-9.
[8] Becker, A.W. (1992). Manual of quantitative genetics, Fifth Edition, publisher Pullman,
WA 99163-9666, U.S.A.
[9] Becker, A.W. (1972). Manual of Quantitative genetics. Fifth edition, Publisher Pullman,
WA99163-9666, U S A.
[10] Bellhorn, R.W. (1980). Lightening in the Animal Environment, Laboratory Animal
Science, 30 (part II). Pp. 440-450.
[11] Brakel, W.J., Rife, D.C. and Salisbury, S.M. (1952). Factors associated with duration of
gestation length in Dairy cattle. J. Dairy Sci. 35: 179-194.
[12] Brown, D.E. (1986). Transportation stress. Limiting the effect of stress on cattle. West
Reg. Pub. No. 009. 77-80.
[13] Carrey, D.H. and Fletcher, S.M. (1986). An evaluation of management practices used
by Southern Dairy farmers. J. Dairy Science. 69: 2458-2464
World Scientific News 34 (2016) 1-33
-27-
[14] Cohen, R.D.H., King, B.D., Thomas, L.R. and Jangen, E.D. (1990). Efficacy and stress
of chemical versus surgical castration of cattle. Cam J. Animal Science, 70: 1063-1072.
[15] Cossivi, Mushin, F.X., Dabon, C.J. and Grange, J.M. (1995). Epidemiology of
Mycobacterium bovis infection in animals and humans with particular reference to
Africa; Rev. Sci. Tech. Off. Int. Epi. 14(3): 733-746.
[16] Defra (2003). Consultation. April 2003 policy paper 04/24/2003. Animal Health welfare
strategy for Great Britain.
[17] Ehiobu, N.G. and Solomon, O.B. (1998). Mortality rates of Friesian cattle in relation to
genetic improvement in tropical environment. Proceeding: Silver Jubilee Anniversary
Conference of NSAP. Paper No. 145, March 21-25th
. 1998.
[18] Ehoche, O.W.A., Malau-Adulla, E and Abubakar, B.Y. (1992). Factors affecting birth
weight and growth rate in Friesian X Bunaji calves. Nigerian J. of Animal Sci. No. 6.
pp. 100-105.
[19] Fall, A., Diop, M., Sandford, Jennifer, Nisseog, Y.J., Paajin and Trial, J.C. (1982).
Evaluation of the productivities of Djallonke sheep and N‟dama cattle at the Centre de
Recherches, Zoo techniques, Kolda Senegal; ILCA, Res. Rep. No. 3: 40-70.
[20] Goddard, M.E. (1978). Animal Breeding. In: Beef cattle production in the Tropics. R.M
Murray and K.W. Entwinstle (Eds). 123-156.
[21] Gwaza, D.S,, Okwori, A.I., Fombah, E.M. and Abu, A.H. (2007a). A retrospective
study on reproduction and dairy performance of Holstein Friesian on zero grazing in the
Western highland regions of Cameroon. Livestock Research for Rural Development
(LRRD) 19 (4). 1 – 10. http://lrrd.org/lrrd19/4/gwaz19057
[22] Gwaza, D.S,, Okwori, A.I. and Fombah, E.M. (2007b). Calf mortality and its effects on
genetic improvement due to selection of Holstein Friesian Herds under local farmers at
the Western highland Regions of Cameroon. Journal of Tropical Agricultural Research
23: 40-44
[23] Ibrahim K.M. (1988). Forage Plant Development and Extension in Kenya. AG;
DP/KEN/84/007 Technical Report 34-36, Rome, Italy.
[24] Itammon, K. and Leicth, M. (1995). World Animal Review. A quarterly Journal on
Animal health, Production and products. Vol. 84 / 85. 1995 / 3-6.
[25] James, R.E., McGilliard, M.L. and Hartman, D.A. (1984). Calf mortality in Virginia
Dairy Herd Improvement herds. J. Dairy Sci. 67(4): 908-911.
[26] Jennifer, Sandford, Y.J., Wissocq, J., Durkin and J.C.M. Trial. (1982). Evaluation of the
productivities of Djallonke sheep and N‟dama cattle at the Centre de Recherches,
Zootechniques Kolda, Senegal, ILCA Research Report, No.5; pp. 44-45.
[27] Johanson, J.m. and Berger, P.J. (2003). Birth weight as a predictor of calving ease and
perinatal mortality in Holstein. J. Dairy Sci. 86(11): 3745-3755.
[28] Joubert, D.N. 1961. Duration of pregnancy of south Afr. Friesian cattle. S. Afr. J. Agric.
Sci. 4, 467-472.
World Scientific News 34 (2016) 1-33
-28-
[29] Kilfaro, G.C. (1995). Performance of exotic dairy cattle in the Southern highlands of
Tanzania and prospects for genetic improvement. Ph.D. Thesis & U.A. pp. 291.
[30] Knudsen, P.B. and Sohael, A.S. (1970). The Vom herd. A study of the performance of
mixed Friesian Zebu herd in a Tropical environment. Trop. Agric., (Trnid) 47(3): 189-
203.
[31] Martin, S.W., Schwabe, C.W. and Franti, C.E. (1975). Dairy calf mortality rate:
Influence of management and housing factors on calf mortality rate in Tulare county,
California. Am. J. Vet. Res. 36(08): 1111-1114.
[32] Mbap, S.T and Ngere, L.O. (1988). Productivity of Friesian cattle in Sub-tropical
environment. Trop. Agric. (Trnid). Vol. 66. No. 2: pp. 121-124.
[33] Mbap, S.T. 1996. A note heritability estimates of birth weight and calving interval of
White Fulani cattle. Nigerian Journal of Animal Production. Vol. 23. No. 122. pp. 101-
102.
[34] McDoweil, R.F. (1972). Improvement of livesock production in warm climates, San
Fransisco, W.H. Freeman and Co.
[35] Mrode, R.A. and Akinokun, O. (1986). Genetic parameters and factors affecting
reproductive performance in White Fulani cattle in Southern Nigeria. Trop. Anim. Hlth.
And Prod. 18: 81-154.
[36] Ogata, Y., Nakao, T., Takahashi, K., Abe, H., Misawa, T, Urushiyama, Y. and Sakai, J.
(1999). Intra-uterine growth retardation as a cause of perinatal mortality in Japanese
Black beef calves. J. Vet. Med. A. 46: 329-334.
[37] Okwori, A.I., Gwaza, D.S. and Fombah, E.M. (2007). Disease prevalence affecting
Holstein Friesian cattle on zero grazing at the Western highland Regions of Cameroon.
Journal of Tropical Agricultural Research 23: 50-55.
[38] Oni, O.O., Buvarnendran, V. and Dim, N.I. (1989). Estimates of genetic and phenotypic
parameters for body weight in Bunaji (White Fulani) cattle. Trop. Agric. (Trinid) 65:
369-371.
[39] Osei, S.A.K., Eltah-Baale and P. Karikari. (2004). The reproductive p;erformance of
Friesian cattle breed in the hot humid zone of Ghana. Unpublished research supported
by International Atomic Energy Agency, Vienna and the Government of Netherlands
under Research contract No. 4825 / NL.
[40] Oyedipe, E.A., Buvarnendran, V. and Eduvie, I.O. (1982). Some factors affecting the
reproductive performance of White Fulani (Bunaji) cattle. Trop. Agric. (Trinid) 39: 231-
234.
[41] Payne, W.J.A. (1951). Records from the dairy herd at Singatoria for the Decade (1941-
1950). Anial breeding Abstract 230: 1006.
[42] Payne, W.J.A. (1985). Disease and parasites of livestock in the tropics. Pp. 100-105.
[43] Rachnefeed, A.T., Kress, D.O., Burfering, P.J. and Fredrick, R.A. (1980). Sire X region
of U.S. and herd interaction effect on calving ease and Birth weight. J. Anim. Sci. 55:
765-769.
World Scientific News 34 (2016) 1-33
-29-
[44] Rege, J.E.O., Rook, J.S. and Rendel, J. (1992). Genetic Analysis of Reproductive and
Productive performance of Friesian cattle in Kenya. I. Genetic and phenotypic
parameters. J. Anim. Breed. Genet. 108: 412-423.
[45] Rendel, J. (1972). Dairy cattle in hot climate. World Rev. Anim. Prod. 8: 16-24.
[46] Rooks, J.S. and Larry, A.K. (1997). Effect of management level on prevalence of
bacterial and parasitic diseases in the tropics. Unpublished research paper.
[47] Singh, O.N., Singha, B.O. and Singh, B.P.S.R. (1958). Environmental and hereditary
causes of variation in gestation of Tharparker cows. Indian J. of Dairy Sci. 11: 109-112.
[48] Steele, R.G.D. and Torrie, J.H. (1980). Principles and Procedures of Statistics: A
Biometrical Approach. 2nd
. Ed. McGraw- hill. London, U.K. 633 pp.
[49] Stephen, S.K. (2000). Comparative performance of Dairy cattle under large scale and
small holder dairy farms in Tanzania: A Review, Deparment of Animal Science and
Production, Sokoine University of Agriculture, P.O. Box 3224. Morogoro
[50] Stetshwaelo, L.L. and Adebambo, A.O. (1989). Genetic conservation of domestic
livestock. Vol. 2: Ed. Lawrence Anderson Imres. Bodo, CAB International,
Wallingford. Pp. 87-102.
[51] Vesely, J.A. and Robinson, O.W. (1971). Genetic and maternal effects of pre-weaning
growth and types scores in beef calves. J. Anim. Sci. 32: 825-831.
[52] Wasting, J.M., Akanmori, B.D. and William, D.J.I. (1999). Zoonoses in West Africa.
Impact and Control. Para-psychology Today. 15 (8): pp. 309-311.
[53] Wheat J.D. and Riggs, J.K. (1958). Heritability and Repeatability of gestation length in
beef cattle. J. Anim. Sci. 17: 248-253.
( Received 12 December 2015; accepted 27 December 2015 )
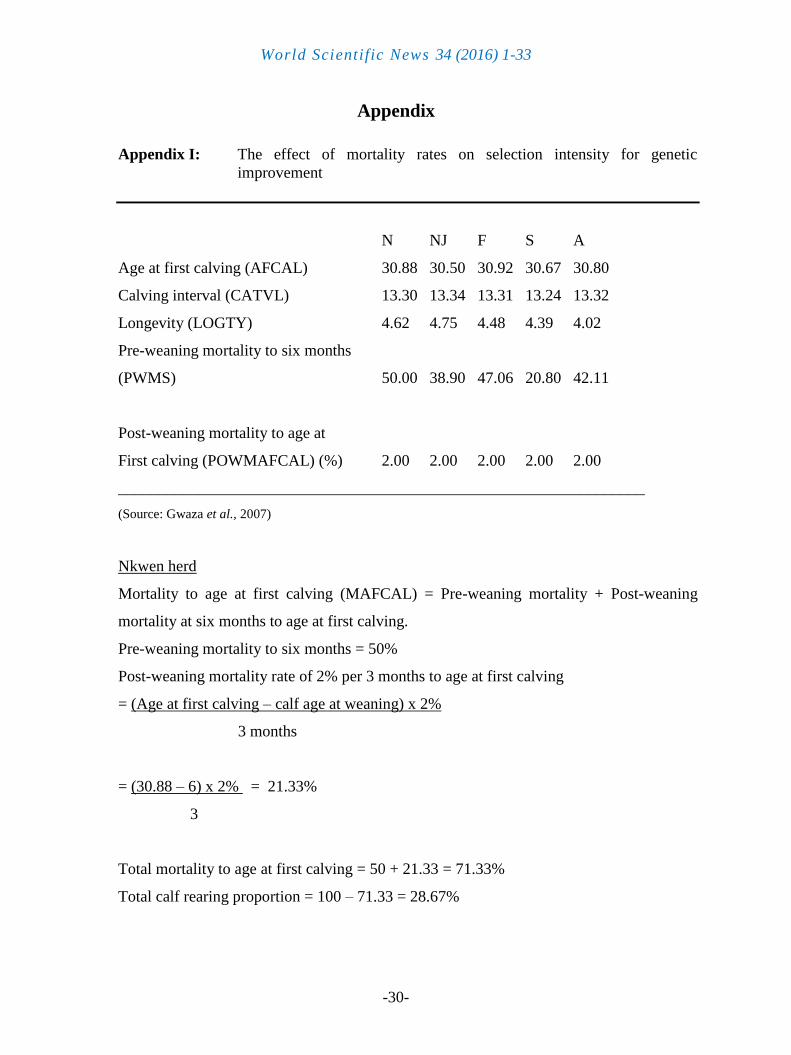
World Scientific News 34 (2016) 1-33
-30-
Appendix
Appendix I: The effect of mortality rates on selection intensity for genetic
improvement
N NJ F S A
Age at first calving (AFCAL) 30.88 30.50 30.92 30.67 30.80
Calving interval (CATVL) 13.30 13.34 13.31 13.24 13.32
Longevity (LOGTY) 4.62 4.75 4.48 4.39 4.02
Pre-weaning mortality to six months
(PWMS) 50.00 38.90 47.06 20.80 42.11
Post-weaning mortality to age at
First calving (POWMAFCAL) (%) 2.00 2.00 2.00 2.00 2.00
__________________________________________________________________
(Source: Gwaza et al., 2007)
Nkwen herd
Mortality to age at first calving (MAFCAL) = Pre-weaning mortality + Post-weaning
mortality at six months to age at first calving.
Pre-weaning mortality to six months = 50%
Post-weaning mortality rate of 2% per 3 months to age at first calving
= (Age at first calving – calf age at weaning) x 2%
3 months
= (30.88 – 6) x 2% = 21.33%
3
Total mortality to age at first calving = 50 + 21.33 = 71.33%
Total calf rearing proportion = 100 – 71.33 = 28.67%
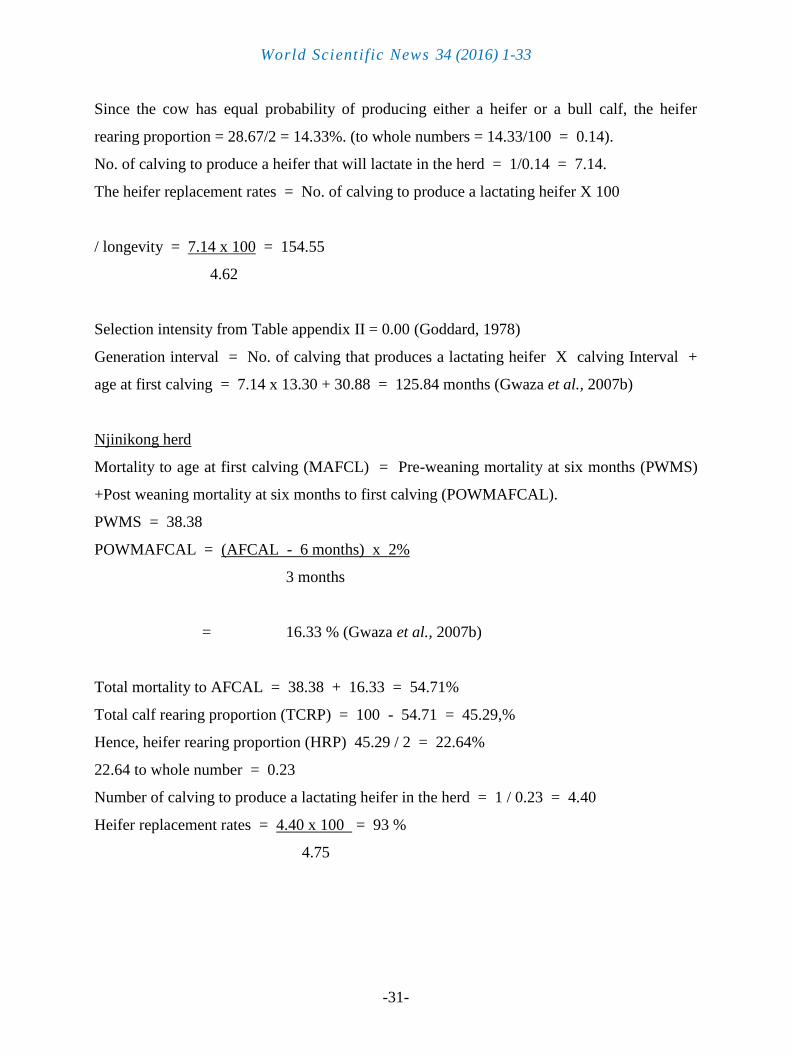
World Scientific News 34 (2016) 1-33
-31-
Since the cow has equal probability of producing either a heifer or a bull calf, the heifer
rearing proportion = 28.67/2 = 14.33%. (to whole numbers = 14.33/100 = 0.14).
No. of calving to produce a heifer that will lactate in the herd = 1/0.14 = 7.14.
The heifer replacement rates = No. of calving to produce a lactating heifer X 100
/ longevity = 7.14 x 100 = 154.55
4.62
Selection intensity from Table appendix II = 0.00 (Goddard, 1978)
Generation interval = No. of calving that produces a lactating heifer X calving Interval +
age at first calving = 7.14 x 13.30 + 30.88 = 125.84 months (Gwaza et al., 2007b)
Njinikong herd
Mortality to age at first calving (MAFCL) = Pre-weaning mortality at six months (PWMS)
+Post weaning mortality at six months to first calving (POWMAFCAL).
PWMS = 38.38
POWMAFCAL = (AFCAL - 6 months) x 2%
3 months
= 16.33 % (Gwaza et al., 2007b)
Total mortality to AFCAL = 38.38 + 16.33 = 54.71%
Total calf rearing proportion (TCRP) = 100 - 54.71 = 45.29,%
Hence, heifer rearing proportion (HRP) 45.29 / 2 = 22.64%
22.64 to whole number = 0.23
Number of calving to produce a lactating heifer in the herd = 1 / 0.23 = 4.40
Heifer replacement rates = 4.40 x 100 = 93 %
4.75
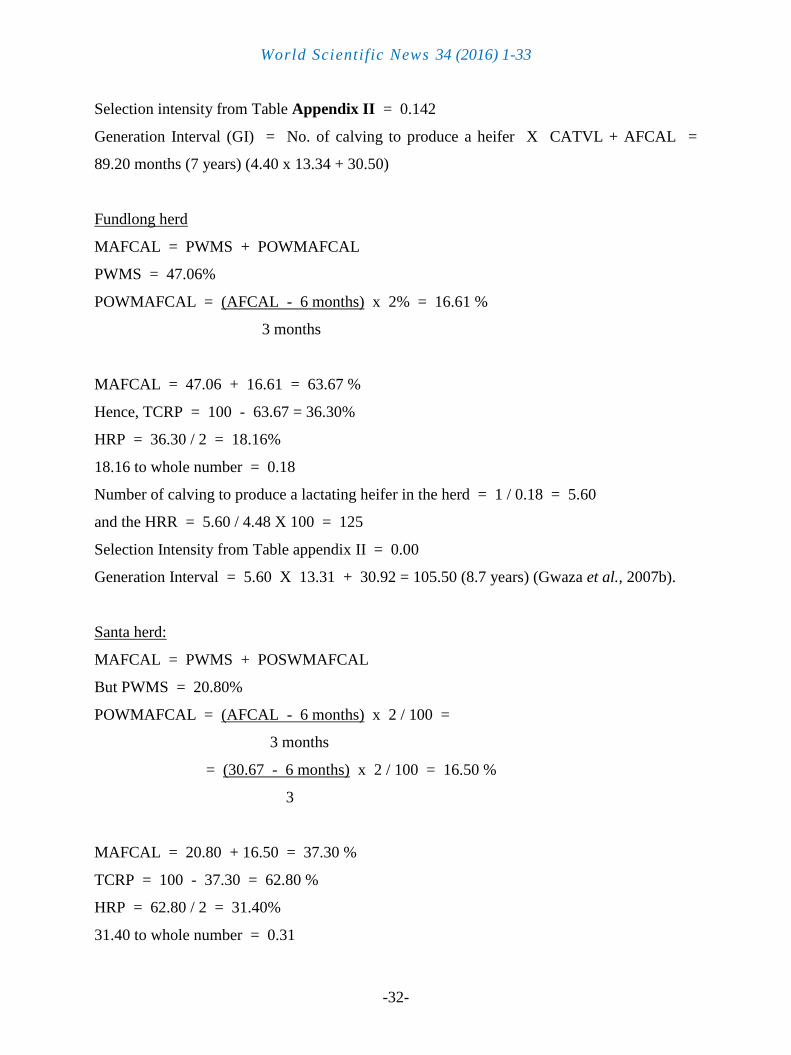
World Scientific News 34 (2016) 1-33
-32-
Selection intensity from Table Appendix II = 0.142
Generation Interval (GI) = No. of calving to produce a heifer X CATVL + AFCAL =
89.20 months (7 years) (4.40 x 13.34 + 30.50)
Fundlong herd
MAFCAL = PWMS + POWMAFCAL
PWMS = 47.06%
POWMAFCAL = (AFCAL - 6 months) x 2% = 16.61 %
3 months
MAFCAL = 47.06 + 16.61 = 63.67 %
Hence, TCRP = 100 - 63.67 = 36.30%
HRP = 36.30 / 2 = 18.16%
18.16 to whole number = 0.18
Number of calving to produce a lactating heifer in the herd = 1 / 0.18 = 5.60
and the HRR = 5.60 / 4.48 X 100 = 125
Selection Intensity from Table appendix II = 0.00
Generation Interval = 5.60 X 13.31 + 30.92 = 105.50 (8.7 years) (Gwaza et al., 2007b).
Santa herd:
MAFCAL = PWMS + POSWMAFCAL
But PWMS = 20.80%
POWMAFCAL = (AFCAL - 6 months) x 2 / 100 =
3 months
= (30.67 - 6 months) x 2 / 100 = 16.50 %
3
MAFCAL = 20.80 + 16.50 = 37.30 %
TCRP = 100 - 37.30 = 62.80 %
HRP = 62.80 / 2 = 31.40%
31.40 to whole number = 0.31
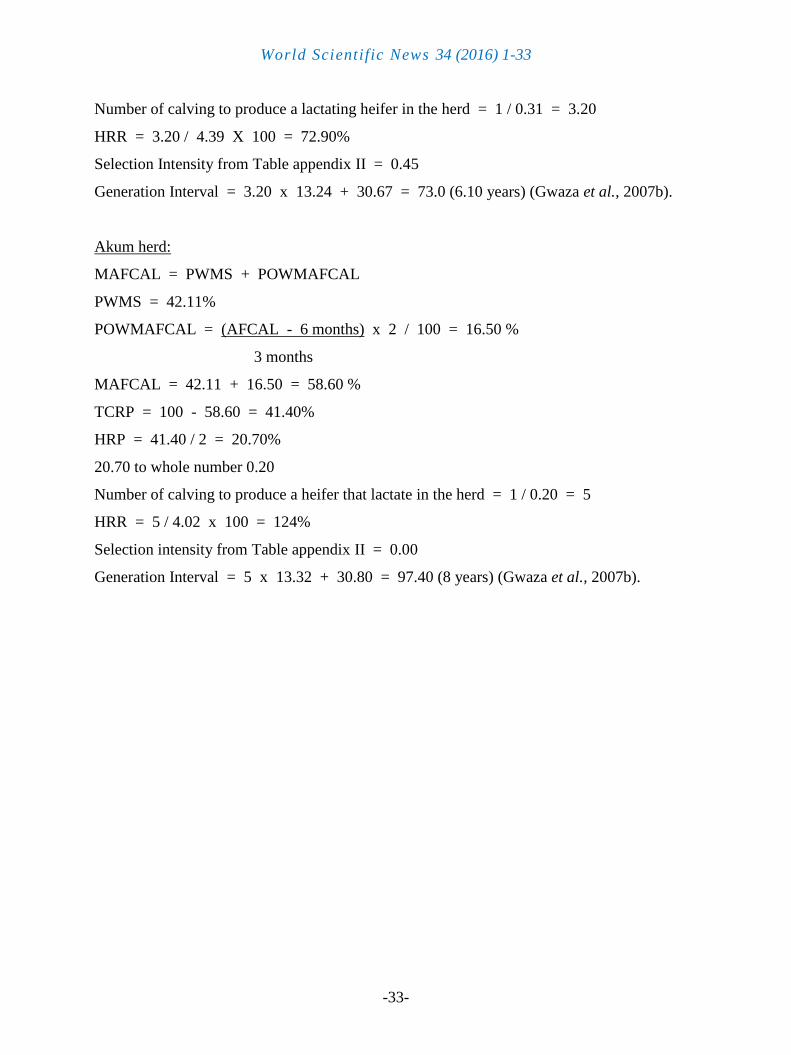
World Scientific News 34 (2016) 1-33
-33-
Number of calving to produce a lactating heifer in the herd = 1 / 0.31 = 3.20
HRR = 3.20 / 4.39 X 100 = 72.90%
Selection Intensity from Table appendix II = 0.45
Generation Interval = 3.20 x 13.24 + 30.67 = 73.0 (6.10 years) (Gwaza et al., 2007b).
Akum herd:
MAFCAL = PWMS + POWMAFCAL
PWMS = 42.11%
POWMAFCAL = (AFCAL - 6 months) x 2 / 100 = 16.50 %
3 months
MAFCAL = 42.11 + 16.50 = 58.60 %
TCRP = 100 - 58.60 = 41.40%
HRP = 41.40 / 2 = 20.70%
20.70 to whole number 0.20
Number of calving to produce a heifer that lactate in the herd = 1 / 0.20 = 5
HRR = 5 / 4.02 x 100 = 124%
Selection intensity from Table appendix II = 0.00
Generation Interval = 5 x 13.32 + 30.80 = 97.40 (8 years) (Gwaza et al., 2007b).