Embed Size (px)
Citation preview

Emission allowance origination and trading: How does it affect ABB and its Group Treasury Operations?
Jonas Lindqvist Linus Lund
Production Economics
Master’s Thesis Department of Management and Engineering
LIU-IEI-TEK-A--09/00537--SE

This page is intentionally left blank.
Emission allowance origination and
trading – How does it affect ABB and its Group Treasury
Operations?
Master’s Thesis carried out at the
Department of Management and Engineering,
Linköping Institute of Technology
and at ABB
by
Jonas Lindqvist and
Linus Lund
LIU‐IEI‐TEK‐A‐‐09/00537‐‐SE
Supervisors
Peter Hultman (IPE)
Pawel Skala (ABB)

This page is intentionally left blank.

Abstract The purpose of the thesis is to determine how ABB’s treasury department (GTO) should respond to an increasing awareness and interest in the carbon credit markets. Emission caps have been introduced on national levels and also for certain industries in Europe as a consequence of the Kyoto Protocol. This allows for trading of certain carbon credits as well as for the creation of new credits. ABB is a company which has many solutions for efficient energy use; solutions that aim to reduce electricity cost and in the prolongation also emissions. The awareness of the carbon market is growing within ABB, but no carbon credit generating projects have been completed and the initiatives are scattered.
The thesis describes the Kyoto Protocol and its implementation within EU, the markets available for trading by companies as well as what instruments and derivatives exist. With the underlying regulations described an empirical study of ABB’s involvement is conducted. The study shows that ABB has few installations with emissions caps and that the potential for generating new credits as a way to increase profit is quite big. However, there have been no carbon generating projects registered up to this point and there are many barriers to overcome before ABB receives any carbon credits.
To ensure a thorough analysis, a model of factors affecting ABB’s carbon credit involvement is formed. The model is based on the available literature on the subjects organizational performance, transfer pricing, project‐ and financial risk and risk management.
GTO’s immediate response should be to set up a pool to which subsidiaries with compliance requirements are to send their carbon credits. The pool will then redistribute the credits so that each subsidiary’s needs are fulfilled and finally settle the net remainder on the open market. A unit independent of GTO, called Group Carbon Operations (GCO) in the thesis, should be formed in the near future with responsibility to actively follow the progress of CDM pilot projects and to facilitate their implementation.
Depending on the outcome of these pilot‐projects ABB can then either, in case of a negative outcome, quickly end the direct CDM involvement and reach closure or, in case of a positive outcome, further develop the GCO department to profit from ABBs involvement in the CDM market. In case of a positive outcome, the GTO should be further involved regarding risk handling and internal pricing.

Sammanfattning Syftet med denna studie är att avgöra hur ABBs treasuryavdelning (GTO) bör reagera på den allt större medvetenheten och potentialen i utsläppsrättsmarknaden. Utsläppstak har introducerats för länder runt om i världen och även för vissa industrier i främst Europa som en konsekvens av Kyoto Protokollet. Detta skapar möjligheter att handla med utgivna utsläppsrätter och derivat på dessa samtidigt som nya utsläppsrätter kan generereras genom utsläppsreducerande projekt. ABB är ett företag vars produktportfölj till stor del utgörs av energieffektiva lösningar vars syfte ofta är att reducera energianvändning och i förlängningen därmed även utsläppen. Medvetenheten om utsläppsrättsmarknaden växer inom ABB, men ännu har inga utsläppsrättsgenererande projekt färdigställts och initativen som är tagna är spridda inom organisationen.
Denna studie beskriver Kyoto Protokollet och dess implikationer, främst inom EU, samt de tillgängliga marknaderna, instrumenten och derivaten. Efter att denna underliggande information inhämtas följer en grundläggande empirisk studie av ABBs involvering i utsläppsrättsmarknaden. Studien visar att ABB har några få installationer med utsläppsregleringar och att potentialen för generering av nya utsläpprätter via utsläppsreducerande projekt är stor. Inga projekt har ännu ej registrerats för utsläppsrättsgenerering och det finns ett flertal barriärer som måste övervinnas innan ABB får nya utsläpprsätter i sin ägo.
För att säkerställa att analysen av frågeställningen blir uttömanade skapas en analysmodell innehållande de faktorer som påverkar ABBs involvering på utsläppsrättsmarknaden. Modellen baseseras på tillgänglig litteratur i ämnena organisation, internprissättning, projekt‐ och finansiell risk samt riskhantering.
GTOs direkta respons bör vara att skapa en utsläppsrättspool, till vilken de installationer med utsläppstak ska överföra sina tilldelade utsläppsrätter. Via poolen kommer sedan utsläppsrätterna distribueras så att alla installationer kan möta utsläppstaken och kvarstoden kan sedan köpas eller säljas på marknaden.
Dessutom bör en av GTO organisatorisk oberoende enhet, kallad Group Carbon Operations (GCO) i uppsatsen, skapas som aktivt ska följa utvecklingen av CDM pilotprojekten och underlätta deras genomförande.
Om pilotprojekten visar att CDM potentialen är låg kan ABB lägga ner GCO och därmed snabbt avsluta CDM involveringen och nå ett, för hela företaget, tydligt avslut. Om potentialen däremot visar sig vara hög bör GCO vidareutvecklas för att ytterligare förbättra ABBs möjlighet att profitera på en CDM involvering. I detta fall bör även GTO vidareutveckla sitt erbjudande till dotterbolagen så att det täcker både en övergripande riskhantering och möjligheten att internprissätta utsläppsrätter.

Table of content 1 INTRODUCTION............................................................................................................................................... 1
1.1 GLOBAL WARMING – THE BACKGROUND OF THE THESIS................................................................................ 1 1.2 ABB – A COMPANY DESCRIPTION.................................................................................................................. 1
1.2.1 ABB Group Treasury Operations............................................................................................................. 2 1.3 PURPOSE........................................................................................................................................................ 2 1.4 THE ROAD TO A CONCLUSION – A METHODOLOGY DISCUSSION ..................................................................... 3
1.4.1 The orientation of the study...................................................................................................................... 4 1.4.2 Study approach......................................................................................................................................... 5 1.4.3 Primary and secondary sources ............................................................................................................... 6 1.4.4 Analysis .................................................................................................................................................... 8 1.4.5 Method criticism....................................................................................................................................... 8
1.5 DELIMITATION .............................................................................................................................................. 9 2 CARBON CREDITS AND EMISSION TRADING....................................................................................... 11
2.1 THE GREENHOUSE EFFECT AND GLOBAL WARMING ..................................................................................... 11 2.2 THE UNFCCC............................................................................................................................................. 11 2.3 THE KYOTO PROTOCOL............................................................................................................................... 12 2.4 KYOTO MECHANISMS AND KYOTO UNITS .................................................................................................... 12
2.4.1 Assigned Amount Unit............................................................................................................................ 13 2.4.2 Emission Trading Mechanism................................................................................................................ 13 2.4.3 Clean Development Mechanism and Certified Emission Reduction ...................................................... 13 2.4.4 Joint Implementation and Emission Reduction Units............................................................................. 18 2.4.5 Removal Unit.......................................................................................................................................... 20 2.4.6 Summary................................................................................................................................................. 20
2.5 THE EUROPEAN UNION EMISSION TRADING SCHEME.................................................................................. 21 2.5.1 Phase I.................................................................................................................................................... 22 2.5.2 Phase II .................................................................................................................................................. 22 2.5.3 Summary................................................................................................................................................. 23
2.6 POST 2012 EMISSION RESTRICTIONS ............................................................................................................ 23 2.6.1 Future of the EU ETS............................................................................................................................. 23
2.7 OTHER TYPES OF EMISSION TRADING........................................................................................................... 25 2.8 THE CARBON CREDIT MARKET..................................................................................................................... 26
2.8.1 Carbon market characteristics............................................................................................................... 28 2.8.2 Practical implications of carbon credit trading..................................................................................... 30 2.8.3 Instruments............................................................................................................................................. 31
3 ABB AND THE CARBON CREDIT MARKET ............................................................................................ 35 3.1 ABB AND CARBON CREDIT SUPPLY ............................................................................................................. 35
3.1.1 Flexible mechanism projects.................................................................................................................. 36 3.1.2 Emission reduction as a sales argument ................................................................................................ 36 3.1.3 Power Products...................................................................................................................................... 37 3.1.4 Power Systems........................................................................................................................................ 38 3.1.5 Automation Products.............................................................................................................................. 45 3.1.6 Process Automation ............................................................................................................................... 47 3.1.7 Cross-divisional cooperation ................................................................................................................. 49 3.1.8 Carbon credit supply barriers................................................................................................................ 49
3.2 ABB AND CARBON CREDIT DEMAND ........................................................................................................... 51 3.2.1 ABB Figeholm ........................................................................................................................................ 53 3.2.2 ABB Fastighet ........................................................................................................................................ 53 3.2.3 ABB Service............................................................................................................................................ 53 3.2.4 ABB Pucaro............................................................................................................................................ 54
3.3 PREVIOUS INVOLVEMENT IN THE CARBON CREDIT MARKET ........................................................................ 54 3.4 SUMMARY ................................................................................................................................................... 54
i
4 PROBLEM BREAKDOWN............................................................................................................................. 56 4.1 HOW TO MOVE FORWARD............................................................................................................................ 57
5 THEORETICAL FRAME OF REFERENCE................................................................................................ 58 5.1 ORGANIZATION ........................................................................................................................................... 58
5.1.1 Centralization versus decentralization................................................................................................... 58 5.1.2 Sharing of expertise................................................................................................................................ 59 5.1.3 Outsourcing............................................................................................................................................ 62
5.2 TRANSFER PRICING WITHIN A TREASURY DEPARTMENT............................................................................... 64 5.2.1 Financial services .................................................................................................................................. 65
5.3 PROJECT RISK AND RISK MANAGEMENT....................................................................................................... 66 5.3.1 Risk identification................................................................................................................................... 66 5.3.2 Risk quantification and analysis............................................................................................................. 69 5.3.3 Risk response control ............................................................................................................................. 69
5.4 FINANCIAL RISK AND RISK MANAGEMENT ................................................................................................... 70 5.4.1 Financial risk management techniques.................................................................................................. 72 5.4.2 Financial risk management in practice.................................................................................................. 76
5.5 ANALYSIS MODEL........................................................................................................................................ 76 6 ANALYSIS......................................................................................................................................................... 79
6.1 ORGANIZATIONAL OUTCOME ...................................................................................................................... 79 6.1.1 The centralization – decentralization trade-off ...................................................................................... 79 6.1.2 Efficient sharing of expertise.................................................................................................................. 81 6.1.3 Outsourcing versus In-house.................................................................................................................. 83 6.1.4 Internal pricing ...................................................................................................................................... 84
6.2 RISK MANAGEMENT .................................................................................................................................... 85 6.2.1 Risk identification................................................................................................................................... 85 6.2.2 Risk quantification ................................................................................................................................. 88 6.2.3 Risk response control ............................................................................................................................. 92
7 CONCLUSION.................................................................................................................................................. 95 7.1 IMMEDIATE RESPONSE................................................................................................................................. 95
7.1.1 Preparation for future CDM involvement .............................................................................................. 95 7.2 FUTURE RESPONSE ...................................................................................................................................... 96
7.2.1 Negative outcome ................................................................................................................................... 96 7.2.2 Positive outcome .................................................................................................................................... 97
REFERENCES........................................................................................................................................................... 99 APPENDIX A– ABB ORGANIZATION SCHEME............................................................................................. 106 APPENDIX B– HOW TO COMPLY..................................................................................................................... 107 APPENDIX C– FACTORS AFFECTING ORGANIZATIONAL PERFORMANCE...................................... 109
ii
List of figures FIGURE 1.1: PROPORTIONS OF REVENUE PER DIVISON. (ABB, 2007) ............................................................ 2 FIGURE 1.2: THE PHASES AND STEPS IN THE THESIS WORK. ......................................................................... 3 FIGURE 1.3: THE INFORMATION FLOW BETWEEN ALL PHASES AND STEPS IN THE THESIS WORK. ... 4 FIGURE 1.4: THE MAIN ORIENTATION OF THE FIRST THREE STEPS IN THE THESIS WORK.................... 5 FIGURE 1.5: THE MAIN ORIENTATION, DATA TYPE AND APPROACH OF THE FIRST THREE STEPS IN
THE THESIS WORK. .......................................................................................................................................... 6 FIGURE 1.6: THE MAIN ORIENTATION, DATA TYPE, APPROACH AND SOURCES OF THE FIRST THREE
STEPS IN THE THESIS WORK.......................................................................................................................... 6 FIGURE 1.7: THE DIFFERENCES BETWEEN THE ANALYTICAL APPROACHES. (HÖRTE, 1999, P.8) ......... 8 FIGURE 1.8: ALL METHODOLOGICAL CHOICES OF ALL STEPS AND PHASES IN THE THESIS WORK. .. 8 FIGURE 2.1: SCHEMATIC DESCRIPTION OF ADDITIONALITY DETERMINATION. (UNFCC, 2008E)....... 14 FIGURE 2.2: CDM TRANSACTION COSTS. (HODES, 2007, P.10)....................................................................... 18 FIGURE 2.3: THE KYOTO PROTOCOL’S MECHANISMS AND EMISSION ALLOWANCE UNITS. .............. 21 FIGURE 2.4: THE EU ETS’ MECHANISMS AND EMISSION ALLOWANCE UNITS. ....................................... 23 FIGURE 2.5: KYOTO PROTOCOL AND EU ETS TIMELINE................................................................................ 25 FIGURE 2.6: THE MECHANISMS AND ALLOWANCES AVAILABLE FOR THE OTHER MARKETS........... 26 FIGURE 2.7: SCHEMATIC OVERVIEW OF THE CARBON CREDIT MARKET................................................. 27 FIGURE 2.8: CDM MARKET DEVELOPMENT IN MTCO2E (WORLD BANK 2008, P.20) ................................ 29 FIGURE 2.9: LOCATION OF CDM PROJECTS, AS SHARE OF VOLUME SUPPLIED IN 2007. (WORLD
BANK, 2008, P. 27) ............................................................................................................................................ 29 FIGURE 2.10: THE CURRENT REGISTRY STRUCTURE AS OF SEPTEMBER 2008. (UNFCCC, 2008B) ....... 30 FIGURE 2.11: THE REGISTRY STRUCTURE AFTER THE CONNECTION OF THE CITL AND THE ITL.
(UNFCCC, 2008D) ............................................................................................................................................. 31 FIGURE 2.12: EUA AND CER FORWARD CURVE AVERAGED OVER THE FOUR EXCHANGES AND THE
SPREAD BETWEEN THEM. (BLUENEXT, 2008; EUROPEAN ENERGY EXCHANGE, 2008; EUROPEAN CLIMATE EXCHANGE 2008D AND NORDPOOL, 2008)....................................................... 33
FIGURE 2.13: HISTORICAL PRICES OF EUA AND CER FUTURES WITH DELIVERY IN DECEMBER 2008. (JPMORGAN, 2008B, P. 1, MODIFIED)........................................................................................................... 34
FIGURE 3.1: ABB GROUP FUNCTIONS. ................................................................................................................ 35 FIGURE 3.2: ABB DIVISIONS OF WHICH THE HIGHLIGHTED ARE CURRENTLY MOST INTERESTING
REGARDING CARBON CREDIT SUPPLY..................................................................................................... 37 FIGURE 3.3: ABB FACTS SHUNT COMPENSATION. .......................................................................................... 39 FIGURE 3.4: POSSIBLE PROFIT INCREASES DUE TO INSTALLATION OF A FACTS SHUNT
COMPENSATION SOLUTION......................................................................................................................... 40 FIGURE 3.5: PROJECT INSTALLATION COST AND ACCUMULATED PROFIT FROM FACTS SOLUTION.
............................................................................................................................................................................. 41 FIGURE 3.6: ABB FACTS SERIES COMPENSATION. .......................................................................................... 41 FIGURE 3.7: TRANSMISSION LOSSES FOR VARIOUS TYPES OF TRANSMISSIONS. (MACHAREY ET AL,
2007) ................................................................................................................................................................... 43 FIGURE 4.1: SUMMARY OF THE PROBLEM BREAKDOWN. ............................................................................ 57 FIGURE 5.1: FACTORS AFFECTING CHOICE OF ORGANIZATIONAL CENTRALIZATION......................... 59 FIGURE 5.2: THE KNOWLEDGE MANAGEMENT CYCLE (KING, 2008).......................................................... 60 FIGURE 5.3: OVERCOMING EXPERTISE SHARING LIMITATIONS. ................................................................ 62 FIGURE 5.4: FACTORS AFFECTING THE OUTSOURCING DECISION AND ITS OUTCOME........................ 64 FIGURE 5.5: A HIERARCHICAL RISK BREAKDOWN STRUCTURE. (CARR & TAH, 2001, P. 838) .............. 67 FIGURE 5.6: RISK QUANTIFICATION TABLE. (CAPPELS, 2003, P. 150).......................................................... 69 FIGURE 5.7: ILLUSTRATION OF THE VAR MEASURE. ..................................................................................... 73 FIGURE 5.8: PAYOFFS FROM FORWARD AND FUTURES CONTRACT, DEPENDENT ON DELIVERY
PRICE, K, AND SPOT PRICE AT TIME OF DELIVERY, ST. ......................................................................... 73 FIGURE 5.9: THE NET PROFIT PER OPTION CONTRACT FROM BUYING OR SELLING EITHER PUT OR
CALL OPTIONS DEPENDING ON THE UNDERLYING ASSETS SPOT VALUE AT THE EXPIRATION DATE (ST) WITH A STRIKE PRICE OF K. ..................................................................................................... 75
FIGURE 5.10: HEDGING A LONG POSITION IN AN ASSET WITH A LONG POSITION IN A PUT OPTION.............................................................................................................................................................................. 75
iii
FIGURE 5.11: THE ANALYSIS MODEL.................................................................................................................. 77 FIGURE 5.12: THE FIRST PART OF THE MODEL................................................................................................. 77 FIGURE 5.13: THE SECOND PART OF THE MODEL. .......................................................................................... 78 FIGURE 6.1: ORGANIZATIONAL ASPECTS, WHICH IMPORTANCE IS ILLUSTRATED BY THE GREY
ARROWS............................................................................................................................................................ 80 FIGURE 6.2: EXPERTISE SHARING LIMITATIONS............................................................................................. 82 FIGURE 6.3: THE EXTERNAL RISKS IN CARBON CREDIT PROJECTS. .......................................................... 86 FIGURE 6.4: THE GLOBAL RISKS IN CARBON CREDIT PROJECTS. ............................................................... 87 FIGURE 6.5: RISKS IN CARBON CREDIT PROJECTS.......................................................................................... 88 FIGURE 6.6: A TYPICAL CDM PROJECT TIMELINE........................................................................................... 88 FIGURE 6.7: THE NINE RISKS PLOTTED ACCORDING TO THEIR OCCURRENCE AND EFFECT.............. 91 FIGURE 6.8: THE NINE RISKS’ IMPORTANCE DEPENDING ON THE CDM TIMELINE................................ 91 FIGURE 7.1: PRINCIPAL FLOW OF INFORMATION AND CARBON CREDITS BETWEEN GTO, GCO AND
SUBSIDIARIES.................................................................................................................................................. 98 FIGURE 7.2: SUMMARY OF ABB’S AND GTO’S RESPONSE............................................................................. 98
iv
List of tables TABLE 2.1: CDM REGISTRATION TRANSACTION COSTS. (PIN, 2005) .......................................................... 17 TABLE 2.2: PROPOSED CDM REGISTRATION FEES. (PIN, 2005) ..................................................................... 17 TABLE 2.3: JI AND CDM TRANSACTION COST DIFFERENCES. (ECKERMANN ET AL, 2003, P.15).......... 20 TABLE 2.4: ANNUAL VOLUMES AND VALUES OF TRANSACTIONS ON THE MAIN ALLOWANCE
MARKETS. (WORLD BANK, 2008, P. 7) ........................................................................................................ 28 TABLE 2.5: ANNUAL VOLUMES AND VALUES FOR PROJECT-BASED TRANSACTIONS. (WORLD BANK
2008, P. 19) ......................................................................................................................................................... 29 TABLE 2.6: THE MATURITY OF EUA FUTURES AVAILABLE FROM EACH EXCHANGE. (BLUENEXT,
2008; EUROPEAN ENERGY EXCHANGE, 2008; EUROPEAN CLIMATE EXCHANGE 2008D AND NORDPOOL, 2008)............................................................................................................................................ 32
TABLE 2.7: THE MATURITY OF CER FUTURES AVAILABLE FROM EACH EXCHANGE. (BLUENEXT, 2008; EUROPEAN ENERGY EXCHANGE, 2008; EUROPEAN CLIMATE EXCHANGE 2008D AND NORDPOOL, 2008)............................................................................................................................................ 32
TABLE 3.1: FACTS SHUNT COMPENSATION CDM POTENTIAL. .................................................................... 40 TABLE 3.2: FACTS SERIES COMPENSATION CDM POTENTIAL. .................................................................... 42 TABLE 3.3: HVDC LINK CDM POTENTIAL. ......................................................................................................... 44 TABLE 3.4: EFFECT OF VALHALLA HVDC PROJECT........................................................................................ 45 TABLE 3.5: MVD PROJECT EXAMPLES. (BACH & WIKSTRÖM, 2006) ........................................................... 46 TABLE 3.6: EFFECT OF ITC PROCESS IMPROVEMENT PROJECT. (RAVEMARK & ÅHSTRÖM, 2004) ..... 48 TABLE 3.7: EFFECT OF A HEAT RECOVERY UNIT INSTALLED AT A CEMENT PRODUCTION PLANT.
(BÖRRNERT, 2008)........................................................................................................................................... 49 TABLE 3.8: ABB CARBON CREDIT DEMAND DURING EU ETS PHASE I. (RÅDSTEDT, 2008;
JOHANSSON, 2008; RABE, 2008; MECKES, 2008)........................................................................................ 52 TABLE 3.9: ABB CARBON CREDIT DEMAND DURING EU ETS PHASE II. (RÅDSTEDT, 2008;
JOHANSSON, 2008; RABE, 2008; MECKES, 2008)........................................................................................ 53 TABLE 3.10: OVERVIEW OF THE CDM INVOLVEMENT POTENTIAL OF VARIOUS ABB DIVISIONS,
ASSUMING A CER PRICE OF 28 USD. .......................................................................................................... 55 TABLE 5.1: VARIABLE DEFINITION AND RELATED RISK. (HULTMAN, 2003; LAURIKKA & SPRINGER,
2003) ................................................................................................................................................................... 68 TABLE 5.2: RISK FACTORS REGARDING THE PROJECT ACTIVITY LEVEL. (LAURIKKA & SPRINGER,
2003) ................................................................................................................................................................... 68 TABLE 6.1: HOW TO INTERPRET THE DIFFERENT CATEGORIES OF THE RISK QUANTIFICATION
MATRIX. ............................................................................................................................................................ 89
v
Abbreviations AAU Assigned Amount Unit
BPO Business Process Outsourcing
CDM Clean Development Mechanism
CDM EB CDM Executive Board
CER Certified Emission Reduction
CO2e Carbon dioxide equivalent
ERU Emission Reduction Unit
EU ETS European Union Emission Trading Scheme
EUA EU Emission Allowance
FACTS Flexible Alternating Current Transmission System
GCO Group Carbon Operations
GF‐SA Group Function Sustainability Affairs
GHG Greenhouse Gases
GTO Group Treasury Operations
HVDC High Voltage Direct Current
JI Joint Implementation
LULUCF Land Use, Land Use Change and Forestry
MVD Medium Voltage Drive
NAP National Allocation Plan
RMU Removal Unit
UNFCCC United Nations Framework Convention on Climate Change
VaR Value‐at‐Risk
vi
1 Introduction The introduction presents the background to the thesis along with a brief description of ABB and ABB Group Treasury Operations (GTO). The overall purpose is then presented and a methodological discussion describes how the work intends to progress and what flaws may be introduced as a consequence of the selected method. Finally, general delimitations are made in order to make the timeframe realistic.
1.1 Global warming – the background of the thesis The global warming is the ultimate background of this thesis. Most scientists now agree that the changing climate is a direct effect of mankind’s emissions of so called greenhouse gases (GHG). In order to try to turn the trend of a climbing average temperature the UN called for an agreement with reduction of GHG all over the world as the goal. The agreement came to be known as the Kyoto Protocol and contains clear targets on emission cuts for all industrialized countries that have ratified the protocol. In order to make the reductions as cost efficient as possible a cap‐and‐trade system was created. With clear caps on allowable emissions of GHG, measured in CO2 equivalents (CO2e), and a possibility to trade these allowances between firms and even to originate new allowances from investing in emission reducing projects in the developing world, the goal is to create a sustainable environment.
ABB is a company which specializes in power transfer and automation within the whole chain of energy distribution, from generators at waterfalls to efficient production equipment. This competence is sought by ABB’s customers, regardless if they wish to reduce energy costs or if they wish to save emission allowances. This puts ABB in a possible central position with respect to the new market of emission allowances, or carbon credits.
An increasing awareness of this potential position within ABB has raised the question if and how ABB’s treasury department could assist. Today the department lacks knowledge about the carbon market and whether ABB’s subsidiaries are involved in it. To be able to make an informed decision on the appropriate response, the treasury department took the chance to investigate these matters through this master’s thesis.
1.2 ABB – a company description The history of ABB begun in 1883 with the establishment of Elektriska Aktiebolaget in Stockholm, a company manufacturing electrical lightning and generators. Only seven years later the firm merges with another, creating Allmänna Svenska Elektriska Aktiebolaget, later shortened to Asea. Around the same time Brown, Boveri & Cie (BBC) is created in Baden, Switzerland, a company that shortly afterwards is the first to transmit high‐voltage power.
The two firms’ history run in parallel for almost 100 years, until they merge in 1989 forming Asea Brown Boveri or ABB for short. During these 100 years Asea has played a big part in the electrification of Sweden, examples include building the first high voltage direct current (HVDC) transmission line in 1952 and the construction of Sweden’s nuclear power plants with the first one in 1970. In 1978 Asea also invents and launches one of the first industrial robots in the world. Meanwhile BBC has become a leader within power systems, creating the first combined heat and power plant in 1893, the first combustion gas turbine in 1939 and the world’s most powerful transformer in 1973. Both firms started their expansion abroad in the early 1900’s.
The newly formed ABB continued the expansion into eastern and central Europe upon the collapse of the iron curtain in 1990 and into USA, finally making ABB currently present in approximately 100 countries. The 1990’s was also colored by a number of strategic moves where ABB started to focus on its core competence. (ABB, 2008) This change accelerated during the early 2000’s due to a financial crisis
1

Chapter 1 – Introduction
where an economy in downturn, large claims from asbestos related law suits in USA and too much accumulated debt from the aggressive expansion during the 1990’s made ABB’s future prospects unclear.
Nuclear power, power generation and rail businesses were divested and in 2002 the organizational structure was streamlined to focus on two core areas; power technologies and automation technologies. The divestments solved the immediate debt problems and the reorganization helped ABB to focus on its
core competence. Leaving three years of net losses behind, 2004 became a profitable year, marking the end of the financial crisis. (Economist, 2002)
Automation Products 27%
Process Automation
20%
Robotics 4% Power Products 31%
Power Systems 18%
Figure 1.1: Proportions of revenue per divison. (ABB, 2007)
In 2008 ABB is a leader in power and automation technologies, having a turnover of approximately 34 billion USD with the help of 112,000 employees. The ultimate parent company of the ABB Group, which consists of 323 consolidated operating and holding subsidiaries, is ABB Ltd., Switzerland. Its organizational structure is enclosed in Appendix A, showing that ABB is organized in five different divisions along with a number of divisional transboundary group functions reporting directly to a member of the executive committee. The divisions’ proportion of revenue is depicted in Figure 1.1. (ABB, 2007)
The division’s main operations and markets are described respectively below:
• Power Products incorporates ABB’s manufacturing network for transformers, switchgear, circuit breakers, cables and associated equipment. Approximately 32,000 employees serve customers primarily in utilities, transportation and power‐generation industries.
• Power Systems offers turnkey systems and services for power transmissions, distribution grids and power plants. Other solutions provided by Power Systems include automation control and protection systems for power transmissions. The main customers are in utilities and power generation industries and approximately 14,000 employees helped serve them during 2007.
• Automation Products helps customers improve their productivity via a product portfolio containing circa 170,000 products, such as drives, motors, generators, instrumentation and power electronics. Approximately 33,000 employees worked within Automation Products in 2007, serving mainly industrial applications.
• Process Automation provides its customer with integrated solutions for control, plant optimization and industry‐specific application knowledge. 26,000 employees helped customers in primarily oil and gas, metals, minerals, pulp and paper, chemical and pharmaceuticals with their needs.
• Robotics offers robots, services and modular manufacturing solutions. Around 5,000 employees served customers in manufacturing, foundry, packaging and material handling industries.
1.2.1 ABB Group Treasury Operations GTO consists of the main office in Zurich, where we are placed, and two branches in Singapore and USA. The description will therefore only cover GTO, Zurich.
2
Chapter 1 – Introduction
GTO is ABB’s internal bank, providing the ABB Group companies with professional treasury management services that cover interest rates, foreign exchange, commodities and cash management. The department is internally organized similar to an external bank, with a trading floor, a risk control and a back office as well as with its own IT support and accounting functions. The main services provided by GTO are described below:
Interest rates. ABB policies state that both liquidity surplus and debt financing must be done with GTO except legally impossible or prohibited. GTO applies credit ratings for Group companies and quotes them market interest rates for lending and borrowing.
Foreign exchange. Group companies must hedge contracted exposures as soon as the sales order is received or the purchase order is placed. Companies with sales of standard product must hedge at least 50% of their forecasted foreign currencies sales for a maximum of 12 months. All FX transactions must be executed using GTO if legally possible. GTO manages FX risk within approved limits.
Commodities. ABB policies require that all companies must hedge risks related to forecast demand of raw materials fabricated from primary aluminum, copper and crude oil. The hedging transactions must be done by GTO, if this is not legally impossible, and the policies also states that allowable derivatives for this hedging are swaps and futures.
Other services. Include funding of working capital, internal and external payments, management of cash pools and investing the liquidity of the Group. (ABB, 2008)
1.3 Purpose The assignment from ABB is to determine whether ABB’s treasury department should take a centralized role in the handling of carbon credits spawning from projects that the ABB group companies are involved in. This leads to the purpose of the thesis being:
How should GTO respond to ABB’s involvement in carbon credit related issues?
To answer this main purpose a number of sub‐purposes evolves:
• to examine the underlying functions and mechanisms of the carbon credit market.
• to determine ABB’s current exposure to the carbon credit market and what future possibilities that lies ahead.
• to determine how carbon credit related issues are handled by ABB today.
• to determine how the GTO can get involved in the handling of carbon credits.
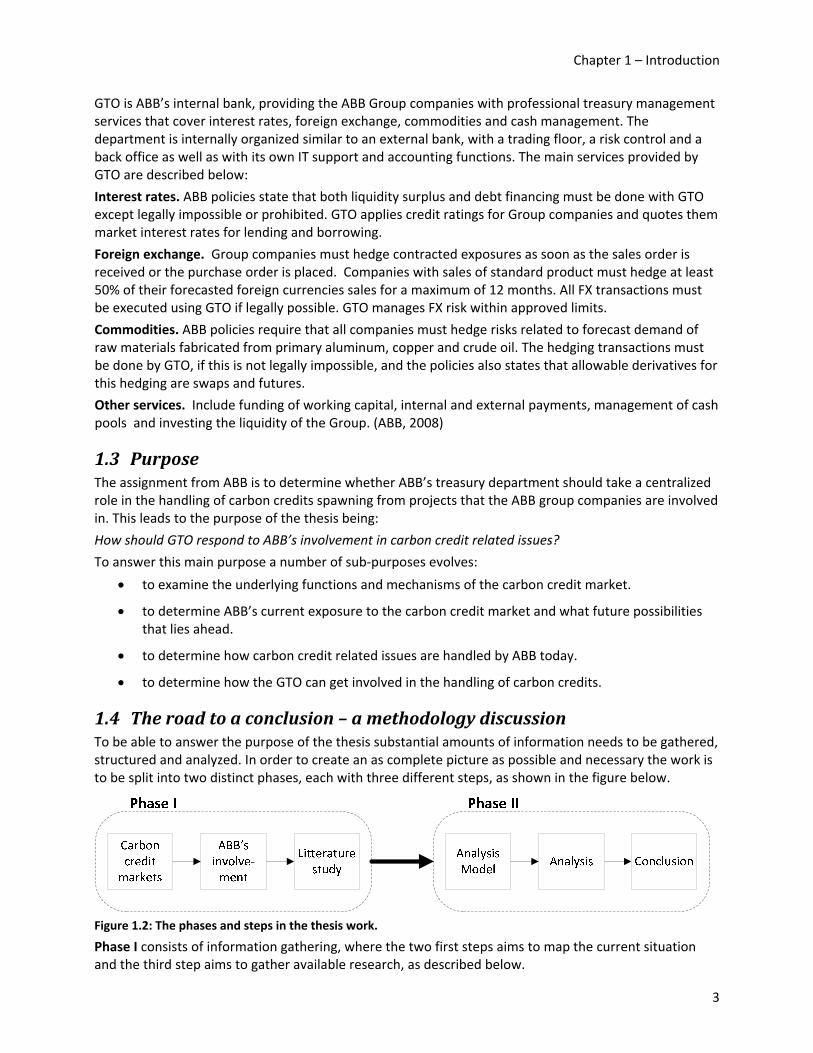
1.4 The road to a conclusion – a methodology discussion To be able to answer the purpose of the thesis substantial amounts of information needs to be gathered, structured and analyzed. In order to create an as complete picture as possible and necessary the work is to be split into two distinct phases, each with three different steps, as shown in the figure below.
Figure 1.2: The phases and steps in the thesis work.
Phase I consists of information gathering, where the two first steps aims to map the current situation and the third step aims to gather available research, as described below.
3
Chapter 1 – Introduction
The first step is the mapping of the market for carbon credits and how it functions. This includes description of the underlying reasons and regulations. It also includes describing how the Kyoto Protocol is implemented, especially within the EU, what instruments are available for trading and where. This step is necessary in order to grasp the problem as the knowledge of these mechanisms is poor with both GTO and the authors.
Not until after the completion of the first step can the second step be initiated. This step aims to describe how the ABB group companies are involved in the carbon credit market and what their future involvement possibilities are. This is also a crucial step towards reaching a conclusion as the GTO and the authors lack any knowledge of the extent of the exposure ABB has to the carbon credit market today. This step consists mainly of interviews with ABB employees within different business units and countries combined with a study of ABB’s internal resources, such as management presentations and technical reports issued by ABB.
The third and final step in the information gathering phase is the review of available research within areas relevant for the treasury department’s operations in regard to carbon credits. The aim is to gather all the theories and models needed in order to capture all aspects of the problem, expressed as a theoretical frame of reference.
Phase II consists of analyzing the present situation in the light of the theories and models gathered in the first phase. The first step of the phase is the forming of an analysis model. This model will summarize the reference material, put in the context of the problem at hand and aims to capture the relevant aspects of the problem in a cognitive way. By investing rather much effort in the forming of this model a comprehensive and exhaustive analysis will be facilitated.
The second step is to apply the model on the information gathered in the two first steps of Phase I. Here all gathered information will be used to examine every interesting aspect of the problem.
The third and final step is to answer the purpose of the thesis by concluding the analysis.
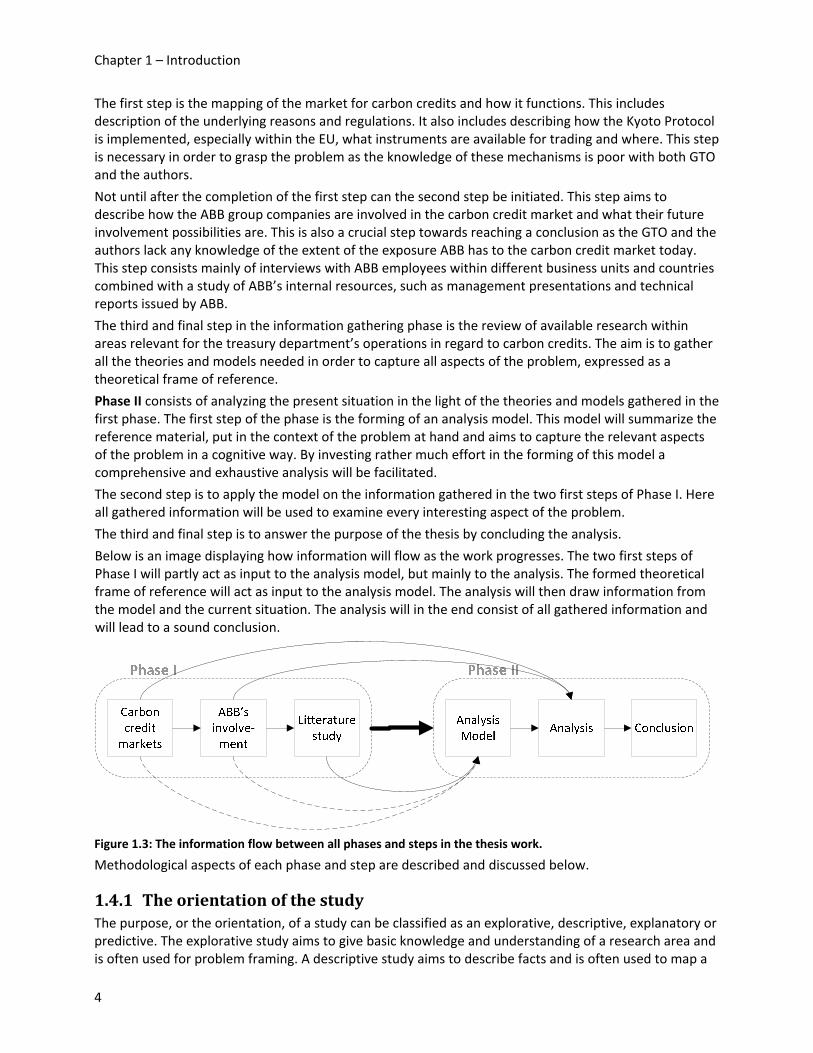
Below is an image displaying how information will flow as the work progresses. The two first steps of Phase I will partly act as input to the analysis model, but mainly to the analysis. The formed theoretical frame of reference will act as input to the analysis model. The analysis will then draw information from the model and the current situation. The analysis will in the end consist of all gathered information and will lead to a sound conclusion.
Figure 1.3: The information flow between all phases and steps in the thesis work.
Methodological aspects of each phase and step are described and discussed below.
1.4.1 The orientation of the study The purpose, or the orientation, of a study can be classified as an explorative, descriptive, explanatory or predictive. The explorative study aims to give basic knowledge and understanding of a research area and is often used for problem framing. A descriptive study aims to describe facts and is often used to map a
4

Chapter 1 – Introduction
situation or a problem. Its aim is to describe how it looks rather than try to explain the underlying reasons. An explanatory study takes one step further compared to the descriptive study and tries to clarify causality. A study with a predictive orientation goes yet another step further and aims to give a forecast or prediction about e.g. the future development of a phenomenon. A study is seldom of one pure orientation, rather it experiences influences from two or three, but is focused around one.
The level of ambition regarding the information in the results of the study is increasing from the explorative to the predictive orientation. There is also an implicit causality between the steps, such that in order to perform a predictive study one has to have an explanatory understanding of the problem. (Lekvall & Wahlbin, 2001)
It is only Phase I that concerns information gathering, each step in Phase II uses this information as inputs in order to perform analysis and conclusions. Therefore it is only reasonable to talk about a study’s orientation for the steps within Phase I.
In the first step the problem knowledge is poor, we need to gain insights into the carbon credit market in order to be able to proceed and examine whether ABB is exposed to this market. But as the main sources needed to extend the problem knowledge is of such a regulatory and legislative nature the main orientation is best described as a descriptive one. However as we proceed into Step II the orientation shifts to an exploratory one. This is due to that we have no prior knowledge of the problems before entering this step and there are no standardized sources we can use. Instead here we need to be open‐minded and try to gain a basic understanding of how the ABB divisions are involved in the carbon credit market. In Step III the problem knowledge has increased and the orientation shifts back to a descriptive one.
The figure below summarized the different orientations within the first three steps.
Figure 1.4: The main orientation of the first three steps in the thesis work.
1.4.2 Study approach First one can make a distinction between a qualitative and a quantitative study. The difference between the two is how data is expressed and how the initial analysis is performed. A qualitative study is characterized by data that cannot be quantified meaningfully and an initial analysis in terms of verbal reasoning. A quantitative study on the other hand is characterized by data coded in number form and an initial analysis in terms of calculations and statistical measures.
Secondly one can also make a distinction between a case‐study approach and a cross‐sectional approach. In a case‐study approach the researcher is interested in profound description and analysis of few cases. The researcher is not aiming to make conclusions of how the studied cases are related to some underlying population. A cross‐sectional approach measures a number of relations determined before the study and the aim is to generalize the findings to an underlying population. (Lekwall & Wahlbin, 2001)
All steps in Phase I are of either exploratory or descriptive orientation. It is therefore not appropriate to approach the study as a cross‐sectional study; instead the case‐study approach is selected. It is most apparent in Step II, where we will examine specific business units with certain products and formulate
5
Chapter 1 – Introduction
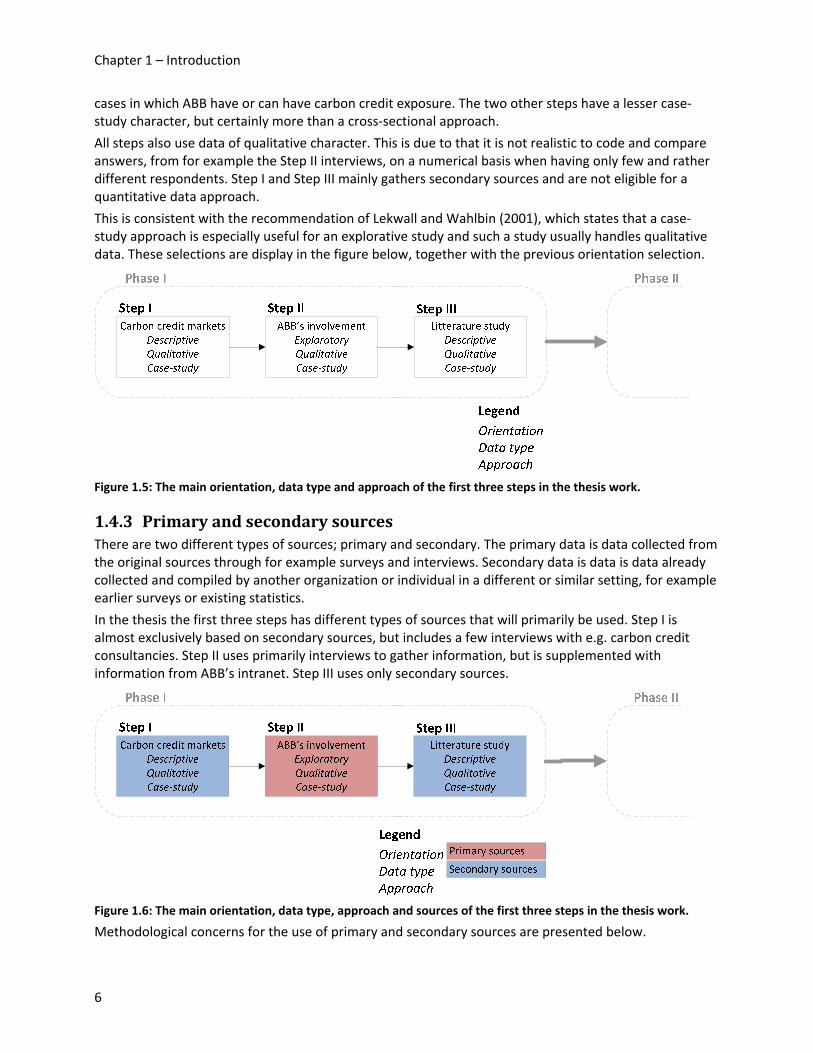
cases in which ABB have or can have carbon credit exposure. The two other steps have a lesser case‐study character, but certainly more than a cross‐sectional approach.
All steps also use data of qualitative character. This is due to that it is not realistic to code and compare answers, from for example the Step II interviews, on a numerical basis when having only few and rather different respondents. Step I and Step III mainly gathers secondary sources and are not eligible for a quantitative data approach.
This is consistent with the recommendation of Lekwall and Wahlbin (2001), which states that a case‐study approach is especially useful for an explorative study and such a study usually handles qualitative data. These selections are display in the figure below, together with the previous orientation selection.
Figure 1.5: The main orientation, data type and approach of the first three steps in the thesis work.
1.4.3 Primary and secondary sources There are two different types of sources; primary and secondary. The primary data is data collected from the original sources through for example surveys and interviews. Secondary data is data is data already collected and compiled by another organization or individual in a different or similar setting, for example earlier surveys or existing statistics.
In the thesis the first three steps has different types of sources that will primarily be used. Step I is almost exclusively based on secondary sources, but includes a few interviews with e.g. carbon credit consultancies. Step II uses primarily interviews to gather information, but is supplemented with information from ABB’s intranet. Step III uses only secondary sources.
Figure 1.6: The main orientation, data type, approach and sources of the first three steps in the thesis work.
Methodological concerns for the use of primary and secondary sources are presented below.
6
Chapter 1 – Introduction
Primary sources – Interviews As described above the thesis will have a case‐study approach, which implies that the primary data is collected through interviews. An interview can take the form of a fully structured interview, where the interviewer has a number of pre‐formulated questions and strictly defined answering alternatives, an open‐ended interview, where the interviewer and the interviewee discusses a subject with no preplanning, or any combination of the two. In Step II the purpose is rather clear, to clarify the present situation, which creates a good base for what kind of questions to explore. To encourage the interviewee to express him‐ or herself freely and to perhaps discover issues not considered beforehand a semi‐structured approach is selected. (Lekvall & Wahlbin, 2001)
The selection of who to interview differs between the steps. As Step II is of explorative character a top‐down approach is used. Persons holding rather high positions within the different business units or group companies are initially interviewed. If they do not hold the information sought, they are simply asked to refer to the most relevant person available. This could of course introduce some bias into study, but limitations in time and the explorative nature of the study makes this solution the only feasible. Step I is more of a descriptive character and the available interviewees are much smaller – only a few consultancies have had previous contact with ABB. The aim is therefore to interview everyone within this group.
The goal is to perform as many interviews as possible in person. This will be particularly tough in Step II, due to the number of persons that needs to be interviewed and due to the working load allocated to persons high up in the hierarchy. Where possible, telephone interviews will be performed and as last resort questions will be asked via email. The general form, i.e. semi‐structured interviews, will be used in all cases. It is important to recognize that, particularly in the email case, a semi‐structured interview may fail to capture additional information. We will try to contact each mail‐interviewee in person whenever we suspect that the person holds more relevant information.
Regarding practical aspects notes will be taken during the entire interview and be compared and discussed as fast as possible after each interview. A discussion on what have been said will take place and additional or clarifying questions to the interviewee will be asked via phone or email if needed. Every interview has also been pre‐booked in order to not catch the interviewee at a bad time where he or she is stressed or otherwise suspected to be unable to give satisfying answers.
Secondary sources The main sources used in step one are the actual Kyoto Protocol and the legislative and regulative documents of the commitments made by the EU countries. However, as the authors lack any deeper juridical education and experience, sources summarizing these documents will also be used. In order to preserve the integrity of the thesis all such sources will, whenever possible, be checked against other summarizing sources and/or the normative documents.
The second step will use ABB internal presentations and technical reports in order to capture ongoing work within the company with respect to carbon credit markets. We will use the internal search engine to locate relevant sources and we expect to receive relevant material from our mentors and interviewees.
In the third step we will use database search engines to locate books and journal articles covering the subject we identify in the problem breakdown chapter. We will start broad, searching on general keywords to get a grasp of the subject. We will then proceed to more specific sources handling interesting questions. References of the material will be checked, to see if a publication relies too much on one source and from what publications the sources have been taken.
7

Chapter 1 – Introduction
1.4.4 Analysis How an analysis and a reasoning is built up can be described by three main approaches; induction, deduction and abduction. They all contain the same three components, but are organized differently. One component is the way one interprets how the world is structured and how it works, here called the model. Another component is something that has been empirically observed, named the empirics. The last component, named the result, is the result one gets when relating the empirical observations to the model. (Hörte, 1999)
Figure 1.7: The differences between the analytical approaches. (Hörte, 1999, p.8)
As shown in the figure above the difference between the analytical approaches is in the starting point. In a deductive approach the researcher goes from a model, applies them on empirical data in order to reach a result. An inductive approach starts in empirical data, using them as results in order to conclude general theories and models. Finally, an abductive approach starts with a situation, i.e. the result, and attempts to explain the situation using a model with support from empirical findings. (Hörte, 1999)
The analysis and reasoning approach used in this thesis will resemble the deductive approach the most. We will start with a set of theories to which we apply empirics in order to reach result.
1.4.5 Method criticism This part presents criticism to the selected methodological approaches. Its purpose is to demonstrate that the authors are aware that the method will have flaws. By being aware of these flaws their effect could be managed. The methodological choices are summarized in the figure below and its criticism further below.
Figure 1.8: All methodological choices of all steps and phases in the thesis work.
8
Chapter 1 – Introduction
Phase I – Primary sources Two factors affect the quality of the study, its reliability and its validity. The reliability concerns the measuring method’s ability to resist influence of different disturbing moments. If different respondents give different answers to the same question, or if one respondent gives different answers to the same question asked on different times, the reliability of the study is low. (Lekvall & Wahlbin, 2001) To heighten the reliability the same questions will be asked to different persons within the same business unit to compare the answers. As mentioned above interviews will be pre‐booked in order to avoid disturbances such as stressed or tired interviewees. Clarifying questions will be asked in case of unclarity regarding what has been said or if the answer is hard to interpret. The fact that an individual’s view or knowledge of a situation is not necessarily the true one is something that cannot be avoided, but taking the measures described above is an insurance that the used information is the best available.
The validity of a study concerns the measuring method’s ability to actually measure the property it intends to measure. To ensure that a study has a high validity is generally rather difficult. (Lekvall & Wahlbin, 2001) The face validity, i.e. that the respondent agrees that the questions asked are relevant for the study’s purpose, for the first phase is considered to be rather good, since most of the interviews are conducted within ABB which will encourage an less formal discussion climate where questions easily can be altered so that all involved parties are satisfied.
Phase II – Secondary sources Step I is heavily based on legislative and regulatory documents. This may introduce bias and misinterpretation due to the lack of juridical education and experience with the authors. We will try to minimize this by cross‐reading the official documentation against other summarizing sources to increase the integrity of this part.
The internal material used in Step II has varying purposes and may therefore be biased. We will try to stay objective to our cause when reading this material by being aware of the publications purpose and how this may reflect on the content.
In Step III we are affected by time limitations; we cannot cover all research available and we cannot go through all available databases. This is a rather natural limitation, but may nevertheless affect the frame of reference. However, the method introduced above follows the recommendations of Lekvall and Wahlbin (2001) and we will try to as objective as possible when choosing what literature to include in the thesis.
Phase II – Analysis Even though our general analysis approach will be of a deductive character it is not possible to form a pure and complete logical chain of events leading to a conclusion. Assumptions, delimitations and introduced simplifications will affect the conclusion and must be chosen carefully. We will rely on our own judgment and common sense to do this and this may obviously introduce bias. But, as Gummesson (2006) suggests:
It [research] includes objectivity, intersubjectivity and subjectivity. Instead of being ashamed of subjectivity elements, we should let them out of the closet and use them as assets.
(Gummesson, 2006, p.178)
1.5 Delimitation The study will not focus on technical aspects of carbon credits, such as how to properly price different instruments, what hedge ratios should be used when cross‐hedging or specific risk management techniques. The study will rather focus on general descriptions of the instruments and general risk
9

Chapter 1 – Introduction
management techniques. This is partly due to the lack of proper time series but mainly due to the focus of the thesis being of a more strategic nature.
The case descriptions will only highlight future potential of cash flows related to carbon credits. They will not be thoroughly investigated with respect to CDM acceptance probabilities or customer involvement probabilities.
ABB has used and are using carbon credits indirectly through sales arguments. Another master thesis that investigates how voluntary carbon credits and carbon certifications can be used to enhance, among other things, the sales arguments is being conducted in parallel within the MVD division in Switzerland. Therefore this thesis will not go in very deep on these subjects, but rather assume that these mechanisms work satisfactory today.
The carbon credit markets are developing rapidly compared to more mature financial markets, which have introduced issues regarding timing. We will therefore handle certain issues with respect to a fixed point in time. It is clearly marked in the thesis whenever this limitation has been used.
10
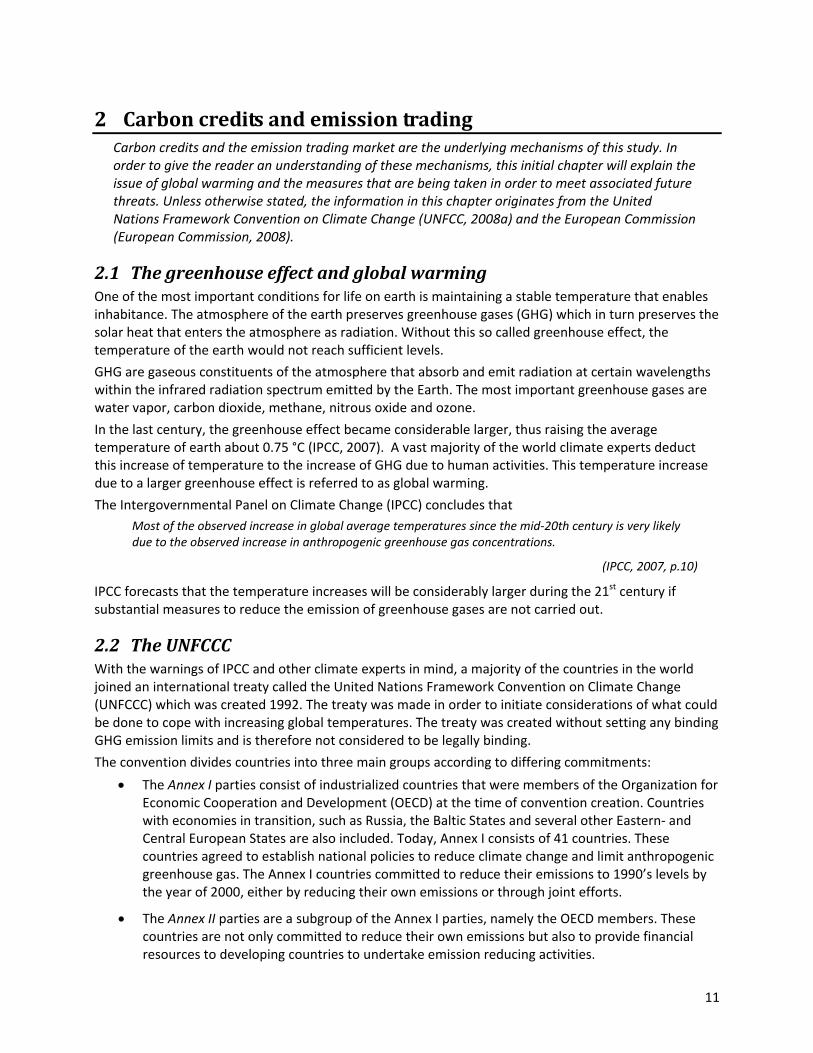
2 Carbon credits and emission trading Carbon credits and the emission trading market are the underlying mechanisms of this study. In order to give the reader an understanding of these mechanisms, this initial chapter will explain the issue of global warming and the measures that are being taken in order to meet associated future threats. Unless otherwise stated, the information in this chapter originates from the United Nations Framework Convention on Climate Change (UNFCC, 2008a) and the European Commission (European Commission, 2008).
2.1 The greenhouse effect and global warming One of the most important conditions for life on earth is maintaining a stable temperature that enables inhabitance. The atmosphere of the earth preserves greenhouse gases (GHG) which in turn preserves the solar heat that enters the atmosphere as radiation. Without this so called greenhouse effect, the temperature of the earth would not reach sufficient levels.
GHG are gaseous constituents of the atmosphere that absorb and emit radiation at certain wavelengths within the infrared radiation spectrum emitted by the Earth. The most important greenhouse gases are water vapor, carbon dioxide, methane, nitrous oxide and ozone.
In the last century, the greenhouse effect became considerable larger, thus raising the average temperature of earth about 0.75 °C (IPCC, 2007). A vast majority of the world climate experts deduct this increase of temperature to the increase of GHG due to human activities. This temperature increase due to a larger greenhouse effect is referred to as global warming.
The Intergovernmental Panel on Climate Change (IPCC) concludes that Most of the observed increase in global average temperatures since the mid‐20th century is very likely due to the observed increase in anthropogenic greenhouse gas concentrations.
(IPCC, 2007, p.10)
IPCC forecasts that the temperature increases will be considerably larger during the 21st century if substantial measures to reduce the emission of greenhouse gases are not carried out.
2.2 The UNFCCC With the warnings of IPCC and other climate experts in mind, a majority of the countries in the world joined an international treaty called the United Nations Framework Convention on Climate Change (UNFCCC) which was created 1992. The treaty was made in order to initiate considerations of what could be done to cope with increasing global temperatures. The treaty was created without setting any binding GHG emission limits and is therefore not considered to be legally binding.
The convention divides countries into three main groups according to differing commitments:
• The Annex I parties consist of industrialized countries that were members of the Organization for Economic Cooperation and Development (OECD) at the time of convention creation. Countries with economies in transition, such as Russia, the Baltic States and several other Eastern‐ and Central European States are also included. Today, Annex I consists of 41 countries. These countries agreed to establish national policies to reduce climate change and limit anthropogenic greenhouse gas. The Annex I countries committed to reduce their emissions to 1990’s levels by the year of 2000, either by reducing their own emissions or through joint efforts.
• The Annex II parties are a subgroup of the Annex I parties, namely the OECD members. These countries are not only committed to reduce their own emissions but also to provide financial resources to developing countries to undertake emission reducing activities.
11

Chapter 2 – Carbon credit and emission trading
• Non‐Annex I parties mainly consist of developing countries. These countries are not subject to the same emission reductions for economic or geographical reasons but they need to report their emission status. The convention emphasizes activities such as investments and technology transfers by developed countries to meet the undeveloped countries needs. The 49 least developed countries (LDCs) are given special consideration because of their limited capacity to respond to climate change.
2.3 The Kyoto Protocol The UNFCCC encourages emission reductions but in order to make binding commitments a linked addition to the convention has been signed, the Kyoto Protocol.
The general implications of the Kyoto Protocol is the establishment of legally binding targets for emission of greenhouse gases for 36 industrialized countries plus the European Union which is considered as one entity.
The protocol was adopted in 1997 and was open for signing from March 1998 to March 1999 and thereafter entered into force on 16 February 2005. By the final signing date, the protocol was signed by 84 countries. The parties that had not yet signed have been able to do this later and today a majority of the world countries have signed the protocol. The only country that has signed the protocol but not ratified it is the United States.
The average reduction target for the countries bound to reduce their emissions is 5.2% in relation to the 1990 emission levels. This reduction should be carried out during the first commitment period from 2008 to 2012. Though, separate emission reduction targets have been created for individual regions depending on the current emissions and the effort needed to reduce emissions. For example, the European Union are bound to reach emission levels of 8% below the 1990 levels while some countries, such as Australia, are permitted increases in its emissions. The individual emission targets of the Kyoto Protocol are stated in the protocols Annex B. The Annex B countries are almost identical to the Annex I countries, though certain Annex I countries such as Turkey were not included in Annex B since they were not parties to the convention when the protocol was adopted.
The emission targets are quantified as CO2 equivalents (CO2e) but include the six main greenhouse gases which are presented in Annex A of the Kyoto Protocol:
• Carbon dioxide – CO2
• Methane – CH4
• Nitrous oxide – N2O
• Hydroflourocarbons – HFCs
• Perflourocarbons – PFCs
• Sulphur hexaflouride – SF6
The Kyoto Protocol compliance is carried out through an enforcement branch. If any Annex B country fails to meet its Kyoto emission restrictions they are subject to penalties. Except for making up for the difference between the assigned emission amount and the actual emission amount during the second commitment period (after 2012), the penalized country will get a 30% decrease of the second commitment period emission targets.
2.4 Kyoto mechanisms and Kyoto units The parties included by the Kyoto Protocol are bound to meet their emission targets, which can be done through domestic measures such as investing in new technology, introducing emission taxes or
12
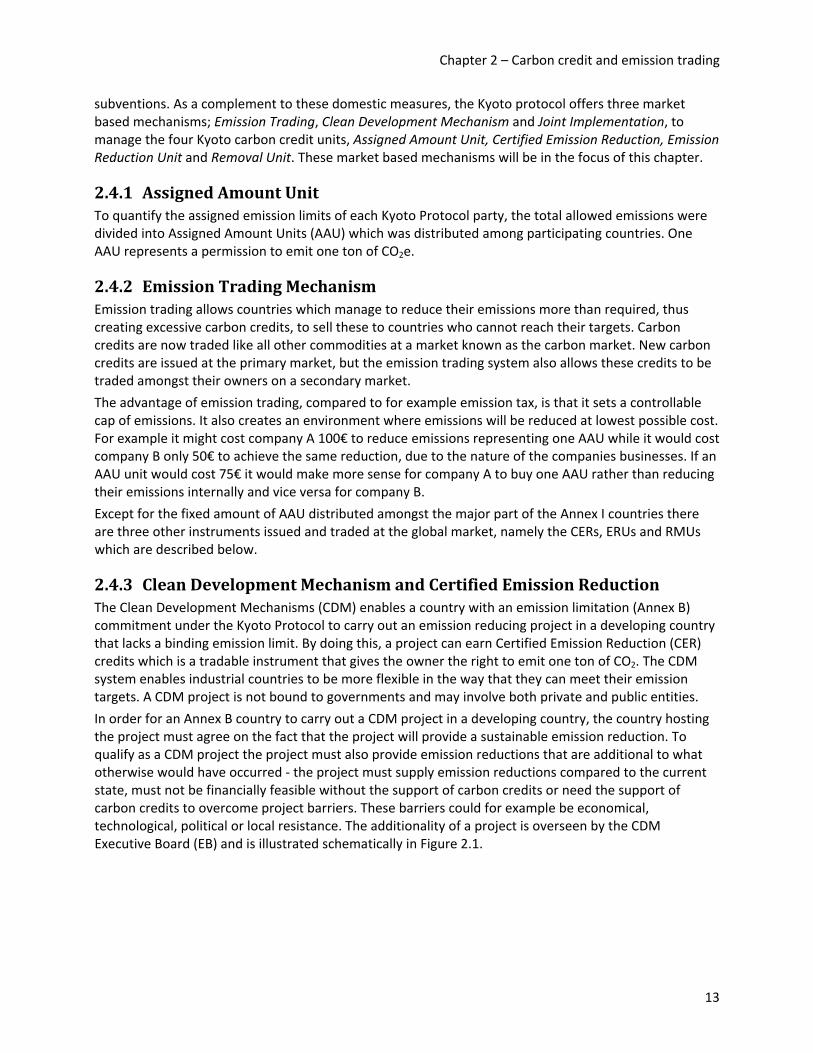
Chapter 2 – Carbon credit and emission trading
subventions. As a complement to these domestic measures, the Kyoto protocol offers three market based mechanisms; Emission Trading, Clean Development Mechanism and Joint Implementation, to manage the four Kyoto carbon credit units, Assigned Amount Unit, Certified Emission Reduction, Emission Reduction Unit and Removal Unit. These market based mechanisms will be in the focus of this chapter.
2.4.1 Assigned Amount Unit To quantify the assigned emission limits of each Kyoto Protocol party, the total allowed emissions were divided into Assigned Amount Units (AAU) which was distributed among participating countries. One AAU represents a permission to emit one ton of CO2e.
2.4.2 Emission Trading Mechanism Emission trading allows countries which manage to reduce their emissions more than required, thus creating excessive carbon credits, to sell these to countries who cannot reach their targets. Carbon credits are now traded like all other commodities at a market known as the carbon market. New carbon credits are issued at the primary market, but the emission trading system also allows these credits to be traded amongst their owners on a secondary market.
The advantage of emission trading, compared to for example emission tax, is that it sets a controllable cap of emissions. It also creates an environment where emissions will be reduced at lowest possible cost. For example it might cost company A 100€ to reduce emissions representing one AAU while it would cost company B only 50€ to achieve the same reduction, due to the nature of the companies businesses. If an AAU unit would cost 75€ it would make more sense for company A to buy one AAU rather than reducing their emissions internally and vice versa for company B.
Except for the fixed amount of AAU distributed amongst the major part of the Annex I countries there are three other instruments issued and traded at the global market, namely the CERs, ERUs and RMUs which are described below.
2.4.3 Clean Development Mechanism and Certified Emission Reduction The Clean Development Mechanisms (CDM) enables a country with an emission limitation (Annex B) commitment under the Kyoto Protocol to carry out an emission reducing project in a developing country that lacks a binding emission limit. By doing this, a project can earn Certified Emission Reduction (CER) credits which is a tradable instrument that gives the owner the right to emit one ton of CO2. The CDM system enables industrial countries to be more flexible in the way that they can meet their emission targets. A CDM project is not bound to governments and may involve both private and public entities.
In order for an Annex B country to carry out a CDM project in a developing country, the country hosting the project must agree on the fact that the project will provide a sustainable emission reduction. To qualify as a CDM project the project must also provide emission reductions that are additional to what otherwise would have occurred ‐ the project must supply emission reductions compared to the current state, must not be financially feasible without the support of carbon credits or need the support of carbon credits to overcome project barriers. These barriers could for example be economical, technological, political or local resistance. The additionality of a project is overseen by the CDM Executive Board (EB) and is illustrated schematically in Figure 2.1.
13

Chapter 2 – Carbon credit and emission trading
Figure 2.1: Schematic description of additionality determination. (UNFCC, 2008e)
The process of turning a project idea into CER generation is quite complex and time demanding. It involves a number of steps (European Climate Exchange, 2008d) which can be summarized as below:
• Step 1: The Project Idea The idea behind a CDM project is normally presented in a Project Idea Note (PIN) document. This contains the most important information concerning the project, together with a rough estimate of the possible emission reductions. The PIN is generally used to assess the compatibility of the project with CDM guidelines prior to the main Project Design Document (PDD) being written.
• Step 2: The Project Design Document (PDD) and the consent of the host country The PDD contains all information about the project and stipulates the anticipated volume of emission reductions over a certain time period. The focus point of the PDD is the selection of a suitable methodology to calculate the CO2 savings. In order to claim emission reductions, projects must be carried out more efficiently and cleanly, in regard to greenhouse gas outputs, than conventional technologies or procedures normally implemented in the host country. This
14

Chapter 2 – Carbon credit and emission trading
hypothetical reference scenario forms the so‐called baseline. The PDD, and thus the suggested CDM project, must be authorized through the responsible authorities in the developing country, i.e. its Designated National Authority (DNA). Attention is focused on the contribution of the project to the sustainable development of the country.
• Step 3: Validation In addition, the PDD must be checked by a United Nations accredited organization, called a Designated Operational Entity (DOE). The validation process of the project is usually carried out by certification institutions such as SGS, TUV or DNV. Validation includes an inspection of the PDD, with focal point on the methods used in order to comply with baseline principles, as well as the calculation and monitoring of emission reductions. Everyone is allowed to comment on a project during the validation process, and the PDD is open to debate for a period of 30 days on the UNFCCC website.
• Step 4: Registration Once validated, the project developer makes an application to register the project with the CDM EB. This Executive Board has the last word, as it is the executive organ of the United Nations in all CDM matters. Once the board agrees, the project is officially registered and CERs can be generated.
• Step 5: Monitoring It is far from over with the registration of the project under the CDM. After all, the PDD only depicts the intentional performance of a project toward emission reductions over a certain time. The project developer must prove whether this performance is actually generated over the credit period of the project. Monitoring reports, in which features of the project are reported, assist here. The reported information permits the precise calculation of the emission reductions in relationship to the selected baseline.
• Step 6: Verification Despite the monitoring reports, accredited organizations keep a close eye on project developers. This process is called Verification and is normally carried out on a yearly basis. After inspection, the independent Verifier goes on to make a statement concerning the integrity and accuracy of the information provided in the monitoring report.
• Step 7: Issuing of the CERs Provided that the monitoring reports are approved without objection during the verification, the CDM Executive Board is allowed to issue the generated CERs.
The crediting period is the period for which the CDM Program Activity (CPA) generates emission reductions from the baseline case. There are certain rules (Baker&McKenzie, 2008) which have to be taken into account when determining the period for which the CDM project will generate CERs:
• The crediting period for a CPA must not extend beyond the operational lifetime of the CPA.
• The crediting period cannot exceed the end date of the program of activities to which the CPA belongs.
• The crediting period of a CPA is limited to 7 years with the option to renew it twice, to a total maximum of 21 years, or to 10 years without the renewal option.
The exploding growth of the CDM market, described in Chapter 0, has lead to significant delays due to the overloading of the of the CER issue administration. These bottlenecks have put pressure of the CDM to deliver sufficient CER on time.
15

Chapter 2 – Carbon credit and emission trading
For example, of the 3,188 projects currently in pipeline a vast majority, 2,022 projects, are at the validation stage. Further on, market participants report that it is taking up to six months to engage a DOE just to reach the CDM pipeline (step 4 above). Upon initiation of registration, projects experience an average wait time of 80 days until registration completion. Because of the following monitoring processes (step 5 and 6 above), projects need an average time of one to two years to reach CER issuance from the time they enter the pipeline. That sums up to a total time of 1.5 to 2.5 years to reach issuance from the point where the project idea is generated. (World Bank, 2008)
Besides experiencing problems due to the rigorous administration processes DOEs have been reporting staffing shortages. The shortages have different reasons, such as lack of candidates with proper language knowledge or the post 2012 uncertainty presented in Chapter 0.
There are certain simplifications to the CDM registration rules that can be made according to a directive of simplified modalities and procedures for small‐scale CDM projects. The major conclusion from this directive is that a project can be considered a small‐scale project if it has a capacity below 15 MW, if it saves up to 15 GWh per year or if the project emits less than 15 ktCO2. If classified as a small‐scale project the project will be subject to less rigorous registration processes. (UNFCC, 2008f) It will also lead to CDM related transaction costs being reduced up to 70% (Yapp, 2006).
CDM transaction costs The flexible mechanism project registration is not only complex and time demanding, it also generates significant costs. Except for the indirect costs connected to the personnel involvement there are many direct registration and monitoring costs. The total transaction costs for a normal CDM project is about USD 200,000 while the transaction costs for the small‐scale CDM projects are significantly lower at about 60,000 (Yapp, 2006; Nilsson 2008).
The transaction costs are dependant of the size of the project, the demands of the hosting country, what type of project that is performed and who is conducting the project. If the registration process is handled by an inexperienced group the costs can be significantly higher than 200,000 USD. (Nilsson, 2008) Transaction costs can be divided into three major categories as follows (Pin, 2008):
• Project preparation costs
• Project implementation costs
• Relative transaction costs
The transaction cost structure is presented in Table 2.1 and Table 2.2 and illustrated by Figure 2.2.
16
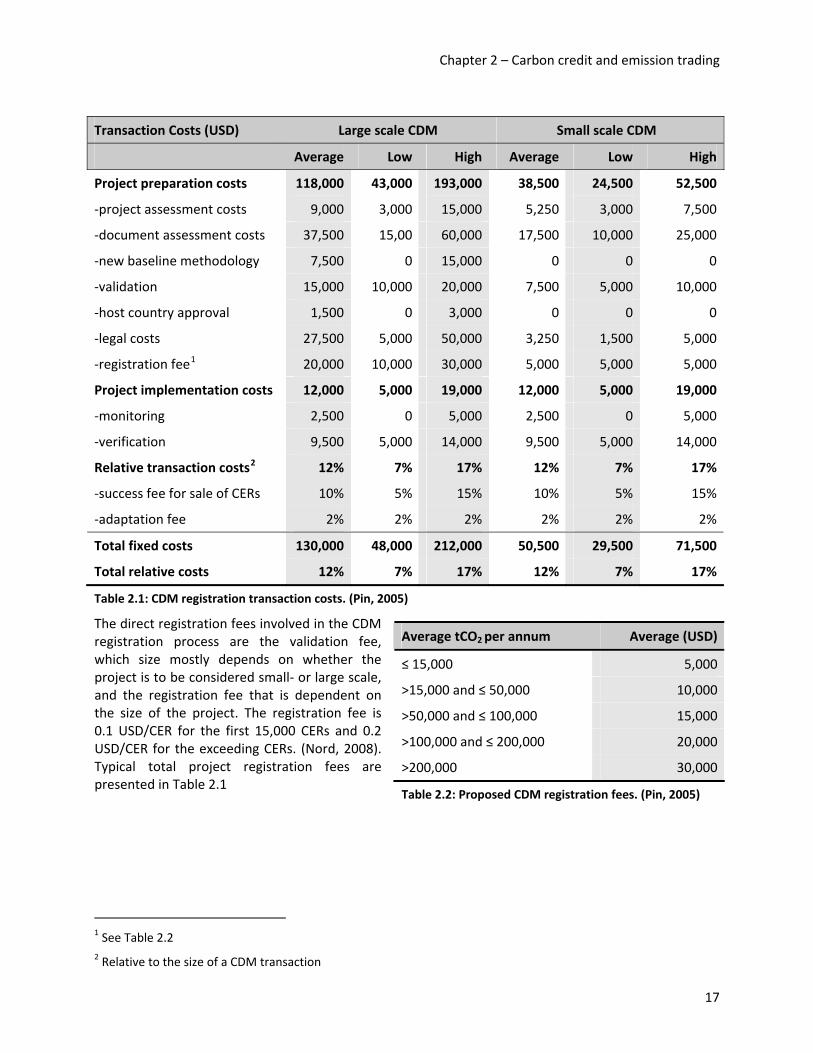
Chapter 2 – Carbon credit and emission trading
Transaction Costs (USD) Large scale CDM Small scale CDM
Average Low High Average Low High
Project preparation costs 118,000 43,000 193,000 38,500 24,500 52,500
‐project assessment costs 9,000 3,000 15,000 5,250 3,000 7,500
‐document assessment costs 37,500 15,00 60,000 17,500 10,000 25,000
‐new baseline methodology 7,500 0 15,000 0 0 0
‐validation 15,000 10,000 20,000 7,500 5,000 10,000
‐host country approval 1,500 0 3,000 0 0 0
‐legal costs 27,500 5,000 50,000 3,250 1,500 5,000
‐registration fee1 20,000 10,000 30,000 5,000 5,000 5,000
Project implementation costs 12,000 5,000 19,000 12,000 5,000 19,000
‐monitoring 2,500 0 5,000 2,500 0 5,000
‐verification 9,500 5,000 14,000 9,500 5,000 14,000
Relative transaction costs2 12% 7% 17% 12% 7% 17%
‐success fee for sale of CERs 10% 5% 15% 10% 5% 15%
‐adaptation fee 2% 2% 2% 2% 2% 2%
Total fixed costs 130,000 48,000 212,000 50,500 29,500 71,500
Total relative costs 12% 7% 17% 12% 7% 17%
Table 2.1: CDM registration transaction costs. (Pin, 2005)
The direct registration fees involved in the CDM registration process are the validation fee, which size mostly depends on whether the project is to be considered small‐ or large scale, and the registration fee that is dependent on the size of the project. The registration fee is 0.1 USD/CER for the first 15,000 CERs and 0.2 USD/CER for the exceeding CERs. (Nord, 2008). Typical total project registration fees are presented in Table 2.1
Average tCO2 per annum Average (USD)
≤ 15,000 5,000
>15,000 and ≤ 50,000 10,000
>50,000 and ≤ 100,000 15,000
>100,000 and ≤ 200,000 20,000
>200,000 30,000
Table 2.2: Proposed CDM registration fees. (Pin, 2005)
1 See Table 2.22 Relative to the size of a CDM transaction
17

Chapter 2 – Carbon credit and emission trading
0
20,000
40,000
60,000
80,000
100,000
120,000
140,000
160,000
180,000USD
Total costs: $50,000‐$225,000
Validation ($10,000‐$40,000)
Legal/Due Diligence ($10,000‐$40,000)
Registration/CDM taxes ($0‐$30,000)
Monitoring & Verification ($5,000‐$15,000)
PDD, DNA approval ($10,000‐$40,000)
Prefeasibil ity, PIN development ($15,000‐$60,000)
Figure 2.2: CDM transaction costs. (Hodes, 2007, p.10).
2.4.4 Joint Implementation and Emission Reduction Units The Joint Implementation (JI) mechanism is similar to the CDM but it allows an Annex B country to implement an emission reducing project in another Annex B country. A valid JI project will then earn Emission Reduction Units (ERU) which allows the owner to emit one ton of CO2. These instruments can be traded on the market.
In contrary to the CDM projects the issue of ERUs will not increase the total number of emission rights on the market. Upon project approval a number of the host country’s AAUs, equivalent to the projects emission reduction, are converted into ERUs. These are then transferred from the host country to the investor country (UNFCC, 2005).
The JI projects are intended to take place in the so‐called economies in transition within Annex B. Because of the EU decision on double counting, the potential of JI within EU has been substantially restricted to projects outside the scope of EU ETS, see Chapter 2.5 for more details, to for instance reduction of Methane or NXO (World Bank, 2008). This has lead to the major JI project growth being located to Russia and Ukraine which represents 69% and 21% respectively of the pipeline of expected 2012 ERU supply.
As for the CDM, the JI project must create emission reductions additional to any that would otherwise have occurred. For a party to be eligible to transfer ERUs through a JI project it must fulfill certain eligibility requirements according to the JI guidelines of the UNFCC. These guidelines are mainly regarding the registration and reporting under the Kyoto Protocol and can be summarized as follows:
The hosting country
• is a party to the Kyoto Protocol.
• must calculate and record its assigned emission amount according to certain UNFCC standards.
18

Chapter 2 – Carbon credit and emission trading
• has in place a national system for the estimation of anthropogenic emissions by sources and anthropogenic removals by sinks of all greenhouse gases not controlled by the Montreal Protocol1.
• has a national emission registry to supply the information needed in compliance with the Kyoto Protocol.
• has annually submitted the most recent required inventory, including the national inventory report and the common reporting format. For the first commitment period, the quality assessment needed for the purpose of determining eligibility to use the mechanisms shall be limited to the parts of the inventory pertaining to emissions of greenhouse gases from sources/sector categories from Annex A to the Kyoto Protocol and the submission of the annual inventory on sinks2 .
• submits the supplementary information on assigned amount in accordance with the Kyoto Protocol requirements and makes any additions to, and subtractions from, assigned amount pursuant depending on for example the change of land use.
Unlike the CDM projects, JI projects must be approved by the Annex B host country on a case‐by‐case basis. Depending on if the host party fulfills the above stated eligibility requirements or not, the ERU issuance process will differ.
If the requirements are fulfilled, a simplified JI procedure called Track 1 may be pursued. The host country may verify that a project that will reduce emission or create carbon dioxide sinks in addition to what otherwise would have occurred. In that case the host party may issue the appropriate quantity of ERUs. ERUs should be transferred annually during the JI commitment period.
If the host party does not meet all of the eligibility requirements, the verification of emission reductions or removals that are additional to what otherwise would have occurred is made by the Joint Implementation Supervisory Committee (JISC) in a process called Track 2. Upon JISC verification the host country may transfer the appropriate quantity of ERUs.
Like the registration of CDM projects, the Track 2 process is very time demanding. As of March 2008, out of 129 JI Track 2 projects in the JISC pipeline, only one has been rejected and one has been approved (World Bank, 2008)
Transaction costs The transaction costs of JI are similar to the costs of CDM projects but depending on whether the project is Track 1 eligible or not, the costs can differ significantly. The major differences can be summarized according to Table 2.3.
1 http://www.unep.org/OZONE/pdfs/Montreal‐Protocol2000.pdf 2 A carbon sink is a removal of greenhouse gases through activity that binds carbon, e.g. forestation
19
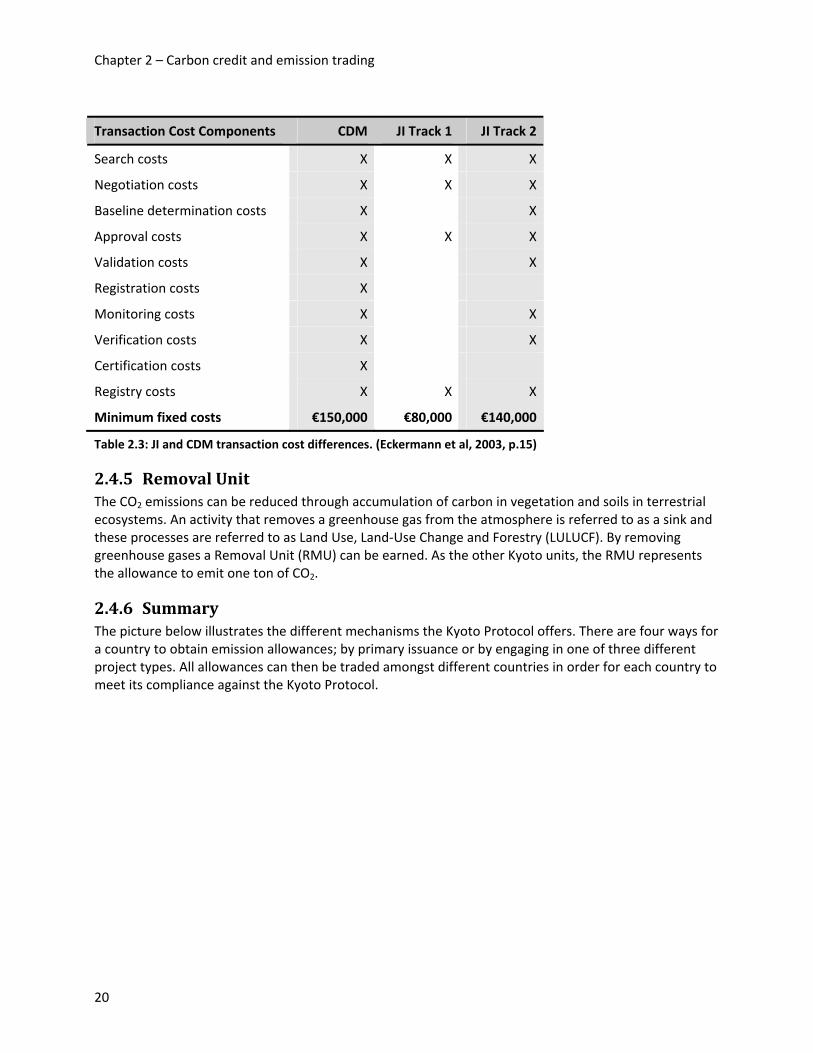
Chapter 2 – Carbon credit and emission trading
Transaction Cost Components CDM JI Track 1 JI Track 2
Search costs X X X
Negotiation costs X X X
Baseline determination costs X X
Approval costs X X X
Validation costs X X
Registration costs X
Monitoring costs X X
Verification costs X X
Certification costs X
Registry costs X X X
Minimum fixed costs €150,000 €80,000 €140,000
Table 2.3: JI and CDM transaction cost differences. (Eckermann et al, 2003, p.15)
2.4.5 Removal Unit The CO2 emissions can be reduced through accumulation of carbon in vegetation and soils in terrestrial ecosystems. An activity that removes a greenhouse gas from the atmosphere is referred to as a sink and these processes are referred to as Land Use, Land‐Use Change and Forestry (LULUCF). By removing greenhouse gases a Removal Unit (RMU) can be earned. As the other Kyoto units, the RMU represents the allowance to emit one ton of CO2.
2.4.6 Summary The picture below illustrates the different mechanisms the Kyoto Protocol offers. There are four ways for a country to obtain emission allowances; by primary issuance or by engaging in one of three different project types. All allowances can then be traded amongst different countries in order for each country to meet its compliance against the Kyoto Protocol.
20

Chapter 2 – Carbon credit and emission trading
Figure 2.3: The Kyoto Protocol’s mechanisms and emission allowance units.
2.5 The European Union Emission Trading Scheme The members of the European Union decided to introduce its own trading scheme as a response to its obligations towards the Kyoto Protocol. An agreement which entered into force in October 2003 was reached and in January 2005 the European Union Emission Trading Scheme (EU ETS) was launched.
The EU ETS is the largest multi‐national emission trading system in the world and covers over ten thousand installations which together accounts for nearly half of the EU CO2 emission and 40% of its total GHG emission. Sectors included by the EU ETS are the energy intense sectors presented below:
• Power stations and other combustion plants
• Oil refineries
• Coke ovens
• Iron and steel plants
• Factories manufacturing cement, glass, lime, bricks, ceramics, pulp, paper and board
In order for an installation within one of these sectors to be included in the EU ETS it must reach certain capacity thresholds. By limiting the emission of installation within these industries, EU could control one part of their emission targets. Each entity with compliance against the EU ETS is required to hand in an amount of carbon credits corresponding to their actual emissions each year.
The EU member states are separately able to decide how their agreed Kyoto reduction targets should be achieved. Except for targeting the industries included by the EU ETS, each country could decide to allocate more or less of the emission reduction to sectors such as transportation, agriculture and residential. This could be done through for example taxation.
To which extent each country should achieve their emission targets through the EU ETS is determined by the so‐called National Allocation Plan (NAP). This plan will also decide how many allowances that should be issued for each period in total as well as for each installation. The European Commission (EC) oversees the NAP process and decides if it fulfills the required criteria, of which the most important one is that each country’s total emissions equals that country’s Kyoto emission cap. The emission controlling instrument which is distributed through the NAPs is the so called EU Emission Allowance (EUA), which is comparable with the Kyoto AAU.
21

Chapter 2 – Carbon credit and emission trading
2.5.1 Phase I The first NAP covered the period from 2005 to 2007 and included all of the, at that time, 15 EU member states. As the EU ETS system was on the forefront of the emission trading development, the possible effects of this first period of emission trading were far from clear. To avoid putting to much pressure on the included companies a vast majority of the emission certificates that each company needed to cover their current emissions were handed out for free. Only 0.2% of the allocated allowances were allowed to be auctioned during Phase I.
The idea was that a shortage of credits would evolve as companies grew and had to increase their emissions or initiate emission reduction projects. Any emissions exceeding each entities NAP target was fined €40 per ton of CO2e, unless the exceeding was compensated by buying more EUAs on the EU ETS market. However, companies were not very conservative when applying for the EUAs which led to a situation where demand for credits fell.
If the amount of EUAs that should be handed in every year was less then the amount of EUAs possessed by a certain entity, the EUAs could be banked to coming years. However, the EUAs could only be banked within Phase I, any surplus after 2007 was lost (Agcert, 2008). The Phase I certificates were virtually not traded at all by the end of 2007, when the market already had started to focus on the trading of Phase II instruments.
2.5.2 Phase II The experience from Phase I strengthened the design of the EU ETS through the launch of Phase II which is ranging from 2008 to 2012. The improvements from Phase I include tighter emission targets, stronger flexibility provisions for compliance and longer‐term visibility in action to reduce emissions until 2020 (World Bank, 2008).
A supply surplus during the first phase caused carbon credit prices to plummet. In order to comply with the over‐allocation problem the emission targets for the included parties were significantly tightened as the reviewed NAPs have been cut by 10.4% below the cap originally suggested by the member states (World Bank, 2008) which corresponds to a reduction of 21% below 2005 levels by 2020.
The auctioning of EUAs within the EU member states also increased significantly. From the previous 0.2%, governments will be able to auction up to 10% of their EUAs during Phase II. The remaining 90% must be handed out for free. The fee for exceeding emission targets is also increased to €100 per emitted ton of GHG (Agcert, 2008).
The scope of the trading system is also extended in certain countries (e.g. installations emitting NXO in France) and suggested to include new sectors, e.g. the flight industry. There are still some unresolved issues regarding the legislation for the flight sector, concerning for example emission cap and auctioning cap. Finally, new countries such as Norway and Iceland have been included by the EU ETS through Phase II.
A big difference is that the Kyoto CER and ERU credits are being introduced to the EU ETS system through the conversion process of the EU linking directive. By conducting CDM or JI projects, companies will be able to import CER and ERUs to the EU ETS system for trading or compliance. The issues concerning this linking are described further in Chapter 2.8.2. The proportion of CER/ERU that each member state can use to fulfill its emission target is limited to 10% CERs. In some cases, depending on the effort needed from each member state to reach their target, this limit can be higher. (Europa, 2006)
As of this writing, September 2008, there are still uncertainties regarding each country’s Phase II NAPs as some countries are suing the EC as they are dissatisfied with their NAP. Also, some EU members are still missing lists of specific installations that are to be included by the EU ETS. This is because of the linking problems described in Chapter 2.8.2.
22

Chapter 2 – Carbon credit and emission trading
Another big difference from Phase I is that banking of EUAs is possible from Phase II to future compliance periods. This creates a clearer connection between the phases of the EU ETS and analysts could treat the different phases as one. However, borrowing of carbon credits from future periods is not allowed. A draft proposal of Phase III stated a certificate extension horizon of another 8 years, to 2020. Guidance and transparency regarding the post‐2012 phase of the EU ETS has improved significantly from the first phase. Further details on the future of emission trading is described in Chapter 0.
2.5.3 Summary
Figure 2.4: The EU ETS’ mechanisms and emission allowance units.
The figure to the right illustrates the different mechanisms and emission allowances that are present within the EU ETS. EUAs are issued from the European Commission with the NAPs as a basis. Allowances spawning from JI or CDM projects are allowed to be imported into the EU ETS. All these three units are then tradable between firms in order to allow each firm to be able to meet its compliance against the EU ETS.
2.6 Post 2012 emission restrictions The first commitment period of the Kyoto Protocol ends in 2012 but discussions concerning the outlining of the next commitment has been initiated by the G8 +5 (Canada, France, Germany, Italy, Japan, Russia, United Kingdom, United States, Brazil, China, India, Mexico, South Africa). A non‐binding agreement on global warming for the period after 2012 was reached in Washington D.C. in 2007. The group agreed that there is no doubt that anthropogenic causes are behind global warming and that an emission cap system should be applied to developed and developing countries to succeed the Kyoto Protocol.
There has been criticism against the CDM from many directions and there are forces that fight to restructure the future rules of CDM projects. One argument (Environmental defense, 2007) presented is that the mechanism slows down the non‐Annex I countries own emission reductions and puts to much focus on the Annex B countries, which alone cannot manage sufficient emission reductions.
2.6.1 Future of the EU ETS In the beginning of 2008 the EU Commission adopted a proposal to amend the current EU ETS Directive. The main features of the proposal are:
• An EU emission target of 20% below 1990 levels by 2020.
• Emissions not covered by the EU ETS should be cut to 10% below 2005 levels by 2020.
• Development of Carbon Capture and Storage (CCS) technologies that allows capturing and underground storing of CO2.
23
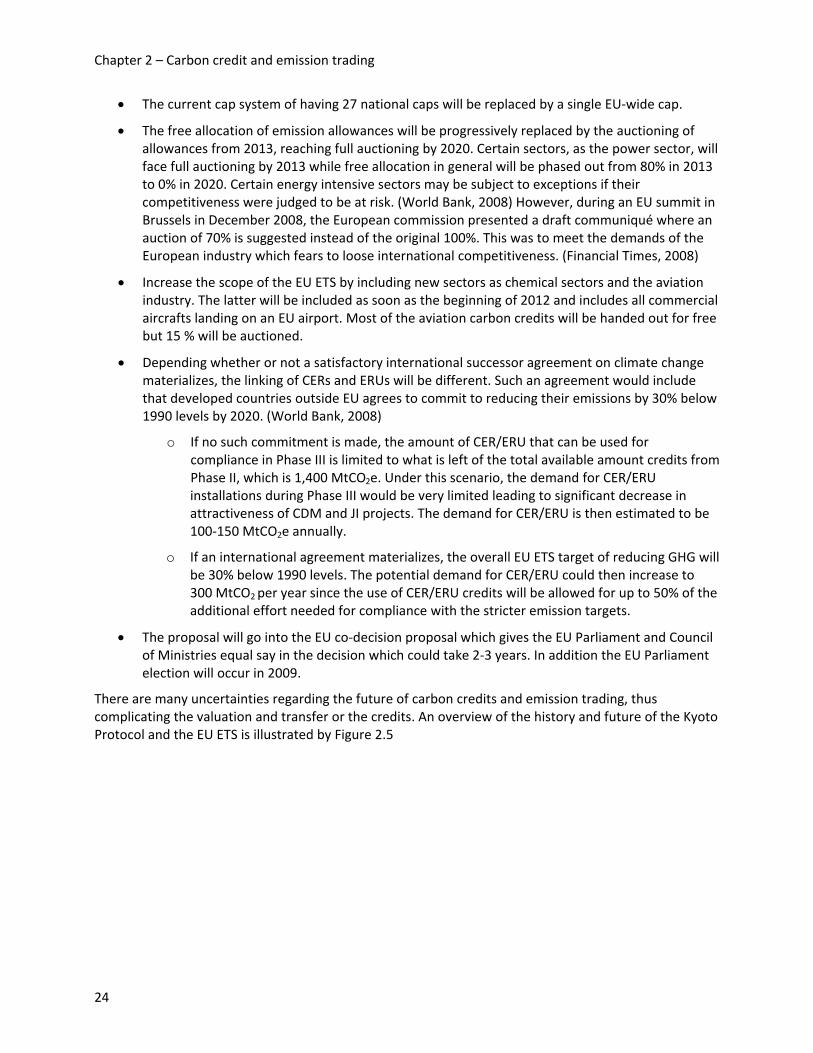
Chapter 2 – Carbon credit and emission trading
• The current cap system of having 27 national caps will be replaced by a single EU‐wide cap.
• The free allocation of emission allowances will be progressively replaced by the auctioning of allowances from 2013, reaching full auctioning by 2020. Certain sectors, as the power sector, will face full auctioning by 2013 while free allocation in general will be phased out from 80% in 2013 to 0% in 2020. Certain energy intensive sectors may be subject to exceptions if their competitiveness were judged to be at risk. (World Bank, 2008) However, during an EU summit in Brussels in December 2008, the European commission presented a draft communiqué where an auction of 70% is suggested instead of the original 100%. This was to meet the demands of the European industry which fears to loose international competitiveness. (Financial Times, 2008)
• Increase the scope of the EU ETS by including new sectors as chemical sectors and the aviation industry. The latter will be included as soon as the beginning of 2012 and includes all commercial aircrafts landing on an EU airport. Most of the aviation carbon credits will be handed out for free but 15 % will be auctioned.
• Depending whether or not a satisfactory international successor agreement on climate change materializes, the linking of CERs and ERUs will be different. Such an agreement would include that developed countries outside EU agrees to commit to reducing their emissions by 30% below 1990 levels by 2020. (World Bank, 2008)
o If no such commitment is made, the amount of CER/ERU that can be used for compliance in Phase III is limited to what is left of the total available amount credits from Phase II, which is 1,400 MtCO2e. Under this scenario, the demand for CER/ERU installations during Phase III would be very limited leading to significant decrease in attractiveness of CDM and JI projects. The demand for CER/ERU is then estimated to be 100‐150 MtCO2e annually.
o If an international agreement materializes, the overall EU ETS target of reducing GHG will be 30% below 1990 levels. The potential demand for CER/ERU could then increase to 300 MtCO2 per year since the use of CER/ERU credits will be allowed for up to 50% of the additional effort needed for compliance with the stricter emission targets.
• The proposal will go into the EU co‐decision proposal which gives the EU Parliament and Council of Ministries equal say in the decision which could take 2‐3 years. In addition the EU Parliament election will occur in 2009.
There are many uncertainties regarding the future of carbon credits and emission trading, thus complicating the valuation and transfer or the credits. An overview of the history and future of the Kyoto Protocol and the EU ETS is illustrated by Figure 2.5
24
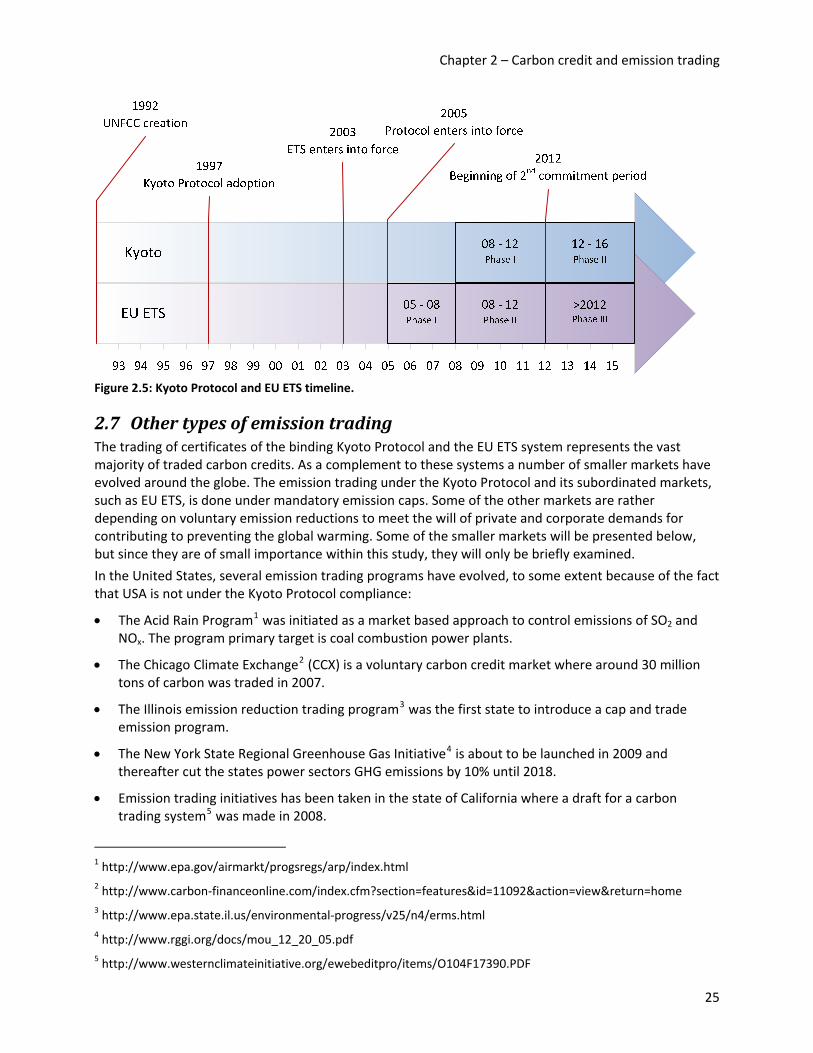
Chapter 2 – Carbon credit and emission trading
Figure 2.5: Kyoto Protocol and EU ETS timeline.
2.7 Other types of emission trading The trading of certificates of the binding Kyoto Protocol and the EU ETS system represents the vast majority of traded carbon credits. As a complement to these systems a number of smaller markets have evolved around the globe. The emission trading under the Kyoto Protocol and its subordinated markets, such as EU ETS, is done under mandatory emission caps. Some of the other markets are rather depending on voluntary emission reductions to meet the will of private and corporate demands for contributing to preventing the global warming. Some of the smaller markets will be presented below, but since they are of small importance within this study, they will only be briefly examined.
In the United States, several emission trading programs have evolved, to some extent because of the fact that USA is not under the Kyoto Protocol compliance:
• The Acid Rain Program1 was initiated as a market based approach to control emissions of SO2 and NOx. The program primary target is coal combustion power plants.
• The Chicago Climate Exchange2 (CCX) is a voluntary carbon credit market where around 30 million tons of carbon was traded in 2007.
• The Illinois emission reduction trading program3 was the first state to introduce a cap and trade emission program.
• The New York State Regional Greenhouse Gas Initiative4 is about to be launched in 2009 and thereafter cut the states power sectors GHG emissions by 10% until 2018.
• Emission trading initiatives has been taken in the state of California where a draft for a carbon trading system5 was made in 2008.
1 http://www.epa.gov/airmarkt/progsregs/arp/index.html 2 http://www.carbon‐financeonline.com/index.cfm?section=features&id=11092&action=view&return=home 3 http://www.epa.state.il.us/environmental‐progress/v25/n4/erms.html 4 http://www.rggi.org/docs/mou_12_20_05.pdf 5 http://www.westernclimateinitiative.org/ewebeditpro/items/O104F17390.PDF
25

Chapter 2 – Carbon credit and emission trading
In Australia, among the most recent countries to sign the Kyoto Protocol, the New South Wales Gas Abatement Scheme1 was launched in 2003. It enforces electricity producers and large consumers to offset their emission by purchase of certificates. The profit from these certificates has been used to finance energy efficiency measures such as free energy efficient light‐bulbs. A domestic cap and trade emission system called the Australian Carbon Trading Scheme2 will be launched by 2010 as a part of meeting the country’s emission restrictions.
In September 2008, a bill on climate change3 was passed in New Zealand. Except for establishing a trading scheme the bill also legislated for preference of renewable energy generation.
The Asia Carbon Exchange4 (ACX) is a CDM focused exchange that claims to be positioned as a global platform for sellers and buyers of CERs.
In addition several voluntary trading schemes have evolved. Except for the above mentioned CCX, there is a UK Emissions Trading Scheme (UK ETS), Japan’s Voluntary Emissions Trading Scheme (JVETS), the European Climate Exchange (ECX) which is a subsidiary of CCX, the Montreal Climate Exchange (MCEX)
which is a cooperation between CCX and the Montreal Exchange. These exchanges satisfy the demand of voluntary climate compensation of the aviation industry amongst others.
Figure 2.6: The mechanisms and allowances available for the other markets.
The figure to the left summarizes the mandatory emission trading outside EU ETS and the voluntary emission trading. There are domestic systems allowing primary issuance of tradable carbon credits which then are used to comply against the particular trading scheme’s authorities. The voluntary markets have no compliance, but offer firms to buy certificates for climate compensation reasons.
2.8 The carbon credit market The carbon credit market consists of several co‐linked markets, schematically illustrated by Figure 2.7. This chapter will give a further description of the carbon credit marketplace and the instruments commonly available for trading.
1 http://greenhousegas.nsw.gov.au/ 2 http://www.climatechange.gov.au/emissionstrading/index.html 3 http://www.beehive.govt.nz/release/climate+change+legislation+introduced 4 http://www.icao.int/env/vets_report.pdf
26

Chapter 2 – Carbon credit and emission trading
Kyoto Protocol
Kyoto Trading
CDM (CER)Primary
allowances (AAU)
JI (ERU) LULUCF (ERU)
Kyoto Compliance
Primary Allowances
(Various units)
Domestic Compliance
Domestic Trading
Primary Allowances
(EUA)
Linked Kyoto Units
EU ETS Compliance
EU ETSTrading
Various voluntary units
Voluntary markets
EU ETSOther domestic
emission trading systems
Figure 2.7: Schematic overview of the carbon credit market.
The figure illustrates the following:
• The EU ETS market, together with smaller domestic markets, is subordinated the international Kyoto Protocol which governments with emission caps have to comply against.
• Kyoto units are distributes among governments which in turn distribute local units to installations to control a certain amount of each governments total emission cap through a local compliance.
27

Chapter 2 – Carbon credit and emission trading
• The Kyoto project‐based units are transferable to the EU ETS market.
• Global and local units are traded at marketplaces to ensure that each installation and government fulfill their emission targets.
• The voluntary market is growing but does not create any binding compliance with the Kyoto Protocol.
2.8.1 Carbon market characteristics The properties, such as market size and development, of the various market places linked together according to Figure 2.7 are briefly described in this chapter.
Allowancebased markets The base of carbon credit trading is the allowance‐based market, which is the market where allocated emission rights such as AAUs or EUAs are traded.
As the AAUs have not been traded up to this date, September 2008, the trading of EUAs is the largest carbon market by far, see Table 2.4 below. As mentioned in Chapter 2.7 there are several smaller market places, both mandatory and voluntary, besides the large EUA trading. The largest of those are The New South Wales exchange, which is in its starting phase as Australia’s proposed national emission trading scheme is projected to be fully operational in 2010, and the Chicago Climate Exchange (CCX) which mainly trades voluntary emission permits
2006 Volume (MtCO2e)
2006 Value (MUSD)
2007 Volume (MtCO2e)
2007 Value (MUSD)
EU ETS (EUAs) 1,104 24,436 2,061 50,097
New South Wales 20 225 25 224
CCX 10 38 23 72
Table 2.4: Annual volumes and values of transactions on the main allowance markets. (World Bank, 2008, p. 7)
More than two billion EUAs changed hands for a market value of 50 billion USD on the EU ETS market. This corresponds to a nearly doubling in both volume and value compared to 2006 and nearly six times the volume and value compared to 2005. 80 percent of the transacted EUA volumes were struck over‐the‐counter, with the London Energy Brokers Association (LEBA) accounting for slightly more than half of the activity (The World Bank, 2008).
Projectbased markets Besides the trading of allocated emission rights markets, credits earned from project‐based mechanisms are traded. The development of the project‐based market is illustrated by Table 2.5 and Figure 2.8 below.
28
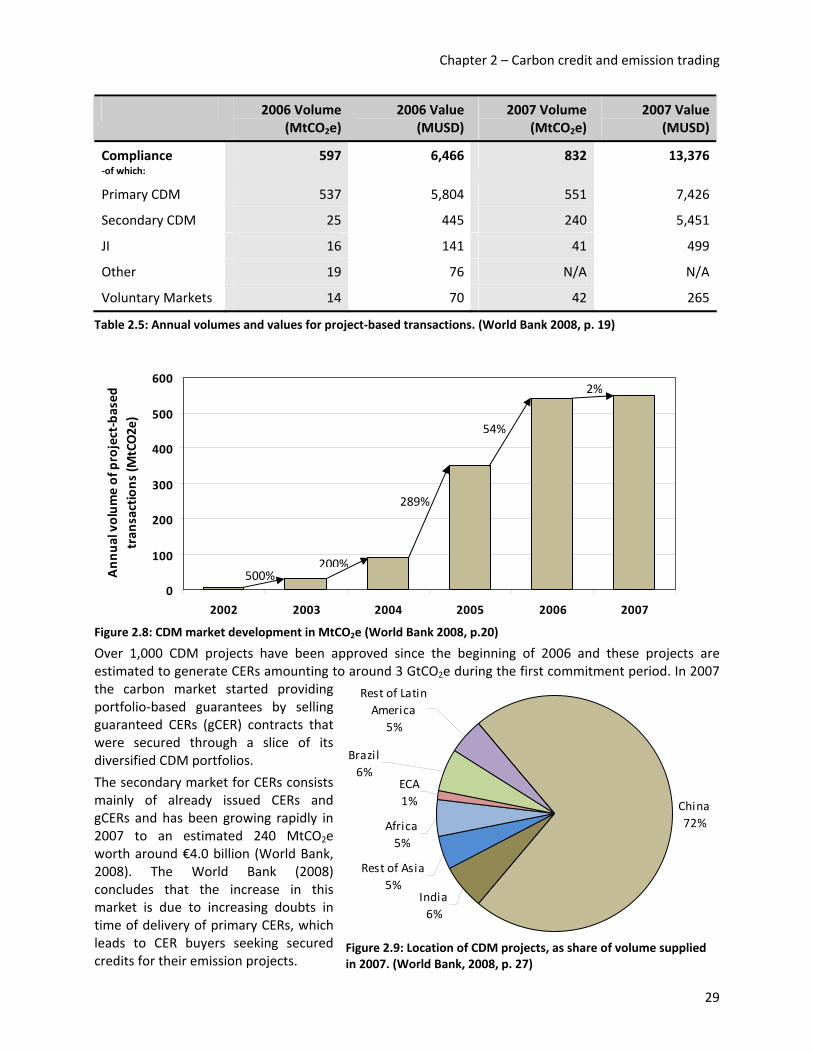
Chapter 2 – Carbon credit and emission trading
2006 Volume (MtCO2e)
2006 Value(MUSD)
2007 Volume (MtCO2e)
2007 Value(MUSD)
Compliance ‐of which:
597 6,466 832 13,376
Primary CDM 537 5,804 551 7,426
Secondary CDM 25 445 240 5,451
JI 16 141 41 499
Other 19 76 N/A N/A
Voluntary Markets 14 70 42 265
Table 2.5: Annual volumes and values for project‐based transactions. (World Bank 2008, p. 19)
0
100
200
300
400
500
600
2002 2003 2004 2005 2006 2007
Ann
ual volum
e of project‐based
tran
sactions
(MtCO2e)
Figure 2.8: CDM market development in MtCO2e (World Bank 2008, p.20)
Over 1,000 CDM projects have been approved since the beginning of 2006 and these projects are estimated to generate CERs amounting to around 3 GtCO2e during the first commitment period. In 2007 the carbon market started providing portfolio‐based guarantees by selling guaranteed CERs (gCER) contracts that were secured through a slice of its diversified CDM portfolios.
The secondary market for CERs consists mainly of already issued CERs and gCERs and has been growing rapidly in 2007 to an estimated 240 MtCO2e worth around €4.0 billion (World Bank, 2008). The World Bank (2008) concludes that the increase in this market is due to increasing doubts in time of delivery of primary CERs, which leads to CER buyers seeking secured credits for their emission projects.
China72%
Rest of Asia5%
Africa5%
ECA1%
Brazil6%
Rest of Latin America
5%
India6%
Figure 2.9: Location of CDM projects, as share of volume supplied in 2007. (World Bank, 2008, p. 27)
200%500%
2%
54%
289%
29

Chapter 2 – Carbon credit and emission trading
China dominates the CDM market for the third consecutive year with a market share of 73 % and 53 % potential CER supply projects in the pipeline. Buyers cite China’s large size, economies of scale in origination and its favorable investment climate as reasons. The exploding CDM project activity has created well functioning administrative systems in big CDM countries such as China and India. The distribution of primary sellers is depicted in Figure 2.9. (World Bank, 2008)
Most JI projects are carried out in Russia or Ukraine and because of the lack of experience and well functioning administrative processes in these countries, JI development has been slow. Though, these countries have recently improved their JI procedures (World Bank, 2008) thus reducing regulatory uncertainties. Due to this, the JI market has been growing lately, but it is still small in comparison to the CDM market.
2.8.2 Practical implications of carbon credit trading In order to hold and trade emission units a nation has to implement a national registry which contains accounts specifying which units are held in the name of the government or in the name of the legal entities authorized by the government to hold and trade units. It is against these registries that compliance with emission caps will be checked at the end of a period.
In addition to the national registries the UNFCCC secretariat has implemented a CDM registry for issuing CDM credits and distributing them to national registries. However the accounts in the CDM registry are held only by CDM project participants as the registry does not accept emissions trading between accounts. (UNFCCC, 2008d)
Trading of emission units between non EU ETS participants are settled via the International Transaction Log (ITL). This is a system for checking transactions proposed by registries to ensure that they are consistent with the rules agreed under the Kyoto Protocol. (UNFCCC, 2008b) In 2007 the registries of Japan, New Zealand and Switzerland were connected via the ITL. (UNFCCC, 2008c)
As EU trading legislation preceded the international Kyoto trading it sets in place rules that are above those agreed for the Kyoto Protocol. A supplemental transaction log has been implemented by the European Commission; the Community Independent Transaction Log (CITL). This log records issuance, transfer, cancellation and banking of allowances that take place in the EU ETS. (European Commission, 2008) The CITL and ITL are as of September 2008 not connected to each other, making it impossible to trade CERs between non‐project participants. (UNFCCC, 2008b) The current registry structure is shown below.
Figure 2.10: The current registry structure as of September 2008. (UNFCCC, 2008b)
Under the second phase of the EU ETS, EU allowances are considered specific Kyoto units which have been valid for trading under the scheme. Transactions in EUAs are therefore recorded automatically as transactions under the Kyoto Protocol.
30

Chapter 2 – Carbon credit and emission trading
EU registries are therefore to switch their connections from the CITL to the ITL from the start of the second commitment period starting in 2008. This switch has been delayed due to a delay in the ITL‐CITL connection setup, which is scheduled to be implemented on 6 October 2008. When the systems are integrated, the CITL will then perform additional checks if transactions between EU registries are performed via the ITL link, to monitor trading within EU ETS, as shown in the figure below.
Figure 2.11: The registry structure after the connection of the CITL and the ITL. (UNFCCC, 2008d)
Implications of the ITLCITL link on the market The vast majority of 170 million issued CERs have remained in the CDM registry due to that the CERs are until October 2008 only tradable between CDM project partners. This has stifled the CER spot market, see Chapter 2.8.3 for more details. Once the link is complete a boost in liquidity is expected as the last barriers to trading of all instruments on all platforms are removed.
Many EU states delayed their EUA issuance due to concerns over the legality of EUA trading before the connection is done. The lack of the connection has complicated spot trading of EUAs because of the parallel CITL‐ and ITL verification that needs to be done. The completion of the link will therefore trigger issuance of EUAs from those states as well as enabling verification of future contracts that soon needs to be closed. (Vitelli, A, 2008) All currently executed cross‐border EUA trades have not been verified, effectively creating a backlog of AAU trades that needs to be executed as soon as the link is operational (Carbon Finance, 2008).
2.8.3 Instruments Among the carbon credits mentioned in previous chapter, the EUA and the CER are the two which are commonly traded. Several exchanges offer the possibility to trade EUAs and CERs on a spot basis as well as with futures and options. Below is a brief presentation of different instruments available and examples of how the different instruments can be used are illustrated in Appendix B.
Spot instruments The New York Stock Exchange offers spot trading of both EUAs and CERs through its environmental exchange BlueNext. The spot EUA exchanged on BlueNext is a real time settled contract traded in multiples of 1,000 tons of Phase II EUAs, also known as lots (BlueNext, 2008). NordPool offers trading with EUA spot contracts, under identical contract terms.
European Energy Exchange (EEX) offered spot exchange of EUAs from the first phase and is now waiting for the German Emissions Trading Authority to issue EUAs for the period 2008 – 2012. (European Energy Exchange, 2008)
31
Chapter 2 – Carbon credit and emission trading
NordPool and EEX are expected to launch spot contracts once the ITL‐CITL link is complete. (Vitelli, A. 2008)
As of 12 August 2008 BlueNext offers trading in spot CER, via the Swiss national registry. The CERs that are traded must be selected on the advice of BlueNext’s Expert Committee. Trading is done similar to the EUA spots in multiples of 1,000 tons and real‐time settlement. (BlueNext, 2008)
EUA futures BlueNext, EEX, European Climate Exchange (ECX), as well as NordPool offer trading with future contracts with EUAs as underlying. The future contracts are for one lot of EUAs with physical settlement and the main difference between each exchange is the available maturity dates. The table below depicts the different maturity options that are available.
2008 2009 2010 2011 2012 2013 2014‐
BlueNext Annual contracts No contracts
EEX Annual contracts No contracts
ECX Quarterly contracts Annual contracts
No contracts
NordPool Annual contracts No contracts
Table 2.6: The maturity of EUA futures available from each exchange. (BlueNext, 2008; European Energy Exchange, 2008; European Climate Exchange 2008d and NordPool, 2008).
CER futures ECX, EEX and NordPool offer trading with futures on secondary CERs. BlueNext also offers trading with futures on CERs, but with the restriction that the CER generating projects are approved by BlueNext’s Expert Committee to minimize the risk of issuance approval failure. The contracts are for physical delivery of one lot of CER units and the contracts have different available maturity, as shown in the table below.
2008 2009 2010 2011 2012 2013 2014‐
BlueNext Annual contracts No contracts
EEX Annual contracts No contracts
ECX Quarterly contracts No contracts
NordPool Annual contracts No contracts
Table 2.7: The maturity of CER futures available from each exchange. (BlueNext, 2008; European Energy Exchange, 2008; European Climate Exchange 2008d and NordPool, 2008).
EUA options The ECX and the EEX also trade in European options with each exchanges respective future contract on EUAs as the underlying. The expiry date for the ECX and EEX options are in December 2008 through 2012.
Due to the fundamental design of the EU ETS, where compliance users are only required to surrender their allowances once a year, the only options currently traded have annual expiry dates. The lengthy time to expire together with a rather high volatility of the EUAs has made premiums relative expensive
32
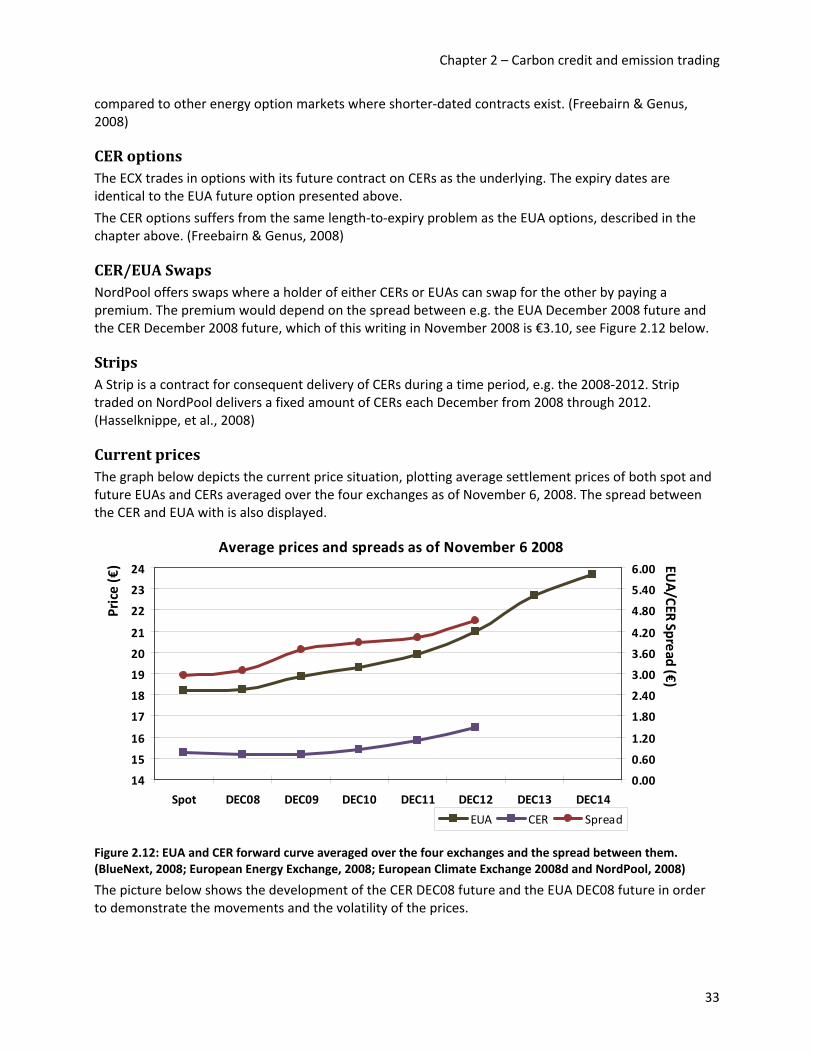
Chapter 2 – Carbon credit and emission trading
compared to other energy option markets where shorter‐dated contracts exist. (Freebairn & Genus, 2008)
CER options The ECX trades in options with its future contract on CERs as the underlying. The expiry dates are identical to the EUA future option presented above.
The CER options suffers from the same length‐to‐expiry problem as the EUA options, described in the chapter above. (Freebairn & Genus, 2008)
CER/EUA Swaps NordPool offers swaps where a holder of either CERs or EUAs can swap for the other by paying a premium. The premium would depend on the spread between e.g. the EUA December 2008 future and the CER December 2008 future, which of this writing in November 2008 is €3.10, see Figure 2.12 below.
Strips A Strip is a contract for consequent delivery of CERs during a time period, e.g. the 2008‐2012. Strip traded on NordPool delivers a fixed amount of CERs each December from 2008 through 2012. (Hasselknippe, et al., 2008)
Current prices The graph below depicts the current price situation, plotting average settlement prices of both spot and future EUAs and CERs averaged over the four exchanges as of November 6, 2008. The spread between the CER and EUA with is also displayed.
Average prices and spreads as of November 6 2008
14
15
16
17
18
19
20
21
22
23
24
Spot DEC08 DEC09 DEC10 DEC11 DEC12 DEC13 DEC14
Price (€)
0.00
0.60
1.20
1.80
2.40
3.00
3.60
4.20
4.80
5.40
6.00 EUA/CER Spread (€)
EUA CER Spread
Figure 2.12: EUA and CER forward curve averaged over the four exchanges and the spread between them. (BlueNext, 2008; European Energy Exchange, 2008; European Climate Exchange 2008d and NordPool, 2008)
The picture below shows the development of the CER DEC08 future and the EUA DEC08 future in order to demonstrate the movements and the volatility of the prices.
33

Chapter 2 – Carbon credit and emission trading
Figure 2.13: Historical prices in USD of EUA and CER futures with delivery in December 2008. (JPMorgan, 2008b, p. 1, modified)
34

3 ABB and the carbon credit market Determining the present state of ABB’s carbon credit market activity is an important step along the way of fulfilling the purpose of this study. This chapter will evaluate the current and future carbon credit market involvement of ABB. The evaluation will focus on ABB as a carbon credit supplier but also consider the company carbon credit compliance demands.
3.1 ABB and carbon credit supply ABB is a global leader in power and automation technologies that enable utility and industry customers to improve their performance. The products of ABB creates energy efficient processes, thus reducing energy costs and at the same time emissions. The potential role of ABB within the carbon credit market is therefore obvious. Emission reduction could either generate indirect sales argument or direct generation of carbon credits and thereby act as an alternative way of financing projects.
ABB initiated the involvement in the carbon credit market during the late 1990´s. The company saw big business opportunities through the ABB products which could decrease energy consumption. (Henricsson, 2008; Nordström, 2008) Previously the energy reductions had been a direct economical sales argument because of the cut of energy costs. Along with the growing environmental debate, ABB has put increasing effort on the emission reducing effect of its products.
The involvement within the carbon credit market has been made from many directions within ABB. However, the only group function with a clear involvement in the carbon credit market is the Sustainability Affairs department, see Figure 3.1.
Figure 3.1: ABB group functions.
The group function of sustainability affairs (GF‐SA) is responsible for monitoring and supervising a sustainable business. Their work includes issues within environment, human rights, social matters and company policies. Together with certain ABB business divisions, further described in Chapter 3.1.3 to 3.1.6, the GF‐SA has been involved in most of the carbon credit research and must be considered the carbon credit market competence centre as of today.
35
Chapter 3 – ABB and the carbon credit market
3.1.1 Flexible mechanism projects ABB products are reducing the energy demand for thousands of companies around the globe. However, only a fraction of these products could lead to direct involvement in the carbon credit market by credit issuance to ABB.
The emission reductions generated by ABB products at companies complying towards EU ETS will not generate any carbon credits for ABB even though customers can create an EUA surplus. Companies have no reason of giving or selling their already allocated carbon credits to ABB as the EU ETS market is a well functioning market where certificates are easily traded. The company might just as well sell the surplus certificates on the market. (Henricsson, 2008; Nordström, 2008)
Projects in the United States or other developed countries outside EU will not generate any credits for ABB. Either the buying company is not included by a trading scheme, or if it is, the excessive credits could be sold on the domestic market as they are in the EU ETS.
The only probable way for ABB to receive carbon credits is through the flexible mechanism of the Kyoto Protocol; CDM and JI. As described in Chapter 2.4.3 governments or private entities can retrieve credits from reducing emissions in developing countries. As a major player at the international energy transfer and automation market, particularly in the important CDM countries China and India, ABB has opportunities of gaining credits through these projects. (Henricsson, 2008; Nordström, 2008) As the JI market is smaller and not as developed as the CDM market, the opportunities are mostly CDM related.
3.1.2 Emission reduction as a sales argument Through the investigations that have been made by the GF‐SA, the business divisions and external consultancies, ABB has concluded that there are many difficulties for ABB to engage in a direct involvement in the carbon credit market. Besides the limitation to the flexible mechanism projects there are numerous barriers that ABB has to overcome to receive the carbon credits, described further in Chapter 3.1.8. Because of this, the carbon credit related work within ABB has been focused on indirect carbon credit involvement up to this point. (Henricsson, 2008; Nordström, 2008)
Many of ABB’s customers are subject to emission restrictions through EU ETS. These restrictions could be met by reducing energy usage which in turn can be done through ABB products. By emphasizing this, together with the ethic importance of reducing emissions, ABB has been able to create effective sales arguments through the Kyoto Protocol.
Because of the global warming debate where companies strive to take an environmental responsibility, not only companies with emission caps see something positive in reducing emissions. This has created a powerful sales argument throughout a vast majority of the ABB organization. To create an awareness of this advantage, the sales arguments have been communicated by the GF‐SA and certain involved business divisions. The potential of the carbon credit market has been illustrated by a number of example cases created by the involved parties. (Beckius et al, 2008)
In addition, the GF‐SA has been communicating the significant role of ABB products in the fight against global warming to gain positive publicity for ABB.
However, there have been several initiatives to reach direct involvement in the carbon credit market. The divisions that have the clearest involvement or possibilities within CDM or JI projects, according to the interviews made, will be presented below. A number of example cases will also be presented in order to quantify the opportunities available within the divisions. The divisions that are most clearly involved in the ABB carbon credit supply‐side are highlighted in Figure 3.2.
36
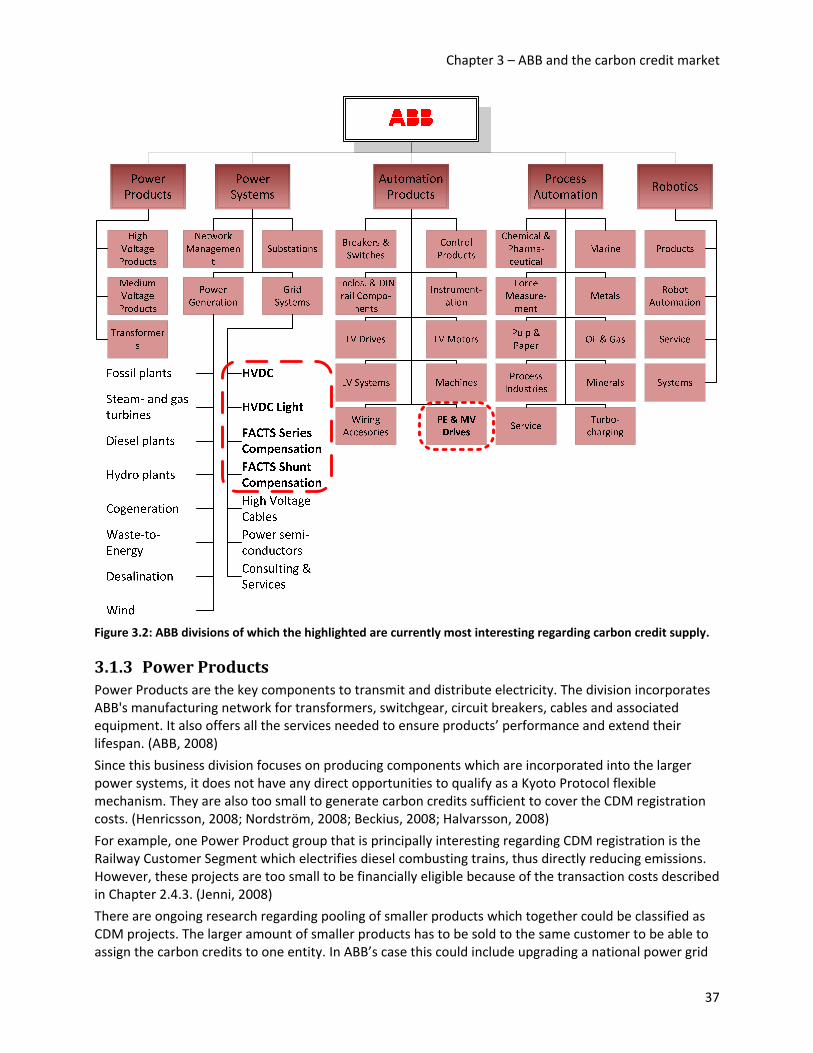
Chapter 3 – ABB and the carbon credit market
Figure 3.2: ABB divisions of which the highlighted are currently most interesting regarding carbon credit supply.
3.1.3 Power Products Power Products are the key components to transmit and distribute electricity. The division incorporates ABB's manufacturing network for transformers, switchgear, circuit breakers, cables and associated equipment. It also offers all the services needed to ensure products’ performance and extend their lifespan. (ABB, 2008)
Since this business division focuses on producing components which are incorporated into the larger power systems, it does not have any direct opportunities to qualify as a Kyoto Protocol flexible mechanism. They are also too small to generate carbon credits sufficient to cover the CDM registration costs. (Henricsson, 2008; Nordström, 2008; Beckius, 2008; Halvarsson, 2008)
For example, one Power Product group that is principally interesting regarding CDM registration is the Railway Customer Segment which electrifies diesel combusting trains, thus directly reducing emissions. However, these projects are too small to be financially eligible because of the transaction costs described in Chapter 2.4.3. (Jenni, 2008)
There are ongoing research regarding pooling of smaller products which together could be classified as CDM projects. The larger amount of smaller products has to be sold to the same customer to be able to assign the carbon credits to one entity. In ABB’s case this could include upgrading a national power grid
37
Chapter 3 – ABB and the carbon credit market
by replacing all transformers or breakers which could generate huge aggregated emission reductions. Projects like this are being examined by Atlas Copco in corporation with the carbon consultancy and trader Tricorona. This possibility is far from obvious today, but if similar projects are approved there is a large potential within the power products division. (Beckius, 2008)
Because of the time demanding CDM registration process involvement is often not worthwhile for shorter projects. A project analysis has to be made to determine the likelihood that a project would be eligible for CDM registration which in turn is necessary to give the customer an eventual offer of partly financing the project through carbon credits. The customer might want to make a quick decision and cannot wait for a CDM study before deciding if the project should be bought or not, based on the financing alternatives. This limits the CDM possibilities for Power Products and the smaller Power Systems solutions further. (Halvarsson, 2008) The involvement barriers are further described in Chapter 3.1.8.
3.1.4 Power Systems The Power Systems division offers turnkey systems and services for power transmission, distribution grids and power plants. Substations and substation automation systems are key areas. The product portfolio also includes flexible alternating current transmission systems (FACTS), high‐voltage direct current (HVDC) systems and network management systems. In power generation, Power Systems offers the instrumentation, control and electrification of power plants. (ABB, 2008)
As for the Power Products, many of the products within the Power Systems division are not eligible for carbon credit generation because of involvement barriers. The Substation and Power Generation sub‐divisions are focused on supplying essential standard components to larger systems such as power plants, causing CDM registration problems described further in Chapter 2.4.3. Even if these projects hypothetically would be CDM eligible they would also, most likely, generate too small energy reductions to be worth the CDM/JI involvement due to the associated transaction costs.
The Network Management division supplies customers with IT solutions used to optimize the power network including power generation, transmission, distribution and consumption. It is unlikely that any clear emission reductions will emerge from this segment (Karlsson, 2008; Beckius, 2008; Halvarsson, 2008)
However, the Grid System division has been involved in the carbon credit processes of ABB. These energy transfer solutions connect energy sources to energy users in an effective way that can generate very large CO2 reductions which easily can be measured. (Beckius et al, 2007; Halvarsson, 2008; Normark, 2008) Since ABB delivers complete systems, the company also has a direct connection to the emission reduction which increases the likelihood of receiving carbon credits. Carbon credit related initiatives are being carried out within the division and this involvement will be described further below.
Flexible Alternating Current Transmission Systems The Flexible Alternating Current Transmissions System (FACTS) offers numerous technologies that improve capacity, safety and flexibility of electrical power systems. The FACTS solutions enable grid capacity increases while the grid stability rises. This results in increased electrical power transfer to customers at a lower investment cost since the alternatives would be new transmission lines or new power generation. There are two main type of FACTS; shunt compensation systems and series compensation systems. (ABB, 2008)
Energy intensive production facilities, such as a steel plant, often have problems in handling the reactive effect generated by the processes. The shunt compensation FACTS handles this problem by reducing the reactive effect returning to the grid, thus enabling higher power usage and increased productivity. By
38
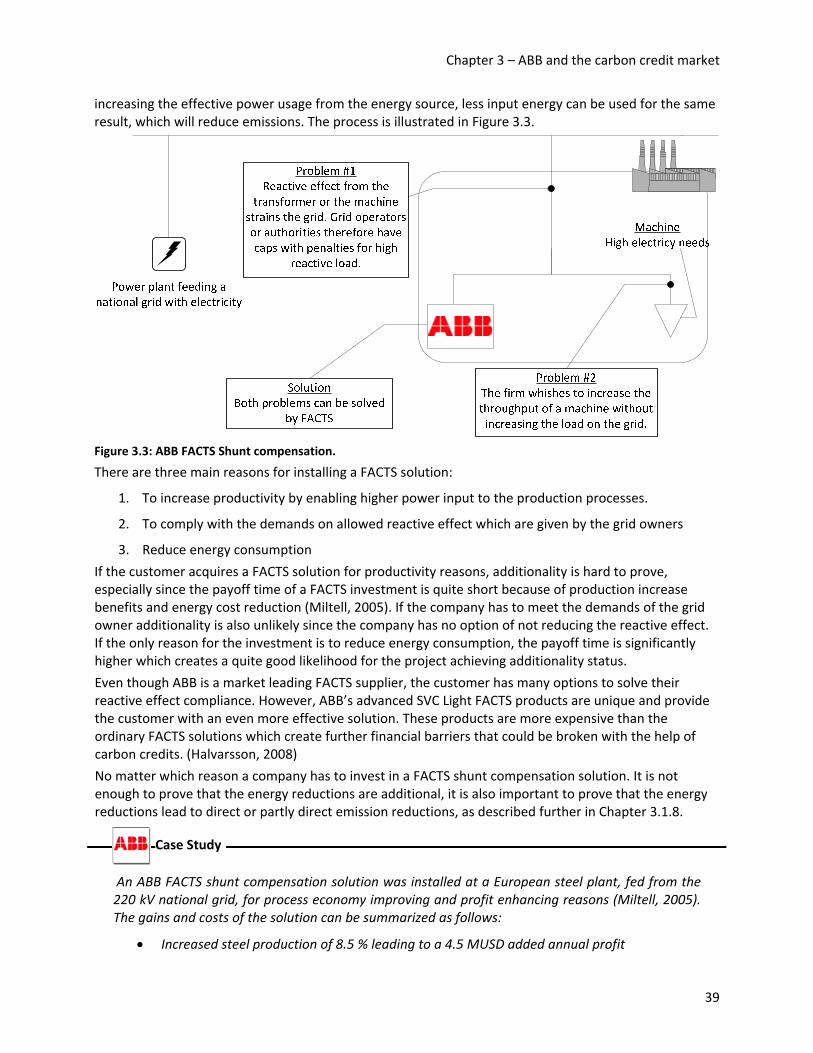
Chapter 3 – ABB and the carbon credit market
increasing the effective power usage from the energy source, less input energy can be used for the same result, which will reduce emissions. The process is illustrated in Figure 3.3.
Figure 3.3: ABB FACTS Shunt compensation.
There are three main reasons for installing a FACTS solution:
1. To increase productivity by enabling higher power input to the production processes.
2. To comply with the demands on allowed reactive effect which are given by the grid owners
3. Reduce energy consumption
If the customer acquires a FACTS solution for productivity reasons, additionality is hard to prove, especially since the payoff time of a FACTS investment is quite short because of production increase benefits and energy cost reduction (Miltell, 2005). If the company has to meet the demands of the grid owner additionality is also unlikely since the company has no option of not reducing the reactive effect. If the only reason for the investment is to reduce energy consumption, the payoff time is significantly higher which creates a quite good likelihood for the project achieving additionality status.
Even though ABB is a market leading FACTS supplier, the customer has many options to solve their reactive effect compliance. However, ABB’s advanced SVC Light FACTS products are unique and provide the customer with an even more effective solution. These products are more expensive than the ordinary FACTS solutions which create further financial barriers that could be broken with the help of carbon credits. (Halvarsson, 2008)
No matter which reason a company has to invest in a FACTS shunt compensation solution. It is not enough to prove that the energy reductions are additional, it is also important to prove that the energy reductions lead to direct or partly direct emission reductions, as described further in Chapter 3.1.8.
An ABB FACTS shunt compensation solution was installed at a European steel plant, fed from the 220 kV national grid, for process economy improving and profit enhancing reasons (Miltell, 2005). The gains and costs of the solution can be summarized as follows:
• Increased steel production of 8.5 % leading to a 4.5 MUSD added annual profit
Case Study
39

Chapter 3 – ABB and the carbon credit market
• Annual electric energy savings of 3,700 MWh leading to 0.37 MUSD annual savings
• Costs of 2.5 MUSD for installing the FACTS
The payoff of the investment is only 6 months if taking the production increase into account. However, if not, the payoff time is 7 years, making the investment quite unlikely to happen.
This project was initiated solely because the company wanted to increase profit and emission reduction was not a critical factor. By modifying the original case and assuming that the company had no need for production increases and was to install the FACTS solution only to reduce energy consumption, where carbon credits would be a way of making the project economically feasible the following result is achieved.
Topic Amount
Annual energy reduction 3,700 MWh
Electricity price 100 USD/MWh
Annual electricity savings 370,000 USD
Annual CO2‐emission reduction (100% coal energy mix) 7.1 ktCO2
Value of corresponding carbon credits (2008‐10‐17) 0.2 MUSD
Typical small scale CDM transaction costs 0.05 MUSD
Cost of FACTS equipment 2.5 MUSD
Payoff time without CDM registration 6.8 years
Payoff time with CDM registration 4.5 years
NPV14 of CDM gains during 10 years 1.2 MUSD
Table 3.1: FACTS shunt compensation CDM potential.
Electricity savings 65%
CER earnings 35 %
Figure 3.4: Possible profit increases due to install‐ation of a FACTS shunt compensation solution.
As the table shows a factory without a production increase need could install a FACTS shunt compensation solution and make this project financially viable with the help of the CDM registration. A successful CDM registration would lower the payoff time with approximately 2.5 years and the CERs earnings constitutes 35% of the possible economic effects. Even though other barriers such as direct emission reductions and customer involvement, described further in Chapter 3.1.8, have to be tackled, this shows the potential of FACTS shunt compensation solutions.
14 10% discount rate
40
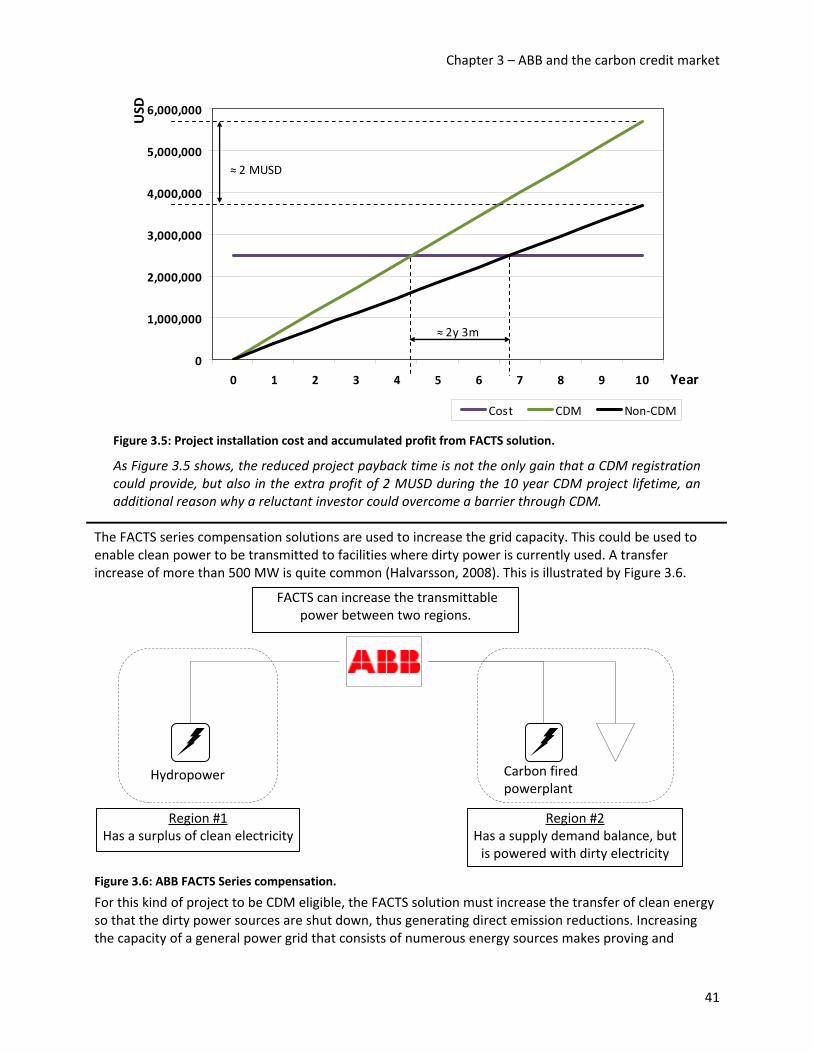
Chapter 3 – ABB and the carbon credit market
0
1,000,000
2,000,000
3,000,000
4,000,000
5,000,000
6,000,000
0 1 2 3 4 5 6 7 8 9 10 Year
USD
Cost CDM Non‐CDM
≈ 2 MUSD
≈ 2y 3m
Figure 3.5: Project installation cost and accumulated profit from FACTS solution.
As Figure 3.5 shows, the reduced project payback time is not the only gain that a CDM registration could provide, but also in the extra profit of 2 MUSD during the 10 year CDM project lifetime, an additional reason why a reluctant investor could overcome a barrier through CDM.
The FACTS series compensation solutions are used to increase the grid capacity. This could be used to enable clean power to be transmitted to facilities where dirty power is currently used. A transfer increase of more than 500 MW is quite common (Halvarsson, 2008). This is illustrated by Figure 3.6.
Region #1Has a surplus of clean electricity
FACTS can increase the transmittable power between two regions.
Hydropower Carbon fired powerplant
Region #2Has a supply demand balance, but is powered with dirty electricity
Figure 3.6: ABB FACTS Series compensation.
For this kind of project to be CDM eligible, the FACTS solution must increase the transfer of clean energy so that the dirty power sources are shut down, thus generating direct emission reductions. Increasing the capacity of a general power grid that consists of numerous energy sources makes proving and
41
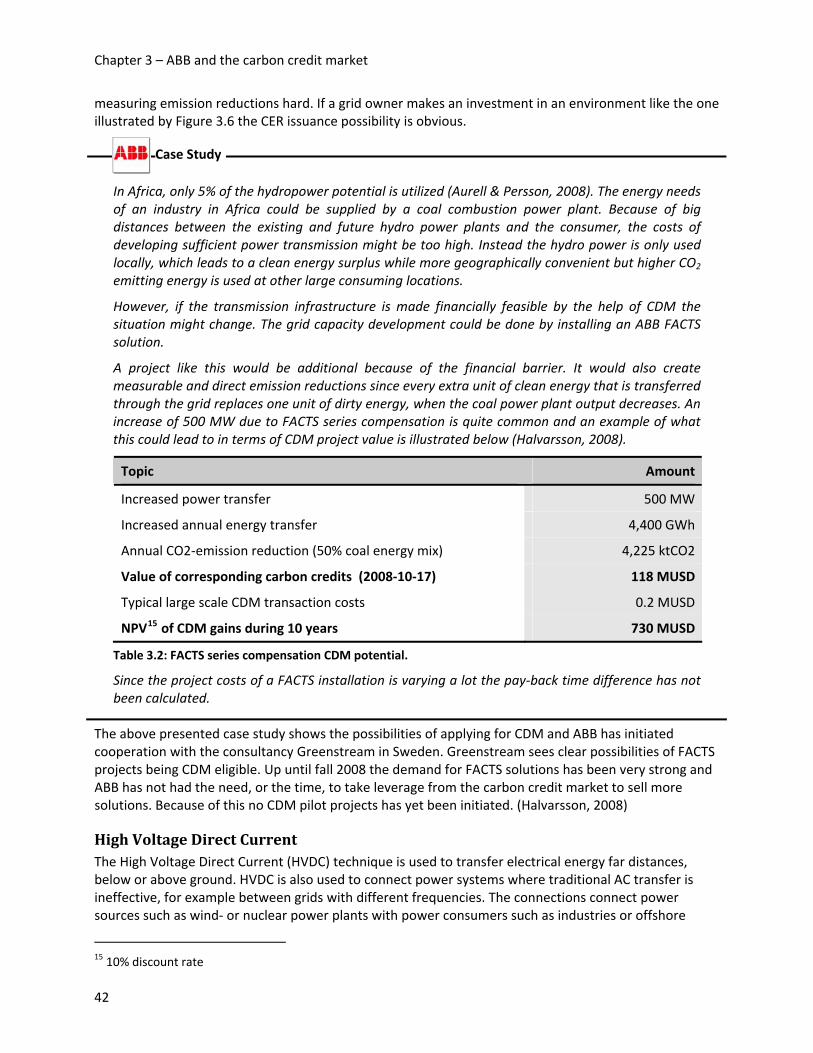
Chapter 3 – ABB and the carbon credit market
measuring emission reductions hard. If a grid owner makes an investment in an environment like the one illustrated by Figure 3.6 the CER issuance possibility is obvious.
In Africa, only 5% of the hydropower potential is utilized (Aurell & Persson, 2008). The energy needs of an industry in Africa could be supplied by a coal combustion power plant. Because of big distances between the existing and future hydro power plants and the consumer, the costs of developing sufficient power transmission might be too high. Instead the hydro power is only used locally, which leads to a clean energy surplus while more geographically convenient but higher CO2 emitting energy is used at other large consuming locations.
However, if the transmission infrastructure is made financially feasible by the help of CDM the situation might change. The grid capacity development could be done by installing an ABB FACTS solution.
A project like this would be additional because of the financial barrier. It would also create measurable and direct emission reductions since every extra unit of clean energy that is transferred through the grid replaces one unit of dirty energy, when the coal power plant output decreases. An increase of 500 MW due to FACTS series compensation is quite common and an example of what this could lead to in terms of CDM project value is illustrated below (Halvarsson, 2008).
Topic Amount
Increased power transfer 500 MW
Increased annual energy transfer 4,400 GWh
Annual CO2‐emission reduction (50% coal energy mix) 4,225 ktCO2
Value of corresponding carbon credits (2008‐10‐17) 118 MUSD
Typical large scale CDM transaction costs 0.2 MUSD
NPV15 of CDM gains during 10 years 730 MUSD
Table 3.2: FACTS series compensation CDM potential.
Since the project costs of a FACTS installation is varying a lot the pay‐back time difference has not been calculated.
Case Study
The above presented case study shows the possibilities of applying for CDM and ABB has initiated cooperation with the consultancy Greenstream in Sweden. Greenstream sees clear possibilities of FACTS projects being CDM eligible. Up until fall 2008 the demand for FACTS solutions has been very strong and ABB has not had the need, or the time, to take leverage from the carbon credit market to sell more solutions. Because of this no CDM pilot projects has yet been initiated. (Halvarsson, 2008)
High Voltage Direct Current The High Voltage Direct Current (HVDC) technique is used to transfer electrical energy far distances, below or above ground. HVDC is also used to connect power systems where traditional AC transfer is ineffective, for example between grids with different frequencies. The connections connect power sources such as wind‐ or nuclear power plants with power consumers such as industries or offshore
15 10% discount rate
42
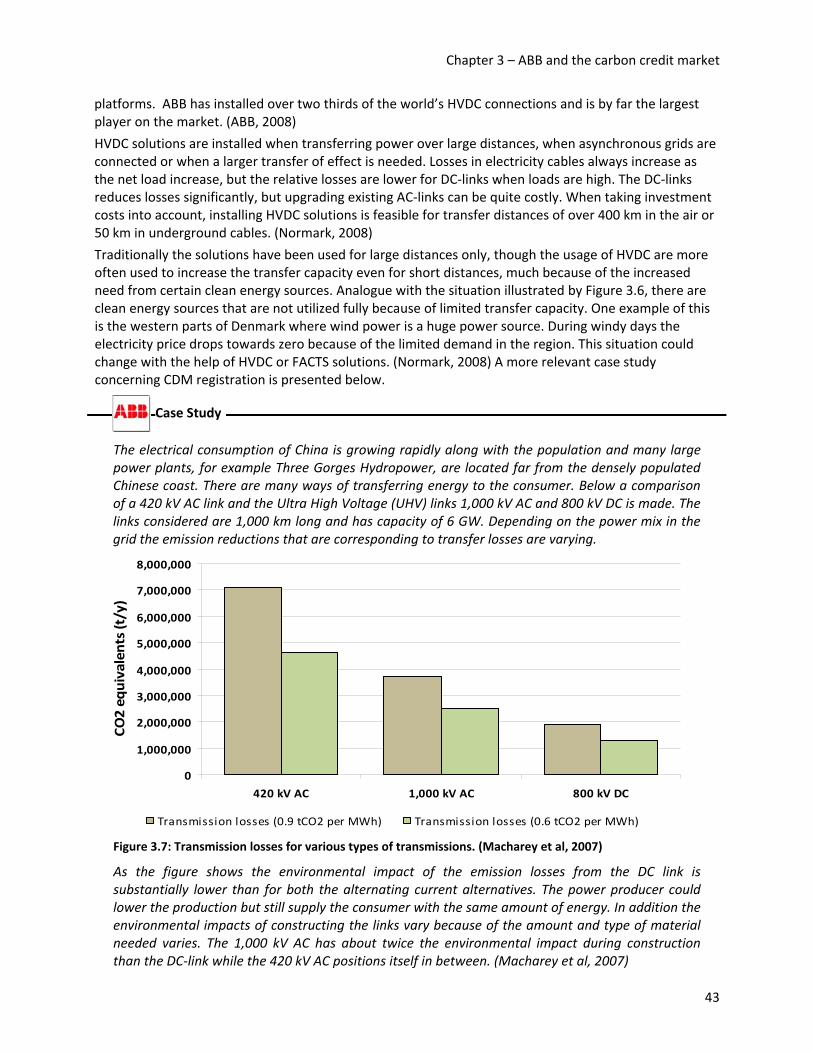
Chapter 3 – ABB and the carbon credit market
platforms. ABB has installed over two thirds of the world’s HVDC connections and is by far the largest player on the market. (ABB, 2008)
HVDC solutions are installed when transferring power over large distances, when asynchronous grids are connected or when a larger transfer of effect is needed. Losses in electricity cables always increase as the net load increase, but the relative losses are lower for DC‐links when loads are high. The DC‐links reduces losses significantly, but upgrading existing AC‐links can be quite costly. When taking investment costs into account, installing HVDC solutions is feasible for transfer distances of over 400 km in the air or 50 km in underground cables. (Normark, 2008)
Traditionally the solutions have been used for large distances only, though the usage of HVDC are more often used to increase the transfer capacity even for short distances, much because of the increased need from certain clean energy sources. Analogue with the situation illustrated by Figure 3.6, there are clean energy sources that are not utilized fully because of limited transfer capacity. One example of this is the western parts of Denmark where wind power is a huge power source. During windy days the electricity price drops towards zero because of the limited demand in the region. This situation could change with the help of HVDC or FACTS solutions. (Normark, 2008) A more relevant case study concerning CDM registration is presented below.
The electrical consumption of China is growing rapidly along with the population and many large power plants, for example Three Gorges Hydropower, are located far from the densely populated Chinese coast. There are many ways of transferring energy to the consumer. Below a comparison of a 420 kV AC link and the Ultra High Voltage (UHV) links 1,000 kV AC and 800 kV DC is made. The links considered are 1,000 km long and has capacity of 6 GW. Depending on the power mix in the grid the emission reductions that are corresponding to transfer losses are varying.
0
1,000,000
2,000,000
3,000,000
4,000,000
5,000,000
6,000,000
7,000,000
8,000,000
420 kV AC 1,000 kV AC 800 kV DC
CO2 equivalents (t/y)
Transmission losses (0.9 tCO2 per MWh) Transmission losses (0.6 tCO2 per MWh) Figure 3.7: Transmission losses for various types of transmissions. (Macharey et al, 2007)
As the figure shows the environmental impact of the emission losses from the DC link is substantially lower than for both the alternating current alternatives. The power producer could lower the production but still supply the consumer with the same amount of energy. In addition the environmental impacts of constructing the links vary because of the amount and type of material needed varies. The 1,000 kV AC has about twice the environmental impact during construction than the DC‐link while the 420 kV AC positions itself in between. (Macharey et al, 2007)
Case Study
43

Chapter 3 – ABB and the carbon credit market
Topic Amount
Annual CO2‐emission reduction due to less transmission losses of a HVDC link (with an energy mix of 0.6 tCO2 per MWh)
3,500 ktCO2
Value of corresponding carbon credits (2008‐10‐17) 98 MUSD
Typical large scale CDM transaction costs 0.2 MUSD
NPV16 of CDM gains during 10 years 600 MUSD
Table 3.3: HVDC link CDM potential.
Since the DC link is a very profitable way of long distance transfer the usage of the solution is very unlikely to be considered additional if the builder has decided to build the transfer for profit. However, if the grid owner has no will or capacity of building expensive DC transfer the additionally of a link like the one presented above could occur. If the replacement of a traditional AC‐link would be CDM eligible the project would have potential of generating up to 3.5 million CERs annually for the cleaner energy mix case, to a NPV1 of about 600 MUSD during a 10‐year period using recent CER prices.
If a hydro power producer wishes to maintain a maximum production level, installing a HVDC‐link could increase the transfer of clean energy and thus reduce the production of dirty energy at another point. This could motivate a scenario where CERs are generated to represent the reduction of dirty energy usage at the coast rather than the reduction of energy produced in midland. This way of viewing the case is favorable if the coastal energy mix is dirtier than the midland.
A sector where ABB has sold many HVDC links is the offshore industry. By connecting offshore platforms with the land energy grid their power needs could be satisfied by more or less clean power rather than by combusting gas at the platform. Connections like this generate very clear emission reductions and have a large CDM potential.
In the Valhall project ABB supplied a HVDC‐link connecting the Norwegian power grid to an oil platform that was powered by a 60 MW gas turbine. By doing this the high emissions of combustion gas could be replaced by the very low emission energy mix of Norway. (Ravemark & Åhström, 2004)
Topic Amount
Gas turbine emissions 0,725 tCO2/Mwh
Norway electricity mix emission 0,0072 tCO2/Mwh
Annual emissions from 60 MW Gas Turbine 381.1 ktCO2
Annual emissions from Norwegian power mix 4.3 ktCO2
Annual emission reductions from HVDC Valhall 376.8 ktCO2
Value of corresponding carbon credits (2008‐10‐17) 11 MUSD
Case Study
16 10% discount rate
44
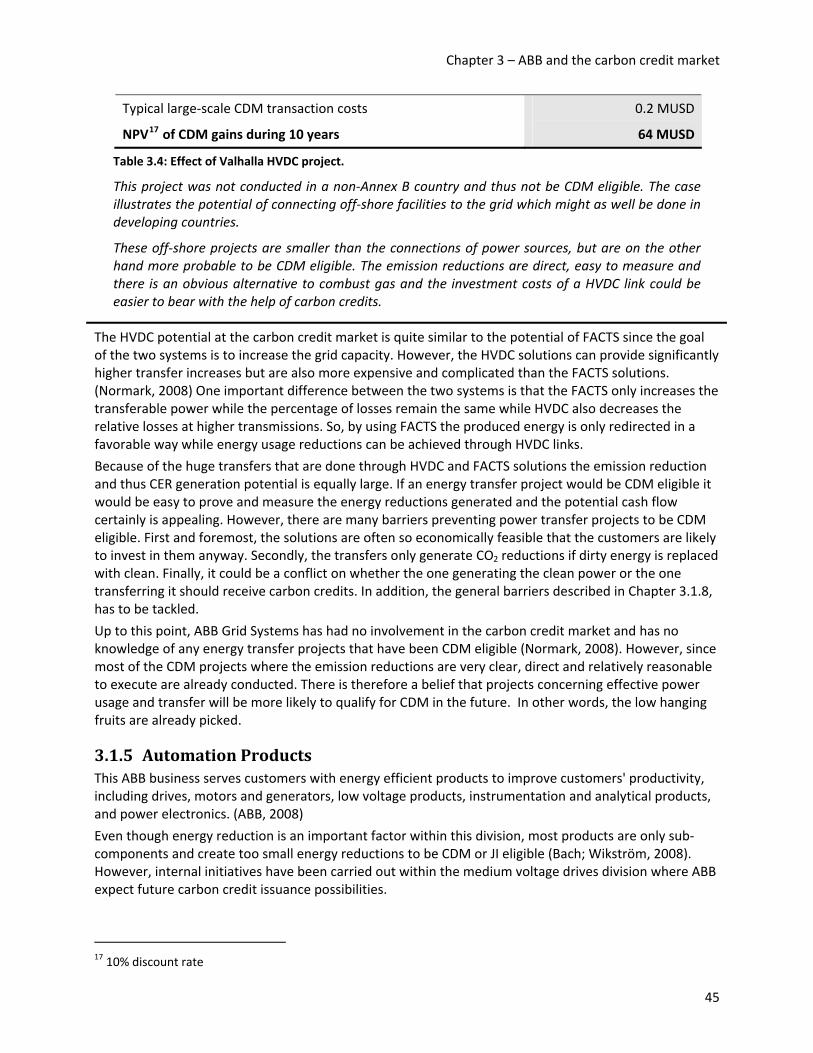
Chapter 3 – ABB and the carbon credit market
Typical large‐scale CDM transaction costs 0.2 MUSD
NPV17 of CDM gains during 10 years 64 MUSD
Table 3.4: Effect of Valhalla HVDC project.
This project was not conducted in a non‐Annex B country and thus not be CDM eligible. The case illustrates the potential of connecting off‐shore facilities to the grid which might as well be done in developing countries.
These off‐shore projects are smaller than the connections of power sources, but are on the other hand more probable to be CDM eligible. The emission reductions are direct, easy to measure and there is an obvious alternative to combust gas and the investment costs of a HVDC link could be easier to bear with the help of carbon credits.
The HVDC potential at the carbon credit market is quite similar to the potential of FACTS since the goal of the two systems is to increase the grid capacity. However, the HVDC solutions can provide significantly higher transfer increases but are also more expensive and complicated than the FACTS solutions. (Normark, 2008) One important difference between the two systems is that the FACTS only increases the transferable power while the percentage of losses remain the same while HVDC also decreases the relative losses at higher transmissions. So, by using FACTS the produced energy is only redirected in a favorable way while energy usage reductions can be achieved through HVDC links.
Because of the huge transfers that are done through HVDC and FACTS solutions the emission reduction and thus CER generation potential is equally large. If an energy transfer project would be CDM eligible it would be easy to prove and measure the energy reductions generated and the potential cash flow certainly is appealing. However, there are many barriers preventing power transfer projects to be CDM eligible. First and foremost, the solutions are often so economically feasible that the customers are likely to invest in them anyway. Secondly, the transfers only generate CO2 reductions if dirty energy is replaced with clean. Finally, it could be a conflict on whether the one generating the clean power or the one transferring it should receive carbon credits. In addition, the general barriers described in Chapter 3.1.8, has to be tackled.
Up to this point, ABB Grid Systems has had no involvement in the carbon credit market and has no knowledge of any energy transfer projects that have been CDM eligible (Normark, 2008). However, since most of the CDM projects where the emission reductions are very clear, direct and relatively reasonable to execute are already conducted. There is therefore a belief that projects concerning effective power usage and transfer will be more likely to qualify for CDM in the future. In other words, the low hanging fruits are already picked.
3.1.5 Automation Products This ABB business serves customers with energy efficient products to improve customers' productivity, including drives, motors and generators, low voltage products, instrumentation and analytical products, and power electronics. (ABB, 2008)
Even though energy reduction is an important factor within this division, most products are only sub‐components and create too small energy reductions to be CDM or JI eligible (Bach; Wikström, 2008). However, internal initiatives have been carried out within the medium voltage drives division where ABB expect future carbon credit issuance possibilities.
17 10% discount rate
45

Chapter 3 – ABB and the carbon credit market
Medium Voltage Drives A Medium Voltage Drive (MVD) is used to control the speed and torque of induction and synchronous machines where high powers are needed. Normally the equipment’s energy usage is binary; it is either turned on or off. With the help of a MVD, the precise amount of power needed can be delivered, thus avoiding excessive power to be wasted when the equipment is not fully utilized. (Bach, 2008)
The MVD division initiated its involvement in the carbon credit market when the Business Processes Project Manager Tomas Bach started to examine the division’s business opportunities in 2006. With the help of external CDM consultants, a number of case studies were carried out to determine whether the Medium Voltage Drives projects had any opportunities regarding retrieving CER. (Bach, 2008)
To examine the emission reduction potential of MVD projects a number of ABB projects conducted in CDM eligible countries were considered by the MVD division and external consultancies.
Project Application Installed Power [MW]
Savings [MWh]
Emission reductions [t]
CDM benefit18 [MUSD]
Azucarena Hondurena (Honduras)
ACS 1000 3.75 24,375 19,500 3.3
Repsol YPF (Argentina)
Blower (replaced turbine)
3.0 7,560 5,500 0.9
Cruz Azul (Mexico)
Kiln ID fan 1+2
1.5 5,300 3,200 0.5
Table 3.5: MVD Project examples. (Bach & Wikström, 2006)
Because of the substantial transaction costs, described in Chapter 2.4.3, the project installation size needed to exceed 10 MW, though there have been few MVD projects of this size, making the above mentioned cases too small. (Bach & Wikström, 2006) However, these calculations were done when the CER price was only 9 €. Since then the situation have changed significantly, when recalculating the above mentioned cases by using today’s CER price the result in the rightmost column of Table 3.5 shows that there is significant potential within this segment.
Case Study
During the study it was made clear that there were MVD projects with CO2‐reduction potential and the next step was to determine the likelihood of an MVD project being eligible for CDM registration. (Bach, 2008) An example of a drives project that was CDM eligible was found. This was a project of energy efficiency measures at a desalination plant in Chennai, India, 2003, where drives where installed.
The opportunity was clear and a CDM pilot project has been suggested. The project includes installation of MVD in a steel plant in Kamataka, India, where ABB India executes the order and ABB Switzerland is the technology supplier. (Bach, 2008) Even if the project would be eligible for CDM registration there are numerous other barriers to overcome before ABB has carbon credits in their hand, see Chapter 3.1.8
18 Benefits calculated by calculating NPV of 10 years of carbon credit issuance at current, 2008‐10‐17, CER price at 10% discount rate
46

Chapter 3 – ABB and the carbon credit market
Because of these obstacles, the pilot project is still not finished. One of the two consultancies, Southpole Carbon Asset Management, was not convinced that a MVD project would be eligible for CDM registration. However, another British carbon consultancy, EcoSecurities, believed that the project could generate credits, which encouraged ABB to initiate the pilot project. Up to this date, October 2008, the project is still not initiated because of a semiconductor supply problem. (Bach, 2008)
The energy efficient products supplied by ABB Automation are aiding many companies as they are striving to reduce their emission. This is frequently used as an effective sales argument but as of today, October 2008, the division has not generated, nor handled, any carbon credits. There have been products similar to ABB Automation products involved in CDM projects and the running pilot project will shine further light on whether the projects will be able to receive carbon credits or not.
3.1.6 Process Automation The main focus of this business unit is to provide customers with integrated solutions for control, plant optimization, and industry‐specific application knowledge. The industries served include oil and gas, power, chemicals and pharmaceuticals, pulp and paper, metals and minerals, marine and turbocharging. Key customer benefits include improved asset productivity and energy savings. (ABB, 2008)
ABB most often does not act as a complete supplier in the process industry since the process automation segment only supplies solutions such as electrification, control systems and automation. Even though ABB supplies essential products they are not the core of the process industries; when an industry is improved to consume less energy ABB is only one part of the upgrade. This reduces the likelihood of ABB receiving carbon credits since the main contractor is the one who most likely will receive carbon credits if the buyer chooses to finance the project via carbon credits.
Even though single ABB products or solutions seldom offer any clear, measurable and substantial energy reductions, a combination of solutions in the portfolio could create substantial energy consumption reductions. However, complete factory upgrades are not offered by ABB who usually sells isolated products or systems to larger contractors or directly to the customer. (Beckius, 2008) An example of a factory upgrade where ABB could have been involved is the energy efficiency project of a pulp and paper factory in India presented below.
The ITC Pulp and Paper Factory in India, Bhadrachalam, has been upgraded to reduce the factory’s energy consumption. The financial and technological barriers to overcome were sufficient to prove project additionality and the project was conducted by ITC itself with the help of ABN Amro and PWC. (Beckius et al, 2008) To achieve the energy reductions the company conducted the following measures:
• Replaced low efficient equipment such as pumps, compressors and light bulbs.
• Upgraded paper factory equipment to increase the power factor
• Installed energy saving solutions
ITC invested in equipment within a broad range relating directly or indirectly to the paper production to reach the mentioned measures. Many of these products were not related to the business of ABB but some products that were or could have been delivered by ABB are:
• Two capacitor banks to the fiber treatment unit
• Two harmonic filters to the paper machines
Case Study
47
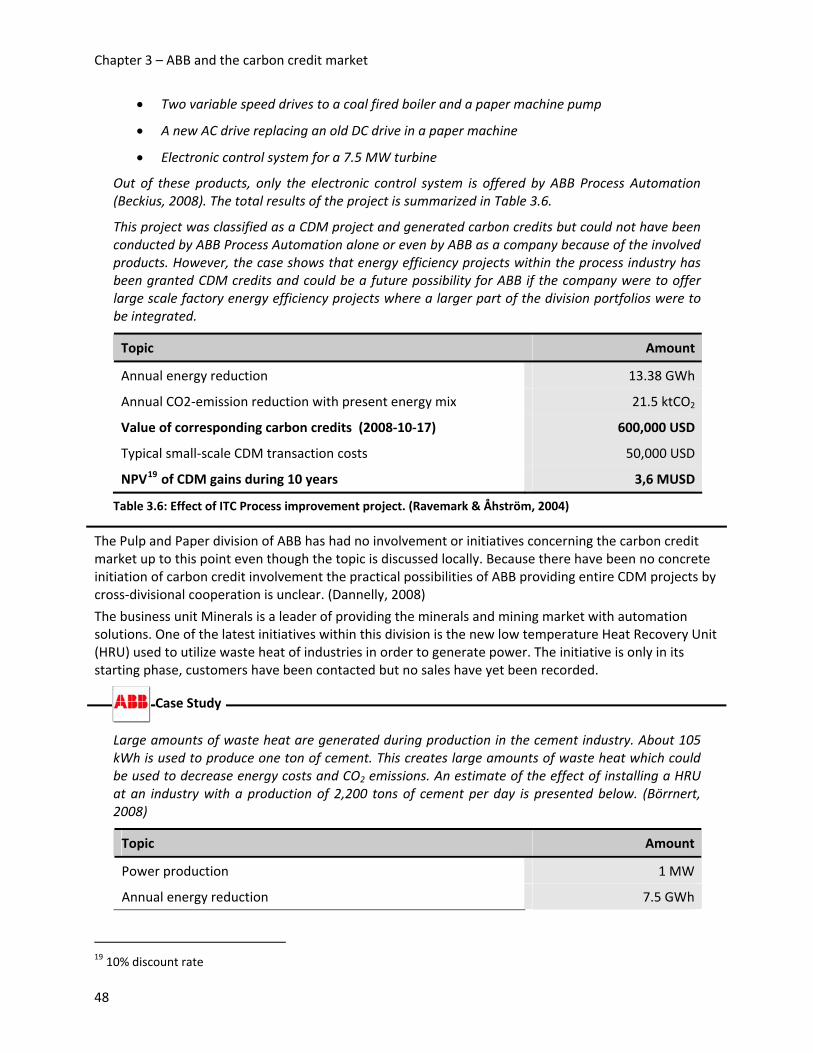
Chapter 3 – ABB and the carbon credit market
• Two variable speed drives to a coal fired boiler and a paper machine pump
• A new AC drive replacing an old DC drive in a paper machine
• Electronic control system for a 7.5 MW turbine
Out of these products, only the electronic control system is offered by ABB Process Automation (Beckius, 2008). The total results of the project is summarized in Table 3.6.
This project was classified as a CDM project and generated carbon credits but could not have been conducted by ABB Process Automation alone or even by ABB as a company because of the involved products. However, the case shows that energy efficiency projects within the process industry has been granted CDM credits and could be a future possibility for ABB if the company were to offer large scale factory energy efficiency projects where a larger part of the division portfolios were to be integrated.
Topic Amount
Annual energy reduction 13.38 GWh
Annual CO2‐emission reduction with present energy mix 21.5 ktCO2
Value of corresponding carbon credits (2008‐10‐17) 600,000 USD
Typical small‐scale CDM transaction costs 50,000 USD
NPV19 of CDM gains during 10 years 3,6 MUSD
Table 3.6: Effect of ITC Process improvement project. (Ravemark & Åhström, 2004)
The Pulp and Paper division of ABB has had no involvement or initiatives concerning the carbon credit market up to this point even though the topic is discussed locally. Because there have been no concrete initiation of carbon credit involvement the practical possibilities of ABB providing entire CDM projects by cross‐divisional cooperation is unclear. (Dannelly, 2008)
The business unit Minerals is a leader of providing the minerals and mining market with automation solutions. One of the latest initiatives within this division is the new low temperature Heat Recovery Unit (HRU) used to utilize waste heat of industries in order to generate power. The initiative is only in its starting phase, customers have been contacted but no sales have yet been recorded.
Large amounts of waste heat are generated during production in the cement industry. About 105 kWh is used to produce one ton of cement. This creates large amounts of waste heat which could be used to decrease energy costs and CO2 emissions. An estimate of the effect of installing a HRU at an industry with a production of 2,200 tons of cement per day is presented below. (Börrnert, 2008)
Topic Amount
Power production 1 MW
Annual energy reduction 7.5 GWh
Case Study
19 10% discount rate
48

Chapter 3 – ABB and the carbon credit market
Annual CO2‐emission reduction (100% carbon energy mix) 14.5 ktCO2
Value of corresponding carbon credits (2008‐10‐17) 400,000 USD
Typical small‐scale CDM transaction costs 50,000 USD
NPV1 of CDM gains during 10 years 2,4 MUSD
Table 3.7: Effect of a Heat Recovery Unit installed at a cement production plant. (Börrnert, 2008)
The HRU does not generate any substantial energy decreases compared to other ABB products but the likelihood of the product being additional should be quite big as the only reason for installing the system is to reduce energy consumptions. As the unit sold is a separate system the likelihood of ABB being the one that could receive eventual carbon credits grows.
As of today the BU Minerals has had no involvement in the carbon credit market but potential of future involvement is clear.
Among the other process automation business units such as Oil and Gas (Wuttig, 2008) and Marine (Adnanes, 2008) the topic of carbon credits has been on the agenda but the divisions have not been conducting any concrete work in the matter. There are projects within these divisions that are interesting from a CDM perspective; such as liquid nitrogen marine propulsion systems. Some of these systems are quite small and some of them are business standard systems that the customer has to buy, regardless of the emission issue. This, together with the above described problems regarding broad process upgrades where ABB often only supplies small parts or where broader cooperation among divisions is needed, is why the involvement potential of many Process Automation projects than the ones in the above mentioned case studies is somewhat unclear.
3.1.7 Crossdivisional cooperation As described in Chapter 3.1.6, cross‐divisional cooperation could create business opportunities at the CDM market. Initiatives where the products and solutions of various divisions are combined have evolved within ABB and the most relevant of these initiatives is the wind cooperation.
ABB’s wind initiative supplies power products, substations and power systems such as HVDC links to the wind power business. However, as for many other divisions, these products are only sub components, putting ABB in the role of a sub supplier that so often prevents the company from receiving carbon credits. (Madsen, 2008) In addition, the wind power companies are very exposed to the CDM market and therefore most likely have well developed processes to handle carbon credits themselves. As of today, ABB have had no involvement in the carbon credit market within the wind initiative (Madsen, 2008).
The opportunities of linking the wind power plants to consumers which today consumes dirty energy via ABB infrastructure such as HVDC links and FACTS were described previously. This opportunity is considered to be included in the Power Systems division rather than this cross‐divisional cooperation in this study, even though the projects could be sold through the wind channel.
3.1.8 Carbon credit supply barriers As described in Chapter 3.1.1, ABB could get involved in the carbon credit market through the flexible mechanisms of the Kyoto Protocol. However, there are numerous barriers to overcome before the company has credits in their hands. These barriers have been exposed during the interviews made throughout the organization and externally.
49

Chapter 3 – ABB and the carbon credit market
Project registration barrier As described in Chapter 2.4.3 the CDM or JI registration process is quite complex and time demanding. The first barrier of achieving a flexible mechanism approval from the concerned authority is obvious. Except for the time demanding administrative processes there are several factors that can complicate the approval processes for ABB projects.
The main problem is to prove that the ABB project is additional; to prove that the emission reductions would not have occurred without the project and that the carbon credits enable the buyer to overcome barriers. Since ABB projects not only generate emission reductions but also significant cost reductions the customer would have been likely to buy the project even without the global warming issue in mind. However, if the customer, for example, would have limited investment opportunities additionality could be proved. It is a big challenge to be able to provide the CDM authorities with documentation that describes the emission reduction and additionality in a clear and credible way. There are many consultancies specializing in the CDM registration process which can be of assistance when determining whether a project is likely to be considered additional or not. This is something that ABB has been taking advantage of when carrying out studies and pilot projects. (Bach, 2008; Halvarsson, 2008; Beckius 2008)
Another problem that ABB has experienced is that ABB often is a subcontractor of larger projects. It is often the main contractor of the wind park, steel mill, power plant or whatever project that ABB is involved in that receives the credit. (Bach, 2008; Halvarsson, 2008; Henricsson, 2008; Nordström, 2008)
ABB products often generate indirect emission reductions. Indirect emission reduction includes reduced energy usage on the general power grid where no clear connection to the energy source can be made, while direct reduction can be directly connected to the polluting energy source. As an example, an energy usage reduction at a facility directly connected to a coal combustion plant will cause direct emission reduction and every kWh reduced can be converted to CO2. Another option could be direct emission reduction through efficiency measures in the combustion process at the power plant. However, if energy usage reductions are made at a facility connected to a power grid where the energy sources could be nuclear power, coal, wind, water, etc, it only generates indirect emission reductions. This creates difficulties in determining the actual CO2‐reductions and thus passing the CDM process.
Customer involvement barrier ABB could be a main contractor or a sub contractor of a project that is CDM or JI eligible. Either way, ABB must convince the customer or the main contractor that they should transfer generated carbon credits to ABB.
If the customer itself has carbon emission caps to comply against or if it has well developed processes for applying for and handling carbon credits, there are no incentives to transfer generated credits to ABB. The customer might just as well sell the gained credits on the carbon credit market. (Henricsson 2008; Nordström, 2008) However, selling the carbon credits of a CDM project at a fixed price when initiating a project could be attractive for customers lacking the experience or the will to engage in the carbon credit market, thus preferring fast money. (Nilsson, 2008)
ABB could also offer a reduced product price in exchange for eventual CERs that will be issued if the project turns out to be CDM eligible. This would create value for a customer without the competence needed to engage in carbon credit handling. Doing this would require sufficient ABB engagement to reach the financial feasibility needed to overcome the financial barrier described below. By being active, ABB could determine the likelihood of the project being CDM eligible for a quite small cost and being able to quickly give the customer an eventual offer of buying credits. (Nilsson, 2008)
There are examples of projects where sub suppliers have received carbon credits but the likelihood of being involved and profiting from carbon credits increases as the percentage of the total contract value increases. The likelihood of receiving carbon credits also increases with the CDM experience of the
50

Chapter 3 – ABB and the carbon credit market
company. There are few companies with that kind of experience which creates a competitive advantage for those who have it. (Nilsson, 2008) However, there are several consultancies which can assist customers in this matter if the customers are willing to involve additional parties in the project process.
Financial barrier As described in Chapter 2.4.3, there are significant transaction costs of CDM and JI projects. The CDM registration process effort is only worthwhile if the project generate enough carbon credits to cover the transaction costs. Because of this, many ABB products are too small for CDM registration. As an example of this a medium voltage drives study indicated that only projects above a certain installation size are financial feasible from a CDM perspective.
It is important to take into account that the transaction costs increases significantly when the size of the project passes 15 MW which is why some projects can be unfeasible when they pass this and the other limits described in Chapter 2.4.3.
ABB has to make thorough estimations of the number of carbon credits that a project will generate, the value of the credits and what direct and indirect costs that are associated with the engagement. In addition, ABB has to take the risk related to the involvement into account to be able to offer the customer a price cut that reflects the total value of the credits that should be transferred, see Chapter 5.4.
In other words, the financial barrier reflects that the project must generate more revenue than costs before ABB can get involved.
Internal barrier Even if the project is CDM approved and would be theoretically financially feasible there must be an internal approval of the carbon credit market involvement. The short term cash flow of ABB would be less if ABB accepted carbon credit as part of the payment. The sales department often dislikes the idea of price reductions in exchange for future return. (Bach, 2008)
Even if rigorous profit estimations have been made and the difference between the carbon credit estimated value and the price reduction is big enough to reflect the risk, there must be an internal willingness to take on this risk. Because of the company history, with the early 21st century crisis close in mind, there is also a clear risk aversion within ABB (Bach, 2008).
As of today, ABB has no internal organization for handling of carbon credits. The CDM registration processes and the many risks, further described in Chapter 2.4.3, related to carbon credits must be handled and since there are no internal processes in this matter, expensive external consultancies and banks must be used and trusted. There is general knowledge concerning global warming and the carbon credit issue within ABB, especially at the group sustainability department. However, CDM registration processes or financial aspects of emission trading can not be handled internally as of today. (Henricsson, 2008; Nordström, 2008)
3.2 ABB and carbon credit demand The Kyoto Protocol only caps the emission on countries whereas the subordinated EU ETS redirects these emission reductions to specific companies. Since ABB is no energy intensive industry included by the EU ETS, see Chapter 2.5, the company is almost entirely excluded from emission caps.
The only ABB entities that are covered by the EU ETS trading scheme as of today, October 2008, are ABB Figeholm, Sweden, ABB Fastighet AB, Sweden and ABB Service GmbH, Germany and ABB Pucaro, Germany (European Commission, 2008b). Small changes may occur as some countries have not yet distributed their emissions among specific companies, further described in Chapter 2.8.2. The emissions
51

Chapter 3 – ABB and the carbon credit market
and designated carbon credits for the different entities during the first and second phase of the EU ETS are presented in below.
Facility Phase I average annual emissions
Phase I annual designated credits
Phase I average annual internal
transfer
Phase I average annual
surplus(+)/shortage(‐)
ABB Figeholm
6,751 tCO2 9,144 pcs ‐167 pcs +2,226 pcs
ABB Fastighet
5,021 tCO2 4,905 pcs +167 pcs +51 pcs
ABB Service Gmbh
22,934 tCO2 22,035 pcs ±0 pcs ‐899 pcs
ABB Pucaro 4,637 tCO2 5,030 tCO2 ±0 pcs 0 pcs1
Total 39,343 41,114 n.m. 1,378 pcs
Table 3.8: ABB carbon credit demand during EU ETS Phase I. (Rådstedt, 2008; Johansson, 2008; Rabe, 2008; Meckes, 2008)
Facility Phase II estimated average annual
emissions
Phase II annual designated credits
Phase II annual estimated internal
transfer
Phase II annual surplus(+)/ shortage(‐)
ABB Figeholm
9,5642 tCO2 7,684 pcs +1,851 pcs ‐29 pcs
ABB Fastighet
3,0003 tCO2 4,851 pcs ‐1,851 pcs ±0 pcs
ABB Service Gmbh
22,9344 tCO2 23,858 pcs ±0 pcs 924 pcs
ABB Pucaro 5,9701 tCO2 6,476 pcs ±0 pcs 506 pcs
1 Due to post Phase I correction of emissions. 2 Linear emission approximation based on 42% increase in production; from the past 12 000 tons per year to the average production of 12 000 tons and the 22000 tons that will be produced upon current upgrade completion. 3 Estimation (Johansson, 2008). 4 Emissions estimated to remain constant (Rabe, 2008).
52

Chapter 3 – ABB and the carbon credit market
Total 41,468 tCO2 42,869 pcs n.m. 1,401 pcs
Table 3.9: ABB carbon credit demand during EU ETS Phase II. (Rådstedt, 2008; Johansson, 2008; Rabe, 2008; Meckes, 2008)
3.2.1 ABB Figeholm ABB Figeholm manufactures electrical insulation material from cellulose and the company is therefore included in the pulp and paper sector covered by EU ETS. During the first phase of EU ETS the company has had no need for measures to meet their target because of carbon credit over allocation. However, through the tightened EU ETS Phase II the company estimates a shortage of carbon credits which has to be complied with.
Figeholm sees little possibilities in reducing emission and therefore expect to meet their emission targets by independently buying carbon credits or receiving them internally. However, the company has no internal knowledge in how to act on the carbon credit market. The only ABB division with allocated carbon credits that is communicating with ABB Figeholm is ABB Fastighet. (Rådstedt, 2008)
3.2.2 ABB Fastighet ABB Fastighet rents and buys property related services such as energy, cleaning and security to the Swedish ABB Units. One part of ABB Fastighet has been generating direct CO2 emissions; the process heat system which is used to heat water for drying purposes in the transformer manufacturing process. Previously, the water has been heated by combustion of oil, which is why ABB Fastighet was not able to meet their emission targets by using their allocated carbon credits during the EU ETS Phase I. To meet their targets, 500 carbon credits were transferred from ABB Figeholm which had a carbon credit surplus. (Johansson, 2008)
Today, the oil combustion has been replaced by district heating that is bought from a combined heat power plant nearby. Because of this, the emissions of ABB Fastighet have been reduced significantly and a carbon credit surplus will evolve. This surplus is planned to assist ABB Figeholm in meeting their emission targets, which they probably will have trouble complying with because of their planned production increase. (Johansson, 2008)
3.2.3 ABB Service ABB Service in Bobingen, Germany, is a subsidiary of ABB Automation with a supportive role which includes businesses such as restructuring and optimization of production sites, project management and engineering, supplying of energy, education, etc. However, the part of ABB Service that generates emission and thus creates EU ETS compliance is the steam boiler facility with a heating power of 20 MW. (Rabe, 2008)
The emissions from this facility could not be covered by the carbon credits handed to the company which forced ABB Service to buy around 3,000 carbon credits. During the 2nd phase of the EU ETS the company does not expect any carbon credit shortages as they expect constant emission while they at the same time are receiving more carbon credits. As they do not expect any significant surplus they have no plans on how to handle such an event. (Rabe, 2008)
24 Linear emissions approximation based on Phase I emission‐allocation relationship.
53
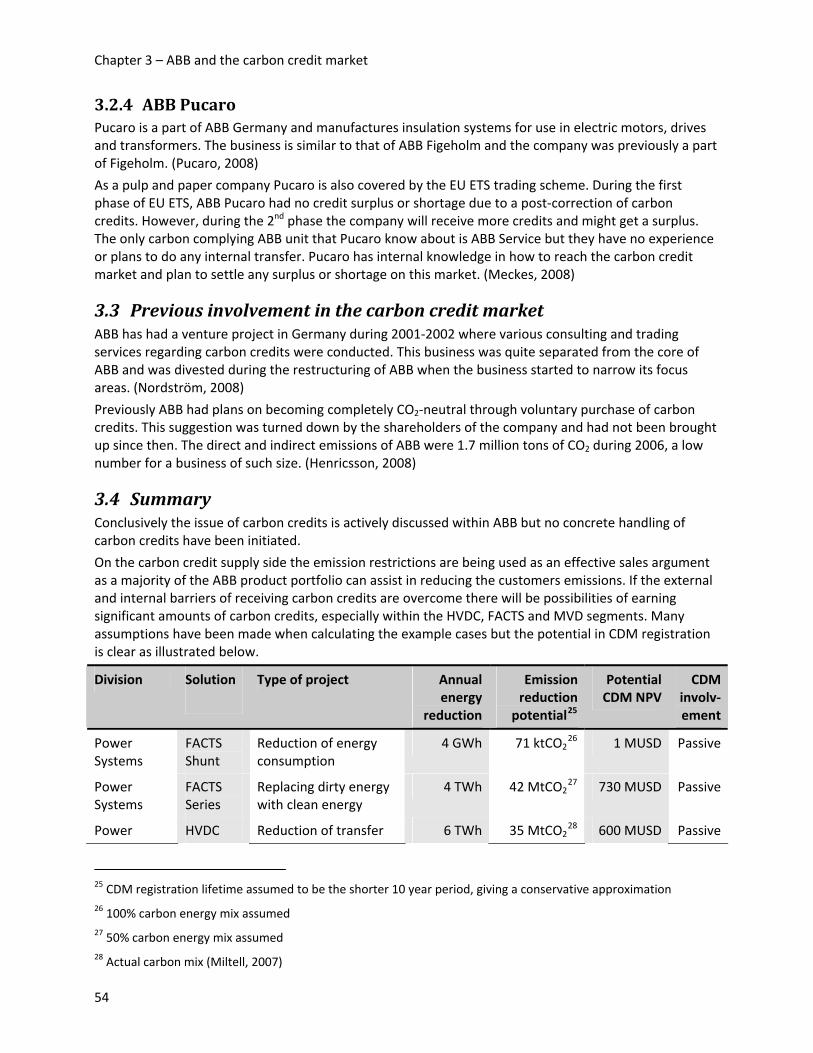
Chapter 3 – ABB and the carbon credit market
3.2.4 ABB Pucaro Pucaro is a part of ABB Germany and manufactures insulation systems for use in electric motors, drives and transformers. The business is similar to that of ABB Figeholm and the company was previously a part of Figeholm. (Pucaro, 2008)
As a pulp and paper company Pucaro is also covered by the EU ETS trading scheme. During the first phase of EU ETS, ABB Pucaro had no credit surplus or shortage due to a post‐correction of carbon credits. However, during the 2nd phase the company will receive more credits and might get a surplus. The only carbon complying ABB unit that Pucaro know about is ABB Service but they have no experience or plans to do any internal transfer. Pucaro has internal knowledge in how to reach the carbon credit market and plan to settle any surplus or shortage on this market. (Meckes, 2008)
3.3 Previous involvement in the carbon credit market ABB has had a venture project in Germany during 2001‐2002 where various consulting and trading services regarding carbon credits were conducted. This business was quite separated from the core of ABB and was divested during the restructuring of ABB when the business started to narrow its focus areas. (Nordström, 2008)
Previously ABB had plans on becoming completely CO2‐neutral through voluntary purchase of carbon credits. This suggestion was turned down by the shareholders of the company and had not been brought up since then. The direct and indirect emissions of ABB were 1.7 million tons of CO2 during 2006, a low number for a business of such size. (Henricsson, 2008)
3.4 Summary Conclusively the issue of carbon credits is actively discussed within ABB but no concrete handling of carbon credits have been initiated.
On the carbon credit supply side the emission restrictions are being used as an effective sales argument as a majority of the ABB product portfolio can assist in reducing the customers emissions. If the external and internal barriers of receiving carbon credits are overcome there will be possibilities of earning significant amounts of carbon credits, especially within the HVDC, FACTS and MVD segments. Many assumptions have been made when calculating the example cases but the potential in CDM registration is clear as illustrated below.
Division Solution
Type of project Annual energy
reduction
Emission reduction
p otential25
Potential CDM NPV
CDM involv‐ement
Power Systems
FACTS Shunt
Reduction of energy consumption
4 GWh 7 1 ktCO226 1 MUSD Passive
Power Systems
FACTS Series
Replacing dirty energy with clean energy
4 TWh 4 2 MtCO227 730 MUSD Passive
Power HVDC Reduction of transfer 6 TWh 3 5 MtCO228 600 MUSD Passive
25 CDM registration lifetime assumed to be the shorter 10 year period, giving a conservative approximation 26 100% carbon energy mix assumed 27 50% carbon energy mix assumed 28 Actual carbon mix (Miltell, 2007)
54
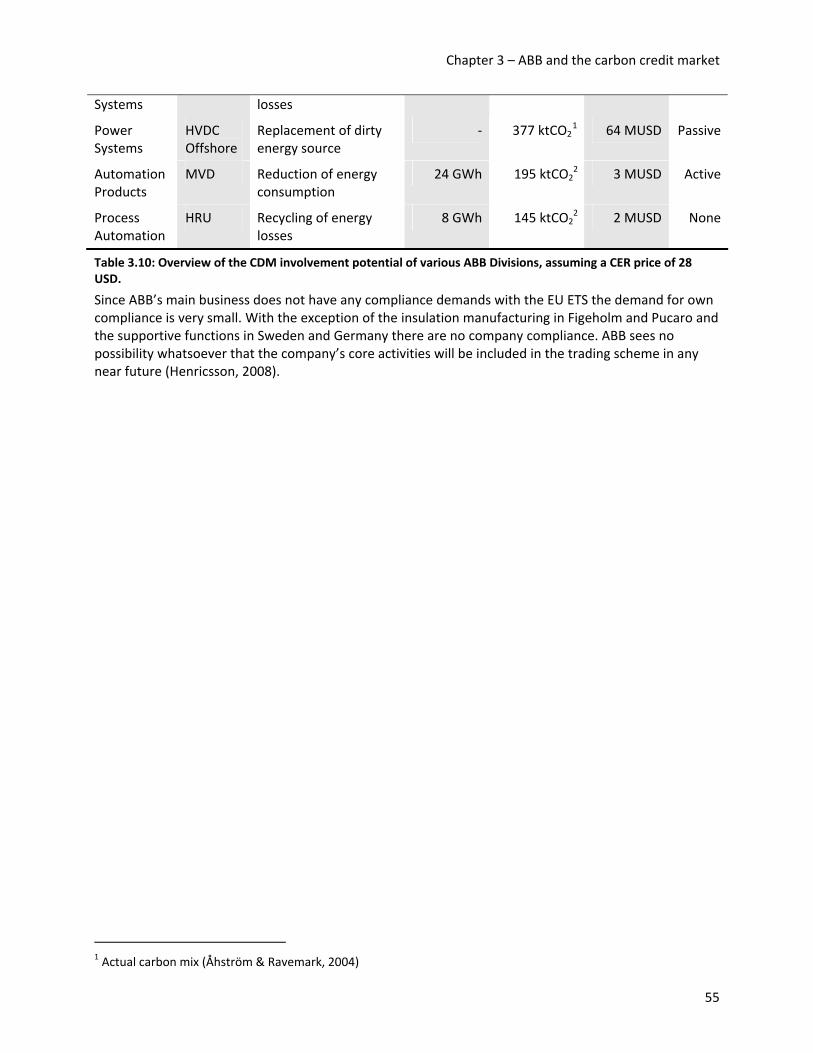
Chapter 3 – ABB and the carbon credit market
Systems losses
Power Systems
HVDC Offshore
Replacement of dirty energy source
‐ 377 ktCO21
64 MUSD Passive
Automation Products
MVD Reduction of energy consumption
24 GWh 195 ktCO22
3 MUSD Active
Process Automation
HRU Recycling of energy losses
8 GWh 145 ktCO22
2 MUSD None
Table 3.10: Overview of the CDM involvement potential of various ABB Divisions, assuming a CER price of 28 USD.
Since ABB’s main business does not have any compliance demands with the EU ETS the demand for own compliance is very small. With the exception of the insulation manufacturing in Figeholm and Pucaro and the supportive functions in Sweden and Germany there are no company compliance. ABB sees no possibility whatsoever that the company’s core activities will be included in the trading scheme in any near future (Henricsson, 2008).
1 Actual carbon mix (Åhström & Ravemark, 2004)
55

4 Problem breakdown The overall purpose of this thesis is to investigate how GTO should respond to ABB’s involvement in carbon credit related issues. To this point the carbon credit markets, the current and the, to some extent, possible future exposure to the market have been studied. In order to move forward and formulate a theoretical frame of reference the problem formulation needs to be broken down to more manageable sizes and specific questions has to be asked. This chapter will present this bridge between the current situation description and the theoretical frame of reference.
From the pre‐study of the carbon credit market it has become clear that there is no direct and significant involvement in the carbon credit market as of today. However, it has also come clear that there are many opportunities regarding ABB’s involvement in the market and many initiatives are being conducted even though they have not lead to any direct carbon credit exposure or handling.
When studying how ABB group functions and business units are involved in the carbon credit market it has become apparent that many different business units are conducting research and investigating time and effort to understand and grasp the potential of this market. This appears to be done simultaneously, but without much organized collaboration and synchronization. There is an obvious organizational aspect to this, posing questions such as:
• Should a centralized unit take on a role as “carbon expert”, aiding the subsidiaries interested in the carbon credit market?
• If so, should this unit be the GTO or how should it be connected to the GTO?
There are many barriers to overcome before ABB divisions could receive any carbon credits. The barrier which the GTO will be able to impact is primarily the financial barrier. Thorough work is required in order to secure economical feasibility of carbon credit involvement and to avoid and mitigate undesirable risks.
EUAs and CERs are financial instruments traded over an exchange or OTC. These instruments, once issued, behave more or less like any other financial instrument. Any involvement from ABB in the carbon credit market would span over some time, e.g. if ABB would enter a CDM project CERs would be issued over at least seven years. This introduces issues regarding pricing, how can a project finance team determine what size of discount to offer to a customer in order to receive its carbon credits? The first response the GTO could take to the growing carbon credit interest is to introduce a financial management of these instruments. That introduces a number of questions such as:
• What is the financial risk in EUAs and CERs?
• How can such risk be handled?
• How can GTO set prices on EUAs and CERs towards the subsidiaries?
The issuance of CERs does not mimic a typical issuance of general financial instruments. One or more parties have to invest in a project in a developing country, certain measures needs to be taken in order to be eligible for issuance and in order to actually get an issuance. This is a process involving bureau‐cracy, uncertainties in project performance and uncertainties in collaborative parties. Interesting questions that can be posed include:
• What project risk exists in CDM projects?
• How can such risk be handled?
• Should GTO invest resources to build competence in this area?
56
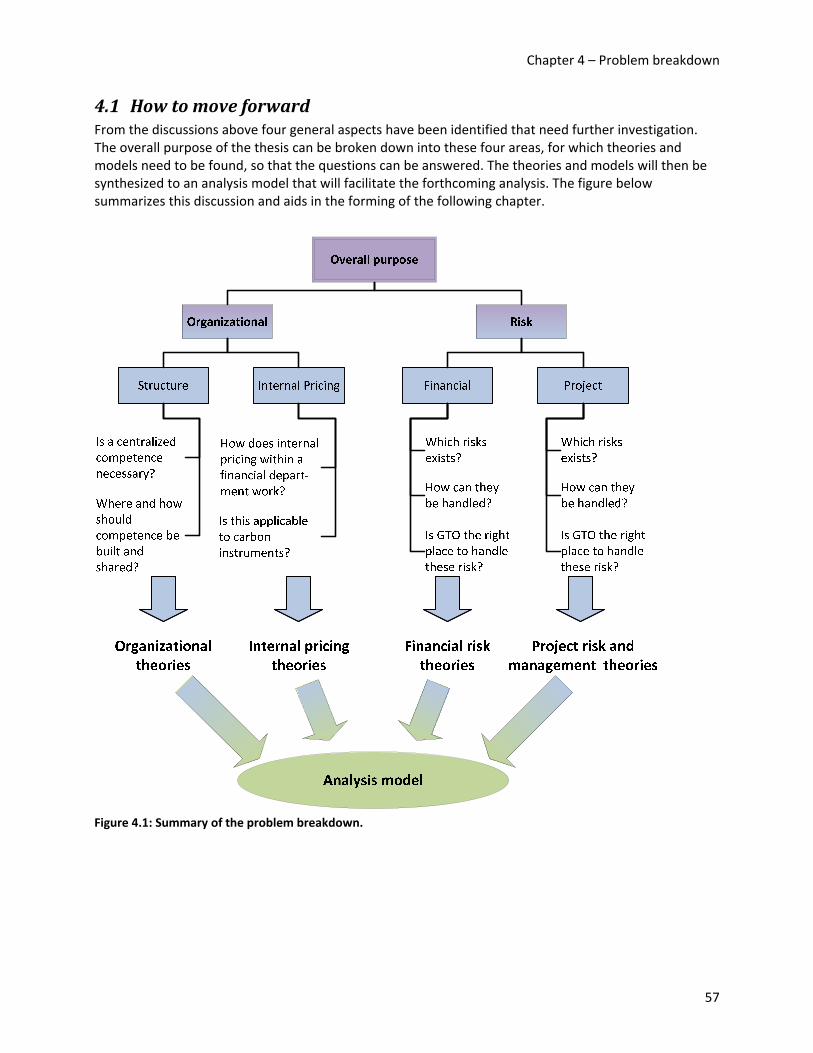
Chapter 4 – Problem breakdown
4.1 How to move forward From the discussions above four general aspects have been identified that need further investigation. The overall purpose of the thesis can be broken down into these four areas, for which theories and models need to be found, so that the questions can be answered. The theories and models will then be synthesized to an analysis model that will facilitate the forthcoming analysis. The figure below summarizes this discussion and aids in the forming of the following chapter.
Figure 4.1: Summary of the problem breakdown.
57

5 Theoretical frame of reference This chapter covers the theoretical frame of reference for the forthcoming analysis section and is guided by the problem breakdown in the previous chapter. Organizational aspects are described first, followed by transfer pricing issues and finally project and financial risks and risk management.
5.1 Organization When a company faces a new issue that has to be handled, the development of an organizational structure for the handling of this issue is needed. Which organisational approach that should be used often revolves around the question of whether a centralized or decentralized approach should be taken. How the expertise in this organisation should be utilized is important to reach organizational performance. If the expertise should be kept in‐house or be outsourced revolves around many trade‐offs such as costs and level of flexibility and risk‐taking.
5.1.1 Centralization versus decentralization An early reference to the problems of a centralized versus decentralized organization reads:
And Moses´ father‐in‐law said unto him, “The thing that thou doest is not good. Thou wilt surely wear away, both thou, and this people that is with thee: for this thing is too heavy for thee; thou are not able to perform it for thyself alone”.
Exodus, 18:17‐18
Where there is no counsel, the people perish; but in the multitude of counselors there is safety.
Proverbs, 29:18;11:14
Choosing a centralized or decentralized organisation effectively requires resolving a trade‐off between coordination and adaptation. A decentralized organisation naturally has the advantage of being adaptable to local conditions where decisions are made by local managers. On the other hand, decentralized organisations also have a natural disadvantage where the divisional manager is uncertain about the decisions made by others. (Alonso et al; 2008)
However, Alonso et al (2008) argues that decentralization can be effective even when coordination is important. When coordination becomes critical, division managers recognize their interdependence and communicate very well under decentralization. In contrast, the communication channels of a centralized organisation are strained when increased coordination is needed as division managers anticipate that headquarters will enforce a compromise. (Alonso et al., 2008)
Brooke (1984) breaks down the general coordination and adaptation trade‐off into a number of aspects. The safeguarding of information is one important aspect when choosing an organizational approach since the organisational unit or units has to have sufficient knowledge and information to be able to independently conduct its work. If close external relations to local entities such as governments or other organisations are important the decentralized organization has an advantage. A centralized approach simplifies implementation of new strategies and reduces uncertainties on the outcome of central initiatives. When the level of expertise needed is high the centralized organization is to prefer while the decentralized organization is more adapt when a short time to decision is wanted. A common problem in centralized organizations is slow communication and bottlenecks created at decision‐making positions. This could lead to lost orders or other problem because of insufficient pace of communication.
In addition there are certain human factors that very much could affect the choice of organizational structure. Alonso et al (2008) argues that information held by division managers often can be used for sub optimal purposes. Managers are often biased toward increasing profits of their own division rather than for the organization as a whole; they communicate their information to influence decision making
58
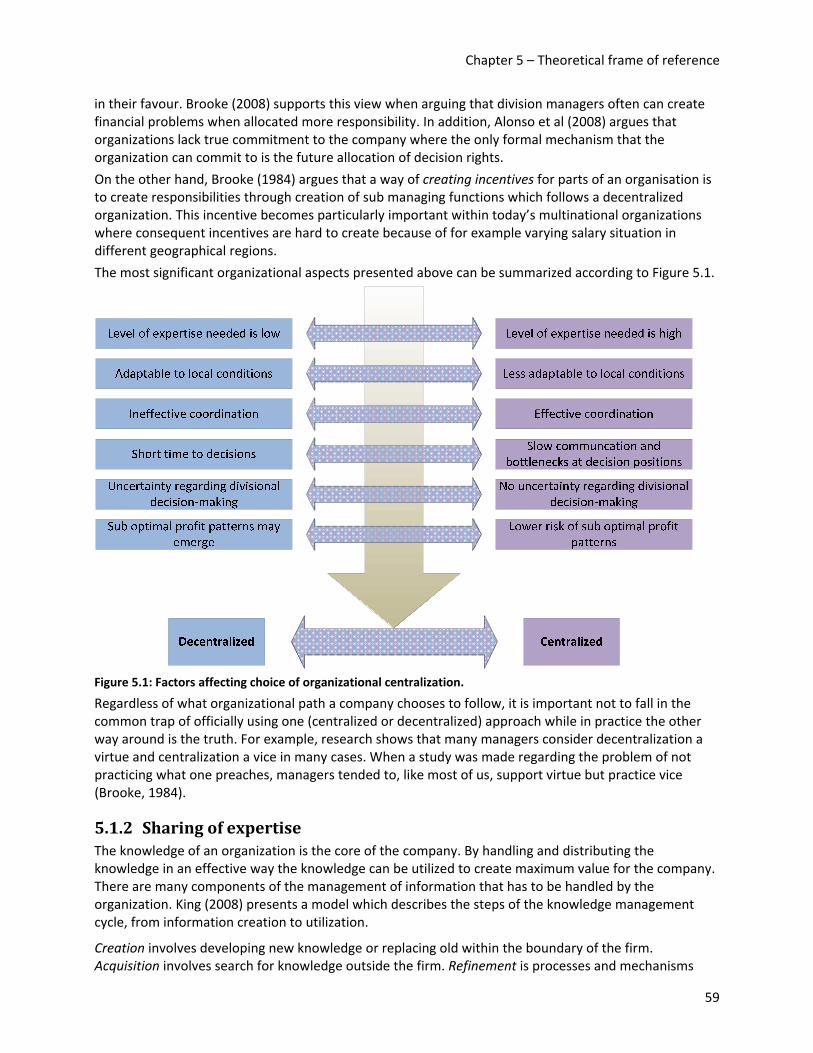
Chapter 5 – Theoretical frame of reference
in their favour. Brooke (2008) supports this view when arguing that division managers often can create financial problems when allocated more responsibility. In addition, Alonso et al (2008) argues that organizations lack true commitment to the company where the only formal mechanism that the organization can commit to is the future allocation of decision rights.
On the other hand, Brooke (1984) argues that a way of creating incentives for parts of an organisation is to create responsibilities through creation of sub managing functions which follows a decentralized organization. This incentive becomes particularly important within today’s multinational organizations where consequent incentives are hard to create because of for example varying salary situation in different geographical regions.
The most significant organizational aspects presented above can be summarized according to Figure 5.1.
Figure 5.1: Factors affecting choice of organizational centralization.
Regardless of what organizational path a company chooses to follow, it is important not to fall in the common trap of officially using one (centralized or decentralized) approach while in practice the other way around is the truth. For example, research shows that many managers consider decentralization a virtue and centralization a vice in many cases. When a study was made regarding the problem of not practicing what one preaches, managers tended to, like most of us, support virtue but practice vice (Brooke, 1984).
5.1.2 Sharing of expertise The knowledge of an organization is the core of the company. By handling and distributing the knowledge in an effective way the knowledge can be utilized to create maximum value for the company. There are many components of the management of information that has to be handled by the organization. King (2008) presents a model which describes the steps of the knowledge management cycle, from information creation to utilization.
Creation involves developing new knowledge or replacing old within the boundary of the firm. Acquisition involves search for knowledge outside the firm. Refinement is processes and mechanisms
59
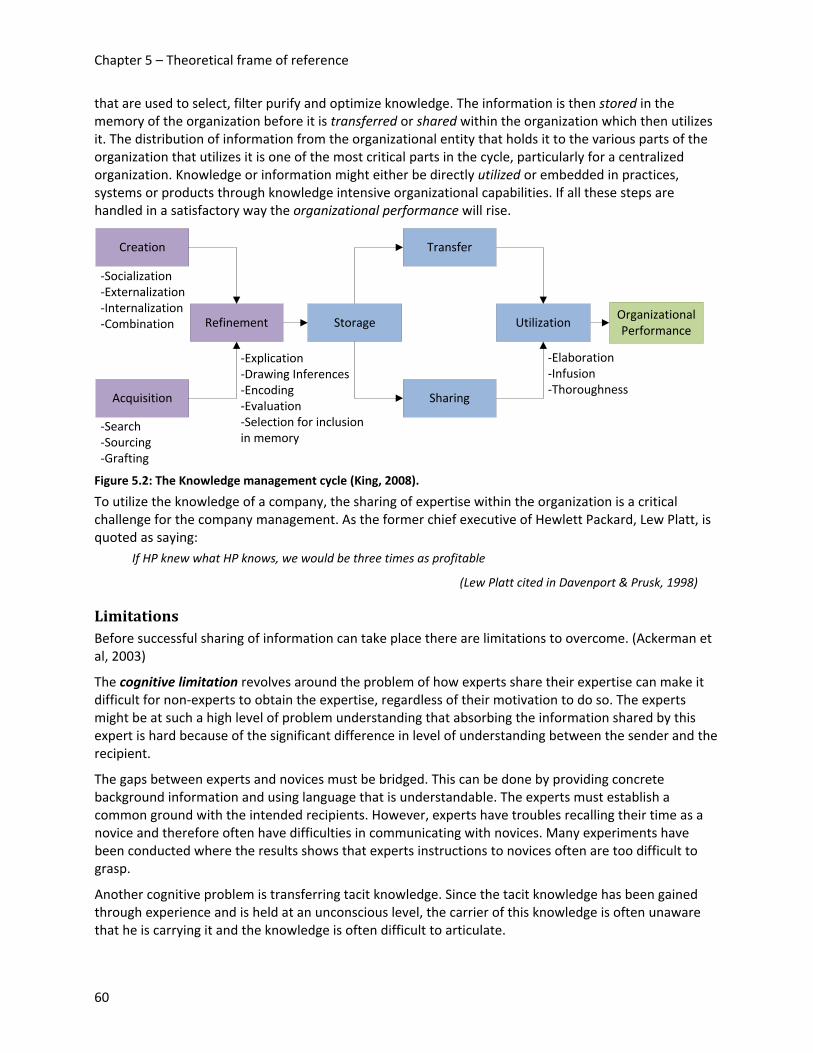
Chapter 5 – Theoretical frame of reference
that are used to select, filter purify and optimize knowledge. The information is then stored in the memory of the organization before it is transferred or shared within the organization which then utilizes it. The distribution of information from the organizational entity that holds it to the various parts of the organization that utilizes it is one of the most critical parts in the cycle, particularly for a centralized organization. Knowledge or information might either be directly utilized or embedded in practices, systems or products through knowledge intensive organizational capabilities. If all these steps are handled in a satisfactory way the organizational performance will rise.
Creation
Acquisition
Refinement Storage
Transfer
Sharing
UtilizationOrganizational Performance
‐Socialization‐Externalization‐Internalization‐Combination
‐Search‐Sourcing‐Grafting
‐Elaboration‐Infusion‐Thoroughness
‐Explication‐Drawing Inferences‐Encoding‐Evaluation‐Selection for inclusion in memory
Figure 5.2: The Knowledge management cycle (King, 2008).
To utilize the knowledge of a company, the sharing of expertise within the organization is a critical challenge for the company management. As the former chief executive of Hewlett Packard, Lew Platt, is quoted as saying:
If HP knew what HP knows, we would be three times as profitable
(Lew Platt cited in Davenport & Prusk, 1998)
Limitations Before successful sharing of information can take place there are limitations to overcome. (Ackerman et al, 2003)
The cognitive limitation revolves around the problem of how experts share their expertise can make it difficult for non‐experts to obtain the expertise, regardless of their motivation to do so. The experts might be at such a high level of problem understanding that absorbing the information shared by this expert is hard because of the significant difference in level of understanding between the sender and the recipient.
The gaps between experts and novices must be bridged. This can be done by providing concrete background information and using language that is understandable. The experts must establish a common ground with the intended recipients. However, experts have troubles recalling their time as a novice and therefore often have difficulties in communicating with novices. Many experiments have been conducted where the results shows that experts instructions to novices often are too difficult to grasp.
Another cognitive problem is transferring tacit knowledge. Since the tacit knowledge has been gained through experience and is held at an unconscious level, the carrier of this knowledge is often unaware that he is carrying it and the knowledge is often difficult to articulate.
60
Chapter 5 – Theoretical frame of reference
Motivational limitations include the lack of a motivational or an intentional component to expertise sharing. The most obvious motivational limitation is the fact that most organizations, to some extent, are designed to set people against each other, for example by sharing a pool of bonus money between employees based on their relative performance. This so called relative zero‐sum incentive system will discourage information sharing. Even without explicit individual incentive systems such as bonuses or awards, the competition between organizational units may be an inevitable aspect of an organization because of human nature. To avoid this, incentives to share information can be created, such as extra rewards when co‐workers are satisfied with the information shared.
If too rigorous information sharing procedures are implemented, another motivational limitation can occur. Formalized information sharing can lead to the development of new relationships that would not have occurred otherwise. If informal networks are developed a reluctance to use the formal procedures can emerge. Also, many examples show that people tend to do the opposite to what they are told to do.
Another motivational limitation is the characteristics of a hierarchic organization. By constraining information so that instructions flow downwards and information flows upward, organizations are made more efficient and predictable. However people accustomed to such a model may be reluctant to share information in ways that violate this model. (Ackerman et al, 2003)
Overcoming limitations Difficulties in sharing of expertise because of cognitive or motivational limitations can be assessed by certain management practices.
Cognitive limitations might be more difficult to overcome since they are dependent on how information is stored and retrieved from the memory. One way of overcoming these barriers is to introduce an interface between the expert and the novice through a person or organizational entity with an intermediate level of expertise. Those with intermediate expertise will have a better understanding of the expertise than the novice has and a better understanding of the novice than the expertise has. (Ackerman et al, 2003)
Studies have been made where people with intermediate knowledge regarding a certain technical issue could make better estimations of how long it would take a novice to solve a problem related to this issue than the expertise within the issue was able to. Those with intermediate knowledge might be able to explicate the concrete knowledge required for the task better than experts would. Organisations should consider creating teams composed of both intermediates and experts to be able to provide the novices of the organizations with information at an appropriate level of complexity. (Hinds, 1999)
Another way to overcome cognitive barriers is to encourage two‐way communication between the experts and novices. By doing this the expert can get a better understanding of the level of knowledge that the novice posses through questions and feedback. It allows the expert to adjust his presentation styles to suit the novice. (Ackerman et al, 2003)
Motivational limitations are significantly easier to overcome. The issues discussed earlier can be addressed by reducing competition between groups or individuals, allowing communities of practice to evolve, deemphasizing status hierarchies and creating incentives to share knowledge.
An effective way of reducing internal competition, without introducing explicit information sharing incentives, is to establish common goals rather than individual. If individuals can identify with the organization and see competition outside the walls of the company rather than inside, expertise sharing is more likely to occur.
Communities of practice are groups of people who are informally bound together by shared expertise and passion for a joint enterprise. Members belong to communities like this because of a will to
61
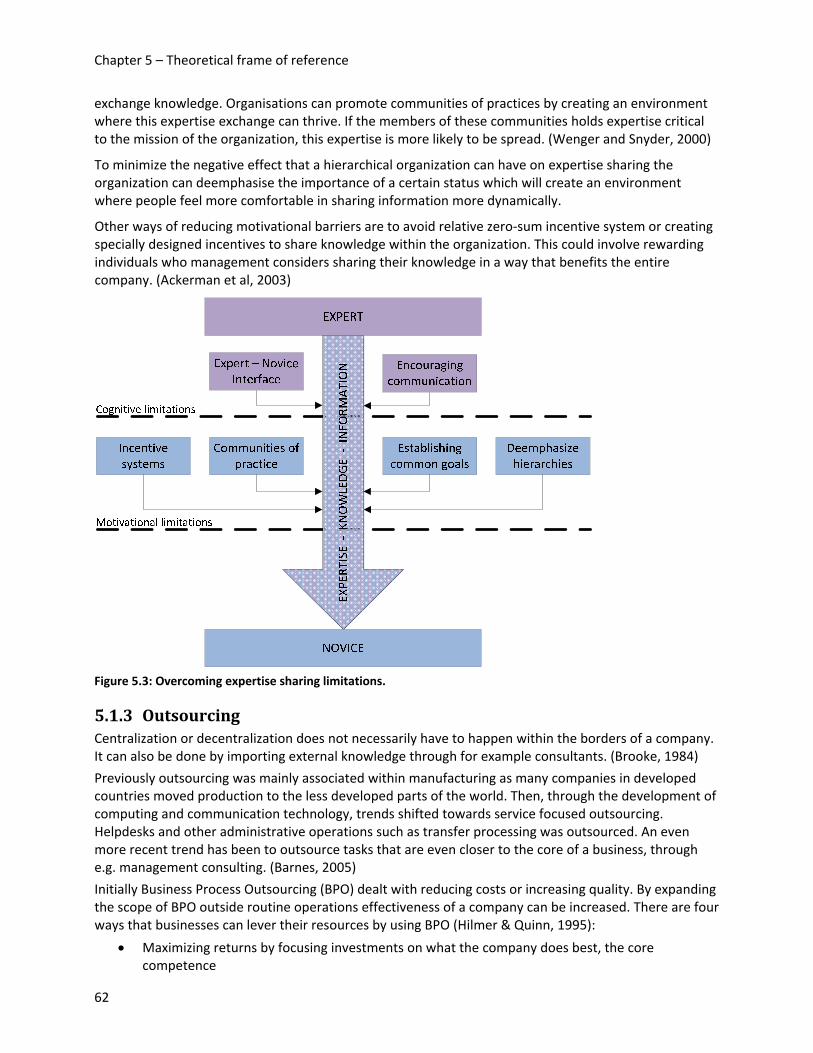
Chapter 5 – Theoretical frame of reference
exchange knowledge. Organisations can promote communities of practices by creating an environment where this expertise exchange can thrive. If the members of these communities holds expertise critical to the mission of the organization, this expertise is more likely to be spread. (Wenger and Snyder, 2000)
To minimize the negative effect that a hierarchical organization can have on expertise sharing the organization can deemphasise the importance of a certain status which will create an environment where people feel more comfortable in sharing information more dynamically.
Other ways of reducing motivational barriers are to avoid relative zero‐sum incentive system or creating specially designed incentives to share knowledge within the organization. This could involve rewarding individuals who management considers sharing their knowledge in a way that benefits the entire company. (Ackerman et al, 2003)
Figure 5.3: Overcoming expertise sharing limitations.
5.1.3 Outsourcing Centralization or decentralization does not necessarily have to happen within the borders of a company. It can also be done by importing external knowledge through for example consultants. (Brooke, 1984)
Previously outsourcing was mainly associated within manufacturing as many companies in developed countries moved production to the less developed parts of the world. Then, through the development of computing and communication technology, trends shifted towards service focused outsourcing. Helpdesks and other administrative operations such as transfer processing was outsourced. An even more recent trend has been to outsource tasks that are even closer to the core of a business, through e.g. management consulting. (Barnes, 2005)
Initially Business Process Outsourcing (BPO) dealt with reducing costs or increasing quality. By expanding the scope of BPO outside routine operations effectiveness of a company can be increased. There are four ways that businesses can lever their resources by using BPO (Hilmer & Quinn, 1995):
• Maximizing returns by focusing investments on what the company does best, the core competence
62

Chapter 5 – Theoretical frame of reference
• Providing barriers for new entrants by developing core competences • Leveraging on utilization of external innovations, competences, etc, that would be hard to create
internally • Reducing risk, shortening cycle times, lowering investments and creating better responsiveness
In addition, Quinn (1999) emphasizes organizational advantages of outsourcing through having a flexible organization and by achieving cross‐divisional coordination that can be problematic because of internal political or structural reasons.
As an example, the U.S. Air force had many positive experiences from hiring management consultants to improve their business. The outsourcing gave the Air force access to a breadth of experience that was new and impossible to develop internally, an objective view of the current situation and problems and a controlling of the current problem approach. (Rawlings, 2006)
However, there are many risks connected with BPO which have been revealed through various studies (Barnes, 2005):
• Costs of internally handling issues such as strategy or IT can be significantly lower than outsourcing costs.
• Outsourcing of some elements can lead to lack of integration between the outsourced function and other parts of the organisation.
• External parties could be poorly funded or have conflicting cultural or political approaches.
In addition, studies made by Jang and Lee (1998) pointed out that clients often assert that consultants lack knowledge of the business and the specialized knowledge required, unlike the example of the U.S. Air force.
Picking your partner and building a relationship If a company chooses to outsource a process the selection of a proper partner is critical. Mulligan (2006) sees similarities in choosing a personal hairdresser and a company business partner.
I know many people who wouldn’t trust just anybody to take a pair of scissors to their head. Even me. If that’s true for you, it could explain why you probably frequent the same stylist. You built a relationship with that person and you know what you want. Initially price may have been a factor, but results based on experience are likely the key to your long‐term selection.
(Mulligan, 2006, p.55)
Mulligan (2006) mentions some factors that should be taken into consideration when choosing your business partner:
• Hire based on long term commitment. • Hire those which offer the expertise required to fulfill the needs of the outsourcing. • Have a roadmap with a long‐term view of how to develop the partnership.
Other more relationship related aspects to take into consideration when picking a partner are being discussed by Barnes (2005):
• How deep should the relationship be? • How broad should the relationship be? • To what extent does the outsourcer’s way of working have to be transferred to the service
provider? • To what extent are assets transferred to the service provider?
Regardless of the advantages and risks of engaging in outsourcing the company that engages in outsourcing must be ready to do this. Consultants often claim that top managers lack sufficient support for consulting projects to succeed (Jang and Lee, 1998). Mulligan (2006) summarizes this and two other factors regarding the internal readiness for outsourcing that should be taken into consideration:
63
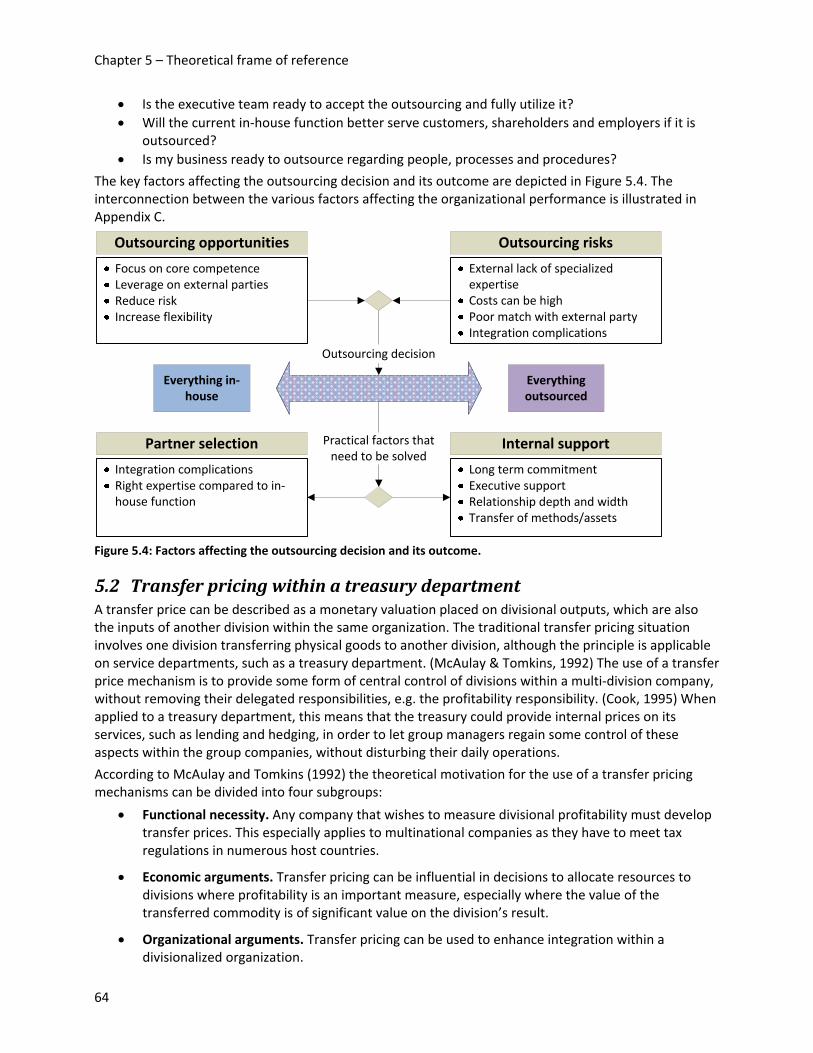
Chapter 5 – Theoretical frame of reference
• Is the executive team ready to accept the outsourcing and fully utilize it? • Will the current in‐house function better serve customers, shareholders and employers if it is
outsourced? • Is my business ready to outsource regarding people, processes and procedures?
The key factors affecting the outsourcing decision and its outcome are depicted in Figure 5.4. The interconnection between the various factors affecting the organizational performance is illustrated in Appendix C.
Outsourcing decision
Practical factors that need to be solved
Outsourcing risks
External lack of specialized expertiseCosts can be highPoor match with external partyIntegration complications
Outsourcing opportunities
Focus on core competenceLeverage on external partiesReduce riskIncrease flexibility
Everything outsourced
Everything in‐house
Partner selection
Integration complicationsRight expertise compared to in‐house function
Internal support
Long term commitmentExecutive supportRelationship depth and widthTransfer of methods/assets
Figure 5.4: Factors affecting the outsourcing decision and its outcome.
5.2 Transfer pricing within a treasury department A transfer price can be described as a monetary valuation placed on divisional outputs, which are also the inputs of another division within the same organization. The traditional transfer pricing situation involves one division transferring physical goods to another division, although the principle is applicable on service departments, such as a treasury department. (McAulay & Tomkins, 1992) The use of a transfer price mechanism is to provide some form of central control of divisions within a multi‐division company, without removing their delegated responsibilities, e.g. the profitability responsibility. (Cook, 1995) When applied to a treasury department, this means that the treasury could provide internal prices on its services, such as lending and hedging, in order to let group managers regain some control of these aspects within the group companies, without disturbing their daily operations.
According to McAulay and Tomkins (1992) the theoretical motivation for the use of a transfer pricing mechanisms can be divided into four subgroups:
• Functional necessity. Any company that wishes to measure divisional profitability must develop transfer prices. This especially applies to multinational companies as they have to meet tax regulations in numerous host countries.
• Economic arguments. Transfer pricing can be influential in decisions to allocate resources to divisions where profitability is an important measure, especially where the value of the transferred commodity is of significant value on the division’s result.
• Organizational arguments. Transfer pricing can be used to enhance integration within a divisionalized organization.
64
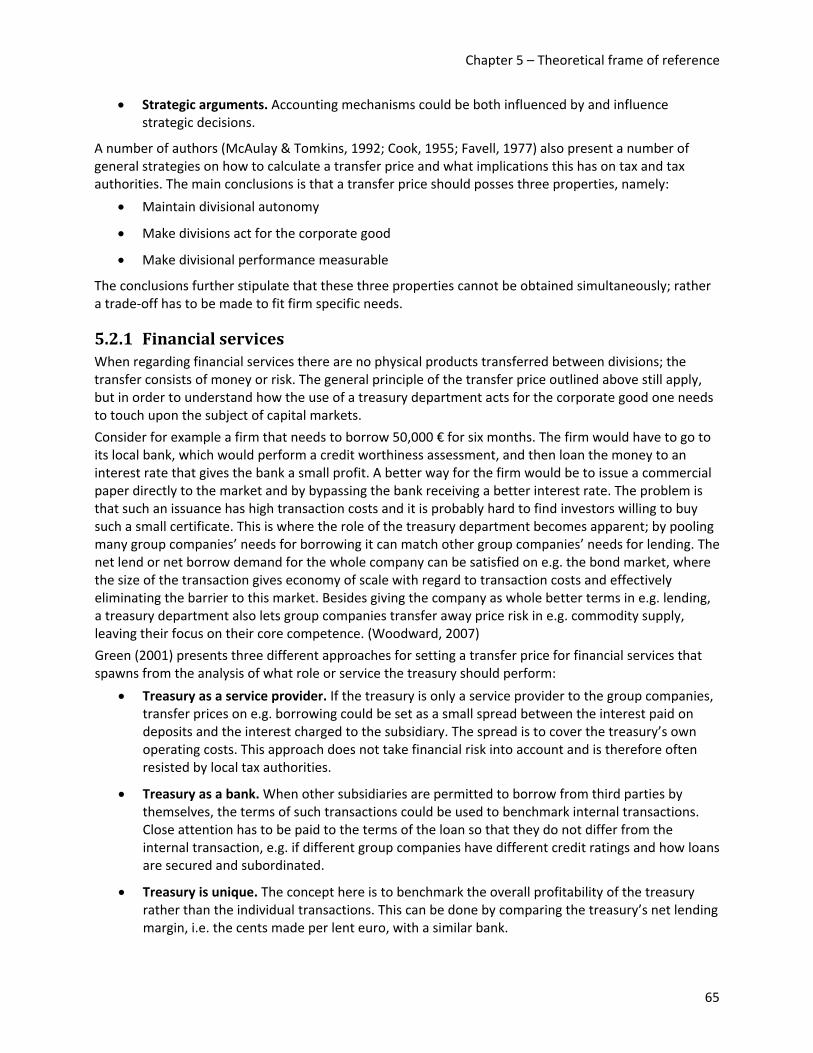
Chapter 5 – Theoretical frame of reference
• Strategic arguments. Accounting mechanisms could be both influenced by and influence strategic decisions.
A number of authors (McAulay & Tomkins, 1992; Cook, 1955; Favell, 1977) also present a number of general strategies on how to calculate a transfer price and what implications this has on tax and tax authorities. The main conclusions is that a transfer price should posses three properties, namely:
• Maintain divisional autonomy
• Make divisions act for the corporate good
• Make divisional performance measurable
The conclusions further stipulate that these three properties cannot be obtained simultaneously; rather a trade‐off has to be made to fit firm specific needs.
5.2.1 Financial services When regarding financial services there are no physical products transferred between divisions; the transfer consists of money or risk. The general principle of the transfer price outlined above still apply, but in order to understand how the use of a treasury department acts for the corporate good one needs to touch upon the subject of capital markets.
Consider for example a firm that needs to borrow 50,000 € for six months. The firm would have to go to its local bank, which would perform a credit worthiness assessment, and then loan the money to an interest rate that gives the bank a small profit. A better way for the firm would be to issue a commercial paper directly to the market and by bypassing the bank receiving a better interest rate. The problem is that such an issuance has high transaction costs and it is probably hard to find investors willing to buy such a small certificate. This is where the role of the treasury department becomes apparent; by pooling many group companies’ needs for borrowing it can match other group companies’ needs for lending. The net lend or net borrow demand for the whole company can be satisfied on e.g. the bond market, where the size of the transaction gives economy of scale with regard to transaction costs and effectively eliminating the barrier to this market. Besides giving the company as whole better terms in e.g. lending, a treasury department also lets group companies transfer away price risk in e.g. commodity supply, leaving their focus on their core competence. (Woodward, 2007)
Green (2001) presents three different approaches for setting a transfer price for financial services that spawns from the analysis of what role or service the treasury should perform:
• Treasury as a service provider. If the treasury is only a service provider to the group companies, transfer prices on e.g. borrowing could be set as a small spread between the interest paid on deposits and the interest charged to the subsidiary. The spread is to cover the treasury’s own operating costs. This approach does not take financial risk into account and is therefore often resisted by local tax authorities.
• Treasury as a bank. When other subsidiaries are permitted to borrow from third parties by themselves, the terms of such transactions could be used to benchmark internal transactions. Close attention has to be paid to the terms of the loan so that they do not differ from the internal transaction, e.g. if different group companies have different credit ratings and how loans are secured and subordinated.
• Treasury is unique. The concept here is to benchmark the overall profitability of the treasury rather than the individual transactions. This can be done by comparing the treasury’s net lending margin, i.e. the cents made per lent euro, with a similar bank.
65

Chapter 5 – Theoretical frame of reference
5.3 Project risk and risk management Whereas risk in a financial meaning has a rather clear definition, scholars within project risk management argue what constitutes the term risk. Gustafsson, et al. (2007) presents a number of different standpoints on how to interpret the terms risk and uncertainty. When economists talks about risk they refer to events subject to a known or a knowable probability distribution and when they talk about uncertainty they generally refer to a situation for which it is not possible to specify numerical probabilities. The dominating interpretation of risk and uncertainty in project management would be the definition provided in the Guide to the Project Management Book of Knowledge (PMBOK), which states that:
Risk is an uncertain event or set of circumstances that, should it occur, will have an effect on the achievement of the project’s objective. (PMI, 2000 cited in Chapman & Ward, 2004, p.620)
This definition means that uncertain events that provide a positive effect also should be considered a risk. In practice one usually talks about an uncertain event with a negative outcome as a risk and an uncertain event with positive outcomes as an opportunity (Heerkens, 2001). Further mentioning of project risk should be interpreted according to the latter of the definitions.
The traditional project risk management consists of a process with variable number of steps depending on what author you consult. The most extensive process found during this study is the one presented by Carr and Tah (2001), which consists of nine steps. This is also the most general description of the risk management process and all other descriptions could be viewed as variations of this one. In it Carr and Tah (2001) underline the importance of not only focusing on quantitative risk analysis, but to also focus on structuring the analysis in order to capture the underlying structure, dependencies, links and lessons learned from earlier projects.
The risk management process presented below is the one described by Heerkens (2001) and Cappels (2003), but considerations from the more holistic process that Carr and Tah (2001) describe are included. The process can be summarized into these three steps:
1. Risk identification
2. Risk quantification and analysis of which threats are of greatest concern
3. Risk response control
which are described in detail below.
5.3.1 Risk identification The identification phase is the first phase and should be started before bidding on a project. The phase does not end with the bidding though, it should continue through the whole upstart phase. The identification phase aims to consolidate information about the project that is at hand, to plan the operational risk management process and to understand where risk originates from and how it could be handled. (Chapman, 1997) This can be done by, for example, reviewing the task list of the project, brainstorming, consulting experts and reviewing lessons from other projects. (Cappels, 2003) Activities supporting this could include having teambuilding exercises and reviewing all project documentation. (Heerkens, 2001)
Carr and Tah (2001) as well as Chapman (1997) stress the importance of breaking down risks to a structure in order to capture interdependencies and links. Carr and Tah (2001) present a hierarchical risk breakdown structure, see the figure below.
66
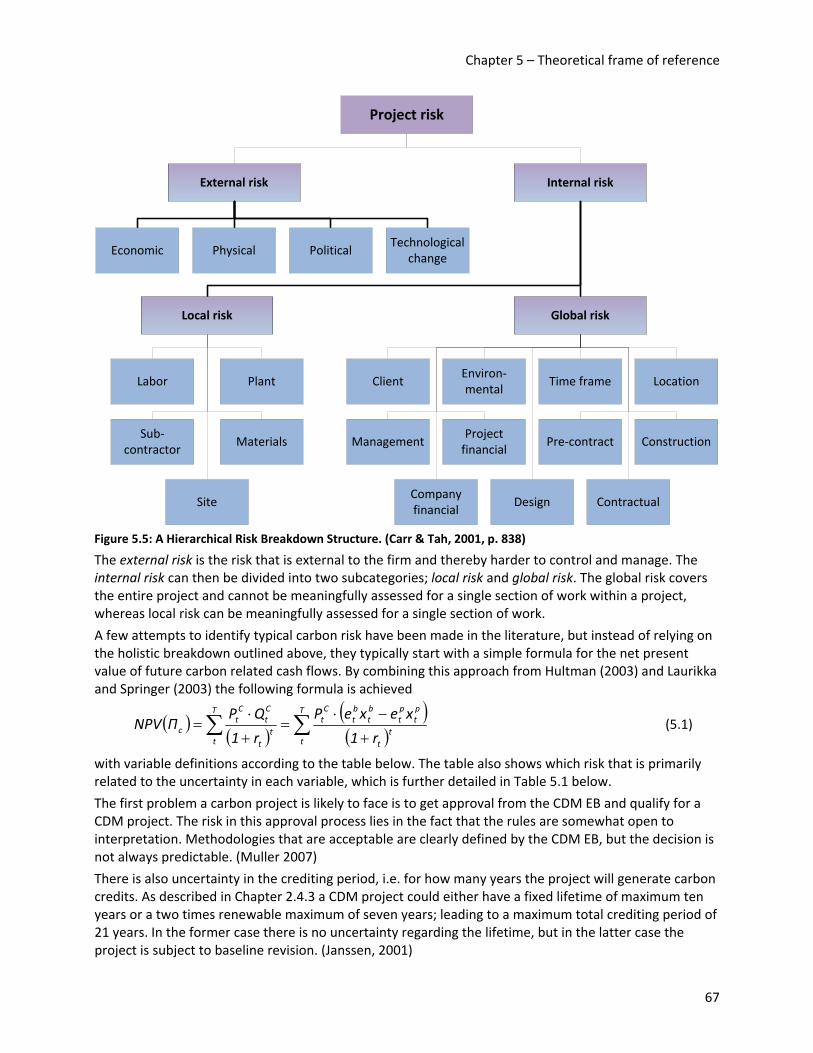
Chapter 5 – Theoretical frame of reference
Project risk
External risk Internal risk
Labor
Sub‐contractor
Plant
Materials
Site
ClientEnviron‐mental
Time frame Location
ManagementProject financial
Pre‐contract Construction
Company financial
Design Contractual
Economic Physical PoliticalTechnological
change
Local risk Global risk
Figure 5.5: A Hierarchical Risk Breakdown Structure. (Carr & Tah, 2001, p. 838)
The external risk is the risk that is external to the firm and thereby harder to control and manage. The internal risk can then be divided into two subcategories; local risk and global risk. The global risk covers the entire project and cannot be meaningfully assessed for a single section of work within a project, whereas local risk can be meaningfully assessed for a single section of work.
A few attempts to identify typical carbon risk have been made in the literature, but instead of relying on the holistic breakdown outlined above, they typically start with a simple formula for the net present value of future carbon related cash flows. By combining this approach from Hultman (2003) and Laurikka and Springer (2003) the following formula is achieved
( )( )
( )( )∑∑+
−⋅=
+
⋅=
T
tt
t
pt
pt
bt
bt
Ct
T
tt
t
Ct
Ct
cr1
xexeP
r1
QPΠNPV (5.1)
with variable definitions according to the table below. The table also shows which risk that is primarily related to the uncertainty in each variable, which is further detailed in Table 5.1 below.
The first problem a carbon project is likely to face is to get approval from the CDM EB and qualify for a CDM project. The risk in this approval process lies in the fact that the rules are somewhat open to interpretation. Methodologies that are acceptable are clearly defined by the CDM EB, but the decision is not always predictable. (Muller 2007)
There is also uncertainty in the crediting period, i.e. for how many years the project will generate carbon credits. As described in Chapter 2.4.3 a CDM project could either have a fixed lifetime of maximum ten years or a two times renewable maximum of seven years; leading to a maximum total crediting period of 21 years. In the former case there is no uncertainty regarding the lifetime, but in the latter case the project is subject to baseline revision. (Janssen, 2001)
67

Chapter 5 – Theoretical frame of reference
Variable Description Related risk
cΠ Carbon project profit in time Not applicable.
T Time during which CERs are generated Crediting lifetime risk.
CtP Price of CER at time t. Financial risk.
bte Baseline emission intensity at time t. Qualification risk.
btx Baseline activity level at time t. Qualification risk.
pte Project emission intensity at time t. Qualification and quantity risk.
ptx Project activity level at time t. Quantity risk.
tr Discount rate, i.e. cost of capital at time t. Not carbon specific.
Table 5.1: Variable definition and related risk. (Hultman, 2003; Laurikka & Springer, 2003)
The quantity of CERs issued each year is not deterministic, but depends on the difference of the baseline and the actual performance of the project. The baseline consists of two factors; baseline emission intensity, which is the emission intensity from e.g. a factory before CDM supported improvements, and the baseline activity level, which would, in the case of a factory, be the output before the CDM project. The actual performance of the project depends on the project emission intensity, which is the emission from the above mentioned factory after CDM improvements, and the project activity level, which is the actual output from that factory. The project emission intensity is largely dependent on technological factors, i.e. fuels used and efficiency of a plant, but could also be subject to economic factors. The project activity level is a combined effect of technological, environmental, economic and social factors. Laurikka and Springer (2003) attempts to identify the risk factors regarding the project activity level for different projects. A smaller sample with projects relevant for ABB’s operations is presented below in Table 5.2. (Laurikka & Springer, 2003)
Project type Technological and environmental factors
Economic factors Social factors
Wind/solar/hydropower plants
Local weather
Technical availability
None Local stakeholders
NGOs
On‐grid power plants with combustible fuels
Technical availability Fuel prices
Electricity and heat prices
Local stakeholders
NGOs
Off‐grid heat and power plants with combustible fuels
Technical availability Client demand Local stakeholders
NGOs
Energy efficiency projects Technical availability Fuel price
Energy price
Energy use
Energy users’ behavior
Table 5.2: Risk factors regarding the project activity level. (Laurikka & Springer, 2003)
The wind/solar/hydropower plants depends more on weather conditions and technical availability than on economic factors due to a low variable costs compare to the initial investment. Wind and hydropower
68
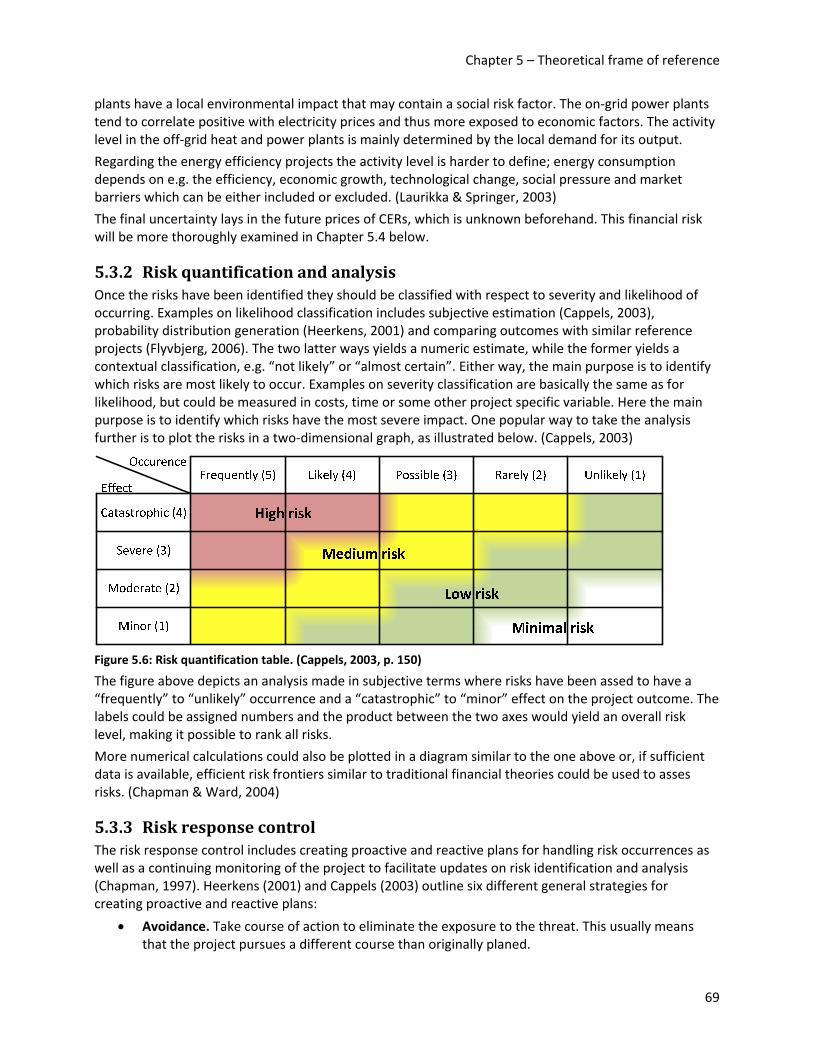
Chapter 5 – Theoretical frame of reference
plants have a local environmental impact that may contain a social risk factor. The on‐grid power plants tend to correlate positive with electricity prices and thus more exposed to economic factors. The activity level in the off‐grid heat and power plants is mainly determined by the local demand for its output.
Regarding the energy efficiency projects the activity level is harder to define; energy consumption depends on e.g. the efficiency, economic growth, technological change, social pressure and market barriers which can be either included or excluded. (Laurikka & Springer, 2003)
The final uncertainty lays in the future prices of CERs, which is unknown beforehand. This financial risk will be more thoroughly examined in Chapter 5.4 below.
5.3.2 Risk quantification and analysis Once the risks have been identified they should be classified with respect to severity and likelihood of occurring. Examples on likelihood classification includes subjective estimation (Cappels, 2003), probability distribution generation (Heerkens, 2001) and comparing outcomes with similar reference projects (Flyvbjerg, 2006). The two latter ways yields a numeric estimate, while the former yields a contextual classification, e.g. “not likely” or “almost certain”. Either way, the main purpose is to identify which risks are most likely to occur. Examples on severity classification are basically the same as for likelihood, but could be measured in costs, time or some other project specific variable. Here the main purpose is to identify which risks have the most severe impact. One popular way to take the analysis further is to plot the risks in a two‐dimensional graph, as illustrated below. (Cappels, 2003)
Figure 5.6: Risk quantification table. (Cappels, 2003, p. 150)
The figure above depicts an analysis made in subjective terms where risks have been assed to have a “frequently” to “unlikely” occurrence and a “catastrophic” to “minor” effect on the project outcome. The labels could be assigned numbers and the product between the two axes would yield an overall risk level, making it possible to rank all risks.
More numerical calculations could also be plotted in a diagram similar to the one above or, if sufficient data is available, efficient risk frontiers similar to traditional financial theories could be used to asses risks. (Chapman & Ward, 2004)
5.3.3 Risk response control The risk response control includes creating proactive and reactive plans for handling risk occurrences as well as a continuing monitoring of the project to facilitate updates on risk identification and analysis (Chapman, 1997). Heerkens (2001) and Cappels (2003) outline six different general strategies for creating proactive and reactive plans:
• Avoidance. Take course of action to eliminate the exposure to the threat. This usually means that the project pursues a different course than originally planed.
69

Chapter 5 – Theoretical frame of reference
• Transfer. The risk could be transferred to a third party via for example insurances. This option has a lot of similarities to how financial risk can be transferred via derivates that form a kind of insurance, see Chapter 5.4 below.
• Assumption. This means that the project participants are aware of the risk, but have chosen not to take any actions against it. This is usually a good measurement to employ when dealing with risks that are of low importance or that are more costly to prevent than the consequences of the risk.
• Prevention. Take actions that reduce the probability of occurrence. This is usually the first response to a high threat risk and begins by identifying the root cause of the threat. Once determined this can help in identifying preventive measures that could reduce the likelihood of occurrence.
• Mitigation of Impact. Take actions that reduce the negative effects of the threat. For example if a project is dependent on an outside vendor making its delivery dates, the contract with the vendor could be modified so that it includes penalty charges if the deadline is missed. It should be noted that every mitigation effort may be viewed as a waste of time and money if the potential problem never occurs.
• Contingency planning. Contingency plans are specific actions that are to be taken when a problem occurs. They are intended to deal with problems when they occur, but should have been developed before any occurrence in order to ensure a swift and effective response.
5.4 Financial risk and risk management In financial terms risk can be defined as the volatility of unexpected outcomes, generally regarding the value on an asset or a liability (Jorion, 2001). This definition comes from the fact that there always is a trade‐off between risk and expected return when money is invested. The word expected is to be interpreted as statisticians interprets it, i.e. a weighted average of possible returns where the weight applied to a particular return equals the probability of that return occurring. As the trade‐off is between this statistic measure of return and risk, risk is usually measured with another statistic measure, namely the volatility or the variance of the returns. (Hull, 2007)
The risk and return trade‐off is usually analyzed by investors according to the portfolio theory of Markowitz (1952) and the Capital Asset Pricing Model of Sharpe (1962). The theories state that investors should choose investments representing their expected return and systematic risk combination according to each investor’s own risk profile. The systematic risk is the risk every firm faces, the risk that the market or economy changes. The non‐systematic or unique risk is the risks an individual company faces. The theories declare that as long as an investor has a sufficient number of low correlated stocks in his or hers portfolio this unique risk will be distributed and fluctuations will cancel each other out, which is also known as diversification. Further, companies should only evaluate new projects based on the risk/return profile as new projects can be viewed as yet another addition to its owner’s portfolio.
In practice companies are concerned about nonsystematic risk as well. For example, most companies have insurances on their property although the risk of a fire could be reduced through diversification. This is because the survival of the company and stable earnings are important. Most investors are concerned about the overall risk of a company; they look for companies that do limit not only the systematic risk but also the unique risk. This suggests that investors behave suboptimal, but is usually explained with the bankruptcy costs argument.
The bankruptcy process in itself leads to what is known as bankruptcy costs. In a perfect world a bankruptcy would be a fast affair where the company’s assets are sold at their fair market value and the income distributed to the stakeholders. In reality a bankruptcy announcement will lead to customers and
70
Chapter 5 – Theoretical frame of reference
suppliers being less inclined to do business with the company, large fees are often paid to accountants and lawyers, assets has to be sold quickly at prices lower than their market value. These costs destroy the value of the company and therefore the survival of the company and its managing of the risks it undertakes are important for investors. (Hull, 2007)
Financial risk can be classified into the broad categories of market risk, credit risk, liquidity risk and operational risk, which are described below. (Jorion, 2001)
Market risk Market risk arises from the movement in the level of volatility of market prices of assets, e.g. interest rates, exchange rates or commodity prices (Hull, 2007). This risk can further be classified into directional and non‐directional risk, where directional risk involves exposures to the direction of the movement in the prices. Non‐directional risks involve risks in exposures to nonlinear instruments, hedged positions or to volatilities. (Jorion, 2001)
Carbon credits are subject to the same market risk as other financial instruments. (Laurikka & Spring, 2003) Determinants of the carbon credit prices could be separated in three general factors; policy decisions, supply and demand factors.
The supply of carbon credits is primarily determined by the number of allowances that are issued on the basis of the NAPs. If these plans are not stringent enough and too many allowances are issued the demand will be low and prices collapse. The supply of carbon credits is also dependent on the supply of CDM originating credits, i.e. the CERs. The CERs are generally cheaper than the EUAs, but their supply has been limited mainly due to the lead times that CDM projects require before CERs are issued. An increased supply of CDM carbon credits will ultimately put pressure on both CER and EUA prices.
The demand for carbon credits is determined by the projected emissions of individual installations covered by the EU ETS. In this context both fuel prices and weather factors are relevant. Nearly 60 % of emission allowances are held by companies in the power industry, which often have the option to reduce emissions by switching to lower emitting fuels. Depending on the dark spread, i.e. the spread between coal price and price of electricity, and the spark spread, i.e. the spread between gas price and price of electricity, companies are able to determine which plants and energy sources will be more profitable and to what extent they should be used. As the cost of emission allowances will be factored into these spreads, EUA and CER prices have a close correlation with coal, oil and gas prices.
Weather patterns are an equally strong factor driving demand by power companies, hot summers and cold winters will lead to an increase in energy requirements and emissions. At the same time dry spells or periods of less wind will reduce the amount of power that can be generated by hydroelectric sources or wind farms. (Anon., 2007)
According to Laurikka and Spring (2003) the price volatility would also tend to increase with banking restrictions and regulatory uncertainty and tend to decrease with broader sectoral coverage. However the penalty charges for non‐compliance with the carbon credit system will act as a price ceiling, currently set at 100 € per tCO2e.
Credit risk Credit risk originates from the fact that counterparties may be unwilling or unable to fulfill their contractual obligations. Its effect is measured by the cost of replacing cash flows if the other party defaults. This loss includes the exposure, i.e. the amount of risk, and the recovery, i.e. the proportion paid back to the lender, usually measured in “cents on the dollar”.
Credit risk also encompasses the risk that a party’s ability to perform its obligation, e.g. a change in its credit rating. A lowered rating for a party may increase the interest the market demands, thus creating a potential loss of value in a certificate issued by the party. (Jorion, 2001)
71
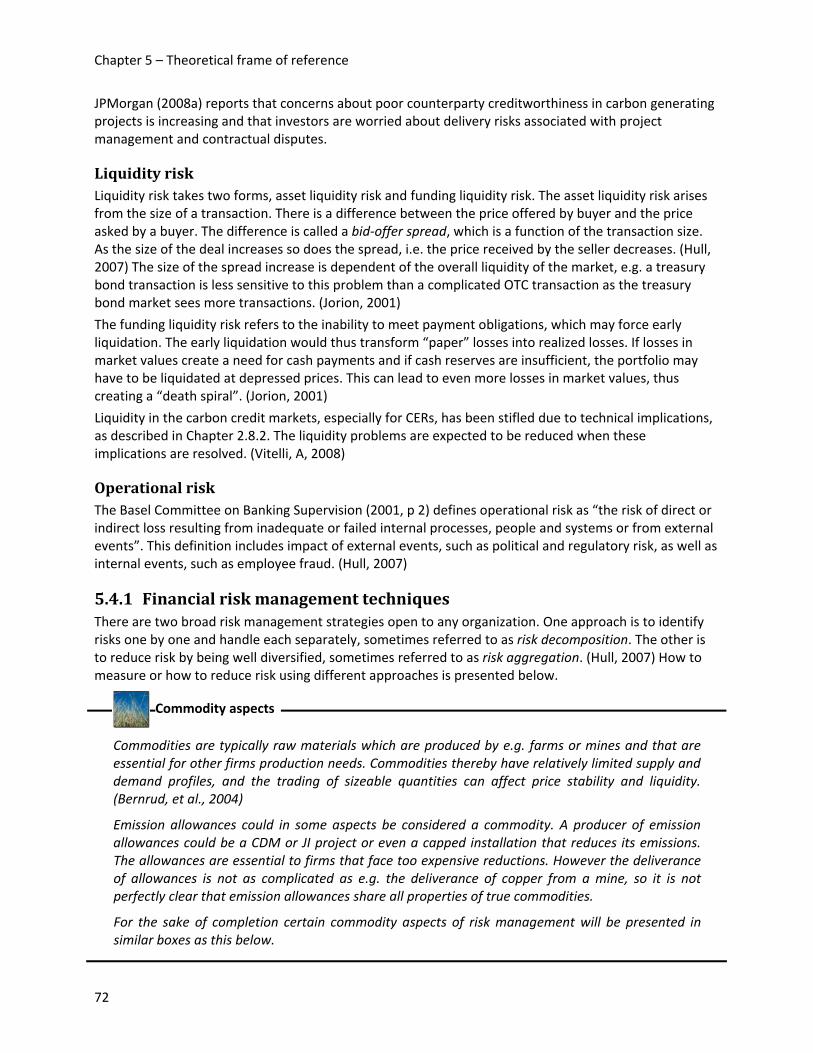
Chapter 5 – Theoretical frame of reference
JPMorgan (2008a) reports that concerns about poor counterparty creditworthiness in carbon generating projects is increasing and that investors are worried about delivery risks associated with project management and contractual disputes.
Liquidity risk Liquidity risk takes two forms, asset liquidity risk and funding liquidity risk. The asset liquidity risk arises from the size of a transaction. There is a difference between the price offered by buyer and the price asked by a buyer. The difference is called a bid‐offer spread, which is a function of the transaction size. As the size of the deal increases so does the spread, i.e. the price received by the seller decreases. (Hull, 2007) The size of the spread increase is dependent of the overall liquidity of the market, e.g. a treasury bond transaction is less sensitive to this problem than a complicated OTC transaction as the treasury bond market sees more transactions. (Jorion, 2001)
The funding liquidity risk refers to the inability to meet payment obligations, which may force early liquidation. The early liquidation would thus transform “paper” losses into realized losses. If losses in market values create a need for cash payments and if cash reserves are insufficient, the portfolio may have to be liquidated at depressed prices. This can lead to even more losses in market values, thus creating a “death spiral”. (Jorion, 2001)
Liquidity in the carbon credit markets, especially for CERs, has been stifled due to technical implications, as described in Chapter 2.8.2. The liquidity problems are expected to be reduced when these implications are resolved. (Vitelli, A, 2008)
Operational risk The Basel Committee on Banking Supervision (2001, p 2) defines operational risk as “the risk of direct or indirect loss resulting from inadequate or failed internal processes, people and systems or from external events”. This definition includes impact of external events, such as political and regulatory risk, as well as internal events, such as employee fraud. (Hull, 2007)
5.4.1 Financial risk management techniques There are two broad risk management strategies open to any organization. One approach is to identify risks one by one and handle each separately, sometimes referred to as risk decomposition. The other is to reduce risk by being well diversified, sometimes referred to as risk aggregation. (Hull, 2007) How to measure or how to reduce risk using different approaches is presented below.
Commodities are typically raw materials which are produced by e.g. farms or mines and that are essential for other firms production needs. Commodities thereby have relatively limited supply and demand profiles, and the trading of sizeable quantities can affect price stability and liquidity. (Bernrud, et al., 2004)
Emission allowances could in some aspects be considered a commodity. A producer of emission allowances could be a CDM or JI project or even a capped installation that reduces its emissions. The allowances are essential to firms that face too expensive reductions. However the deliverance of allowances is not as complicated as e.g. the deliverance of copper from a mine, so it is not perfectly clear that emission allowances share all properties of true commodities.
For the sake of completion certain commodity aspects of risk management will be presented in similar boxes as this below.
Commodity aspects
72

Chapter 5 – Theoretical frame of reference
The general idea behind risk aggregation is that the combined return of several assets is the average of their returns, but the combined volatility of several assets is usually smaller than the average volatility. The volatility is dependent on the assets correlation with each other and if the assets are not perfectly correlated the volatility will decrease as the number of assets increase. The unique risk of different assets is typically rather uncorrelated which make a portfolio of assets mostly subject to systematic risk due to diversification of unique risk.
Figure 5.7: Illustration of the VaR measure.
A popular measure of a firm’s aggregated exposure is the value‐at‐risk (VaR) measure. The VaR measure makes it possible to make a statement on the form “we are X percent certain that we will not loose more than V euro in the next N days”. The VaR measure corresponds to the loss level over N days that one are X percent certain will not be exceeded. It is illustrated in Figure 5.7, where the distribution of a hypothetical portfolio’s daily value change is displayed and the 5 % VaR over one day is the colored area. (Hull, 2007)
The idea behind risk decomposition is to decompose a portfolio and handle each risk separately. This can be done by risk transfer mechanisms, e.g. insurance or hedging. The general methods of risk decomposition are described in detail below.
Forward and futures contracts A forward contract is an agreement to buy an asset in the future for a certain price determined today. Forward contracts are traded in the over‐the‐counter (OTC) market. One of the parties assumes a long position, i.e. he or she agrees to buy the asset on a certain future date at the specified price. The other part assumes a short position, in which he or she agrees to sell the asset on the same date at the same price. (Hull, 2007)
Future contracts are in principle the same as forward contracts. The difference is that future contracts are exchange traded and thus standardized. The exchange specifies the exact amount of a certain asset one contract will deliver, where and at what time the asset will be delivered. Future contracts are settled daily which means that at the end of the day the loss or gain, depending on the price movement of the underlying, will be immediately realized. (Doherty, 2000)
The figure to the right depicts the payoff for an investor having a long and a short position respectively in a forward or futures contract. The payoff is dependent on the spot price at delivery, ST, and the delivery price, K. (Hull, 2007)
Figure 5.8: Payoffs from forward and futures contract, dependent on delivery price, K, and spot price at time of delivery, ST.
Forward and futures contracts can be used to lock in the price at which an asset will be sold or bought at a certain time in the future.
73

Chapter 5 – Theoretical frame of reference
When a futures or a forward has a commodity as underlying the cost of carry becomes important. Consider for example a producer needing oil in three months. There are two strategies to follow, either he buys the oil today and stores it for three months or he contracts today to buy oil in three months. But if the oil is bought today it needs storage and the earlier payment means loosing a possible three month interest payment. This is the cost of carry and explains why futures prices generally are higher than spot prices.
The difference between futures prices and spot prices is called the basis. Changes in the basis are generally caused by changes in the cost of carry. When the basis is positive, i.e. the futures price is higher than the spot price, it is said that the market is in contango. When the reverse prevails it is said that the market is in backwardation. (Bernrud, et al., 2004)
Note: This applies for all futures and forwards, but the cost of carry is more palpable when regarding commodities.
Commodity aspects
Swaps A swap agreement is an agreement between two companies to exchange cash flows in the future. The calculation of the cash flows usually involves future values of interest rates, exchange rates or other market variables. The agreement specifies the date or dates when the cash flows are to be paid and the way in which they are to be calculated.
A forward contract could be viewed as a simple example of a swap, where cash is swapped for an asset and the amount of cash is decided today. But whereas a forward or future contract is equivalent to the exchange of cash flows on just one date, a swap typically involves cash flow exchanges taking place on several future dates. The most common swap is an interest rate swap where a fixed rate of interest is exchanged for LIBOR over a number of years. (Hull, 2007)
The most common use of commodity swaps is to manage the value of energy resources. Energy dependent firms can enter into long‐term supply contracts that call for delivery of e.g. oil over a long period of time but that also allow prices to fluctuate with spot rates. These contracts guarantees supply of a needed commodity, but they leave the firm exposed to fluctuating prices. The firm can then enter a swap contract where they pay a fixed rate for the commodity and receive a floating rate based on the average spot rates at the time of delivery. The long term contract in combination with the swap agreement will secure delivery of a commodity over a long time to stable prices. (Bernrud, et al., 2004)
Commodity aspects
Options Options are contracts traded on both exchanges and OTC. There are two different types of options; a call option gives the buyer the right, but not the obligation, to buy the underlying asset at a certain time for a certain price. A put option gives the buyer the right, but not the obligation, to sell the underlying asset at a certain time for a certain price. The certain price is known as the strike price and the certain date is known as the exercise date. An option can also be of European type, which means that the option only
74
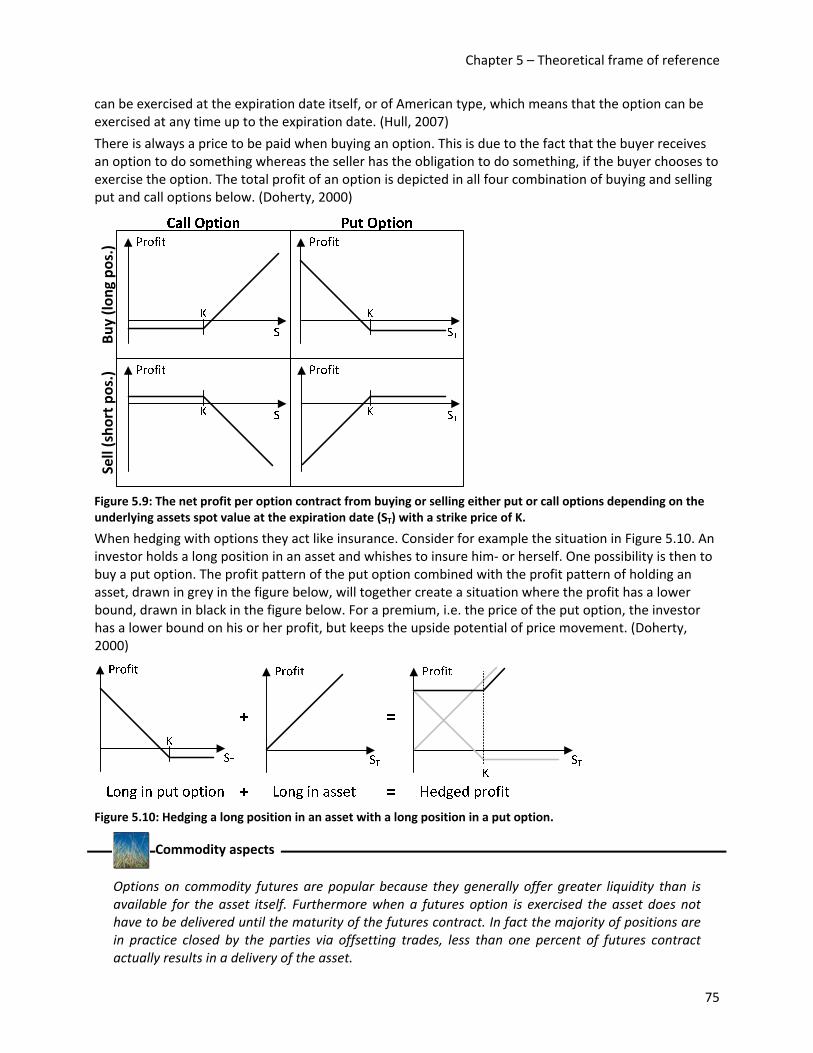
Chapter 5 – Theoretical frame of reference
can be exercised at the expiration date itself, or of American type, which means that the option can be exercised at any time up to the expiration date. (Hull, 2007)
There is always a price to be paid when buying an option. This is due to the fact that the buyer receives an option to do something whereas the seller has the obligation to do something, if the buyer chooses to exercise the option. The total profit of an option is depicted in all four combination of buying and selling put and call options below. (Doherty, 2000)
Buy (lo
ng pos.)
Sell (sho
rt pos.)
Figure 5.9: The net profit per option contract from buying or selling either put or call options depending on the underlying assets spot value at the expiration date (ST) with a strike price of K.
When hedging with options they act like insurance. Consider for example the situation in Figure 5.10. An investor holds a long position in an asset and whishes to insure him‐ or herself. One possibility is then to buy a put option. The profit pattern of the put option combined with the profit pattern of holding an asset, drawn in grey in the figure below, will together create a situation where the profit has a lower bound, drawn in black in the figure below. For a premium, i.e. the price of the put option, the investor has a lower bound on his or her profit, but keeps the upside potential of price movement. (Doherty, 2000)
Figure 5.10: Hedging a long position in an asset with a long position in a put option.
Options on commodity futures are popular because they generally offer greater liquidity than is available for the asset itself. Furthermore when a futures option is exercised the asset does not have to be delivered until the maturity of the futures contract. In fact the majority of positions are in practice closed by the parties via offsetting trades, less than one percent of futures contract actually results in a delivery of the asset.
Commodity aspects
75

Chapter 5 – Theoretical frame of reference
A call option on a futures contract gives the buyer right to enter into a long futures position at the strike price set by the contract. If exercised the holder will receive the position in a contract at the then prevailing futures price plus a cash payment equal to the difference between that prevailing rate and the strike price of the options contract. (Bernrud, et al., 2004)
5.4.2 Financial risk management in practice This section describes how the techniques outlined above are used to manage different risk.
Market risk is typically controlled by limits on exposures to specific markets and on limits on the risk of a company’s aggregated exposure via e.g. a VaR measure. (Hull, 2007) This diversification approach appears to work well for carbon credits as well, Spring and Laurikka (2003) shows that a portfolio of projects with different project types within different geographical locations yields risk reduction. Even naive risk diversification, i.e. pooling projects in a portfolio without knowing their returns and covariance, will yield this effect. This view is also supported by Hultman (2006) that found that diversification, even within similar ecosystems and within similar latitudinal zones, have risk reduction benefits. This is also used in practice; according to JPMorgan (2008a) major compliance buyers have been focused on purchasing primary and secondary CERs and investing in Carbon Funds for portfolio diversification effects.
Credit risk is traditionally managed by ensuring that the credit portfolio is well diversified. The diversification reduces the non‐systematic risk of e.g. defaults, but it does not eliminate systematic risk, e.g. economic downturn. In the late 1990s a credit derivative market emerged allowing companies not only to aggregate the credit risk but also to decompose it using different derivatives, e.g. credit default swaps (CDS). (Hull, 2007) Also a company may demand collateral from its counterparty in order to ensure that the recovery rate is sufficient high. (Jorion, 2001)
Asset liquidity risk can be managed by setting limits on certain markets or products, by means of diversification and by ensuring that the VaR measure’s horizon is at least greater than an orderly liquidation period. Funding liquidity risk can be controlled by proper cash‐flow planning via e.g. limit on cash‐flow gaps or asset and liability management. (Jorion, 2001)
The best protection against operational risks consists of redundancies of systems, clear separation of responsibilities with strong internal controls, and regular contingency planning. (Hull, 2007)
It appears that the techniques applicable for commodities also are applicable for carbon credits, further strengthening the argument that carbon credits in fact are a commodity. It should be noted however that the cost of carry for a carbon credit is much smaller compared to a traditional commodity, but this does not affect the general techniques that can be used for risk management.
5.5 Analysis model The theories and models presented above is the foundation upon which the analysis of ABB’s involvement in the carbon credit market will be done. In order to tie the different aspects together and ensure an exhaustive analysis an analysis model is presented in the picture below. The formation of this model is also described in detail below.
76

Chapter 5 – Theoretical frame of reference
GTO Involvement
High LowCarbon credit
response
Project
Financial
Internal pricing
Risk iden
tification
Risk quantificatio
n
Risk handling
Everything outsourced
Everythingin‐house
Decentralizedorganization
Centralizedorganization
Shar
ing
of
expe
rtis
e
Figure 5.11: The analysis model.
The first part of the model, shown in Figure 5.12, handles issues regarding how the general response to a carbon credit involvement within ABB should be organized. This is not yet a GTO specific, but rather covers ABB as a whole and involves two trade‐offs.
Figure 5.12: The first part of the model.
The first trade‐off is whether the response should be coordinated from some kind of central unit or not. The two extremes are between a full centralization, where a department takes full and complete responsibility for every ABB involvement, and a full decentralization, where each business unit have to act on their own.
The second trade‐off regards how much of the processes should be kept in‐house with ABB and how much should be outsourced to third parties. On one hand ABB could keep every process, from CDM registration to credit trading, within itself and on the other hand ABB could act more as a mediator where customers can leverage from ABB’s network of third party providers.
Regardless of the chosen degree of centralization and outsourcing the expertise of the organization has to be shared in an efficient manner in order for ABB to reach organizational efficiency. Together these
77

Chapter 5 – Theoretical frame of reference
three aspects form an organizational outcome, which is the general response from ABB to the carbon credit markets. This outcome will then affect how GTO is to be involved, which is the focus of the second part of the model. The involvement could take on two extremes, or any mix there within. The first extreme is to allocate every responsibility and aspect of carbon credits to GTO, making it effectively a combined treasury and corporate carbon unit. The other extreme is to not allocate any responsibility to GTO.
Not only the organizational outcome affects the degree of GTO’s involvement, a number of practical issues may or may not be best allocated to GTO, depending on its current competence and goals. There will be risk aspects ranging from the identification to the handling or managing of risks, both within the actual project and the financial aspects of issued certificates. If GTO’s involvement should be on the high end there will also be an issue of how to internally set prices towards the subsidiaries.
Figure 5.13: The second part of the model.
Once the practical issues are analyzed, an understanding of how to best organize a response to the carbon credit market and which role GTO should play in this will emerge.
78

6 Analysis This chapter uses the analysis model presented in the previous chapter in order to analyze different aspects of ABB’s response in general and ABB GTO’s response in specific.
6.1 Organizational outcome The choice of the organizational structure to be used when developing a function handling the carbon credit related issues of ABB is a very important concern. A suitable organization has to be constructed and utilized in order to handle the issues in an effective way and sharing the developed expertise throughout the organization. ABB also has to make a decision on to what extent the handling of carbon credit related issues should be outsourced.
6.1.1 The centralization – decentralization tradeoff The future carbon credit involvement of ABB is much dependent on a clear organizational structure. This structure is, to large extent, revolving around the trade‐off between a centralized and a decentralized approach. By assuming the present situation of the carbon credit market and ABB’s involvement in this market and using the model described in Chapter 5.1 this trade‐off can be analyzed exhaustively.
The studies of ABB’s involvement in carbon credit issuance have shown that there are few organized initiatives taken. Todays direct involvement is rather based on scattered initiatives among the company business units, creating no clear expertise center. The GF‐SA has knowledge in the matter but is, as previously stated, focusing on indirect involvement through using the global warming issue as a sales argument and a way to gain positive publicity.
Due to the complexity of CER issuance the effort and expertise required to engage in carbon credit generation is quite substantial. As an example; the CDM registration phase is rather complex and participants need to know what rules and laws apply, what kind of prejudice decisions have been made on similar projects by the CDM EB and how accurate applications are written. To build this expertise is quite time consuming and should be centralized in order avoid reinventing the wheel and gather the company expertise.
Individual business units are examining whether their projects could be eligible for carbon credit generation by performing internal research and involving external parties such as carbon consultancies. The ones that have known about other initiatives have been informed via informal networks and contacts. This behavior highlights the fact that ABB as a company relies heavily on the use of such informal communications. In addition to consuming effort and money, the uncertainty about divisional decision‐making creates a risk. Some business which could have large involvement potential may lack internal initiatives and knowledge how to evaluate involvement potential and are thus missing out on opportunities. By introducing a centralized function which keeps the organization informed in the matter this uncertainty would decrease and thus encourage involvement of previously uninformed business units.
Centralization would also simplify the communication and coordination of new group carbon credit initiatives. The need for coordination is not only related to carbon credit generation supply initiatives but also for coordinating the carbon credits allocated to the ABB units which need to comply against the EU ETS, see Chapter 3.2. This has been done quite spontaneously and independently up to this point.
The application process for CDM or JI differs from country to country since the approval process is conducted partly locally. However, since the theoretical procedures are the same, the need for local adoption rather revolves around gaining a picture of the local energy market and building relationships with its players. There is also a local aspect on risk identification and management that could need local knowledge, even though the majority of the risk is located elsewhere, see Chapter 6.2.1. This speaks
79

Chapter 6 – Analysis
against using an entirely centralized unit, but rather leaving some responsibilities to the group company project managers.
Such an approach also avoids bottlenecks that could evolve if a centralized carbon credit department was to be overloaded since business units would go via this department. However, the Kyoto mechanism involvement is quite time‐demanding itself and seldom requires any considerably fast decisions. Since the involvement of ABB’s organization is in a development phase there is also no reason to believe that this department would be overloaded and thus create significant bottlenecks in any near future.
Since the handling of carbon credits only should be considered as an additional business opportunity for ABB, the probability of sub optimal profit pattern emergences is low. It is rather unlikely that the carbon credit involvement of one business unit would lead to worse involvement opportunities for other business units.
The arguments for a centralized and decentralized organizational approach and their importance in this case are illustrated below.
Figure 6.1: Organizational aspects, which importance is illustrated by the grey arrows.
In addition, during the interviews conducted a big interest in the matter of carbon credits has been noticed and few organizational entities know where to receive more information regarding this. Some of the people interviewed explicitly requested a central carbon help‐desk which could assist them in their work and enable them to stay more focused on their core tasks.
ABB Group Treasury involvement Today, the business units with compliance against the Kyoto protocol settle their compliance processes more or less individually. The level of competence required for an organization to settle their needs on the open market is not very high, but requirements on systems, processes, bank contacts and market knowledge could still be a tough barrier for an individual business unit to overcome. It would be more efficient to use the centralized unit that already holds this competence, the GTO, to settle the compliance needs of the business units. The need for a centralized GTO involvement further grows if a
80
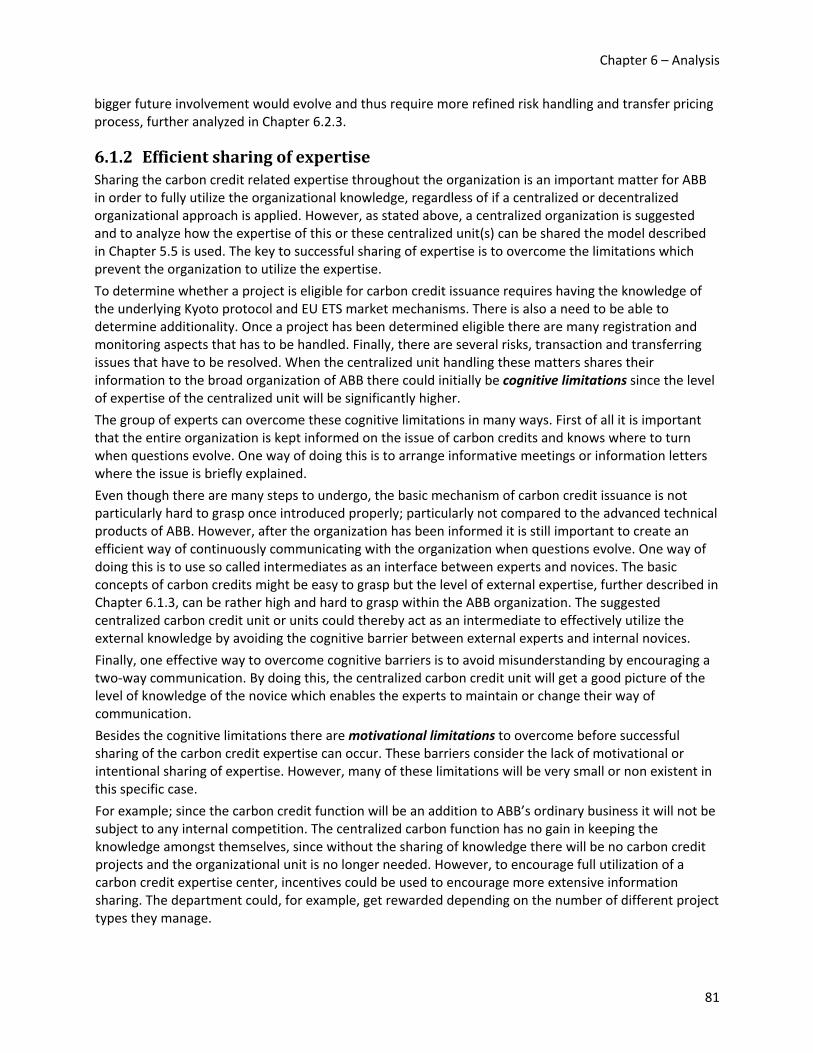
Chapter 6 – Analysis
bigger future involvement would evolve and thus require more refined risk handling and transfer pricing process, further analyzed in Chapter 6.2.3.
6.1.2 Efficient sharing of expertise Sharing the carbon credit related expertise throughout the organization is an important matter for ABB in order to fully utilize the organizational knowledge, regardless of if a centralized or decentralized organizational approach is applied. However, as stated above, a centralized organization is suggested and to analyze how the expertise of this or these centralized unit(s) can be shared the model described in Chapter 5.5 is used. The key to successful sharing of expertise is to overcome the limitations which prevent the organization to utilize the expertise.
To determine whether a project is eligible for carbon credit issuance requires having the knowledge of the underlying Kyoto protocol and EU ETS market mechanisms. There is also a need to be able to determine additionality. Once a project has been determined eligible there are many registration and monitoring aspects that has to be handled. Finally, there are several risks, transaction and transferring issues that have to be resolved. When the centralized unit handling these matters shares their information to the broad organization of ABB there could initially be cognitive limitations since the level of expertise of the centralized unit will be significantly higher.
The group of experts can overcome these cognitive limitations in many ways. First of all it is important that the entire organization is kept informed on the issue of carbon credits and knows where to turn when questions evolve. One way of doing this is to arrange informative meetings or information letters where the issue is briefly explained.
Even though there are many steps to undergo, the basic mechanism of carbon credit issuance is not particularly hard to grasp once introduced properly; particularly not compared to the advanced technical products of ABB. However, after the organization has been informed it is still important to create an efficient way of continuously communicating with the organization when questions evolve. One way of doing this is to use so called intermediates as an interface between experts and novices. The basic concepts of carbon credits might be easy to grasp but the level of external expertise, further described in Chapter 6.1.3, can be rather high and hard to grasp within the ABB organization. The suggested centralized carbon credit unit or units could thereby act as an intermediate to effectively utilize the external knowledge by avoiding the cognitive barrier between external experts and internal novices.
Finally, one effective way to overcome cognitive barriers is to avoid misunderstanding by encouraging a two‐way communication. By doing this, the centralized carbon credit unit will get a good picture of the level of knowledge of the novice which enables the experts to maintain or change their way of communication.
Besides the cognitive limitations there are motivational limitations to overcome before successful sharing of the carbon credit expertise can occur. These barriers consider the lack of motivational or intentional sharing of expertise. However, many of these limitations will be very small or non existent in this specific case.
For example; since the carbon credit function will be an addition to ABB’s ordinary business it will not be subject to any internal competition. The centralized carbon function has no gain in keeping the knowledge amongst themselves, since without the sharing of knowledge there will be no carbon credit projects and the organizational unit is no longer needed. However, to encourage full utilization of a carbon credit expertise center, incentives could be used to encourage more extensive information sharing. The department could, for example, get rewarded depending on the number of different project types they manage.
81
Chapter 6 – Analysis
By establishing common goals, both within the business units and the carbon credit center, the communication and sharing of expertise can be encouraged further. These goals could be to examine whether an annual number of projects would qualify for carbon credit issuance or not.
Even though the carbon credit expertise is not particularly well organized, there is already quite some knowledge present within the organization of ABB. People with individual commitments or clear professional connections to the carbon credit issue have initiated research in the matter and some of these individual have been in contact through informal, so called, communities of practice. To fully utilize the informal networks and prevent motivational limitations, which could occur if these networks are ignored, the organization should promote these networks by involving them in the new formal carbon credit network.
Finally, the general organizational measure of deemphasizing hierarchies is an effective way of promoting communication. However, the carbon credit expertise will not be a clear part of the ABB hierarchy but rather a supporting unit which acts outside the ordinary organization. The centralized expertise will have no formal superiority towards the business units. However, an informal hierarchy in carbon specific matters could evolve and there is therefore important to encourage a humble attitude towards the business units. The limitations and their importance are illustrated below.
Figure 6.2: Expertise sharing limitations.
ABB Group Treasury involvement The involvement of the current treasury functions are of a pure financial characteristic. Divisions will need assistance in examining carbon credit issuance possibilities and regarding project registration and follow‐up. Since the expertise of the GTO is of a pure financial characteristic it is not needed to be communicated to the organization in general. The business units have no interest in how risk is handled or how internal transfers of carbon credits are made, they will just contact the treasury and get their needs fulfilled. This financial expertise is very important to create but the issue of expertise sharing will not be significantly important.
82
Chapter 6 – Analysis
Depending on how the treasury is integrated in the suggested carbon credit organizational unit the sharing of expertise can be an issue within this department. If the carbon credit handling would be entirely handled by the treasury through expansion of its competence it would be no issue. However, if one centralized carbon credit division was to hand all financial matters over to the treasury the internal sharing of expertise could become more important.
6.1.3 Outsourcing versus Inhouse The expertise of a carbon credit department can either be gathered internally, through recruitment or through outsourcing to for example carbon consultancies. The model described in Chapter 5.1.3 is used to analyze the advantages and disadvantages on outsourcing and which carbon credit related functions that would be feasible to outsource.
Opportunities The previously described procedures regarding carbon credit project identification and registration demand quite some effort, are time‐consuming and require experience. ABB has no significant experience in this matter and it would therefore make sense to outsource parts of these processes to be able to focus on the core competence. However, it is not obvious that the issue of carbon credits should not be a part of ABB’s core competence. ABB is a company which focuses on making energy efficient solutions to reduce the energy demand of the customer. This is directly connected to the issue of global warming and thereby also carbon credits. Creating expertise in this matter is closely bound to the issue of energy and could therefore generate credibility for ABB as a player on the global energy market.
Regardless of if ABB chooses to outsource or not the company will need time to create competence comparable to existing consultancies. To be able to leverage on external parties from the start is one of the reasons why ABB should outsource parts of the identification and registration process.
A big part of the risks, further analyzed in Chapter 6.2, depend on regulations and changes in the global carbon credit market. One way of reducing this risk is to stay well informed; something that ABB can do by utilizing the market knowledge of external parties.
Before ABB gets seriously involved in any pilot projects and thereby is able to determine the future potential of the market it makes more sense to outsource the project identification and registration processes to avoid creating excessive expertise and remain flexible. This has already been done on a small scale today, both in Switzerland and in Sweden, and will keep the organization flexible if ABB chooses not to engage further in the matter.
Risks However, there are many risks that come with the outsourcing which ABB should be aware of. First of all there are no guarantees that a carbon consultancy has the competence and experience that they claim to have. This would create a risk of consulting a firm that does not add any significant value.
The flexibility of outsourcing also comes at a price. The external consultancies are often charging significant fees which is why it is important that ABB creates some sort of organized internal initiative to be able to more specifically determine what should be outsourced and what should not. It is also important to continuously review the value that the consultancy adds. This is needed in order to phase them out if ABB sees a larger future involvement in the matter and the internal knowledge develops.
Last, but not least, ABB has to take into consideration the risk of development of poor business relations with the third party and the integration complications that would follow. It is therefore important to thoroughly evaluate the choice of business partner. A good place to start could be the already established contacts within the organization.
83
Chapter 6 – Analysis
Practical issues If ABB chooses to outsource carbon credit related functions it is important to make thorough evaluations in the choice of business partner. ABB need to find a partner that can provide only the needed expertise, expertise that is not already present within the organization. It is also important to identify the corporate match in order for the external party to be able to cooperate with the ABB organization. Finally, the strategic decision of outsourcing must be established among the involved managers in order for ABB to be able to embrace the external firm; which is very important to successfully utilize the external knowledge.
Once a proper partner is selected, clear cooperative intentions has to be communicated in order for ABB to build a long‐term relationship where expertise is exchanged and where ABB can increase the external leverage.
Today, many initiatives are being conducted within the business units where external consultancies are being used. These consultancies could be a good place to start looking for business partners since ABB already has a relationship and thus a picture of these firms. By coordinating the carbon credit approach of ABB, a more rigid relationship could be built with some of these partners rather than the current scattered cooperation. By doing this, costs could be lowered, expertise sharing could be more effective as the relationship improves and coordination would be more effective.
That concept of core competence does not only apply for ABB as a holding company but also on the group company level. If ABB chooses to focus on carbon credit handling this competence, regardless if held internally or acquired externally, should be handled by a designated unit with this core competence. The coordination of outsourcing relationships via a centralized function would put less pressure on business unit managers and enable them to focus on their core tasks.
However, there might be need for more business partners if ABB is not able to find all desired expertise within the borders of one firm. For example there might be a need for one consultancy handling project identification and registration and one bank handling risk management.
ABB Group Treasury involvement Regarding the financial aspects of handling already issued carbon credits the knowledge of the current treasury organization could be utilized since carbon credits can be considered as commodities with associated financial instruments. This would be closely related to the core competence of the treasury.
To reduce the financial risk, further described in Chapter 6.2.3, methods such as hedging using financial instruments with carbon credits as the underlying asset are available. One alternative to handle risk internally is to outsource it by transferring assets to external funds or transfer the risk management to external banks.
The degree of outsourcing, from a financial perspective, is therefore depending on the amount of risk that ABB is willing to take in the handling of carbon credits rather than a need for outsourcing. The technical competence needed to handle these instruments could be quickly developed internally at a low cost.
6.1.4 Internal pricing Today each ABB subsidiary with demand for EUAs try to net their needs with other subsidiaries that they know of, while other subsidiaries, unknown to some of those with EUA shortages, buys EUAs on the open market. A centralized unit could buy each subsidiary’s surplus of EUAs and pool them internally. The unit would then sell EUAs internally to the firm having a shortage and if the surplus is not enough it would buy the aggregated shortage by a one‐time transaction on the market. This would minimize the market transactions ABB as whole does on the carbon market, thus minimizing the transaction costs.
84

Chapter 6 – Analysis
No CER generation is taking place in ABB today, but the prospect for future CDM involvement looks bright. By letting the subsidiaries sell CERs to the centralized unit several effects are achieved:
• The subsidiary will have one clear point of communication where all pricing information is available.
• The subsidiary does not have to perform market operations, but rather sells the CERs internally and thus reducing overall transaction costs.
• The central unit can use CERs to fill firm’s need for compliance credits instead of buying EUAs.
• The risk management can be performed more efficient, due to diversification and economy of scale effects.
This need of an internal price is what the theories would describe as a functional necessity. There could also be a strategic aspect; by creating a transfer pricing system (TPS) subsidiaries could be encouraged to engage in CDM projects.
Regarding the issue of how to shape the TPS, theories stipulate that this depends on what kind of department GTO is; is it a service provider, a bank or something unique? As GTO is organized and managed today it mostly resembles an internal bank, which means that the TPS should aim to benchmark the internal transactions with external equivalents. In practice this would mean that GTO assesses the values of the credits using market standard techniques, but the exact process for doing so is outside the scope of this thesis.
6.2 Risk management This part will mainly analyze the risks in a CDM project and how they can be handled, but will also treat the same subjects with regard to the demand of credits within ABB.
6.2.1 Risk identification In order to grasp the most common and most important pitfalls regarding carbon issues, including both carbon generating projects and ABB’s own installations with emissions caps, this chapter attempts to identify the risks. By using the Hierarchal Risk Breakdown Structure an extensive view can be gained so that no significant risk is excluded.
External risk The external economic risk, i.e. the economic risk that is beyond the control of the firm, covers uncertainty in the quantity of carbon credits generated. The quantity of carbon credits is affected by the project activity level, for example how many hours a day a carbon‐generating factory is being used; something that e.g. an economic downturn could affect. Other economic factors that are relevant differ between different types of projects. For example an energy efficiency project is affected by fuel prices, representing the alternative cost of for example burning crude oil, energy prices, representing the tradeoff between efficiency degree and price and energy use. See Table 5.2 for a complete listing of economic factors affecting different types of projects.
The quantity risk is also inherent in the demand situation, where a firm cannot say definitively how many carbon credits they will need to hand in for compliance before the end of the year. Price uncertainty could be considered as an external risk, but since it is to some extent controllable by the firm, via e.g. futures and options, it is better classified as a global risk.
The physical risk is the risk inherent in such things as accidents and disasters. There may be a physical risk inherent in every carbon project, but since this is an attempt to identify carbon specific risks it will be ignored. There is no physical risk that gets added to a project when it starts generating CERs.
85

Chapter 6 – Analysis
The global political risk affects carbon credit projects in many ways. Since the whole carbon credit market is created by regulations, it is also sensitive to political changes. Uncertainties of the future of these regulations, both with respect to the development of EU ETS Phase III and to the vetoing of the allocation plans that for example Italy is threatening to use, may affect the overall demand for EUAs and CERs. Another factor that can affect the overall demand is financial crises. The current sub prime mortgage and interbank liquidity crisis did not last for long before some states announced that lowering GHG emissions was an inferior target compared to infrastructural projects and other measures to stimulate the falling economy.
The qualification of a project to be CDM eligible is also surrounded by political risk. The CDM EB requires that the host country have proper authorities in place, something that should not be taken as a certainty, especially when engaging in historically unstable countries combined with having an investment horizon of more than ten years. Furthermore the CDM registration process includes the approval of selected methodologies and measuring techniques. This approval partly follows explicit guidelines, but also has a prejudicing component that may change over time. This uncertainty could also affect the EB’s decisions regarding a possible baseline revision, which in the prolongation can shorten the lifetime of the CER streams.
Finally the risk in technological change covers CDM crediting lifetime risk and quantity risk, at least when the seven‐year‐and‐renewal scheme is used. When exercising the renewal option a new baseline has to be calculated. If, during the last seven years, new technology has been introduced that makes the current project old with regard to emission reduction efficiency the new baseline may be lowered substantially, even to the degree that no new CERs are generated.
Figure 6.3: The External Risks in Carbon Credit projects.
The identifications are summarized in Figure 6.3.
Global risk The client risk in CDM projects covers the risk in contractual disputes. In order to receive carbon credits from a customer, via e.g. project discount, a contract has to be signed by all parties. If any part does not fulfill its obligations, for example not handing over the amount of credits that was decided, it will give rise to legal processing costs. The uncertainty in whether the customer agrees to sign over CERs to ABB in the first place is something that can, in most cases be disregarded. If a customer needs a CDM classification for the project to be financially viable the CERs will reach ABB indirectly, via the regular price. If CDM classification is needed for another purpose ABB will still have the original profit from the project to rely on.
If the client would not fulfill its obligations due to financial distress or due to a credit rating downgrade this could also affect the number of delivered CERs. There is in other words also a credit risk coupled with the customer.
The environmental risk is probably not affecting carbon credit projects. As the risk intends to capture negative environmental affecting factors and the carbon credit project is per definition improving the environment this could be removed from the risk identification.
The timeframe is whether the project will be finished on time or not. This must be interpreted as whether the project installation is finished on time, not regarding the crediting lifetime once the installation is complete. This will affect the timing of when the carbon credits start ticking in, but it will not affect the amount of credits. Large delay may however require certain hedging strategies being
86
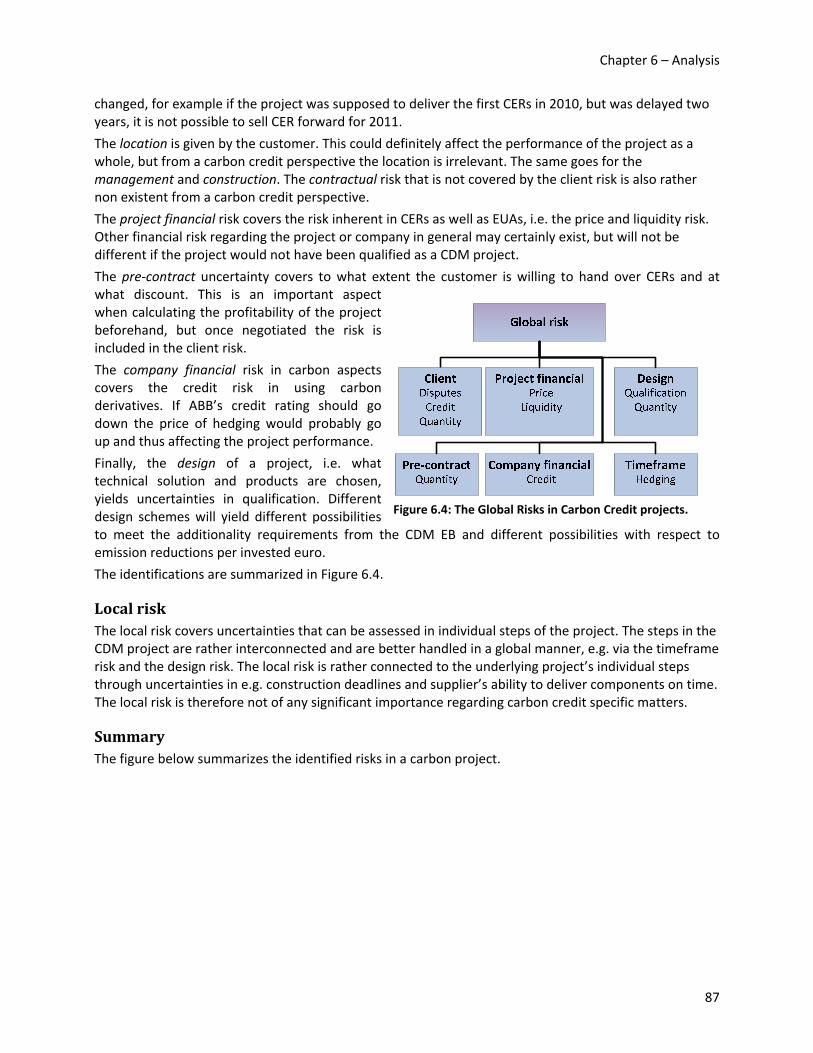
Chapter 6 – Analysis
changed, for example if the project was supposed to deliver the first CERs in 2010, but was delayed two years, it is not possible to sell CER forward for 2011.
The location is given by the customer. This could definitely affect the performance of the project as a whole, but from a carbon credit perspective the location is irrelevant. The same goes for the management and construction. The contractual risk that is not covered by the client risk is also rather non existent from a carbon credit perspective.
The project financial risk covers the risk inherent in CERs as well as EUAs, i.e. the price and liquidity risk. Other financial risk regarding the project or company in general may certainly exist, but will not be different if the project would not have been qualified as a CDM project.
The pre‐contract uncertainty covers to what extent the customer is willing to hand over CERs and at what discount. This is an important aspect when calculating the profitability of the project beforehand, but once negotiated the risk is included in the client risk.
The company financial risk in carbon aspects covers the credit risk in using carbon derivatives. If ABB’s credit rating should go down the price of hedging would probably go up and thus affecting the project performance.
Finally, the design of a project, i.e. what technical solution and products are chosen, yields uncertainties in qualification. Different design schemes will yield different possibilities to meet the additionality requirements from the CDM EB and different possibilities with respect to emission reductions per invested euro.
Figure 6.4: The Global Risks in Carbon Credit projects.
The identifications are summarized in Figure 6.4.
Local risk The local risk covers uncertainties that can be assessed in individual steps of the project. The steps in the CDM project are rather interconnected and are better handled in a global manner, e.g. via the timeframe risk and the design risk. The local risk is rather connected to the underlying project’s individual steps through uncertainties in e.g. construction deadlines and supplier’s ability to deliver components on time. The local risk is therefore not of any significant importance regarding carbon credit specific matters.
Summary The figure below summarizes the identified risks in a carbon project.
87

Chapter 6 – Analysis
Figure 6.5: Risks in Carbon Credit projects.
6.2.2 Risk quantification To asses which risks should be paid most attention to, each has to be quantified. A typical CDM project follows a number of phases in which the risk frequency of occurrence and impact on the project will vary depending on which phase the project is currently in. The picture below outlines the important steps a CDM project follows.
Figure 6.6: A typical CDM project timeline.
Each risk in Figure 6.5 will be discussed briefly below with respect to its occurrence frequency and its severity of effect on the project outcome. The occurrence and effect are meant to be interpreted as in the table below.
Occurrence
Frequently Occurs often and possibly many times during one project.
Likely Occurs quite often, possibly a few times during one project.
Possible Occurs once in a while, seldom more than one time during one project.
Rarely Occurs seldom, almost never more than one time during one project.
Unlikely Occurs very seldom and maximum one time per project.
88

Chapter 6 – Analysis
Effect
Catastrophic The incurred cost will erase all profit margins.
Severe The incurred cost will severely lower the profit margin.
Moderate The incurred cost will affect the profit margin marginally.
Minor No direct effect on the final profit margin.
Table 6.1: How to interpret the different categories of the risk quantification matrix.
Below follows the quantification of the nine risks identified:
1. Qualification Failing to qualify as a CDM project would mean that no financial benefits from emission reductions will be achieved. If the project has been designed so that the financial success of the whole project depends on being a CDM project, the entire project will fall. The frequency of occurrence depends on the project timeline. In the beginning of a project, before any contracts have been signed and products are being manufactured a PIN will be submitted to the CDM EB. This is a rather cheap way of finding out whether it is likely that the project is CDM eligible, and the frequency of occurrence would be rather high here, although with lower impact. If a positive feedback is given from the CDM EB the project will move forward and the qualification risk would occur less frequent, but with rising impact. This relationship will hold up until the actual registration decision, where the project either will be rejected or start generating credits and thus remove any uncertainty.
2. Crediting lifetime The crediting lifetime risk is something applicable only to projects where the renewal option is intended to be used. The risk lies in the fact that when a lifetime renewal is requested there will be a baseline revision that possibly lowers the baseline. A lowered baseline means that the project will generate fewer credits during the remaining lifetime, including the possibility that no CERs will be issued. The severity of impact on the project if this risk is realized is therefore rather high, ranging from catastrophic to severe. However the risk can only occur at a maximum two times per project. Furthermore if a large change in the baseline would occur, it would probably have been preceded by either a major political change or a major technological innovation. The frequency of occurrence for such events is not, in general, very high and is also something that could be predicted.
3. Overall demand The overall demand is mostly subject to a political risk and includes the possibility of major changes to the EU ETS or the post‐Kyoto guidance. For example when entering EU ETS Phase III, some member states of EU might succeed using veto rights. The impact on a CDM project if such an event should occur would be devastating. For example, if EU ETS Phase III disallows the use of newly generated CERs, see Chapter 0, every issuance of CERs after 2012 will be effectively worthless. Major changes to the EU ETS will occur rather seldom and be preceded with much public debate. It is therefore important to follow discussions and try to predict the outcome of such decisions, but it is nearly impossible for one single company to change the outcome.
4. Quantity The quantity risk depends on many factors. For example, the economic factor may affect to what extent a factory or power plant is used, thus affecting the reduced emissions. Common for all factors are that they affect how many CERs will actually be issued at the end of a year and the risk lies in the fact that this may deviate from the anticipated number. The deviation may then
89

Chapter 6 – Analysis
affect the project outcome, in both positive and negative ways, but it is unlikely that the deviation will be of any significant size. The effect therefore is classified as a moderate. It is rather likely that the exact amount of reduced emissions is not the same as the anticipated amount. The frequency of occurrence is therefore frequent to likely. The quantity needed in plants with emission caps is not deterministically known in advance, since this also depends on, amongst other, economic factors.
5. Disputes Contractual disputes may affect the number of CERs actually received by ABB, regardless of how many were issued. In general terms this risk has a low frequency of occurrence, but is of course highly depended on the client. The economic impact could be substantial if this risk materializes, due to the fact that no CERs may come into ABB’s hands. In addition, regardless of if ABB reaches an agreement or not, legal proceeding costs might arise.
6. Credit The credit risk covers two scenarios, one where the client receiving the primary CERs gets its credit rating downgraded and one where ABB gets a downgraded credit rating. The risk in the first scenario is that the client eventually defaults, and that the road to bankruptcy creates bankruptcy costs that can affect the generated carbon credit quantity negatively, thus creating a rather severe impact on the project. The occurrence of the first scenario is rather unlikely, although highly dependent on the client’s initial credit rating. The scenario will be classified as a risk occurring rarely with moderate impact on the project. The second scenario bears little impact on a CDM project, the only obvious impact would be a higher cost of hedging due to higher lending costs. The occurrence of this risk will be classified as unlikely with a low impact.
7. Price The price movements in carbon credits will affect how much a CER is worth once it is generated or how much an EUA costs when it is needed. The risk lies in the fact that it is impossible to know in advance what credits issued or needed in the future would cost. This risk should not be confused with the overall demand risk. The price risk consists of the uncertainty in prices over an individual project’s lifetime while the overall demand consists of general trends in the utilization of carbon credits over a longer time span. CER prices have been rather volatile, therefore making this risk occur frequently. The effect on the project could be substantial if the prices would drop significantly. The effect will be classified as severe.
8. Liquidity The asset liquidity in CERs affects the prices and the scale of the trades which are possible to execute. As described in Chapter 2.8.2 the CER market has suffered from a stifled liquidity due to trade technical issues, but the liquidity is expected to rise in late 2008. More and more derivates with CERs as underlying is likely to emerge, making it possible to trade in CER contracts without physical delivery, further increasing the liquidity. However, as of this writing, the liquidity issue is quite significant. The low liquidity may result in lower prices received, classified as a moderate impact. The occurrence depends on the size of the transaction relative to the traded amounts on the market, as of this writing the occurrence will be classified as likely. The liquidity in the EUA market has not suffered the same problems as the CER market, but is rather high as of this writing.
9. Hedging The hedging risk covers the scenario where the project has been approved as a CDM project, but delayed in construction. This could result in that if any price hedges have been executed
90
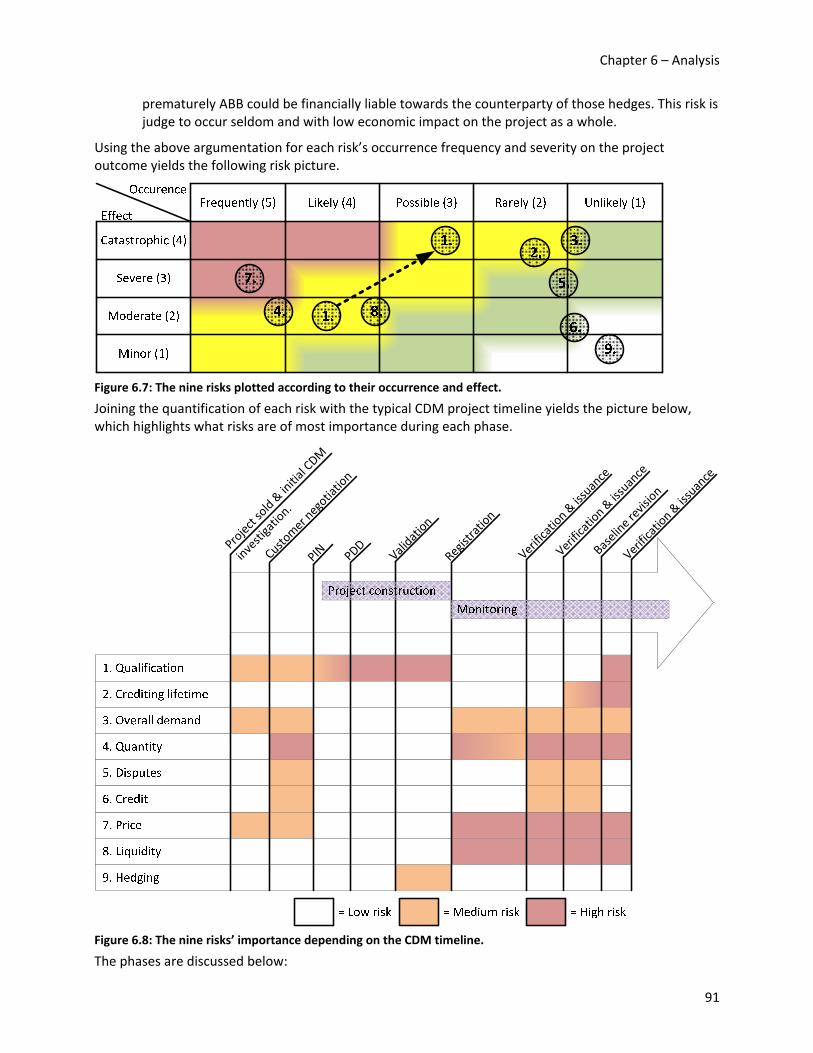
Chapter 6 – Analysis
prematurely ABB could be financially liable towards the counterparty of those hedges. This risk is judge to occur seldom and with low economic impact on the project as a whole.
Using the above argumentation for each risk’s occurrence frequency and severity on the project outcome yields the following risk picture.
Figure 6.7: The nine risks plotted according to their occurrence and effect.
Joining the quantification of each risk with the typical CDM project timeline yields the picture below, which highlights what risks are of most importance during each phase.
Project sold & initial CDM
investigation.
Customer negotiation
PIN PDD
Validation
Registration
Verification &
issuance
Verification &
issuance
Baseline revision
Verification &
issuance
Figure 6.8: The nine risks’ importance depending on the CDM timeline.
The phases are discussed below:
91

Chapter 6 – Analysis
• Initial phase In the initial phase the qualification, crediting lifetime and price risk are present. All these risks affect the prospect of future earnings and profits of the project. If the risks are too big, making the upside too small, the project will not proceed to the next step.
• Customer negotiation This part includes getting the customer involved in the project. It introduces the risk in quantity, disputes, credit and price. All these factors, combined with those in the initial phase, affect how the negotiation will be performed and how the terms of CER handover from the customer to ABB will look.
• PIN When the customer is on board a PIN is sent to the CDM EB. Some effort has already been invested in the project and the economic effects of an EB rejection starts to grow.
• PDD and validation Once the PDD has been written and sent to the CDM EB the economic stakes are even higher. This is the part in the project where a rejection would be most devastating.
• Project construction The project construction could give rise to uncertainties in how to hedge the initial issuance of CERs due to the uncertainty in whether the project deadlines will be held or not.
• Registration Once the registration is complete the qualification risk disappears. More financially related risks arise instead, the CER price and liquidity in the CER instruments becomes a real risk that needs to be handled. The price risk is closely linked to uncertainties in quantity and the overall demand may affect the project’s cash flows on a long term basis.
• Verification and issuance The risks from the step before remains and uncertainties in the client are added during this step. If contractual or financial problems afflict the client it could spill over to ABB.
• Baseline revisions During a baseline revision the crediting lifetime risk arises. The qualification risk could potentially arise here as well; if major political and technological changes have occurred since the last registration it could result in no CERs at all being issued from this point and forward.
6.2.3 Risk response control With significant risks identified and quantified the only question remaining is how to control the risk. As described in Chapter 5.3.3 there are six general strategies that can be followed to control project risk; avoidance, transfer, assumption, prevention, mitigation of impact and contingency planning. Regarding the financial risk, there are two general strategies, described in Chapter 5.4.1 ; risk aggregation and risk transfer. In order to sufficiently analyze each risk they will initially be classified as either financial or project risks. Of the nine risks presented above; credit, price and liquidity are classified as financial risks, with support from the risk descriptions in Chapter 5.4, and the other six are classified as non‐financial risks.
Financial risk response control The price risk in carbon credits can be controlled by the same techniques that are used for other commodities. This includes using derivatives to secure the price for a certain time period. For example, if a project depends on receiving 20 EUR per 1,000 CERs in order to preserve a certain margin this can be
92
Chapter 6 – Analysis
ensured by selling that amount of CERs forward for 20 EUR for each expected time of delivery. This will ensure that the profit margin is met, removing the downturn in price decreases, but at the same time eliminating any upturns that would have been received if the price increased. In order to secure the profit margin to a lower bound, this could be hedged using options instead. By buying put options with a strike price set at around 20 EUR with exercise dates close to the expected issuance of CERs, the margin has a lower bound. The latter strategy comes at a cost; the option premium.
In order to use forward or option hedging strategies the amount of issued CERs is of great importance, i.e. the quantity risk is related to the price risk. Consider that 5,000 tons of CERs was insured through selling a future, but only 4,000 tons were realized. This would put the hedger in a position where he or she cannot deliver the required CERs, which have to be solved by buying the extra 1,000 CERs on the open market at the then prevailing price level.
The same goes for the option strategy, but here the hedger does not have to exercise all the CER sell options. Instead he or she could exercise the option for the 4,000 CERs and the only incurred cost of this is the premium paid on the option for the remaining 1,000 CERs.
In either case, having good estimates of the expected quantity will make the hedging more financially efficient and forces the hedger to keep certain quantity margins. It can be noted that if the hedger has several CDM projects in a portfolio the aggregated quantity risk is less than if the portfolio only contains one project due to the diversification. This means that if the hedger holds several projects, the aggregated expected number of CERs can be hedged yielding a smaller margin for expected CER deviance.
The price risk for EUAs can be managed in similar ways. It can be noted however that firms have the possibility to meet the compliance requirements with CERs, thereby linking the quantity uncertainties of both CERs and EUAs within ABB. Consider that the expected delivery of CERs amount to 5,000 tons and a factory needs 5,000 more credits in order to comply with EU ETS. If the generated CERs are intended to be used by the factory to meet requirements the two quantity uncertainties are linked, if less than 5,000 CERs are generated or if more than 5,000 credits are needed for compliance there will be a shortage that has to be settled on the spot market. The inverse would result in selling credits on the spot market. This further emphasizes the need for good quantity forecasts when handling price risk.
The liquidity risk in CERs is hard to meet by traditional means, i.e. setting caps on exposures to certain instruments, since there are rather few carbon instruments to be traded. There is as of today a rather small liquidity in the carbon credit market, although it is rising and expected to rise more, posing problems when needing to sell large amounts of CERs. One solution is to sell off smaller amount of CERs over time. It should be noted however that selling too small amounts of CERs will impose transaction costs, loosing the economy of scale gained when selling an aggregated number of instruments.
The transaction sizes must be analyzed in relation to the current liquidity of the market, which means that the liquidity has to be monitored so that the right decision is made.
Finally, the credit risk is a risk quantified as a low risk, which means that there should be little effort paid to this risk. To have low impact of credit events it is good to hold a diversified portfolio of credits, which means that there should be several different clients. The risk could also be decomposed by buying Credit Default Swaps if one client should be near default, but it should suffice to have a diversified exposure to different clients.
Nonfinancial risk response control The qualification risk could be controlled by trying to reduce the probability of occurrence. To be able to do this a risk controller must have good intelligence on what decisions the CDM EB makes. Since the acceptance decisions is partly based on the formal guidelines regarding methodology choices and partly
93

Chapter 6 – Analysis
on a kind of prejudicial system where earlier decisions set the tone for future decisions both aspects must be included in the monitoring.
By having an up‐to‐date picture of what kinds of projects are currently being approved a better estimate of whether a certain project will be CDM classified can be made. Combining this knowledge with an internal database of ABB projects with CDM registration potential would be a good basis for estimating the probability of registration success. By making thorough estimations of the probability of success, projects that are probable to fail will be abandoned before they incur any major costs.
This knowledge will take some time to acquire and it makes sense, as described in Chapter 6.1.3 above, to outsource parts of this process to carbon consultancies, at least in the beginning. Depending on ABB’s eventual involvement this outsourced competence could later be phased back to ABB.
The crediting lifetime risk is best faced by developing a contingency plan to be used in event of a major baseline change due to the seldom occurrence. The probability of major changes can be better anticipated if a good monitoring is in place that tracks major political changes and technological inventions. Anticipating the risk will not help preventing it, but will only buy the risk controller some time to take action.
The contingency plan should be made for every individual project that is eligible for this risk. The extent of the plan should naturally vary depending on the value of the project, if there is a lot of money at stake the plan should be more thoroughly done. The content of the plan depends on the individual project’s background, but could include such things as PDD revisions to update methodological choices or upgrading the project to use state of the art technology.
The overall demand is an external risk that lies beyond any individual company’s control, but it could affect projects severely. The only feasible strategy is to assume that the risk will not materialize. But, as for the other risk, a good external monitoring could anticipate major changes in overall demand and should be used as input for all project assessments.
The quantity risk is best handled by mitigating the impact. As the quantity risk affects the practicalities of handling the price risk good monitoring needs to be in place in order to yield good forecasts of the actual number of credits needed for internal compliance or CERs that will be generated. These estimates need to be done by people having knowledge of the specific methodologies used in CDM projects as well as estimates on the economic situation as a whole. Once performed, the estimates should act as input to the hedger so that he or she can update the amount of hedged EUAs and CERs to reflect the anticipated actual issuance.
As outlined above, having a portfolio of different CDM projects will lower the aggregated impact of uncertain CER quantity.
For both the dispute risk and the hedging risk an assumption strategy should be chosen, due to the low impact and infrequent occurrence.
The risk controller needs good market monitoring for many of the risks and it should be noted that much of this monitoring could be outsourced to external parties. The person or persons responsible for monitoring the risks do not have to be closely linked to the people performing market monitoring, as long as they are able to share knowledge between themselves.
94

7 Conclusion After the present situation with regard to the carbon credit market and ABB’s exposure to this market was determined the organizational and risk‐related aspects were analyzed. The remaining question to answer is how ABB in general and the GTO in particular should get involved in this matter.
There are immediate responses to be taken from the GTO but the final response to the emerging carbon credit market from ABB is hard to determine today. The future depends much on the outcome of pilot projects that aim to demonstrate if ABB can gain CERs and to what extent and profit.
7.1 Immediate response Regardless of the final CDM market response, the GTO should create an immediate response to the EUA compliance needs of relevant ABB subsidiaries. The subsidiaries that are assigned carbon credits should transfer these to the GTO which then will be able to settle the annual compliance needs of the subsidiaries through a system of internal pricing and thereafter settle any net surplus or shortage of carbon credits on the market. It is quite natural to locate this function within the GTO since the financial competence of the department could be utilized.
Even though there are few carbon credits to be handled this work should be coordinated to avoid unnecessary market transactions and reinvention of the wheel since all subsidiaries individually would need to develop some knowledge in the matter. In addition, taking this response would be a quite simple way of preparing for a possible future involvement in the CDM market where the GTO would have a role.
7.1.1 Preparation for future CDM involvement There are two general strategies that can be followed regarding the preparation for a possible future involvement in the CDM market; an active or a passive approach. The active approach means that a centrally assigned person, or a small group of persons, actively follows the progress of the CDM pilot projects and possibly even pushes the business units to start and/or speed up these projects. This approach should be preceded by a strategic decision from the top management that carbon credit involvement is important and should be prioritized in order to be efficient. The passive approach means that no centralized response regarding CDM is taken before at least one pilot project is proven successful by the business units. With this reactive response a carbon credit organization could be built up if the outcome is positive.
Even though a centralized passive response means that no effort or risk is added to the one taken by the involved business units, an active response is preferable. First and foremost, the number of successful pilot projects probably becomes higher with an active response as coordination measures between the pilot projects can be achieved. The person or persons taking this active response should become the embryo of a future Group Carbon Operations (GCO) unit, a unit that should act as carbon support and competence center that aids those subsidiaries that are interested in engaging in carbon credit generating projects. The department would simplify the work of those business units already involved, such as MVD, and initiate the involvement of the business units that are interested but not yet involved, such as the HVDC or FACTS departments.
The personnel involvement needed for the active response is depending on ABB’s strategic involvement decision, but at this point not even a full time position would be required to coordinate the current carbon credit involvement. This should be handled by someone outside the GTO since monitoring the CDM market and assisting in CDM project identification and registration is not a part of the GTO financial core competence. The person or persons responsible for ABB’s carbon credit initiative are conveniently
95

Chapter 7 – Conclusion
one of those within ABB who already today have some knowledge in the matter. However, since the present internal competence regarding CDM involvement process is rather small, the GCO embryo would also be responsible for coordinating present and future outsourcing activities. For example, the today scattered cooperation with Swedish, Swiss and English carbon consultancies could be coordinated and rationalized. The internal and external expertise can then be shared and utilized among the pilot projects of the organization.
Since there would be no need for any large‐scale personnel involvement the additional cost for initiating a GCO embryo should not need to be particularly large. However, since an active approach could reveal new pilot project opportunities, costs as consultant fees could rise as a result of a bigger involvement. This should not be considered only negative since if ABB chooses to make an active approach it must be with the will to exhaustively expose ABB’s business opportunities in the matter.
Another advantage of an active response is that ABB will be able to respond faster when starting to support carbon generating projects on a large scale should the CDM pilot projects be successful. There would be less need for external competence and thus decreased outsourcing costs.
As has been pointed out many times in this study, there are many obstacles to overcome before ABB could profit from carbon credits but the opportunities are very appealing. There are also many people within the organization that are interested in the matter and spend time investigating it. By taking an active response, ABB could not only increase the chance of a positive outcome but could probably, once and for all, end the carbon credit involvement quicker if the outcome is negative. Even if an active response requires some effort and might generate no direct profit at all, it would still make sense in order to stop the scattered initiatives as soon as possible to avoid unnecessary efforts within the organization.
7.2 Future response Regardless of the immediate response the future response will follow the same principles, dependent on the outcome of the pilot projects. The difference between the previous active or passive response is what kind of organization is in place once this stage is reached.
The pilot project’s outcome could either be negative or positive. A negative outcome would mean that ABB sees no possibilities of getting involved in the CDM or JI markets within any business divisions. It could also mean that ABB sees possibilities but the profits or risks would be too unattractive to motivate any further involvement. A positive outcome would mean that pilot projects were accepted as CDM projects and that the registration principles could rather easily be generalized for many projects and that these projects were profitable. Depending on this outcome the response will look different, presented more thoroughly below.
7.2.1 Negative outcome With a negative outcome there is no reason to have any CDM registration competence within ABB. If the active immediate response was taken previously the embryo GCO should be closed down. ABB should phase out every attempt to engage directly in the CDM market and focus on using the Kyoto mechanisms as sales arguments. Today, the carbon reduction is used as a sales argument but the argumentation is more based on emission reduction than direct carbon credit opportunities; something that could be developed further to strengthen the sales arguments.
However the GTO should still keep the service of pooling EUAs with the purpose of assisting the firms having compliance requirements in order to not incur any unnecessary costs. In addition, there should be someone responsible for regularly following the development in the carbon credit market since radical political changes can occur and thus alter the possibilities for ABB to get involved. In case of any changes like this, a new strategic decision has to be taken in order for ABB’s GCO initiative to be resurrected.
96

Chapter 7 – Conclusion
7.2.2 Positive outcome If numerous pilot projects are approved and ABB sees significant opportunities in generation of carbon credit the organization should be developed to meet this opportunity.
Regarding CDM project identification and registration function, the GCO function should be developed further or created depending on if an active or passive approach was taken previously. This department’s major task would then be to coordinate the business units and external consultancies in order to push new CDM projects to the market.
Initially, most of the CDM identification and registration work should be conducted by consultancies which are coordinated through the GCO. This would enable ABB to leverage from their competence while remaining flexible and thus reducing risks. Depending on the extent of the positive outcome the degree of outsourcing should be altered. As more projects become registered, ABB will gain experience in the matter and the amount of outsourcing should be lowered which will decrease costs. The lost flexibility will not be of big importance since the positive outcome shows very clear involvement and profit opportunities for ABB. The degree of outsourcing is of course also depending on the future outlook of CDM involvement. If ABB sees big risks in future market changes or technological innovations there is no reason to drop the flexibility of outsourcing.
In addition, by creating a developed GCO unit ABB would gain much positive publicity and establish a position as a company which can provide professional assistance regarding emission allowance issuance and thus gaining new customers. Since ABB is a company focusing on energy efficient solutions and thus emission reduction, a carbon credit competence would be related to the company’s core competence.
GTO should, besides aiding the complying subsidiaries, also take a full scale initiative in the CER markets by helping subsidiaries hedging entire project’s CER streams, improving the transfer pricing system to aid the subsidiaries in pre‐project estimations of CER revenue and enabling complying subsidiaries to use CERs generated for compliance requirements. The cooperation between the GTO and the GCO should be very close and can be illustrated through Figure 7.1.
A summary of ABB’s and GTO’s response is depicted in Figure 7.2. The figure shows that before the pilot project’s outcome is known either an active or a passive response could be taken. The thesis argues for choosing the active response. Once the outcome is known it will have different implications whether it shows that CDM has an economic potential for ABB or not.
97
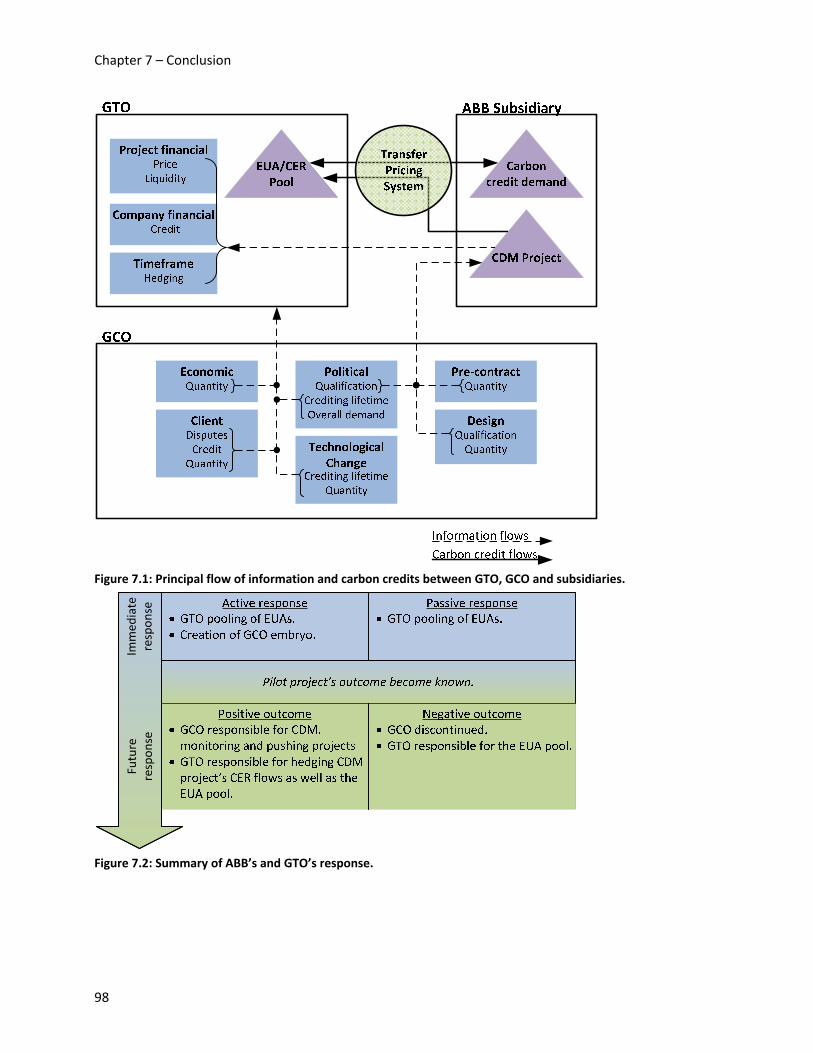
Chapter 7 – Conclusion
Figure 7.1: Principal flow of information and carbon credits between GTO, GCO and subsidiaries.
Immed
iate
respon
seFuture
respon
se
Figure 7.2: Summary of ABB’s and GTO’s response.
98
References ABB, 2007. The ABB Group Annual Report 2007. [online]. Available at http://search.abb.com/ library/Download.aspx?DocumentID=AROR2007EN&LanguageCode=en&DocumentPartId=&Action=Launch&IncludeExternalPublicLimited=True [Accessed 10 October 2008].
ABB, 2008. ABB homepage [online]. Available at http://www.abb.com [Accessed 3 October 2008].
Adnanes, A., 2008. E‐mail conversation with Alf‐Kare Adnanes at ABB Marine in Norway [Interview]. 22 October 2008.
Agcert, 2008. 2005‐2007; Phase 1 of The European Union Emission Trading Scheme (EU ETS). [online]. Available at http://www.agcert.com/eu_ets.aspx [Accessed 25 September 2008].
Anon, 2007. The price risk in carbon trading. [journal] Treasury today, November/December issue, pp.39‐42.
Aurell, E. & Persson, T., 2008. Räkna med Afrikas Energimarknad [Article] Dagens Industri ,11 October 2008 p.4.
Bach, T., 2008. Interviews with Thomas Bach at ABB Medium voltage drives [Interview]. ABB HQ, Zürich, 30 September; 9 October, 2008
Bach, T. & Wikström, P., 2006. Presentation to the management board of ATD/ATP [Management presentation]
Baker&McKenzie, 2008, CDM Rulebook. [online]. Available at http://cdmrulebook.org/PageId/1 072 [Accessed 25 September 2008].
Barnes, P.C., 2005. Outsourcing: A review of trends and some management issues. [journal]. Management Services, Winter issue, pp. 42‐44.
Basel Committee on Banking Supervision, 2001. Operational Risk. [online]. Bank of International Settlement. Available at http://www.bis.org/publ/bcbsca07.pdf [Accessed 30 September 2008].
Beckius, J., 2008. Interviews with Joakim Beckius at ABB Project and Trade Finance in Sweden [Interview] ABB, Västerås, 14 October 2008.
Beckius, J., Nordström, A., Elvhage L., 2008. Carbon Credits – a sales argument for ABB [Internal presentation]
Bernrud, E., Filbeck G. & Upton T., 2004. Derivatives & Risk Management. [book]. La Crosse (WI): Dearborn Trade, A Kaplan Professional Company
99
References
BlueNext, 2008. Statistics. [online]. Available at http://160.92.106.237/templates/genericTemplat e‐20227‐EN.html [Accessed 23 September 2008].
Brooke, M., 1984. Autonomy and Centralization in Multinational firms. [journal]. Int. Studies of Man. & Org., Volume XIV, pp.3‐22
Börrnert, T., 2008. BU Minerals Sales Training – Energy efficiency – Electric power generation out of waste heat. ABB [Internal presentation]
Carbon Finance, 2008. EUA issuance delay deals another blow to EU ETS. [online]. Available at http://www.carbon‐financeonline.com/index.cfm?section=lead&action=view&id=11081 [Accessed 30 September 2008].
Carr, V. & Tah, J.H.M., 2001. Towards a framework for project risk knowledge management in the construction supply chain. [journal]. Advances in Engineering Software, 32, pp.835‐56
Chapman, C., 1997. Project risk analysis and management – PRAM the generic process. [journal]. International Journal of Project Management, 15(5), pp.273‐81.
Chapman, C. & Ward, S., 2004. Why risk efficiency is a key aspect of best practice projects. [journal]. International Journal of Project Management, 22, pp.619‐32.
Cook, Jr. P.W., 1955. Decentralization and the Transfer‐Price Problem. [journal]. The Journal of Business, 28(2), pp.87‐94
Dannelly, W., 2008. Interviews with William M Dannelly at ABB Pulp & Paper in USA [Interview] 10 October 2008.
Doherty, N.A., 2000. Integrated Risk Management. [book]. S.l.: McGraw – Hill.
Eckermann, F., Hunt, A., Michaelowa, A. & Stroinzik, M., 2003, Transaction costs of the Kyoto Mechanisms. [online]. Available at http://www.hwwa.de/Forschung/Klimapolitik/docs/Archiv/Michaelowa_et_al_2003.pdf [Accessed 09 October 2008].
Economist, 2002. Neither lender nor borrower be. [journal]. Economist, 2002, 362(8266), p.54.
Environmental defense, 2007. CDM and the Post‐2012 Framework – Discussion Paper. [online]. Environmental defense. Available at http://www.edf.org/documents/6838_ED_Vienna_CDM%2 0Paper_8_22_07.pdf [Accessed 26 September 2008].
100
References
Europa, 2006, Questions & Answers on national allocation plans for 2008‐2012. [online]. Available at http://europa.eu/rapid/pressReleasesAction.do?reference=MEMO/06/2&format=H TML&aged=0&language=EN&guiLanguage=en. [Accessed 25 September 2008].
European Climate Exchange, 2008a. European Climate Exchange Monthly Report – August 2008. [online]. Available at http://www.europeanclimateexchange.com/uploads/documents/ECX MonthlyReport‐August2008.pdf [Accessed 23 September 2008].
European Climate Exchange, 2008b. European Climate Exchange Monthly Report – July 2008. [online]. Available at http://www.europeanclimateexchange.com/uploads/documents/ECXMonthl yReport‐July2008.pdf [Accessed 23 September 2008].
European Climate Exchange, 2008c. Products & Services. [online]. Available at http://www.europeanclimateexchange.com/default_flash.asp?page=http%3A//www.europeanclimateexchange.com/content.asp%3Fid%3D3%26sid%3DECX%2520Prods%26pid%3D370%26cid%3DContractSpec(O) [Accessed 23 September 2008].
European Climate Exchange, 2008d. What is CDM? [online]. Available at http://www.european climateexchange.com/default_flash.asp?page=http%3A//www.europeanclimateexchange.com/content.asp%3Fid%3D5%26sid%3D392%26pid%3D396%26cid%3DCDM [Accessed 22 September 2008].
European Commission, 2008. Emission Trading Scheme (EU ETS). [online]. Available at http://ec.europa.eu/environment/climat/emission/index_en.htm [Access at 24 September 2008].
European Commission, 2008b. National allocation plans: Second Phase. [online]. Available at http://ec.europa.eu/environment/climat/emission/2nd_phase_ep.htm [Access at 10 October 2008].
European Energy Exchange, 2008. Emission futures | Derivatives. [online]. Available at http://www.eex.com/en/Market%20Data/Trading%20Data/Emission%20 Rights/Emission%20Futures%20|%20Derivatives#EUA [Accessed 23 September 2008].
Financial Times, 2008. Europe in line for emissions reprieve. [journal]. Financial Times, 12 December 2008, p.1.
Flavell, R.B., 1977. Divisionalization and Transfer Pricing: A Review. [journal]. OMEAGE The International Journal of Management Science, 5(5), pp.543‐56
Freebairn, A. & Genus, B., 2008. Options on trial. [online]. Carbon Finance. Available at http://new.evomarkets.com/pdf_documents/Options%20on%20trial.pdf [Accessed 25 September 2008].
Green, G., 2001. Transfer pricing techniques for group treasury companies. [journal] International Tax Review, 12(6), pp.23‐26
101

References
Gummesson, E., 2006. Qualitative research in management: addressing complexity, context and persona. [journal]. Management Decision, 44(2), pp.167‐79.
Gustafsson M., Perminova, O. & Wikström, K., 2007. Defining uncertainty in projects – a new perspective. [journal]. International Journal of Project Management, 26, pp.73‐79.
Halvarsson, P., 2008. Interviews with Per Halvarsson at ABB FACTS in Sweden [interview]. 14 October 2008
Hasselknippe, H., Roine, K. & Tvinnereim E., 2008. Carbon 2008 – Post‐2012 is now. [online]. Point Carbon. Available at http://www.pointcarbon.com/polopoly_fs/1.912721!Carbon_2008_ dfgrt.pdf [Accessed 25 September 2008].
Henricsson C., 2008. Interviews with Curt Henricsson at ABB sustainability department. [interview]. 1 October 2008, 13 October 2008, 15 October 2008
Hilmer, J. & Quinn, J., 1995. Strategic outsourcing. [journal]. McKinsey Quarterly, 1, pp. 48‐70.
Hodes, G.S., 2007. Financial Aspects of CDM and Carbon Finance. [online]. Available at http://www.cd4cdm.org/sub‐Saharan%20Africa/Tanzania/Second%20National%20Workshop/ FinancialsCDMCarbonMarket_Hodes.pdf [Accessed 09 October 2008].
Hull, J.C., 2007. Risk Management and Financial Institutions. [book] New Jersey: Pearson.
Hultman, N.E., 2003. Carbon Financial Risk in the International Greenhouse Gas Market. [dissertation] Ph. D. Berkeley: University of California.
Hörte, S.Å., 1999. Hur kan man ge struktur år rapporter och uppsatser? [online] Luleå Teknikska Universitet, Luleå, Sweden. Available at http://ies.ltu.se/org/Rapporter/AR9824.pdf [Accessed 29 October 2008]
IPCC, 2007. Summary for Policymakers [online]. Available at http://ipcc‐wg1.ucar.edu/wg1/ Report/AR4WG1_Print_SPM.pdf [Accessed 29 September 2008].
Jang, Y. & Lee, J., 1998. Factors influencing the success of management consulting projects. [journal]. International Journal of Project Management, 16(2), pp. 67‐72.
Janssen, J., 2000. Implementing the Kyoto Mechanisms: Potential Contributions by Banks and Insurance Companies. [journal] Geneva Papers on Risk & Insurance – Issues & Practice, 25(4), pp.602‐18.
Jegebäck, H., 2008. Email conversation with Hans Jegebäck at ABB BU Metals [Email]. 31 October, 2008
102

References
Jenni, R., 2008. Email conversation with Rene Jenni at ABB Railway Customer Segment [Email]. 17 October, 2008
Johansson, T., 2008. Phone interviews and email conversations with Tommy G Johansson at ABB Fastigheter [Interview]. ABB HQ, Zürich, 10 October 2008.
Jorion, P., 2001. Value at Risk: The Benchmark for Controlling Market Risk. [book] 2nd ed. S.l.: McGraw – Hill.
JPMorgan, 2008a. JPMorgan Environmental Market Capabilities. [management presentation]. ABB.
JPMorgan, 2008b, Global Environmental Markets. [newsletter]
Karlsson, P., 2008. Interview with Peter Karlsson at ABB Substation (Wind) in Sweden [interview]. 14 October 2008
King, W., 2008. Editorial – Knowledge Management and Organizational Learning. [journal] Omega 36 (2008), pp.167‐162.
Laurikka, H. & Springer, U., 2003. Risk and return of project‐based climate change mitigation: a portfolio approach. [journal] Global Environmental Change, 13(3), pp. 207‐17.
Lekvall, P. & Wahlbin, C., 2001. Information för marknadsföringsbeslut. [book]. 4th ed. Göteborg: IHM Publishing.
Macharey, U., Schnettler, A. & Smolka, T., 2007. Life Cycle Assessment of Ultra High Voltage system layout and operation compared to 420 kV AC power systems. [presentation]. RWTH Aachen University.
Madsen, C., 2008. Email conversation with Claus Madsen at ABB wind in Denmark [Email]. 21 October, 2008
McAulay, L. & Tomkins, C.R., 1992. A Review of the Contemporary Transfer Pricing Literature with Recommendations for Future Research. [journal]. British Journal of Management, 3, pp.101‐22
Meckes, A., 2008. Email conversation with Anja Meckes at ABB Pucaro [Email]. 21 November, 2008
Miltell, J., 2005. FACTS for improved process economy in industry [Internal presentation]. Available at http://abblibrary.abb.com/global/scot/scot221.nsf/veritydisplay/75d96db23250049fc 1257073002e0136/$File/Business%20case%20SVC%20Q.pdf [Accessed 15 October 2008]
Muller, A., 2006. Risk Management in the Clean Development Mechanism (CDM) – The Potential of Sustainability Labels. [working paper] Working Papers in Economics 228, Göteborg University, Department of Economics.
103
References
Mulligan, P., 2008. How to outsource business processes. [journal]. Purchasing, p. 55.
Nilsson, T., 2008. Email conversation with Thomas Nilsson at Greenstream carbon consultants in Sweden [interview]. 27 October 2008
Nord, T., 2008. Email conversation with Teresa Nord at Tricorona Carbon Asset Management in Sweden [interview]. 28 October 2008
Nordpool, 2008. Nordpool homepage [online]. Available at http://www.nordpool.com/en/asa/Services/Emissions/EUACER2/ [Assessed 23 September 2008]
Nordström, A., 2008. Interviews with Anders H Nordström at ABB sustainability department. [interview]. 1 October 2008, 13 October 2008, 15 October 2008
Normark, B., 2008. Interview with Bo Normark at ABB HVDC in Sweden [interview]. 22 October 2008
NYMEX, 2007. The Green Exchange – Markets. [online]. Available at http://nymex.greenfutures.com/markets/?s=4&id=24 [Accessed 23 September 2008].
Pin, K., 2005. The CDM Project Cycle, Transaction Costs and Role of Institutions [Internal presentation]. Pusat Tenaga Malaysia
Pucaro, 2008. Pucaro homepage [online]. Available at http://www.pucaro.com [Accessed 24 October 2008].
Quinn, J., 1999. Strategic Outsourcing: Leveraging Knowledge Capabilities. [journal]. Sloan Management Review, 40(4), pp. 9‐21.
Rabe, D., 2008. Interview with Diethelm Rabe at ABB Service GmbH in Germany [interview]. 24 October 2008
Ravemark, D & Åhström, J., 2004. CO2 effects of HVDC Projects – sales argument. [internal report].
Rawlings, E. How the Air Force Uses Management Consultants. [journal]. Harvard Business Review, 35(4), pp.45‐50.
Rådstedt, B., 2008. Phone interviews and email conversations with Birger Rådstedt at ABB Figeholm [Interview]. ABB HQ, Zürich, 10 October 2008.
UNFCC, 2008a. United Nations Framework Convention on Climate Change homepage and the Kyoto Protocol [online]. Available at http://unfccc.int [Accessed 19 September 2008].
104
References
UNFCC, 2008b. International Transaction Log – ITL. [online]. UNFCC. Available at http://unfccc.int/kyoto_protocol/registry_systems/itl/items/4065.php [Accessed 24 September 2008].
UNFCC, 2008c. Registry Status 2007. [online]. UNFCC. Available at http://unfccc.int/ kyoto_protocol/registry_systems/registry_status/items/4433.php [Accessed 24 September 2008].
UNFCC, 2008d. Registry Systems under the Kyoto Protocol. [online]. Available at http://unfccc.int/kyoto_protocol/registry_systems/items/2723.php [Accessed 24 September 2008].
UNFCC, 2008e. Additionality tool. [online]. p.3. Available at http://cdm.unfccc.int/methodologies/PAmethodologies/AdditionalityTools/Additionality_tool.pdf
[Accessed 23 September 2008].
UNFCC, 2008f. Simplified modalities and procedures for small‐scale CDM project activities. [online]. Available at http://cdm.unfccc.int/Reference/Documents/AnnexII/English/annexII.pdf
[Accessed 09 October 2008].
UNFCC, 2005. Report of the Conference of the Parties serving as the meeting of the Parties to the Kyoto Protocol on its first session, held at Montreal. [online]. UNFCC. Available at http://afoludata.jrc.it/events/Kyoto_technical_workshop/08a02.pdf. [Accessed 19 September 2008].
Vitelli, A. 2008. The ITL‐CITL connection’s impact on the market. [online]. IDEAcarbon. Available at http://communities.thomsonreuters.com/clientfiles/a05396f8‐44d6‐45cc‐9abc‐1fa99735e184/reuters%20commentary_6%20aug.pdf [Accessed 24 September 2008].
Wikström, P., 2008. Interview with Per Wikström at ABB Automation products in Zürich [interview]. 7 October 2008
Woodward, V., 2007. An Introduction to Risk Transfer Pricing. [journal] Journal of Performance Management, 20(3), pp.3‐15.
World Bank, 2008. State and Trends of the Carbon market 2008. [online]. World Bank: Available at http://carbonfinance.org/docs/State___Trends‐‐formatted_06_May_10pm.pdf. [Accessed 30 September 2008]
Wuttig, H., 2008. Email conversation with Hartmut Wuttig at ABB Oil, Gas & Petroleum in USA [Email] 13 October 2008.
Yapp, J., 2006. Development of Sectoral CDM Project: A Case Study for Small Scale Biogas Project. [online]. Available at http://www.snm.nl/pdf/0500_2.1_development_of_sectoral_cdm_ project_background_paper.pdf. [Accessed 09 October 2008]
105

Appendix A – ABB Organization Scheme The figure below shows a rough picture of ABB’s organization.
ABB
Head of Global Markets
Head of HRCFOHead of Corporate
DevelopmentCEO
Group Internal Audit
Legal Affairs & Compliance
Corporate Communications
Research and Development
Group Planning & Controlling
Information Systems
Corporate Finance & Taxes
Investor Relations
Assurance & Internal Control
Risk Management & Insurance
Group Account Management
HR Renumeration
Sustainability Affairs
HR Recruitment
HR Development
Mergers & Acquisitions
Quality & Operational Excellence
Corporate Strategy
Supply Chain Management
Power Systems
RoboticsProcess
AutomationPower Products
Automation Products
Medium Voltage Products
Transformers
High Voltage Products
Substations
Power Generation
Network Managemen
t
Grid Systems
LV Drives LV Motors
Instrument‐ation
LV Systems
Enclos. & DIN rail Compo‐
nents
Machines
Control Products
Wiring Accesories
Breakers & Switches
PE & MV Drives
Pulp & Paper
Oil & Gas
Metals
Process Industries
Force Measure‐ment
Minerals
Marine
Service
Chemical & Pharma‐ceutical
Turbo‐charging
Robot Automation
Service
Products
Systems
Hydro plants
Cogeneration
Diesel plants
Waste‐to‐Energy
Steam‐ and gas turbines
Desalination
Fossil plants
Wind
FACTS Shunt Compensation
High Voltage Cables
FACTS Series Compensation
Power semi‐conductors
HVDC Light
Consulting & Services
HVDC
Figure A.1: ABB’s organization.
106

Appendix B – How to comply This appendix will present a number of different strategies a company, F, may pursue in order to fulfil its compliances needs. It is assumed that A and F are under emission regulation and that F anticipates emitting 20 tons of CO2 above its cap in each year from 2008 to 2012. It is also assumed that F cannot lower its emissions by any other means than lowering production.
Figure B.1: EUA Spot trade
The first and perhaps most straight forward strategy is for F to buy 20 EUAs from A on the spot market right before F needs to hand over its EUAs for compliance fulfillment. F could also buy the 100 EUAs in the beginning of the period and bank them for the subsequent years.
...
Figure B.2: EUA future trade
F may also buy futures from A, i.e. pays A today for delivery of 20 EUAs right before F needs to prove its compliance.
Figure B.3: Invest in a CDM project
F could also invest in a CDM project with company B and thereby earn CERs. The amount of issued CERs is dependent on the performance of the project, which means that there are some risks involved that needs to be handled. CERs may be used for at least 10 % of compliance needs.
Figure B.4: Secondary CER spot trade
F could also acquire CERs by buying them from company A, where company A has invested in CDM projects and is thus receiving CERs. By buying CERs on the secondary market the quantity risk is removed, but the CERs are of course priced to cover for A’s risks. F could either buy the 100 CERs in the
107
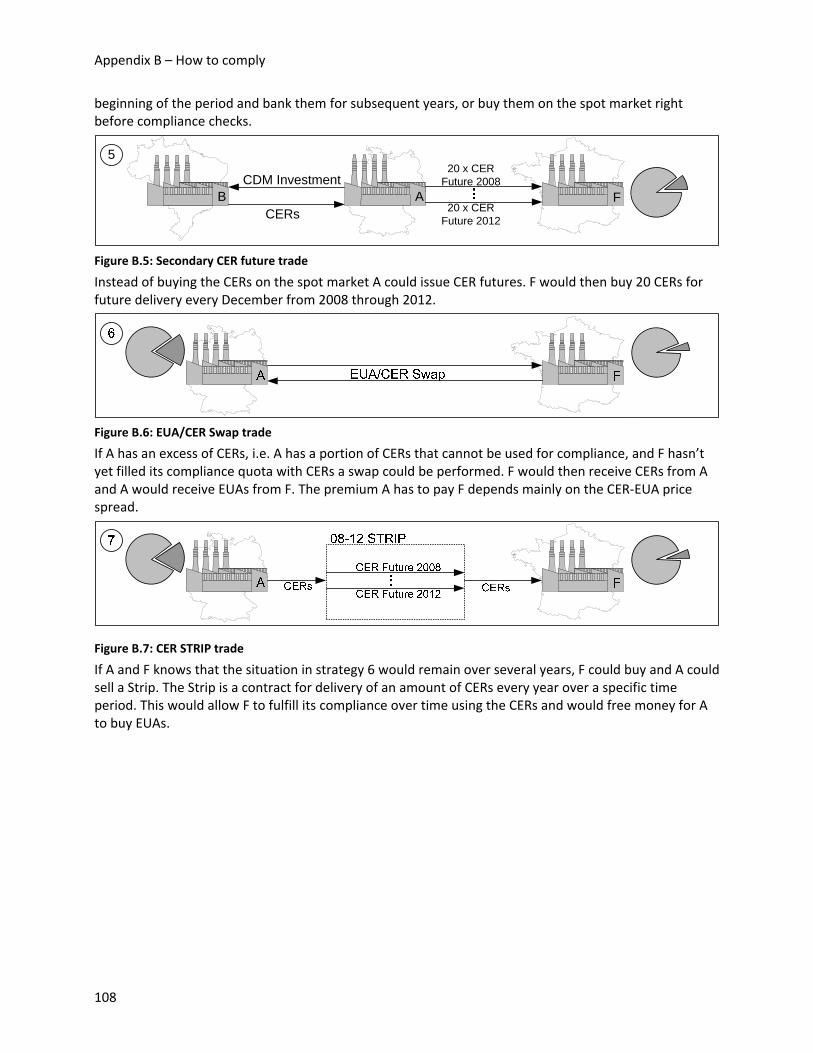
Appendix B – How to comply
beginning of the period and bank them for subsequent years, or buy them on the spot market right before compliance checks.
5
FBCDM Investment
CERsA
20 x CER Future 2012
20 x CER Future 2008
Figure B.5: Secondary CER future trade
Instead of buying the CERs on the spot market A could issue CER futures. F would then buy 20 CERs for future delivery every December from 2008 through 2012.
Figure B.6: EUA/CER Swap trade
If A has an excess of CERs, i.e. A has a portion of CERs that cannot be used for compliance, and F hasn’t yet filled its compliance quota with CERs a swap could be performed. F would then receive CERs from A and A would receive EUAs from F. The premium A has to pay F depends mainly on the CER‐EUA price spread.
Figure B.7: CER STRIP trade
If A and F knows that the situation in strategy 6 would remain over several years, F could buy and A could sell a Strip. The Strip is a contract for delivery of an amount of CERs every year over a specific time period. This would allow F to fulfill its compliance over time using the CERs and would free money for A to buy EUAs.
108

Appendix C – Factors affecting organizational performance This Appendix illustrates the interconnection of the factors which affects organizational performance. The factors are described in Chapter 5.1
EXPERTISE ‐ KNOWLEDGE ‐ INFORMATION
Figure C.1: Factors affecting organizational performance.
109