Embed Size (px)
Citation preview

Lip-reading enhancement for law enforcement
Barry J. Theobalda, Richard Harveya, Stephen J. Coxa, Colin Lewisb, Gari P. Owenb
a School of Computing Sciences, University of East Anglia, Norwich, NR4 7TJ, UK.b Ministry of Defence SA/SD, UK.
ABSTRACTAccurate lip-reading techniques would be of enormous benefit for agencies involved in counter-terrorism and other law-enforcement areas. Unfortunately, there are very few skilled lip-readers, and it is apparently a difficult skill to transmit,so the area is under-resourced. In this paper we investigate the possibility of making the lip-reading task more amenableto a wider range of operators by enhancing lip movements in video sequences using active appearance models. These aregenerative, parametric models commonly used to track faces in images and video sequences. The parametric nature of themodel allows a face in an image to be encoded in terms of a few tens of parameters, while the generative nature allowsfaces to be re-synthesised using the parameters. The aim of this study is to determine if exaggerating lip-motions in videosequences by amplifying the parameters of the model improves lip-reading ability. We also present results of lip-readingtests undertaken by experienced (but non-expert) adult subjects who claim to use lip-reading in their speech recognitionprocess.
The results, which are comparisons of word error-rates on unprocessed and processed video, are mixed. We find thatthere appears to be the potential to improve the word error rate but, for the method to improve the intelligibility there isneed for more sophisticated tracking and visual modelling. Our technique can also act as an expression or visual gestureamplifier and so has applications to animation and the presentation of information via avatars or synthetic humans.
1. INTRODUCTIONSpeech is multi-modal in nature. Auditory and visual information∗ are combined by the speech perception system whena speech signal is decoded, illustrated by the McGurk Effect.1 Generally, under ideal conditions the visual information isredundant and speech perception is dominated by audition, but increasing significance is placed on vision as the auditorysignal degrades2–7 , is missing, or is difficult to understand.8 It has been shown that in less than ideal conditions, visioncan provide an effective improvement of approximately 11dB in signal-to-noise ratio (SNR).
The visual modality of speech is due to the lips, teeth and tongue on the face of a talker being visible. The positionand movement of these articulators relate to the type of speech sound produced e.g. bilabial, dental, alveolar, etc., andare responsible for identifying the place of articulation. Lip-reading describes the process of exploiting information fromonly the region of the mouth of a talker. However, this is problematic as the place of articulation is not always visible.Consequently speech sounds, or more formally phonemes (the smallest unit of speech that can uniquely transcribe anutterance), form visually contrastive (homophenous) groups.9 For example, /p/ and /m/ are visually similar and onlyrelatively expert lip-readers can differentiate between them. The distinguishing features, in a visual sense, are very subtle:both sounds are defined by bilabial actions, but /m/ is voiced and nasal while /p/ is unvoiced and oral.10 The main aimof this study is to determine whether exaggerating visual gestures associated with speech production will amplify thesubtleties between homophenous speech sounds sufficiently to improve the performance of (relatively) non-expert lip-readers. Conceptually, amplifying visual speech gestures for lip-reading is equivalent to increasing the volume (or SNR)of an auditory signal for a listener.
Quantifying the contribution of vision in speech perception is difficult as there are many variables that influence lip-reading ability. These include, for example, the speaking rate of the talker, the overall difficulty of the phrases, the qualityof the testing environment (e.g. lighting), and the metric used to evaluate performance. For this reason much of theprevious work employed relatively simple tasks, such as asking viewers to recognise only isolated monosyllabic words,3
Further author information: (Send correspondence to B.J.T.)Emails of University of East Anglia authors: {bjt,rwh,sjc}@cmp.uea.ac.uk
∗Speech perception can also exploit tactile information in addition to auditory and visual information.

or presenting degraded auditory speech aligned with the visual stimuli.4 Here the aim is to determine whether or notamplifying speech gestures in real-world video sequences, e.g. surveillance, improves the intelligibility of the video. Thisrequires the recognition of continuous visual speech, (often) without audio.
The term speech-reading describes the use of additional visual cues over and above the place of articulation in speechperception. An example of such cues is that visual speech is more intelligible when the entire face of a talker is visiblerather than just the mouth.2, 11 Facial and body gestures add to, or emphasise, the linguistic information conveyed byspeech.12–16 For example, raising the eyebrows is used to punctuate speech, indicate a question or signal the emotion ofsurprise.17 Head, body and hand movements signal turn taking in a conversation, emphasise important points, or directattention to supply additional visual cues. In general, the more of this visual information afforded to a listener, the moreintelligible the speech. In the context of this work, it is not immediately clear how body gestures can be amplified andre-composited into the original video. Hence, the focus of this paper is only with respect to facial gestures directly relatedto speech production — can we improve lip-reading ability, rather than speech-reading ability?
2. ACTIVE APPEARANCE MODELS: AAMSAn active appearance model (AAM)18, 19 is constructed by hand-annotating a set of images with landmarks that delineatethe shape. A vector, s, describing the shape in an image is given by the concatenation of the x and y-coordinates of thelandmarks that define the shape: s = (x1,y1, . . . ,xn,yn)
T . A compact model that allows a linear variation in the shape isgiven by,
s = s0 +k
∑i=1
si pi, (1)
where si form a set of orthonormal basis shapes and p is a set of k shape parameters that define the contribution of each basisin the representation of s. The basis shapes are usually derived from hand-annotated examples using principal componentanalysis (PCA), so the base shape, s0, is the mean shape and the basis shapes are the eigenvectors of the covariance matrixcorresponding to the k largest eigenvalues. Varying pi gives a set of shapes that are referred to as a mode in an analogywith the modes that result from the excitation of mechanical structures (p1 corresponds to the first mode and so on). Thefirst four modes of a shape model trained on the lips of a talker are shown in Figure 1.
Figure 1. The first four modes of a shape model representing the lips of a talker. Typically, 10 parameters are required to account for≈95% of the shape variation. For the model shown, the first parameter captures the opening and closing of the mouth and the secondthe degree of lip rounding. Subsequent modes capture more subtle variations in the mouth shape.
A compact model that allows linear variation in the appearance of an object is given by,
A = A0 +l
∑i=1
Aiqi, (2)
where Ai form a set of orthonormal basis images and q is a set of l appearance parameters that define the contribution ofeach basis in the representation of A. The elements of the vector A are the (RGB) pixel values bound by the base shape, s0.It is usual to first remove shape variation from the images by warping each from the hand-annotated landmarks, s, to thebase shape. This ensures each example has the same number of pixels and a pixel in one example corresponds to the samefeature in all other examples. The base image and first three basis images of an appearance model are shown in Figure 2.

Figure 2. The base image and first three template images of an appearance model. Note: the basis images have been suitably scaled forvisualisation. Typically, between 15–30 parameters are required to account for ≈ 95% of the appearance variation.
2.1. Image Representation and SynthesisAn AAM is generative — new images can be synthesised using the model. Applying a set of shape parameters, Equa-tion (1), generates a set of landmarks and applying a set of appearance parameters, Equation (2), generates an appearanceimage. An image is synthesised by warping the new appearance image, A, from the base shape to the landmarks, s. Toensure the model generates only legal instances, in the sense of the training examples, the parameters are constrained to liewithin some limit, typically ±3 standard deviations, from the mean.
AAMs can also encode existing images. Given an image and the landmarks that define the shape, the shape andappearance parameters that represent the image can be computed by first transposing Equation (1) to calculate the shapeparameters:
pi = sTi (s− s0) , (3)
warping the image to the mean shape and applying the transpose of Equation (2) to calculate the appearance parameters:
qi = ATi (A−A0) . (4)
The goal of this work is encode a video sequence of a person talking in terms of the parameters of an AAM. Eachparameter of an AAM describes a particular source of variability. For example, for the shape model shown in Figure 1the first basis shape represents mouth opening and closing, while the second represents lip rounding and pursing. Theparameters that encode an image are essentially a measure of the distance of the gesture in the image from the “average”position. It follows that increasing this distance exaggerates the gesture. We will measure lip-reading performance onprocessed and unprocessed video to determine the net gain, if any, in terms of lip-reading ability after processing thevideo.
3. VIDEO CAPTURE AND PROCESSINGThe conditions under which the video used in this work was captured ensured, as far as possible, that viewers were able toextract only information directly related to speech production. An ELMO EM02-PAL camera was mounted on a helmetworn by a speaker to maintain a constant head pose throughout the recording and the camera position adjusted to maximisethe footprint of the face in the video frames. The output from the helmet-mounted camera was fed into a Sony DSR-PD100AP DV camera/recorder and stored on digital tape. This was later transferred to computer using an IEEE 1394compliant capture card and encoded at a resolution of 720×568 pixels at 25 frames per second (interlaced). To ensure thelips, teeth and tongue were clearly visible and the lighting was roughly constant across the face, light was reflected from twosmall lamps mounted on the helmet back onto the face. The video was captured in a single sitting and all utterances spokenat a normal talking rate with normal articulation strength, i.e. no effort was made to under/over articulate the speech. Thefacial expression was held as neutral as possible (no emotion) throughout the recording and example frames are illustratedin Figure 3.
The material recorded for this work was designed to allow a measure of the information gained from lip-reading to beobtained. The use of context and a language model in speech recognition greatly improves recognition accuracy,20 and itseems a safe assumption that language modelling is equally if not more important in lip-reading. A lip-reader who missespart of a phrase can often identify what was missed using semantic and syntactic clues from what was recognised. Althoughthe same mechanisms would be used in lip-reading both the processed and unprocessed video, we wish to minimise their

Figure 3. Example (pre-processed) frames from the recording of the video sequence used in this work. The aim is to capture onlygestures directly related to speech production. Other cues used in speech perception, including expression, body and hand gestures, arenot captured in the video.
effects to ensure we measure mostly lip-reading performance. To assist with this, the phrases recorded were a subset ofa phonetically balanced set known as the Messiah corpus21). Each sentence was syntactically correct had very limitedcontextural information. Table 1 gives some example sentences.
3.1. Processing the videoVideo processing begins by first labelling all frames in a video sequence with the landmarks that define the shape of theAAM. Given an initial model, this is done automatically using one of the many AAM search algorithms.19 Note: for amore robust search we use an AAM that encodes the whole face of the talker. Knowledge of the position of all of thefacial features provides a more stable fit of the model to the mouth in the images. Once the position of the landmarks thatdelineate the mouth are known the images are projected onto a (mouth-only) model by applying Equations 3 and 4. Thevalues of the model parameters for each frame are amplified by multiplying with a pre-defined scalar (greater than unity)and the image of the mouth reconstructed by applying the scaled parameters to the model.
The image synthesised by the AAM is of only the mouth and this must be composited (blended) with the originalvideo. The AAM image is projected into an empty (black) image with the same dimensions as the original image, wherethe landmark positions are used to determine the exact location of the mouth in the video frame. After projecting thesynthesised mouth into the video frame, the (mouth) pixels in the original video are over-written by first constructing abinary mask that highlights the relevant pixels. These are defined as those within the convex-hull of the landmarks thatdelineate the outer lip margin. Pixels forming the mouth are assigned the value one and those not internal to the mouthare assigned the value zero. To ensure there are no artifacts at the boundary of the synthesised mouth and the rest of theface, the binary mask is filtered using a circular averaging filter. The final processed video frame is a weighted average ofthe original video frame and the (projected) AAM synthesised frame, where the weight for each pixel is the value of thecorresponding pixel in the (filtered) mask. Specifically,
Ip(i) = IrIa(i)+(1.0− Ir)Iv(i), (5)
where, Ip(i) is the ith colour channel of a pixel in the processed image, and Ir, Ia(i) and Iv(i) are the channels in the pixelsin the filtered mask, the image generated by the appearance model and the original video respectively. This is illustrated inFigure 4.
The entire process is repeated for each frame in a video sequence and the sequences saved as a high quality (≈28MB/sec) MPEG video.
4. EVALUATIONThe aim is to compare lip-reading ability on processed and unprocessed video sequences. Ideally the same sequenceswould be presented in processed and unprocessed form to each viewer and the difference in lip-reading accuracy usedmeasure the benefit. However, to avoid bias due to tiredness or memory effects, the sentences forming the processed and

Iv Ia Ir Ip = IrIa +(1.0− Ir)Iv,
Figure 4. An original unprocessed frame (Iv), the corresponding gesture amplified and projected into an empty (black) image (Ia), afiltered mask that defines the weights used to average the AAM synthesised and original image (Ir) and the final processed video frame.
unprocessed sequences differed. Since it is known that context and the language model have a large effect on humanlistener’s error rate20 our first task was to grade the sentences for audio difficulty: a process that we now describe.
4.1. Grading the Difficulty of Each SentenceInitial experiments using visual-only stimuli proved impossible for viewers with no lip-reading experience — even forseemingly simple tasks, such as word spotting. Therefore the test material was graded using listening tests. Whilst listeningdifficulty may not truly reflect lip-reading difficulty it does serve as a guide. Factors such as sentence length and thecomplexity of words forming a sentence will affect perception in both the auditory and visual modalities. Hence weattempted to measure the intrinsic difficulty of recognising each sentence by degrading the audio with noise and measuringthe audio intelligibility.
Each sentence was degraded with additive Gaussian noise and amplified/attentuated to have constant total energy andan SNR of -10dB. Each sentence was played three times and after the third repetition the listener was instructed to writedown what they thought they had heard. Ideally, to account for any between subject variability, a number of listeners wouldeach transcribe all of the sentences and the score for each sentence would be averaged over all listeners. However, gradingall (129) sentences was a time-consuming process (> two hours per listener), so we wished to avoid this if possible. Inparticular we were interested in analysing the error rates between listeners to determine the extent to which error ratesco-varied. If the relationship is strong, then the material need be graded only once.
Twenty sentences were selected randomly from a pool of 129 and the auditory signal degraded to -10 dB. The listenerresponses, obtained after the third repetition of each sentence, were marked by hand-aligning each response to the correctanswer and counting the number of correctly identified words. For example, for the phrase
“No matter how overdone her praise where Amy was concerned, I did not dare thank her.”
and for the listener response
“No matter how . . . there gaze . . . I dare not thank her.”
The number of words correct is five (No, matter, how, I and dare). Note, the word not is not in the list of correct wordsas after aligning the sentences not dare and dare not appear the wrong way around, so only one of these two words iscounted as correct†. To allow for sentences of different lengths, the number of words correctly identified is converted to apercentage for each sentence (31.25% for the example shown) and the percentage score used to rank the difficulty.
Scattergrams of the scores for two listeners for the twenty randomly selected sentences are shown in Figure 5 (A). Inthis test, we consider only the words correctly identified. An incorrect word that rhymes with the correct word, or is of a
†It is not important how the sentences are actually marked, what is important is that they are all marked consistently. This way themark scheme can be task specific, e.g. word error rate, overall context of the sentence, etc.

0 10 20 30 40 50 60 70 80 90 1000
10
20
30
40
50
60
70
80
90
100
Listener 1
List
ener
2
0 10 20 30 40 50 60 70 80 90 1000
10
20
30
40
50
60
70
80
90
100
Listener 1
List
ener
3
0 10 20 30 40 50 60 70 80 90 1000
10
20
30
40
50
60
70
80
90
100
Listener 2
List
ener
3
(A) (B) (C)
Figure 5. The relationship between the word error rates for three listeners and twenty sentences. Shown are the percent correct scoresfor (A) listeners one and two, (B) listeners one and three, and (C) listeners two and three.
different morphological form, or has some semantic similarity, is considered equally as incorrect as a completely arbitraryword. We would expect that more sophisticated scoring methods would improve the relationship between the error ratesfor each subject.
A single listener repeated the previous experiment for all 129 sentences. The relationships between the error ratesfor this new listener and the previous two listeners are shown in Figure 5 (B) and (C). The relationship between the threecombinations of listener appears equally strong. The Spearman rank correlation between listener 1 and 2 was 0.59, betweenlistener 1 and listener 3 was 0.59 and between listener 2 and 3 was 0.63 which are low but all significantly different fromzero. Therefore, the percentage of words correctly identified for each sentence for only listener 3 were used to grade thelevel of difficulty for each sentence.
4.2. Quantifying the Contribution of VisionEight experienced, but non-expert lip-readers participated in this subjective evaluation of lip-reading performance. Fiveof the participants were deaf, two were hard of hearing, and one had normal hearing ability. Two of the lip-readers reliedon sign-assisted English in addition to lip-reading to communicate. To compensate for varying degrees of hearing loss allvideo presented to the lip-readers contained no audio. All participants attended a briefing session before the evaluationwhere the nature of the task was explained and example processed and unprocessed sequences shown.
The evaluation comprised of two tests: one designed to be difficult and one to be less challenging. For each test,twenty processed and twenty unprocessed video sequences were randomly intermixed and played to the viewers through agraphical user interface (GUI). The randomisation of sequences ensured that there is no bias due to fatigue. The viewerswere further sub-divided into two groups. Group one saw one set of sequences; group saw another. There were thirteencommon sequences between the groups which are listed in Table 1.
The interface ensured each sequence was presented to each viewer three times, but the user was required to hit aplay button to repeat a sentence. This allowed a viewer to spend as much time between repetitions as they wished. Thefirst (difficult) task required each viewer to fully transcribe the sentences. The answer sheet provided to the participantscontained a space for each word to give an indication of the length of the utterance, but this was the only clue as to thecontent of the material. The second task was a keyword spotting task. The user was provided with the transcriptions foreach utterance, but each contained a missing keyword, which the participants were asked to identify.
The viewer responses for the first task were graded in the same way as the audio-only tests. The response for eachsentence was (hand) aligned with ground-truth and the total number of words correctly identified was divided by the totalnumber of words in the sentence. The responses for the second test were marked by assigning a one to the sentences withthe correctly identified word and a zero to those without. The results are presented in the following section.
5. RESULTSFigure 6 shows the accuracy for the eight participants in the tests. The first three participants were assigned to Group 1 andthe remainder were in Group 2. Note that participant 2 did not take part in the keyword spotting task (task 2).

On the left-hand side are the accuracies for the difficult test and on the right are the accuracies for the keyword task.As expected, the keyword accuracies are considerably higher than the sentence ones. However the changes due to videotreatment are much smaller for the keyword task than for the sentence task which implies that the video enhancement ismost useful when the task is difficult.
1 2 3 4 5 6 7 80
0.05
0.1
0.15
0.2
0.25
Viewer
Accu
racy
MeanMean (untreated)Mean (treated)
1 2 3 4 5 6 7 80
0.1
0.2
0.3
0.4
0.5
0.6
0.7
0.8
0.9
1
ViewerAc
cura
cy
MeanMean (untreated)Mean (treated)
Figure 6. Left-hand plot: mean accuracy per viewer measured over the whole sentence. Error bars show ±1 standard error. For eachviewer we show (left) mean accuracy, mean accuracy for unprocessed sequences (centre) and mean accuracy for the processed sequences(right). Right-hand plot: mean accuracy for keyword task. Note Viewer 2 did not take part in the keyword task.
The results in Figure 6 are difficult to interpret. For some lip-readers it appears as though the new processing has madea substantial improvement to their performance; for others it made it worse. A natural caution must be, with such smallnumbers of participants, that these differences are due to small-sample variations in the difficulty of the sentences. We can
Group 2 (unprocessed) Group 2 (processed)
Gro
up1
(unp
roce
ssed
) m067: “It would be very dangerous to touch barewire.”m082: “They asked me to honour them with my opin-ion.”
m009: “The boy asked if the bombshell was merespeculation at this time.”m056: “The boy a few yards ahead is the only fair win-ner.”m079: “Bush fires occure down under with devastat-ing effects.m087: “As he arrived right on the hour. I admired hispunctuality.”
Gro
up1
(pro
cess
ed)
m014: “The church ahead is in just the right area.”m070: “How much joy can be given by sending a bigthankyou with orchids.”m098: “A man at the lodge checked our identifica-tion.”m113: “The big house had large windows with verythick frames.”m122: “Geese don’t enjoy the drabness of winterweather in Monmouthshire.”
m016: “It is seldom thought that a drug that can curearthritis can cure anything.”m084: “Many nations keep weapons purely to deterenemy attacks.”
Table 1. Examples of Messiah sentences (a full list of sentences is available in21). Here are shown the sentences that were common toboth experimental groups. Top-left are the sentences that were presented to groups 1 and 2 unprocessed. Top-right are sentences thatwere presented unprocessed to Group 1 but processed to Group 2 and so on.
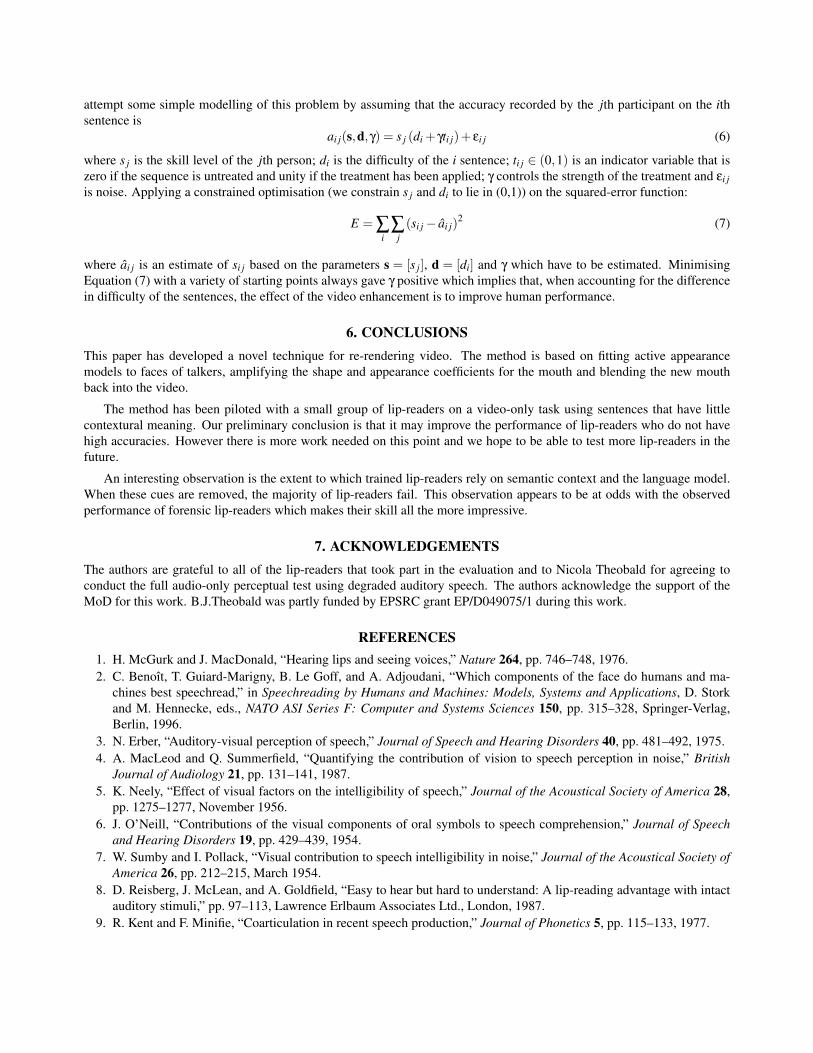
attempt some simple modelling of this problem by assuming that the accuracy recorded by the jth participant on the ithsentence is
ai j(s,d,γ) = s j (di + γti j)+ εi j (6)
where s j is the skill level of the jth person; di is the difficulty of the i sentence; ti j ∈ (0,1) is an indicator variable that iszero if the sequence is untreated and unity if the treatment has been applied; γ controls the strength of the treatment and εi jis noise. Applying a constrained optimisation (we constrain s j and di to lie in (0,1)) on the squared-error function:
E = ∑i
∑j
(si j− ai j)2 (7)
where ai j is an estimate of si j based on the parameters s = [s j], d = [di] and γ which have to be estimated. MinimisingEquation (7) with a variety of starting points always gave γ positive which implies that, when accounting for the differencein difficulty of the sentences, the effect of the video enhancement is to improve human performance.
6. CONCLUSIONSThis paper has developed a novel technique for re-rendering video. The method is based on fitting active appearancemodels to faces of talkers, amplifying the shape and appearance coefficients for the mouth and blending the new mouthback into the video.
The method has been piloted with a small group of lip-readers on a video-only task using sentences that have littlecontextural meaning. Our preliminary conclusion is that it may improve the performance of lip-readers who do not havehigh accuracies. However there is more work needed on this point and we hope to be able to test more lip-readers in thefuture.
An interesting observation is the extent to which trained lip-readers rely on semantic context and the language model.When these cues are removed, the majority of lip-readers fail. This observation appears to be at odds with the observedperformance of forensic lip-readers which makes their skill all the more impressive.
7. ACKNOWLEDGEMENTSThe authors are grateful to all of the lip-readers that took part in the evaluation and to Nicola Theobald for agreeing toconduct the full audio-only perceptual test using degraded auditory speech. The authors acknowledge the support of theMoD for this work. B.J.Theobald was partly funded by EPSRC grant EP/D049075/1 during this work.
REFERENCES1. H. McGurk and J. MacDonald, “Hearing lips and seeing voices,” Nature 264, pp. 746–748, 1976.2. C. Benoıt, T. Guiard-Marigny, B. Le Goff, and A. Adjoudani, “Which components of the face do humans and ma-
chines best speechread,” in Speechreading by Humans and Machines: Models, Systems and Applications, D. Storkand M. Hennecke, eds., NATO ASI Series F: Computer and Systems Sciences 150, pp. 315–328, Springer-Verlag,Berlin, 1996.
3. N. Erber, “Auditory-visual perception of speech,” Journal of Speech and Hearing Disorders 40, pp. 481–492, 1975.4. A. MacLeod and Q. Summerfield, “Quantifying the contribution of vision to speech perception in noise,” British
Journal of Audiology 21, pp. 131–141, 1987.5. K. Neely, “Effect of visual factors on the intelligibility of speech,” Journal of the Acoustical Society of America 28,
pp. 1275–1277, November 1956.6. J. O’Neill, “Contributions of the visual components of oral symbols to speech comprehension,” Journal of Speech
and Hearing Disorders 19, pp. 429–439, 1954.7. W. Sumby and I. Pollack, “Visual contribution to speech intelligibility in noise,” Journal of the Acoustical Society of
America 26, pp. 212–215, March 1954.8. D. Reisberg, J. McLean, and A. Goldfield, “Easy to hear but hard to understand: A lip-reading advantage with intact
auditory stimuli,” pp. 97–113, Lawrence Erlbaum Associates Ltd., London, 1987.9. R. Kent and F. Minifie, “Coarticulation in recent speech production,” Journal of Phonetics 5, pp. 115–133, 1977.

10. P. Ladefoged, A Course in Phonetics, Harcourt Brace Jovanovish Publishers, 1982.11. M. McGrath, Q. Summerfield, and M. Brooke, “Roles of the lips in lipreading vowels,” Proceedings of the Institute
of Acoustics 6, pp. 401–408, 1984.12. P. Bull, “Body movement and emphasis in speech,” Journal of Nonverbal Behavior 9(3), pp. 169–187, 1985.13. J. Cassell, H. Vihjalmsson, and T. Bickmore, “BEAT: The behavior expression animation toolkit,” in Proceedings of
SIGGRAPH, pp. 477–486, (Los Angeles, California), 2001.14. H. Graf, E. Cosatto, V. Strom, and F. Huang, “Visual prosody: Facial movements accompanying speech,” in Proceed-
ings International Conference on Automatic Face and Gesture Recognition, 2002.15. T. Kuratate, K. Munhall, P. Rubin, E. Vatikiotis-Bateson, and H. Yehia, “Audio-visual synthesis of talking faces from
speech production correlates,” in Proceedings of Eurospeech, 3, pp. 1279–1282, (Budapest, Hungary), 1999.16. C. Pelachaud, Communication and Coarticulation in Facial Animation. PhD thesis, The Institute for Research in
Cognitive Science, University of Pennsylania, 1991.17. P. Ekman, Emotions in the Human Face, Pergamon Press Inc., 1972.18. T. Cootes, G. Edwards, and C. Taylor, “Active appearance models,” IEEE Transactions on Pattern Analysis and
Machine Intelligence 23, pp. 681–685, June 2001.19. I. Matthews and S. Baker, “Active appearance models revisited,” International Journal of Computer Vision 60,
pp. 135–164, November 2004.20. A. Boothroyd and S. Nittrouer, “Mathematical treatment of context effects in phoneme and word recognition.,” J
Acoust Soc Am 84(1), pp. 101–14, 1988.21. B. Theobald, Visual Speech Synthesis Using Shape and Appearance Models. PhD thesis, University of East Anglia,
Norwich, UK, 2003.