Embed Size (px)
Citation preview

Malaysian Journal of Environmental Management 8 (2007): 101-
Linking Urban Form To A Liveable City
NORAZIAH ABDUL AZIZ & ABDUL SAMAD HADI
ABSTRACT
This paper intends to show the contribution and relationship of urban form to a
liveable city, as many researchers pose the urban form as one of the factors that
can worsen or improve the sustainability of the city. The paper will begin by
exploring into the theoretical characteristics of the urban form at the macro and
micro scale. Urban form models that match the Malaysian cities’ urban form are
illustrated in this paper with the idea of giving a larger context of the living
ecology for Malaysian communities. There are two types of cities, one that grows
in an ad-hoc manner, and the other is being shaped by planners. This paper
however, focuses only on a planned city that is the core city for Shah Alam.
Consequently, this paper touches briefly on the liveable city concept which is
currently being debated among the researchers as a more practical way of
looking into the sustainable city issues. The liveable city framework for the city
of Shah Alam is discussed and some preliminary findings are offered at the end
of the paper.
ABSTRAK
Kertas ini bertujuan menunjukkan sumbangan dan pertalian bentuk bandar
dengan bandar berdaya huni, kerana ramai pengkaji meletakkan bentuk bandar
sebagai salah satu faktor yang boleh menurun atau meningkatkan kemampanan
sesebuah bandar. Kertas ini dimulakan dengan menerokai ciri-ciri teoretikal
bentuk bandar pada skala makro dan mikro. Model bentuk bandar yang
menepati bentuk bandar Malaysia digambarkan dalam kertas ini dengan tujuan
memberikan konteks yang lebih luas tentang ekologi kehidupan masyarakat
bandar Malaysia. Terdapat dua jenis bandar, satu yang tumbuh secara spontan,
dan satu lagi dibentuk oleh perancang. Kertas ini hanya memfokus kepada
sebuah bandar terancang iaitu pusat bandar bagi Shah Alam. Seterusnya kertas
ini menyentuh secara ringkas tentang konsep bandar berdaya huni yang kini
diperdebatkan oleh para pengkaji sebagai suatu cara yang lebih praktikal dalam
melihat isu bandar mampan. Kerangka bandar berdaya huni untuk bandar Shah
Alam dibincangkan dan beberapa dapatan kajian awalan dinyatakan di akhir
kertas ini.

INTRODUCTION
Looking into urban form has always been the subject and interest of the
urban designers in particular and other groups including urban
geographers. However, of late this subject has caused a trans-disciplinary
grouses. The reason being the academia and urban managers have
identified the urban form as the root for the city’s physical, social and
environment problems (Knox 1994; Alberti 2000; Newman & Kenworthy
2000; Ravetz 2000). However, if the urban space is viewed from a
different angle, urban form is just a passive component of urban areas.
Once it is designed and then constructed, it will be there until the city
becomes obsolete. The main concern then is the implication of the urban
form that affects the liveability of the urban space, how it organises and
influences the life-world of the city people. Sharifah Norazizan Syed
Abdul Rashid et al. (2002) has shown that the complexity and diversity of
modern urban living have radically transformed the way people live,
interact, communicate, travel and work. Nevertheless, the urban form of a
city is unique, wherein each individual city displays morphologies and
land use patterns ranging from the very formal and carefully ordered to
the haphazard collections of buildings, spaces and activities (Kivell 1993:
3). This paper is about the influence of urban form on the everyday life of
a city. It will illustrate how different urban forms within a city affect the
daily life of the city dwellers, using some preliminary observations in
Shah Alam Selangor as an illustration.
The term urban form carries a variety of meanings. It covers from
the viewpoint of physical to non-physical characteristics of cities, at
different levels, sizes, categories and functions of the cities. Most urban
designers refer to the urban form as the ‘built form’ (Dovey 1999; Martin
& March 1972), or ‘townscape’ (Ali Madanipour 1996), comprising three
main components, the street plan or layout; architectural style of
buildings and their design; and land use. Another rarely used term is the
‘city shape’ (Macionis & Parrillo 1998). Obviously, all of them are
referring to the physical form of the city.
Meanwhile, the non-physical side of the urban form is its functions
that relate to the users of the city. Frey (1999) opined that the city as a
physical entity composes of many different elements which relate to each
other functionally and spatially. There is also another simple definition
from Cohen (2001). He maintains that the urban space creates the
surrounding forms, from which all types of successful urban life spring
forth and flourish. Nearer to the present and research need is Tsai’s
(2004) definition, where he cited Anderson’s et al. 1996 definition of

urban form as the spatial pattern of human activities at a certain point in
time. Tsai classified the spatial pattern of human activities into three
categories: its density, diversity and spatial-structure (pattern). For this
part of the definition, it is seen and interpreted as the lifeworld of the city
people. In this paper urban form is taken to be characterised by both the
physical and human dimensions that can be seen in the spatial structure of
the city, supporting the city people activities and eventually making the
city a liveable city. On the other hand, adhering to this definition gives
rise to the question of ‘what is a liveable city’ for Malaysia. This issue is
going to be looked into in a later part of the paper.
THE CHARACTERISTICS OF URBAN FORM
Researchers have identified the characteristics of urban form based on the
shape and growth pattern of the city. Some of the familiar terms given to
the model of the city are core, star, satellite, galaxy, linear and
polycentric city (Frey 1999; Haughton & Hunter 1994). But all of these
are the general theoretical urban form. For the purpose of this paper the
urban forms shown in Figure 1 are taken to represent the latest terms used
to describe the characteristics of urban form for which there are six types
(Newton 1997: 9).
These forms are:
Business as usual or dispersed city - outward expansion of urban
development at relatively low densities (10–30 persons per hectare),
dominated by a central city (as the key economic node), and an associated
radial transport networks.
Compact city - increasing population and density of inner suburbs.
Multi-nodal or edge city - increasing population, housing densities and
employment at selected nodes within orbital freeways linking the edge
cities.
Corridor city - growing along linear corridors emanating from CBD and
supported by public transport infrastructure.
Fringe city - additional growth predominantly on the fringe of the city.
Ultra-city - additional growth predominantly in provincial cities within
100 km of a capital city and linked by high-speed rail transport.

Figure 1. Archetypal urban system
Source: Newton 1997: 9
The above diagram explains the physical distribution of cities. Yet
the size, dimension, function or the catchment area of the city is not being
specified, especially in the compact city type, such as the degree of
compactness. However the degrees between compactness and sprawl
have never been distinguished (Tsai 2004). Thus Tsai (2004) in his
research gives additional light to the complex subject of urban form. In
his research, he focuses on the metropolitan urban form. Figure 2 is taken

from Tsai (2004) which shows that urban form can be further refined into
four dimensions: its size, density, distribution and clusters, and whether
it’s high or low. From the two Figures earlier a deduction can be made
where CSIRO’s diagram seems more suitable in explaining the urban
formation at macro scale, giving the big picture of cities’ growth in a
particular region. Whereas Tsai’s diagram is more appropriate for work at
micro scale, showing the detail concentration of human settlements and
the pattern of built-up areas in the city. Consequently, Tsai’s conception
is closer to the present research, and his scheme will subsequently be
used more in the paper.
Figure 2. Four dimensions of metropolitan form
Source: Tsai 2004: 144
URBAN FORM AND LIVEABLE CITY
Liveable city concept is discussed here to give due focus on the urban
communities. It has been widely used in the 1980’s and 1990’s in North
America as a response to the continuing problems of urban sprawl and

car-dependent land use patterns (Auckland City 2000). Using the
‘liveable city’ concept is one way of recognizing the sustainability of the
city, though according to Girardet (2004) liveability and sustainability are
intimately connected, they are not always representing the same thing
(Girardet 2004). Even the definition for ‘sustainable cities’ is still vague
to many people (Eastaway & Stoa 2004; White 1994), especially with
respect to the issue of what is to be sustainable. We feel, one way to come
to grip with the sustainable city is to ground it on the life and activities of
the people, hence the use of ‘liveable city’ to capture the serene but
rewarding life of city people.
‘Liveable’ city nonetheless is a very subjective word also. What
more if it concerns a liveable city. It is very similar to the old proverb
‘beauty lies in the eyes of its beholder’. Different people have different
opinion to what they call a liveable city. Shortell (2005) however, points
out that whether it is meaningful or not depends very much on the status
of the country, whether it’s a developed or developing country. This view
coincides with Timmer & Seymoar’s (2004) description of a liveable city
where according to them it reflects the ‘quality of life’ (wealth and
beyond) experienced by the city residents.
In comparing a livable city to a sustainable city concept, Douglass et
al. (2004) maintain that a liveable city concept is to be more human
centred; a liveable city should be ‘healthy, convivial and socially just
living, being shaped by the conditions of their natural and built
environments’. In turn these are contributed by three interconnected
dimensions, namely, environmental well being, personal well-being and
lifeworld. While Metcalf (2002) and Girardet (2004) described the
liveable city as having strong neighbourhoods and sufficient supporting
facilities required within walking distance, a network of attractive public
spaces and buildings, affordability, clean, vibrant with diverse street
culture, and there are regional connections. It is to be borne in mind that
each city is unique, for it is very much related to the type of the
community it contains including the geographical factors and the
financial status of that city governance. The expectation and requirement
of the people also vary from city to city and these are reflected in the
content of the city urban form, which also have some bearing on the
definition of their liveable city.
For the purpose of this research ‘liveable city’ is defined as a vibrant
and lively city where the communities enjoy congenial, pleasant and
neighbourly multi-ethnic living environment, affordable, healthy and
safe, with access to all the facilities they require and with a sense of
belonging to the city. This definition will be used as the framework to
look into the liveability of Shah Alam city, taking the core city of Shah
Alam as the case study.
VARIETIES OF URBAN FORM IN MALAYSIA
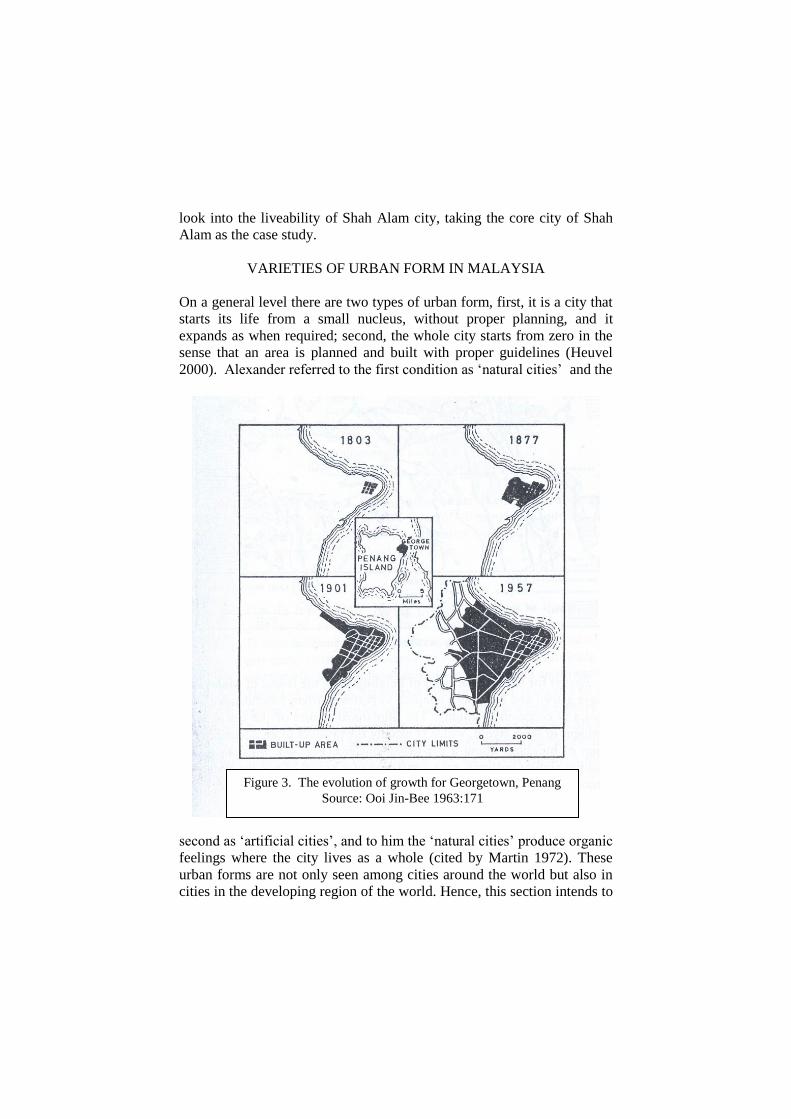
On a general level there are two types of urban form, first, it is a city that
starts its life from a small nucleus, without proper planning, and it
expands as when required; second, the whole city starts from zero in the
sense that an area is planned and built with proper guidelines (Heuvel
2000). Alexander referred to the first condition as ‘natural cities’ and the
second as ‘artificial cities’, and to him the ‘natural cities’ produce organic
feelings where the city lives as a whole (cited by Martin 1972). These
urban forms are not only seen among cities around the world but also in
cities in the developing region of the world. Hence, this section intends to
Figure 3. The evolution of growth for Georgetown, Penang Source: Ooi Jin-Bee 1963:171

explain the contribution of urban form to the liveability of the Malaysian
cities.
Malaysia as a fast developing country demonstrates that its major
cities’ growth started in earnest in the 1970s. Most of the state capitals
were built by the British planners during the early years of British
colonization of the country, and they have modern urban forms. The size
and shape of the cities evolved from nucleus of a small plot of land for
example in the case of George Town, Penang (Figure 3) and Kuala
Lumpur city (Figure 4). Then, with growth, they spread outwards. As
time went by they grew to reach their present sizes, in response to the
various growth promotion activities as the country progresses in its
modernisation path, as shown in Figure 5 for Georgetown, Penang and
Figure 6 for Kuala Lumpur. The approach for development during that
time was more piecemeal or as per requirement. Only during the early
Figure 4. The evolution of growth for Kuala Lumpur City
Source: Lim Heng Kow 1978: 105

1980s that the local authorities started to carry out their planning based
on the development plan, beginning with Kuala Lumpur.
Figure 5. The current size of Georgetown, Penang Source: Google Earth (29/01/2007)
Applying the CSIRO diagrams as the theoretical basis in looking at
the overall pattern of urban form in the State of Selangor to represent
some of the general patterns of urban form in a region we can illustrate
some behaviours of the urban growth experiences in the region. The State
of Selangor is the most developed state in Malaysia, its urbanisation level
for 2005 was 88.4% and the targeted level for 2010 is 89.1% (Malaysia
2006). From Figure 7 the urban forms of the major cities in this state are
shown to illustrate the formation of cities at the regional scale. It is clear
that the distribution of the cities matches the corridor city pattern in the

CSIRO diagram. The majority of these cities follow the federal motor
routes. Such pattern is to be expected in Malaysia as the existence of
conventional road system predated the highway system. The construction
of highways which showcase some advance technology in road building
came only in the 1970s. It can be stressed that more city growth is
therefore, concentrated along the old federal motor roads. From the
diagram, the highways tend to be close to Kuala Lumpur city to facilitate
the movement of people into and out of the city.
Figure 6. The current size of Kuala Lumpur City
Source: Google Earth (29/01/2007)
These highways and major roads are in fact making contributions
towards enriching and enhancing the Petaling Jaya, Subang Jaya and
Shah Alam cities’ developments. These cities have managed to sustain

their growth momentum to the extent that their edges have grown to
merge into one another to produce a mega urban conurbation, never seen
before in the country.
Figure 7. Location of towns and cities in Selangor State
Source: Modified from JPBD Negeri Selangor 2003
Let us move the examination of the urban form to another level, that
is looking at the three cities of Shah Alam, Subang Jaya and Petaling Jaya
urban forms. Each of these cities is also a local authority by itself. Figure
8 shows the physical layout of the three cities. From the diagram,
physically the whole combined urban form portrays compactness as well
as sprawling development. The fringe of each city is not even noticeable.

It is difficult to make an assessment whether this phenomenon has
positive or negative outcomes to the city people. At peak hours the traffic
jams might start to build-up as far as 15 km outside Kuala Lumpur city.
Figure 8. Cities of Shah Alam, Subang Jaya and Petaling Jaya
Source: JPBD 2004
Urban Forms at the Local Level
To understand the influence of urban form on the liveability of the city,
central Shah Alam city is chosen as the case study. The original site of
this city was an oil palm plantation. The idea to build this city started in
1963 after the success of the industrial and residential area for Petaling
Jaya city development. The Shah Alam project was the first city initiated
and built after Independence from the British. The proposal for this city is
based on a master plan for the whole central Shah Alam, which is also
called, the core for Shah Alam, which is the first planned state capital for
Malaysia. Location wise, Shah Alam has the advantage of being close to
Kuala Lumpur and in the centre of potentially rich area for city
development. The original master plan of Shah Alam is shown in Figure
9 bounding an area of 41.69 sq. km. However, since that time we can

identify three major different steps in the implementation of the current
development undertaking, filling the old master plan with new
development initiatives in response probably to the market demand,
especially with housing prices that can guarantee the viability of the
whole city project.
Pelan 2
Figure 9. Masterplan for Central Shah Alam
Source: Unit Perancang 1978
This central portion of Shah Alam comprises wards, called sections.
There are 24 sections in the central Shah Alam. Figure 10 shows the full
development of this area and Table 1 is the breakdown of the land uses in
each section. The sizes of the sections are variable, some are very big
while others are smaller. What is the basis used in determining the size of
each section is not known. Physically, each section looks compact, but
each section carries a density of built-ups, that varies from 3 – 18 units
per acre, except for section 16 where its density is 38 units/acre. The
density is calculated by taking the gross area of the section divided by the
number of residential units in that section. The differences in density
partly reflect the types of houses found in each section which are either

detached, semi-detached, terraces or multi-storey houses. The section that
has a high density reflects that it carries multi-storey residential units.
Figure 10. Neighbourhood centre and city centre for central Shah
Alam
Source: Modified from Draft Local Plan for Petaling District and Part of Klang
District 2003 – 2020 (JPBD Semenanjung Malaysia 2004)
The development of the central Shah Alam is based on the
neighbourhood concept, where each section supposes to be self-
contained. This type of development concept has been practiced in almost
all new towns development in Malaysia. Every section is required to have
its own public facilities such as a praying house ‘surau’, a community
hall, a kindergarten, a playground and convenient shops. Main public
facilities for example a mosque and schools are located in the ‘centre’ of
several neighbourhoods for city community use.

Table 1. Land uses for central Shah Alam
Sec-
tion Landuse
Residential
Units
Section Area
(Acres)
Section Area
(Hectares)
Density of residential/
acre
Land % for
Section
1 University - 362.99 146.9 - 4.3
2 Mixed
residential area 498 145.79 59 3.4 1.7
3 Mixed residential area
261 74.87 30.3 3.5 0.9
4 Mixed
residential area 568 90.93 36.8 6.2 1.1
5 State office - 138.13 55.9 - 1.6
6 Mixed
residential area 1280 126.27 51.1 10.1 1.5
7 Residential - 1110.73 449.5 - 13.1
8 Mixed
residential area 2211 230.05 93.1 9.6 2.7
9 Residential - 242.66 98.2 - 2.9
10 Mixed residential area
359 42.26 17.1 8.5 0.5
11 Mixed
residential area 787 134.92 54.6 5.8 1.6
12 Mixed
residential area 106 84.51 34.2 1.3 1.0
13 Residential - 1222.67 449.8 - 14.4
14
Shopping mall, office
buildings,
museum, state
mosque and
urban parks
- 299.24 121.1 - 3.5
15 Industry - 807.78 326.9 9.5
16 Industry and
housing 3500 658.78 266.6 38 7.7
17 Mixed
residential area 2910 711.91 288.1 4.1 8.4
18 Mixed residential area
3875 238.99 96.7 16.2 2.8
19 Mixed
residential area 3376 258.22 104.5 13.1 3.0
20 Mixed
residential area 2583 140.36 56.8 18.4 1.6
21 Industry - 234.5 94.9 - 2.8
22 Industry - 527.57 213.5 - 6.2
23 Industry - 345.7 139.9 - 4.1
24 Mixed
residential area 4896 280.22 113.4 17.5 3.3
Total 27210 8510.05 3398.9 - 100.0
Source: Majlis Bandaraya Shah Alam 2006

At the centre of Shah Alam city is its central business district (CBD)
area. However, over the years the main functions found in Shah Alam
CBD are being dispersed to a few locations within the larger Shah Alam
city. The dots in Figure 10 represent the neighbourhood centres (the small
dots) vis a vis the main centres. The neighbourhood centres have shop
houses while in the main centres are free standing shopping complexes.
Figure 11. Industrial area for Central Shah Alam
Source: JPBD Semenanjung Malaysia 2004
In Figure 11, the industrial area is shown to cover almost one-quarter
of central Shah Alam. In fact this industrial area is the main catalyst for
the vibrancy of Shah Alam economic life. However, from these diagrams,
one might raise the question, ‘is there any specific formula in determining
the size of sections, type of land uses and the number of city centres’?
The answer remains in the hand of the city planners who plan for the
needs of the day.

Table 2. Total population by ethnic, Section 1– 24 Shah Alam, Selangor, 2000 S
ecti
on
Mal
ay
Oth
er
Bu
mip
ute
ra
Tota
l
Bu
mip
ute
ra
Ch
ines
e
In
dia
n
Oth
ers
Tota
l C
itiz
en
Fo
reig
ner
s
To
tal
1 8,627 246 8,873 - - 6 8,879 245 9,124
2 1,882 40 1,922 136 123 12 2,193 61 2,254
3 3,481 19 3,500 84 364 11 3,959 56 4,015
4 1,530 15 1,545 123 102 3 1,773 25 1,798
5 493 1 494 41 32 - 567 24 591
6 3,725 99 3,824 211 194 34 4,263 91 4,354
7 6,517 80 6,597 593 282 21 7,493 289 7,782
8 8,495 208 8,703 562 1,183 30 10,478 217 10,695
9 6,137 47 6,184 977 292 53 7,506 254 7,760
10 2,221 13 2,234 214 130 12 2,590 49 2,639
11 2,407 5 2,412 421 208 9 3,050 96 3,146
12 640 2 642 121 39 10 812 95 907
13 3,416 36 3,452 1,111 233 125 4,921 523 5,444
14 1,099 11 1,110 28 115 4 1,257 30 1,287
Sub-total 50,670 822 51,492 4,622 3,297 330 59,741 2,055 61,796
% 84.82 1.38 86.19 7.74 5.52 0.55
15 729 7 736 25 58 1 820 7 827
16 4,372 31 4,403 168 635 8 5,214 292 5,506
17 15,215 96 15,311 800 2,104 65 18,280 479 18,759
18 12,584 57 12,641 883 2,181 56 15,761 209 15,970
19 13,855 75 13,930 777 2,399 76 17,182 282 17,464
20 6,670 25 6,695 288 1,696 26 8,705 258 8,963
21 1,365 20 1,385 38 103 43 1,569 170 1,739
22 178 2 180 36 46 - 262 11 273
23 1,253 19 1,272 402 385 7 2,066 57 2,123
24 14,076 212 14,288 1,277 1,811 25 17,401 322 17,723
Sub-total 70,297 544 70,841 4,694 11,418 307 87,260 2,087 89,347
% 80.56 0.62 81.18 5.38 13.09 0.35
Total Population
120967 1366 122333 9316 14715 637 147001 4142 151143
% 83.22 6.34 10.01 0.43
Source: Statistic Department 2006
Table 2 showed the population structure of central Shah Alam. The
majority of its population are Malays, followed by Indians and Chinese.

Hence, Shah Alam is known as a Malay or Muslim city. Therefore the
public facilities provided for this city are suited towards accommodating
the requirement of this major ethnic group, although the ethnic groups
have access also to their respective religious needs.
Physically, the central Shah Alam is divided by the Federal
Highway. Thus the population in the table is also divided into two parts.
For convenience, let sections 1–14 stay in group one and sections 15-24
on the other side of the Federal Highway in group two. Though group one
has more sections it is less populated compared to group two. This is due
to the type of development allocation in the plan; residential area is
designated in group one area without industries while the type of
residential units developed in group two is the high density type – more
multi-storey and less detached building, accommodating perhaps the
needs of the industrial core of Shah Alam.
From preliminary observations it becomes obvious that some
components of the urban form in the study area display homogeneity.
Others are being made lively by activities throughout the day, seen such
as in the activities organised around the prayer house- the ‘surau’.
However, the Shah Alam lake area of 127.8 acres is where the essence of
a liveable city seems to take place. Besides acting as the green lung for
the city, the lake offers a variety of multi level activities with clear
specialised happenings according to time and space in the lake area.
Definitely, the lake area is strategically positioned to link people to
shopping points, recreational spots in an invigorating green environment,
to open spaces and to religious points. Indeed the micro urban forms in
the city centres evoke deeper meanings to those who seek tranquillity in
the midst of the hustle and bustle of heavy schedules of modern living in
the central Shah Alam area. The essence of liveable city is partly
captured within the lake area. More in-depth research needs to be carried
out.
CONCLUSION
In concluding this paper, all in all the urban form for a state like Selangor
can be distinguished into three levels, that is the metropolitan city form
(Shah Alam, Subang Jaya and Petaling Jaya) as the macro level, then the
whole city of Shah Alam as the meso level, finally urban forms in each
section representing the neighbourhood for the core city of Shah Alam.
However, the hierarchies of structures in the urban form such as roads
and highways and variations of land-uses filling the spaces in between
these structures determine the densities of the urban forms, irrespective of

the levels of urban forms. Thus the micro urban forms that are the
neighbourhood become the basis of delving into the liveability of Shah
Alam. Still, the meaning of a liveable city carries a lot more than just
filling the whole space of the city.
Going by the preliminary findings, from the observations, the
research establishes a strong relationship between the urban form and the
liveability of the city. After 30 years of developing the city centre, the
shaping–up of the core city has almost reached its final touch. People had
started to move into the core city strongly in the early 1970s based on
phases of the development of each section. From the age of the trees
lining-up the major roads in the city’s central area the physical
environment in the centre has now achieved tranquillity with lush green
canopies. Being planned as a low density development the city central
area has maintained the set density and therefore complied with the
original planned requirement. From the Central Business District (CBD)
the low density development has increased slowly to the periphery, hence
making the city a private ‘transportation dependent city’. Yet being
private transport dependent does not cause much problem as the urbanites
seem to be well endowed with transportation facilities as well as access to
alternatives.
REFERENCES
Alberti, M. 2000. Urban form and ecosystem dynamics: empirical evidence and
practical implications. William K, Burton E, & Jenks, M. (eds.). Achieving
sustainable urban form. London: E. & F.N. Spon.
Ali Madanipour. 1996. Design of urban space: an inquiry into a socio-spatial
process. Newcastle-upon-Tyne: John Wiley & Sons.
Auckland City. 2000. Growing our city: through liveable communities 2050.
Auckland City.
Cohen, N. 2001. Urban planning conservation and preservation. New York:
McGraw-Hill.
Douglass, M., Trung Quang Le, Cameron Kawika Lowry, Hao Thien Nguyen,
Anh Nguyen Pham, Nghi Dong Thai, & Hernani Yulinawati. 2004. The
livability of mega-urban regions in Southeast Asia - Bangkok, Ho Chi Minh
City, Jakarta and Manila compared. International Conference on The
Growth Dynamics of Mega-Urban Regions in East and Southeast Asia, 24 -
25 June 2004, Singapore.
Dovey, K. 1999. Framing places: mediating power in built form. London: Routledge.
Eastaway, M.P. & Stoa, E. 2004. Dimensions of housing and urban
sustainability. Journal of Housing and the Built Environment, (19):1-5.
Frey, H. 1999. Designing the city: towards a more sustainable urban form.

London: E.& F.N. Spon.
Girardet, H. 2004. Cities people planet: liveable cities for a sustainable world.
West Sussex, UK: John Wiley & Sons Ltd.
Google Earth. 2007. http://earth.google.com/tour/thanks-win4:html. Retrieved
29 January.
Haughton, G. & Hunter, C. 1994. Sustainable cities. London: Jessica Kingsley
Publishers Ltd.
Heuvel, C. 2000. The built environment and its development. Millward, D. (ed.).
Construction and the built environment. London: Longman.
Jabatan Perangkaan Malaysia. 2006. Cabutan daripada banci penduduk dan
perumahan 2000: taburan penduduk mengikut kawasan Pihak Berkuasa
Tempatan dan Mukim.
JPBD. 2003. Lapuran Pemeriksaan Rancangan Struktur Negeri Selangor.
Jabatan Perancangan Bandar dan Desa Negeri Selangor dan Jabatan
Perancangan Bandar dan Desa Semenanjung Malaysia.
JPBD. 2004. Draf Rancangan Tempatan Daerah Petaling dan Sebahagian
Daerah Klang. Jabatan Perancangan Bandar dan Desa Semenanjung
Malaysia, Jabatan Perancangan Bandar dan Desa Negeri Selangor, Majlis
Bandaraya Shah Alam, Majlis Bandaraya Petaling Jaya dan Majlis
Perbandaran Subang Jaya.
Kivell, P. 1993. Land and the city: patterns and processes of urban change.
London: Routledge.
Knox, P.L. 1994. Urbanization: an introduction to urban geography. New
Jersey: Prentice-Hall.
Lim, Heng Kow 1978. The evolution of the urban system in Malaya. Kuala
Lumpur: Penerbit Universiti Malaya.
Macionis, J. & Parrillo, V. 1998. Cities and urban life. New Jersey: Prentice
Hall, Inc.
Majlis Bandaraya Shah Alam. 2006. Maklumat gunatanah Shah Alam.
Malaysia. 2006. Ninth Malaysia Plan. Putrajaya: Prime Minister's Department.
Martin, L. 1972. The grid as generator. Martin, L. & March, L. (eds.). Urban
space and structures. London: Cambridge University Press.
Martin, L. & March, L. (eds.). 1972. Urban space and structures. London:
Cambridge University Press.
Metcalf, G. 2002. Transportation for a livable city: the path to a livable city.
www.livablecity.org/resources/tlc_path.pdf. Retrieved 19 January 2006.
Newman, P. & Kenworthy, J. 2000. Sustainable urban form: the big picture. In
Achieving sustainable urban form, edited by William, K., Burton, E. and
Jenks, M. London: E & FN Spon.
Newton, P.W. (ed.). 1997. Re-shaping cities for a more sustainable future:
exploring the link between urban form, air quality, energy and greenhouse
gas emissions. Melbourne: Commonwealth Scientific and Industrial
Research Organization Building, Construction and Engineering.
Ooi, Jin-Bee. 1963. Land, people and economy in Malaya. London: Longmans,
Green and Co Ltd.

Ravetz, J. 2000. City region 2020: integrated planning for a sustainable
environment. London: Earthscan Publications Ltd.
Sharifah Norazizan Syed Abdul Rashid, Aishah Edris, Nobaya Ahmad. (eds.).
2002. Cities in the 21st century: urban issues and challenges. Serdang:
Universiti Putra Malaysia Press.
Shortell, T. 2005. Inequality in contemporary American society: globalization.
www.shortell.org/courses/cs3/globalization.html. Retrieved 14 January
2006.
Timmer, V. & Seymoar, N.K. 2004. The livable city. World urban forum 2006.
Vancouver. www.icsc.ca.
Tsai, Yu-Hsin. 2004. Quantifying urban form: compactness versus 'sprawl'.
Urban Studies, 42(1): 141-161.
Unit Perancang. 1978. Outline Report on Development Progress in Shah Alam:
Yunit Perancang PKNS.
White, R. 1994. The sustainable city – illusion or necessity. Regional Conference
of the International Geographical Union. Prague.www.utoronto.ca/env
papers/whiter/c_prague-paper.html. Retrieved 16 Jun 2004.
Institute for Environment and Development (LESTARI),
Universiti Kebangsaan Malaysia,
43600 UKM, Bangi, Selango, MALAYSIA.