Embed Size (px)
Citation preview

Graphical User Interfaces 01
Visualization

Graphical User Interfaces 01
Why Visualization?
– More than 75% of the information we perceive daily is collected through our eyes.
– Visual communication is more or less independent from cultural or national backgrounds.
– Visual communication is at times more economic and faster than words or sounds.
Graphical User Interfaces 01
Elemental Aspects of Visualization
Symbols, diagrams and animations can help explain complex processes orrelations of objects in the real world.
Lufthansa Flight Manual, 1998

Graphical User Interfaces 01
Elemental Aspects of Visualization
Visualization simplifies explanations and can work more precise than verbal communication.
Magiker Manual, IKEA, 2002
Graphical User Interfaces 01
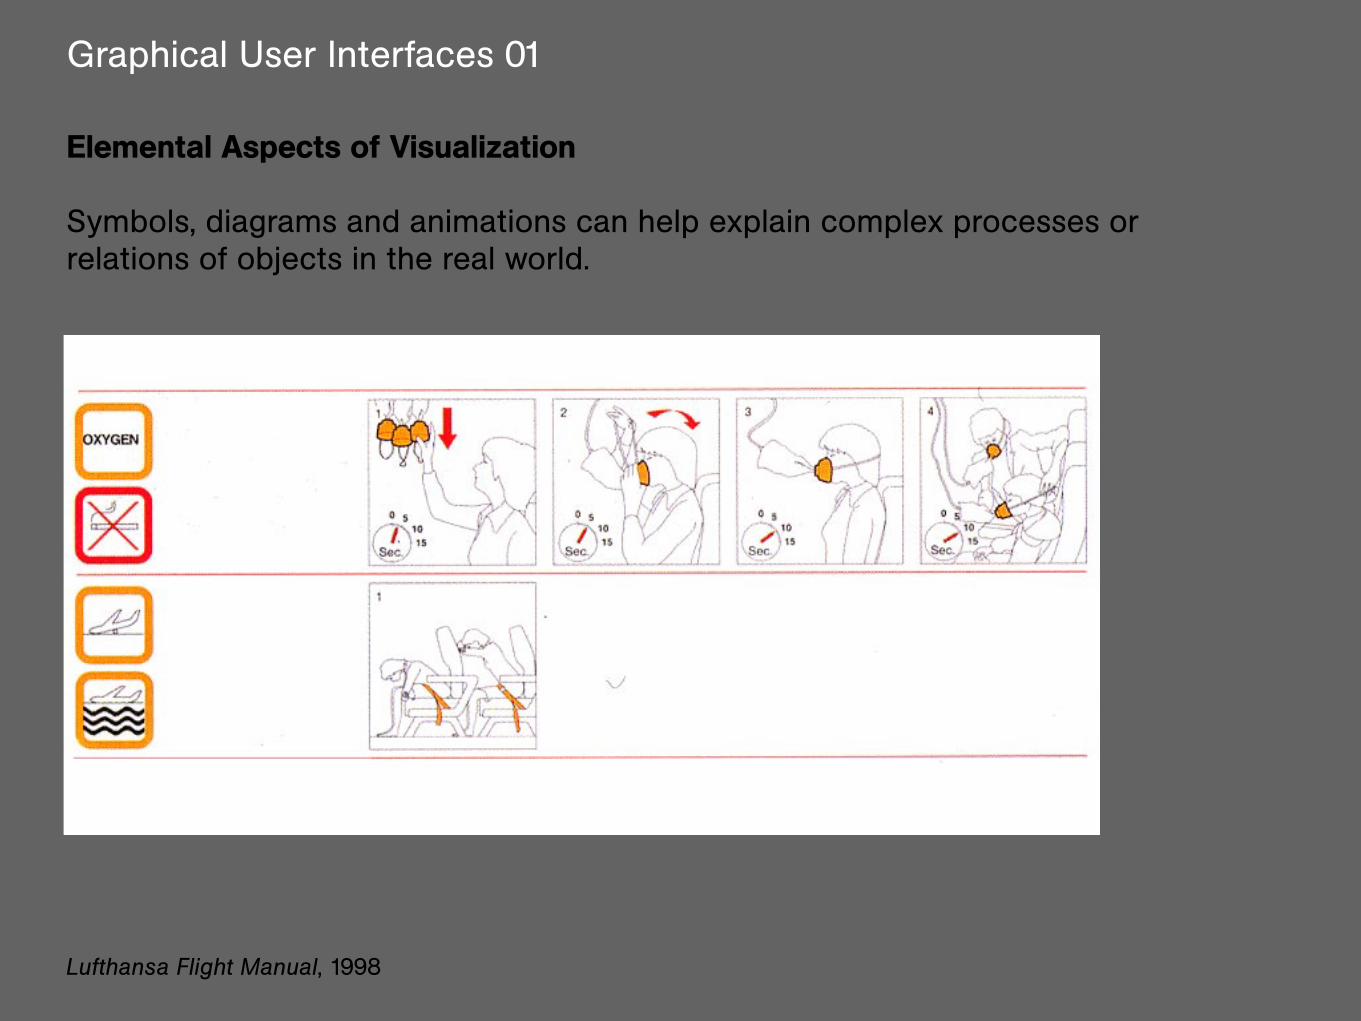
Elemental Aspects of Visualization
Visualization helps interpret raw data in order to discover hidden patterns, relations and trends.
Graphical User Interfaces 01
Elemental Aspects of Visualization
Visualization enables and simplifies access to large and complex data sets, to find or display:
– specific information within larger information clusters.– relations and connections within seemingly unrelated bits of data.– multiple views of one data set.– specific information in context to other information.

Graphical User Interfaces 01
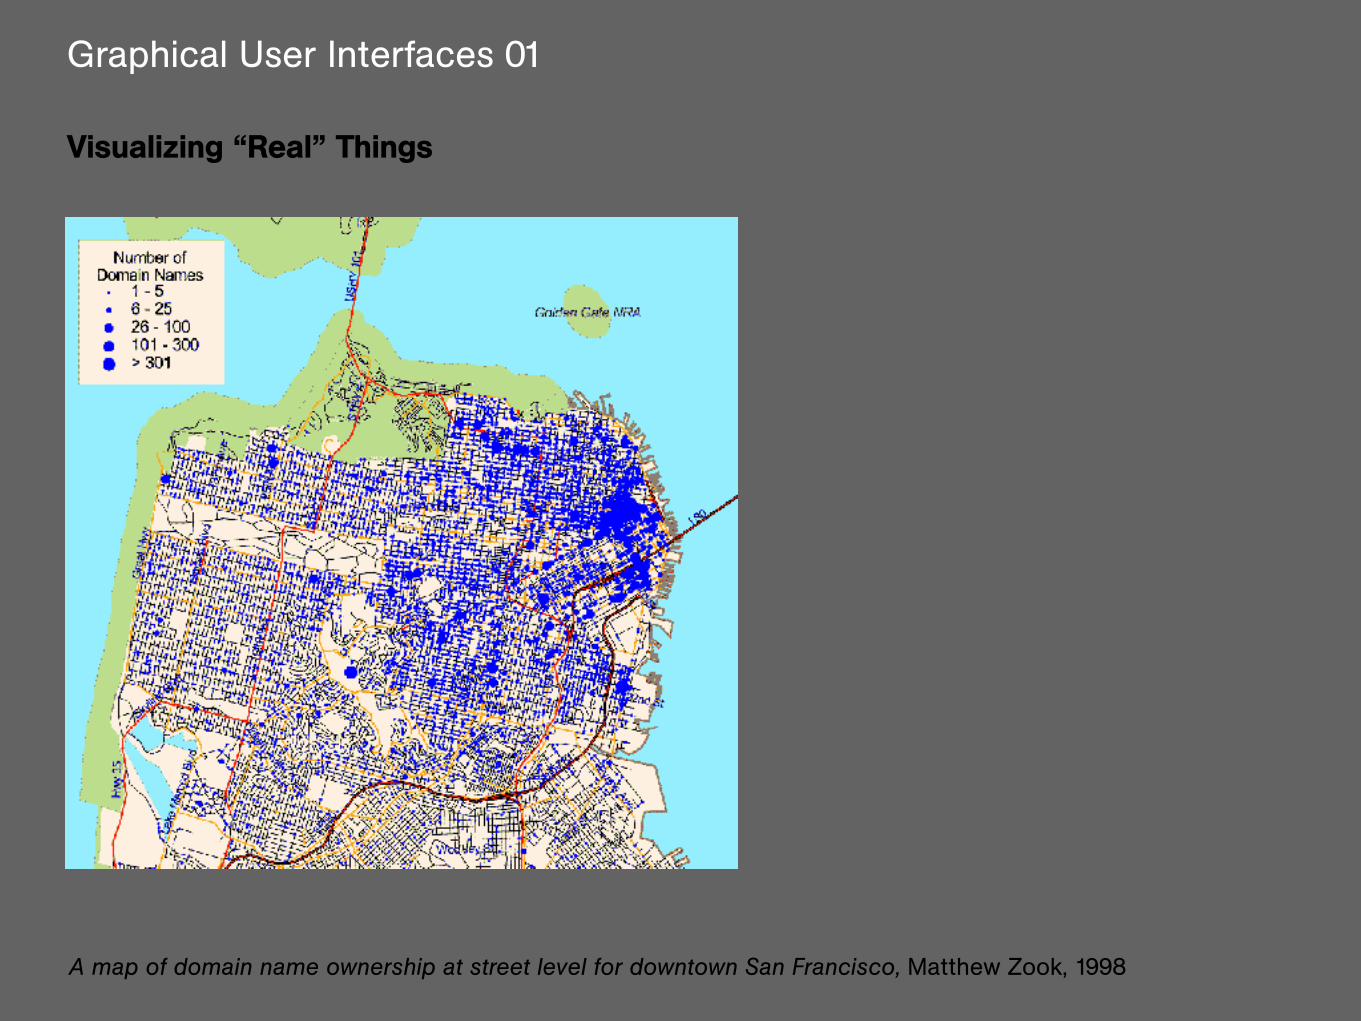
Visualizing “Real” Things
Map of China, originally engraved in stone about 1100 A.D.

Graphical User Interfaces 01
Visualizing “Real” Things
Feldtbüch der Wundartzney, Hans von Gersdorff, 1517
Graphical User Interfaces 01
Visualizing “Real” Things
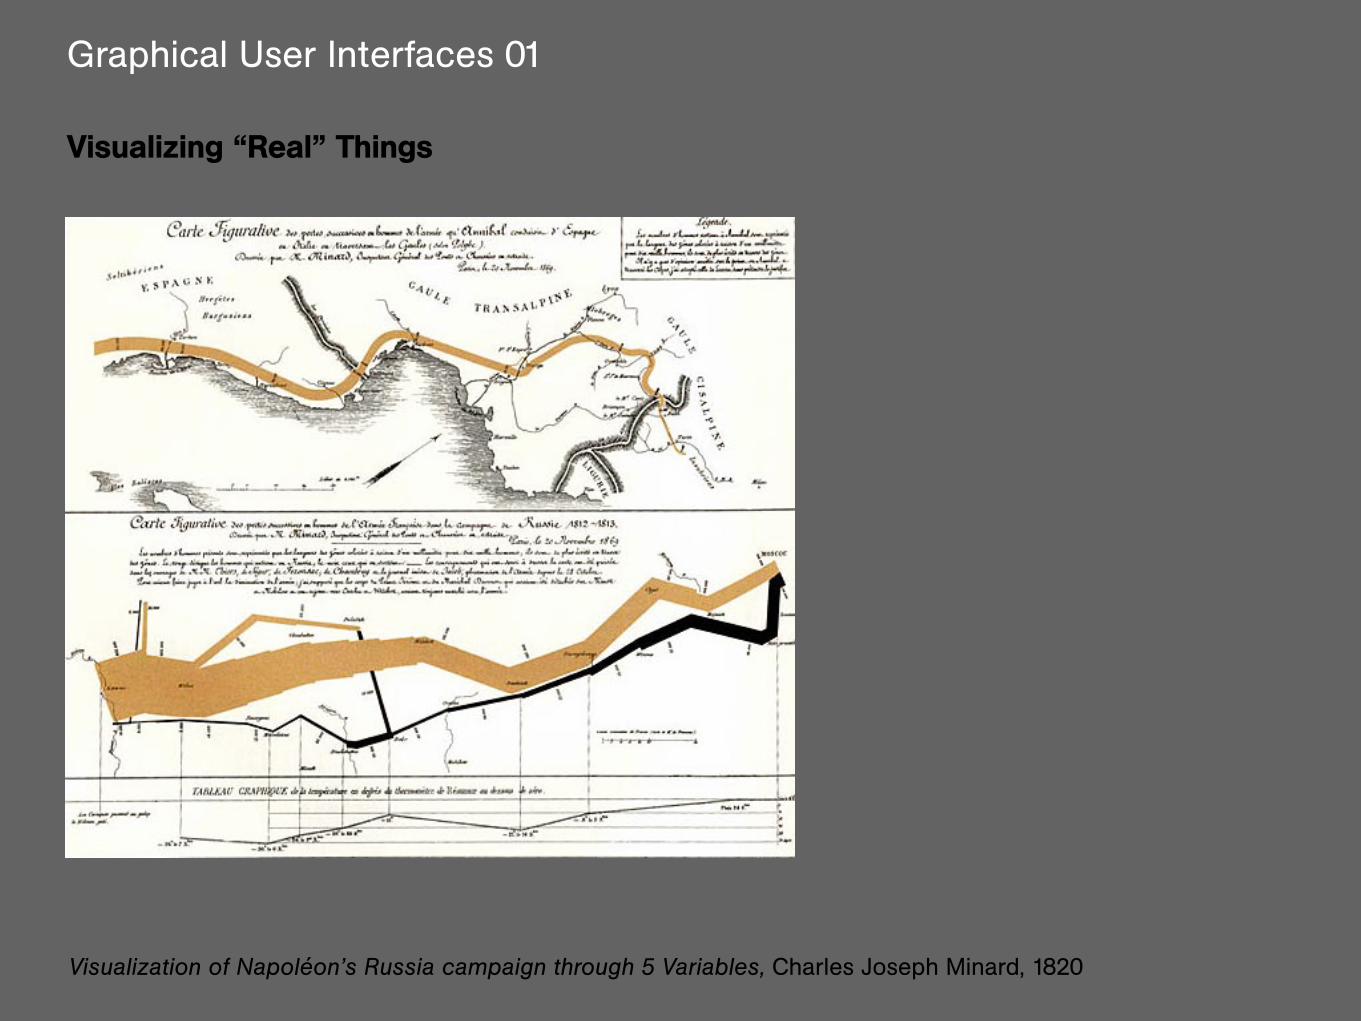
Visualization of Napoléon’s Russia campaign through 5 Variables, Charles Joseph Minard, 1820

Graphical User Interfaces 01
Visualizing “Real” Things
The Royal Road to Card Magic, Jean Hugard and Frederick Braué, 1948

Graphical User Interfaces 01
Visualizing “Real” Things
Map of New York City, Hermann Bollmann, ca. 1960

Graphical User Interfaces 01
Visualizing “Real” Things
Sketch of Network Paradigms, David Baran, ca. 1964
Graphical User Interfaces 01
Visualizing “Real” Things
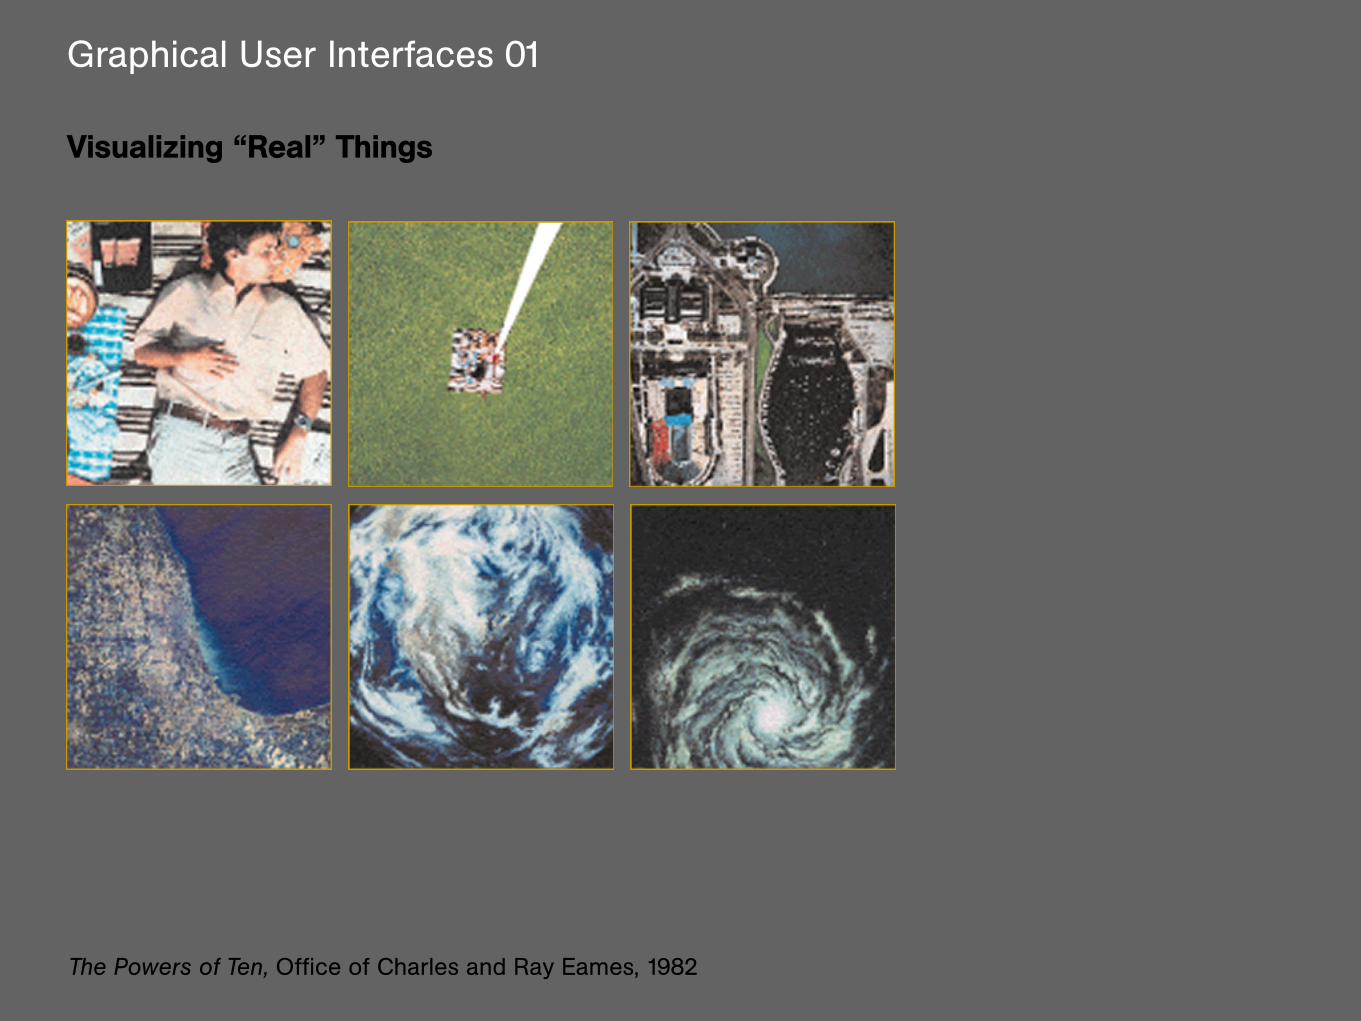
The Powers of Ten, Office of Charles and Ray Eames, 1982
Graphical User Interfaces 01
Visualizing “Real” Things
Level of Detail, Dave Small. MIT, 1993

Graphical User Interfaces 01
Visualizing “Real” Things
Rock and Roll is here to pay, Steve Chappel and Reebee Garofalo, 1975

Graphical User Interfaces 01
Visualizing “Real” Things
Medical Access, Richard Saul Wurman, 1978

Graphical User Interfaces 01
Visualizing “Real” Things
Swiss National Railway Scenic Route Indicator, Hoffmann-Stahli, 1996

Graphical User Interfaces 01
Visualizing “Real” Things
British Library Orientation Diagrams, Colette Miller, Information Design, 1999

Graphical User Interfaces 01
Visualizing “Real” Things
Simulation of a Thunderstorm, Data from the NCSA, redesigned by Edward R. Tufte

Graphical User Interfaces 01
Visualizing “Real” Things
Flight Master 2000, Chapman Bounford & Assoc., 1999

Graphical User Interfaces 01
Visualizing “Real” Things
Vietnam Veterans Memorial in Washington D.C., designed by Maia Lyn
Graphical User Interfaces 01
Visualizing “Real” Things
A map of domain name ownership at street level for downtown San Francisco, Matthew Zook, 1998

Graphical User Interfaces 01
Visualizing “Real” Things
Radio spectrum allocations in the US, National Telecommunications and Information Administration, 1996

Graphical User Interfaces 01
Visualizing “Real” Things
Gold Plate on Pioneer 10 and 11, NASA, 1972
Graphical User Interfaces 01
Information Visualization
“Information Visualization is the use of computer-supported interactive visualrepresentation of abstract data to amplify cognition.” (XEROX PARC, User Interface Research Group).
“Information Visualization combines aspects of scientific visualization, human-computer interfaces, data-mining, imaging and graphics.”(Gershon und Eick, 1997).

Graphical User Interfaces 01
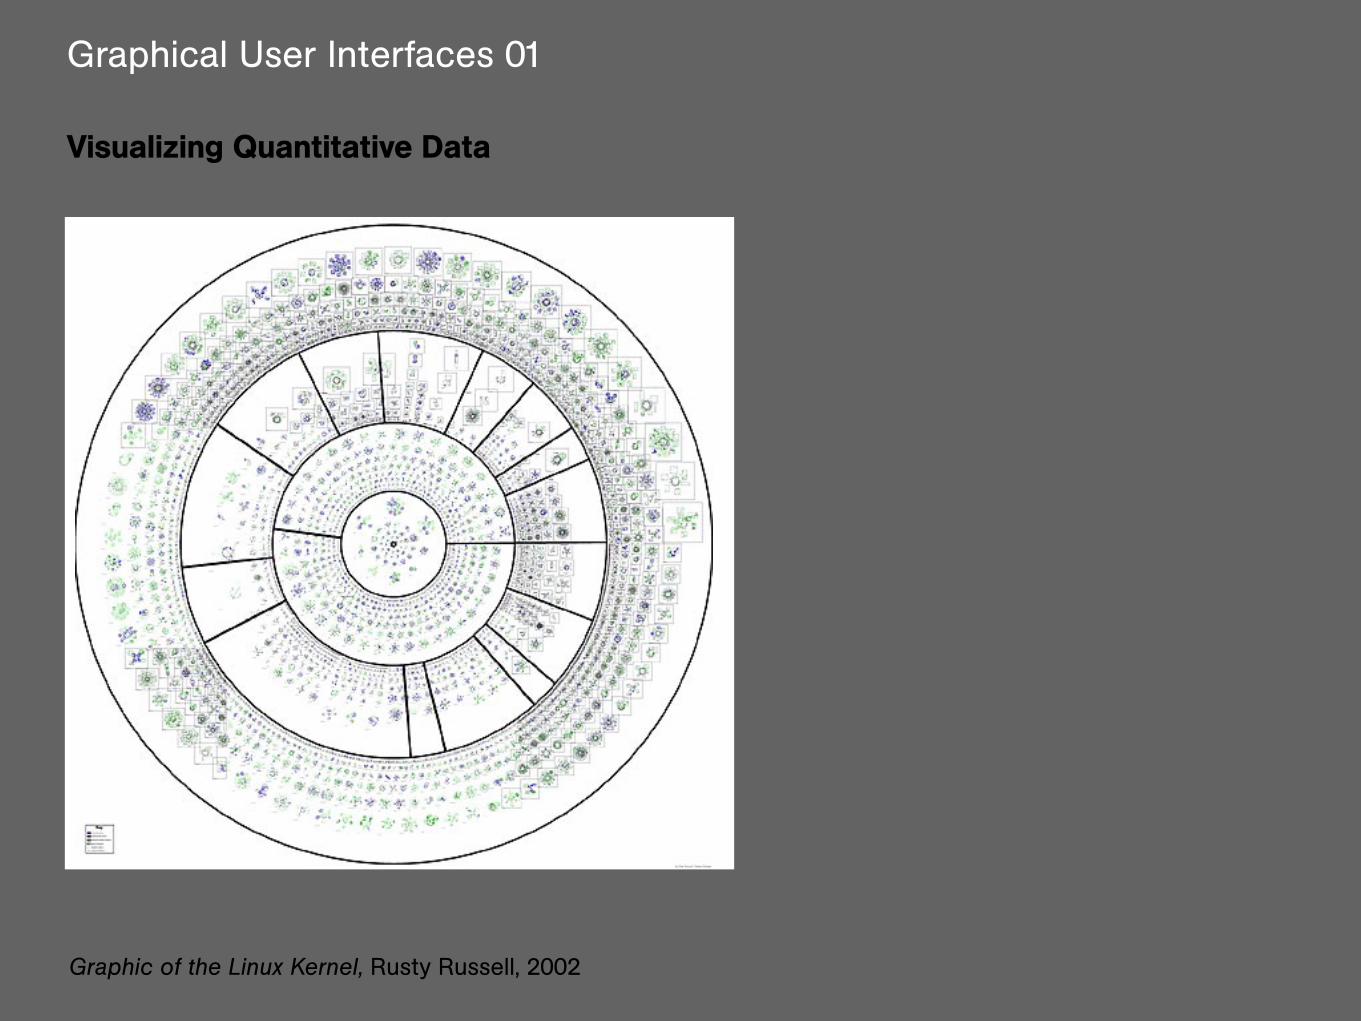
Visualizing Quantitative Data
3D Visualization of Earthquake Epicenters, NCSA 1996

Graphical User Interfaces 01
Visualizing Quantitative Data
GeoURL, A location-to-URL reverse directory, Joshua Schachter, 1999

Graphical User Interfaces 01
Visualizing Quantitative Data
WebInforme Mapping Tool, Lisa Jevbratt, 2001

Graphical User Interfaces 01
Visualizing Quantitative Data
Cartogram of Internet Users, Antonio Scarponi, 2001
Graphical User Interfaces 01
Visualizing Quantitative Data
Graphic of the Linux Kernel, Rusty Russell, 2002

Graphical User Interfaces 01
Using Metaphors
Perspective Wall, Xerox PARC, 1991

Graphical User Interfaces 01
Using Metaphors
Document Lens, Xerox PARC, 1992

Graphical User Interfaces 01
Cone Tee, Xerox PARC, 1992
Using Metaphors

Graphical User Interfaces 01
Using Metaphors
Modified History Display in Mosaic Browser, 1995

Graphical User Interfaces 01
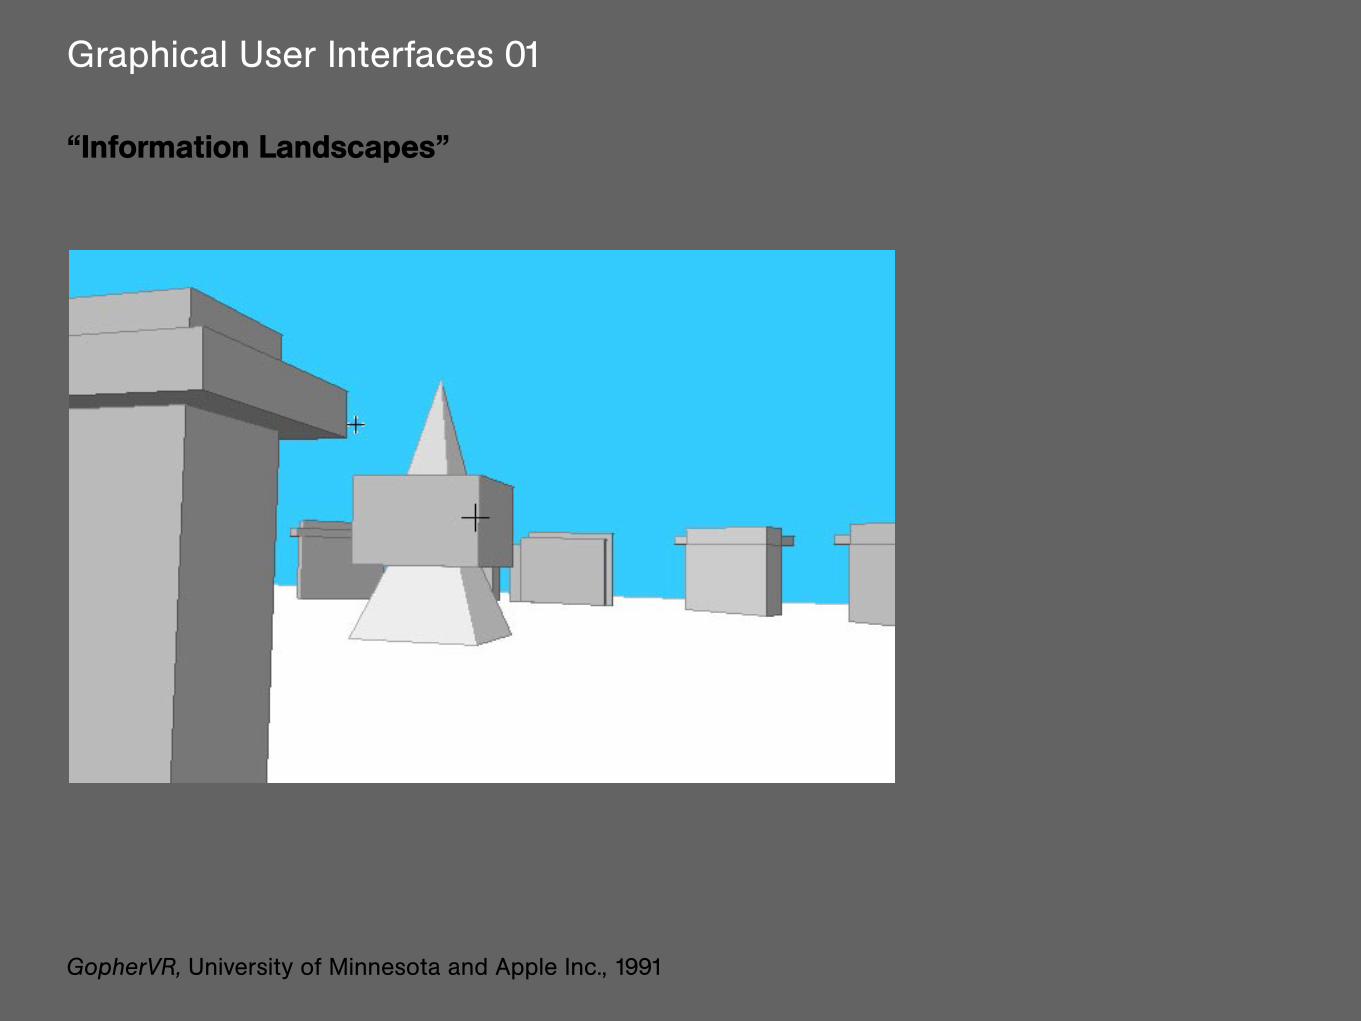
“Information Landscapes”
Conceptual Cybermap, John December, 1992
Graphical User Interfaces 01
“Information Landscapes”
GopherVR, University of Minnesota and Apple Inc., 1991

Graphical User Interfaces 01
“Information Landscapes”
File System Navigator, Joe Tesler, Silicon Graphics, 1993

Graphical User Interfaces 01
“Information Landscapes”
MineSet, Silicon Graphics, 1993

Graphical User Interfaces 01
“Information Landscapes”
Information Landscapes, Students at the Visible Language Workshop, MIT, 1994

Graphical User Interfaces 01
“Information Landscapes”
AlphaWorld, Roland Vilett, ca. 1998
Graphical User Interfaces 01
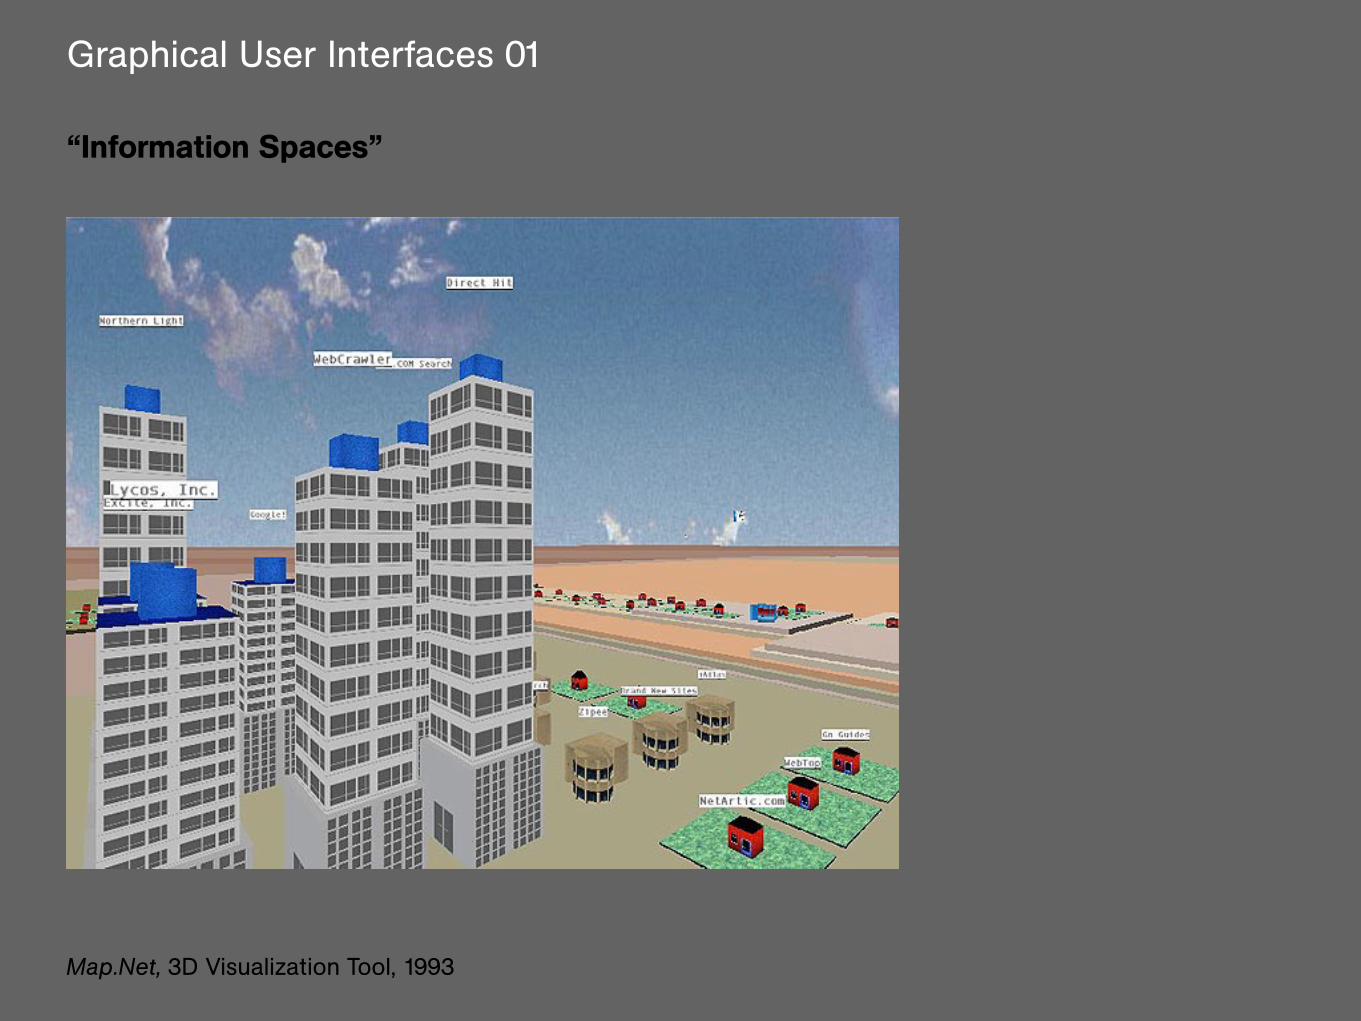
“Information Spaces”
Map.Net, 3D Visualization Tool, 1993
Graphical User Interfaces 01
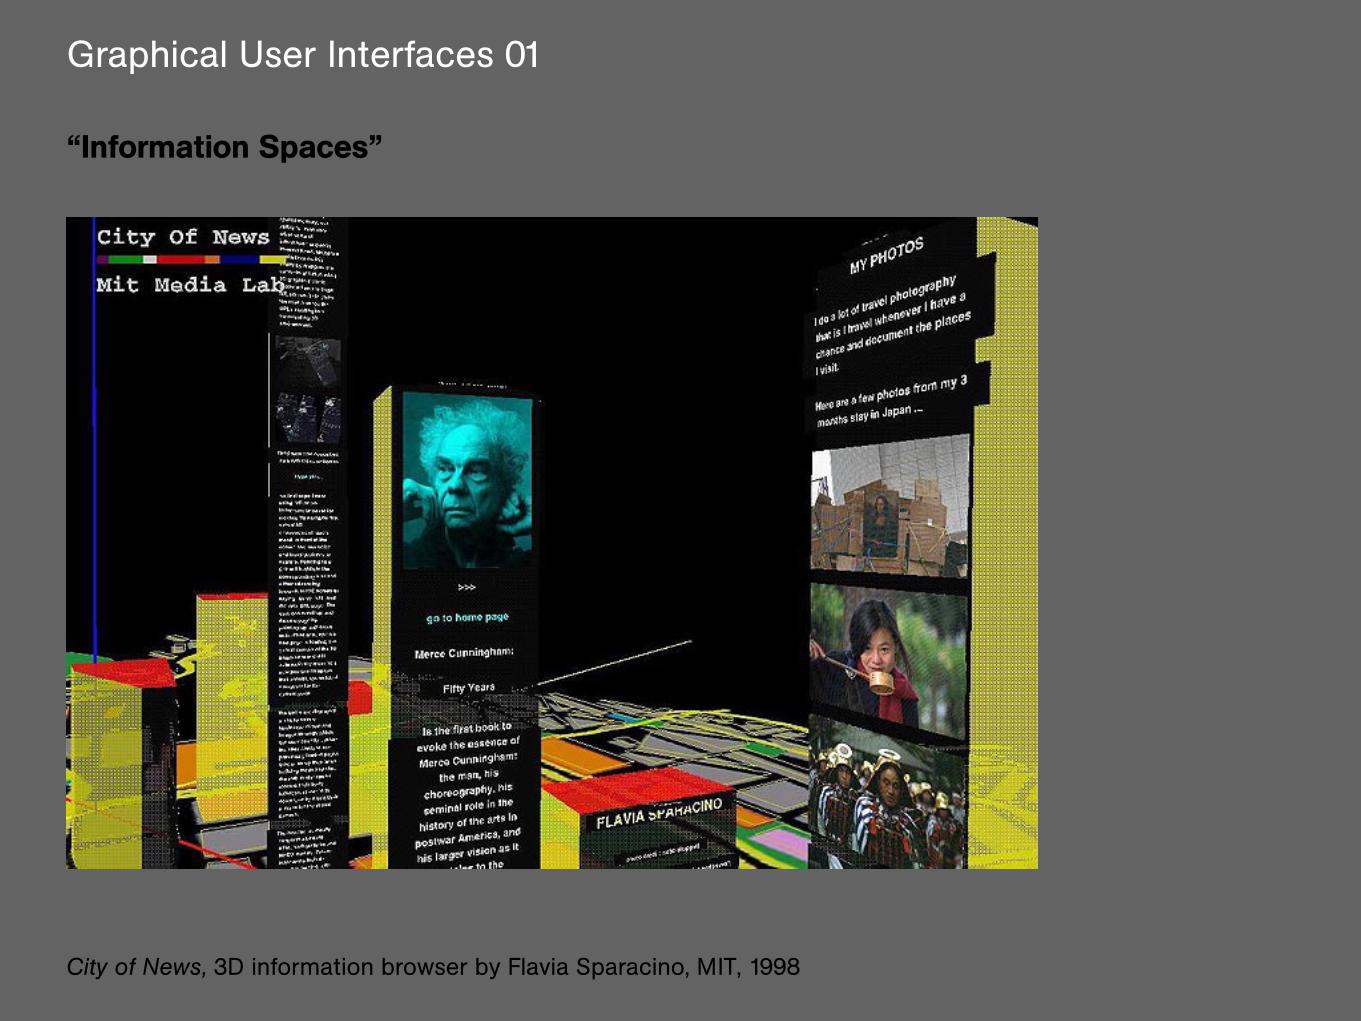
“Information Spaces”
City of News, 3D information browser by Flavia Sparacino, MIT, 1998

Graphical User Interfaces 01
“Information Spaces”
Visualization Study of the NSFNET, Donna Cox and Robert Patterson, NCSA, 1992

Graphical User Interfaces 01
“Information Spaces”
Global Topology of the MBone, Tamara Munzer et al, 1993
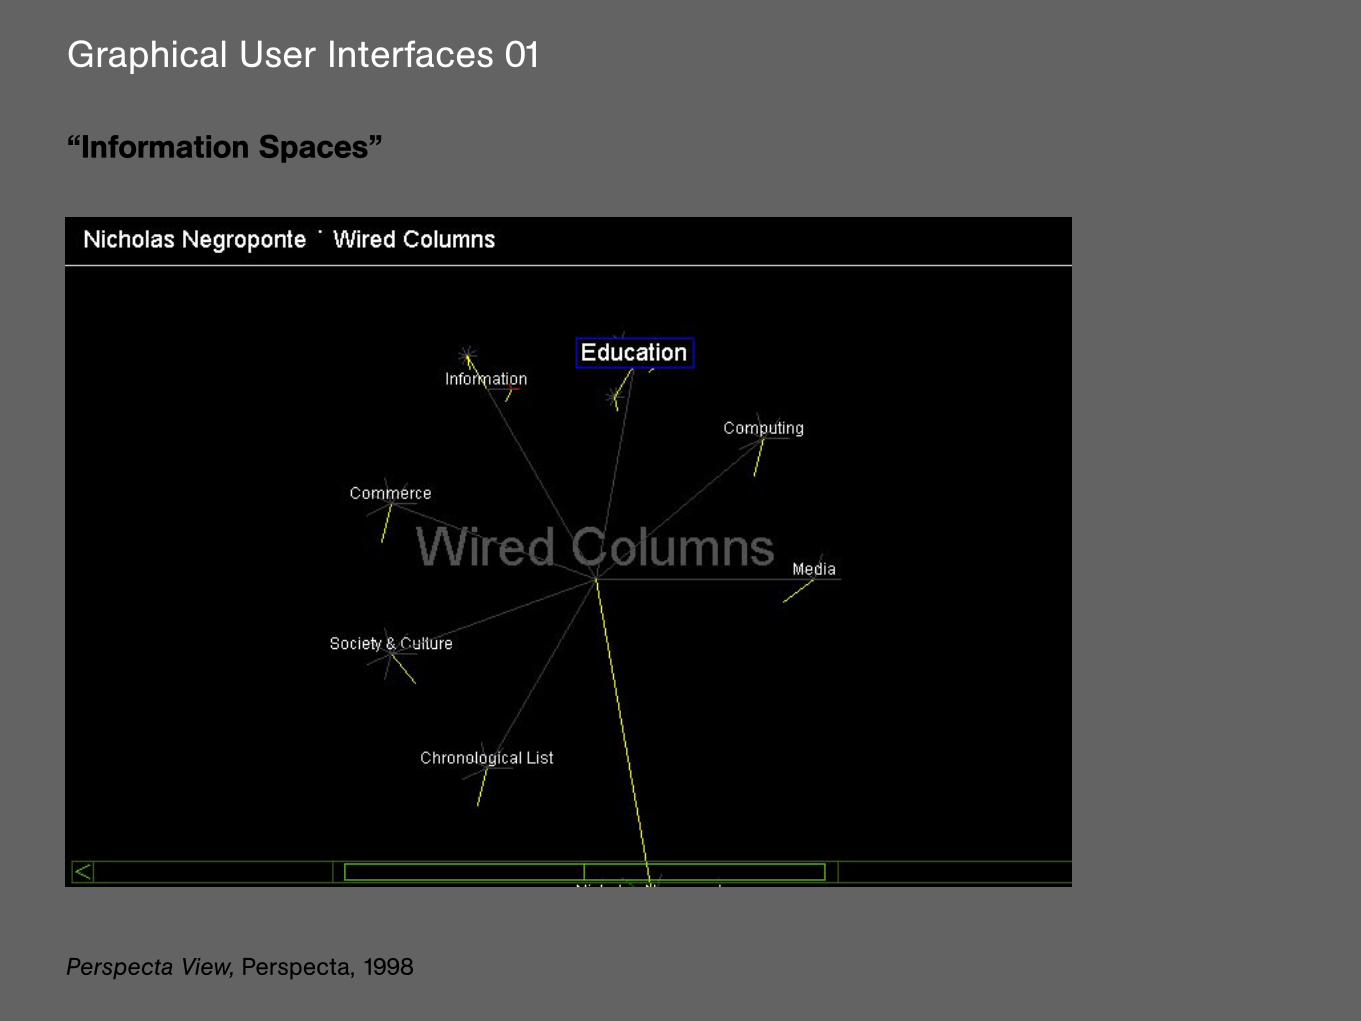
Graphical User Interfaces 01
“Information Spaces”
Perspecta View, Perspecta, 1998

Graphical User Interfaces 01
“Information Spaces”
I/O/D Webstalker, 1998
Graphical User Interfaces 01
“Information Spaces”
Financial Views, Lisa Strausfeld and Eerl Renisson, MIT, 1994

Graphical User Interfaces 01
“Information Spaces”
Shakespeare Project, David Small, MIT, 1996
Graphical User Interfaces 01
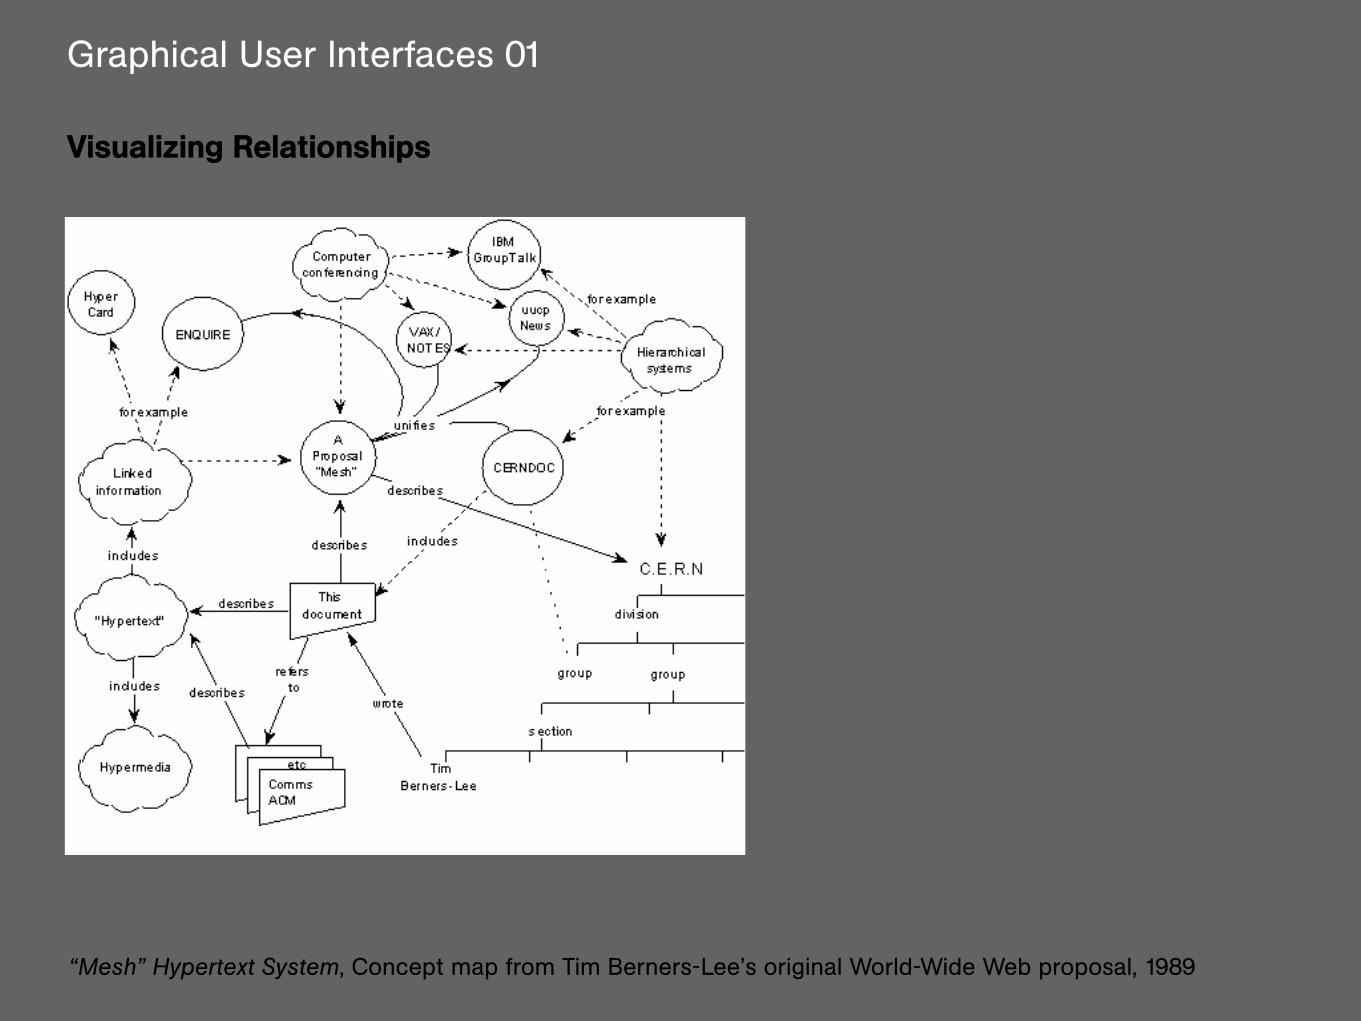
Visualizing Relationships
“Mesh” Hypertext System, Concept map from Tim Berners-Lee’s original World-Wide Web proposal, 1989

Graphical User Interfaces 01
Visualizing Relationships
Hotsauce, Apple’s Meta Content File Format developped by R.V.Guha., 1994

Graphical User Interfaces 01
Visualizing Relationships
Hyperbolic Trees, 1994

Graphical User Interfaces 01
Visualizing relationships
Hyperspace, 1997

Graphical User Interfaces 01
Visualizing Relationships
Walrus Visualisation Tool, Young Hyun, Cooperative Association for Internet Data Analysis (CAIDA), 2000
Graphical User Interfaces 01
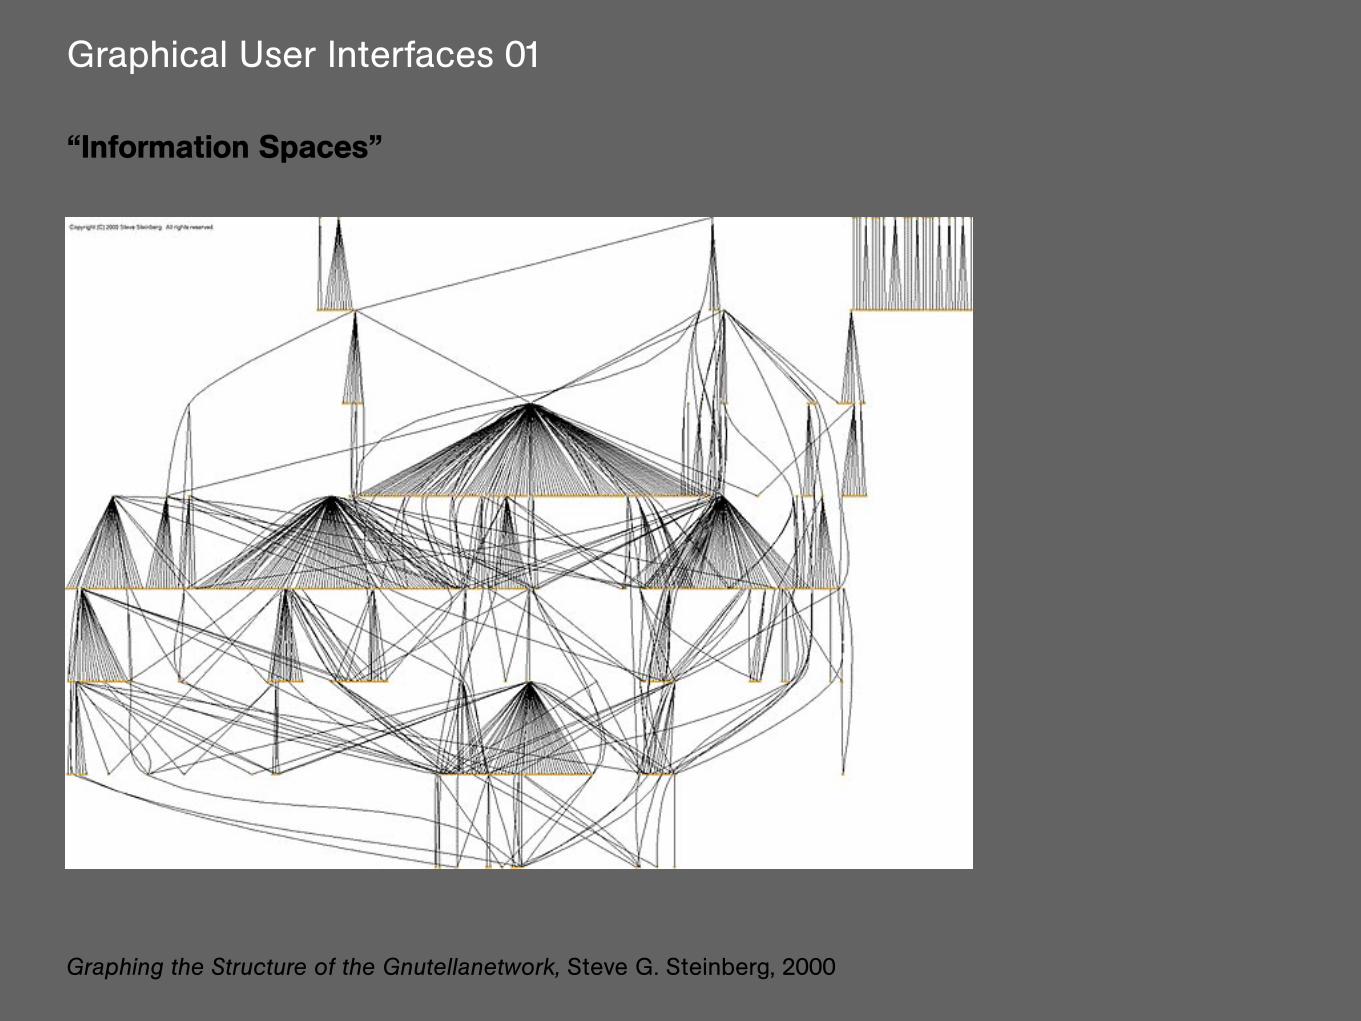
“Information Spaces”
Graphing the Structure of the Gnutellanetwork, Steve G. Steinberg, 2000
Graphical User Interfaces 01
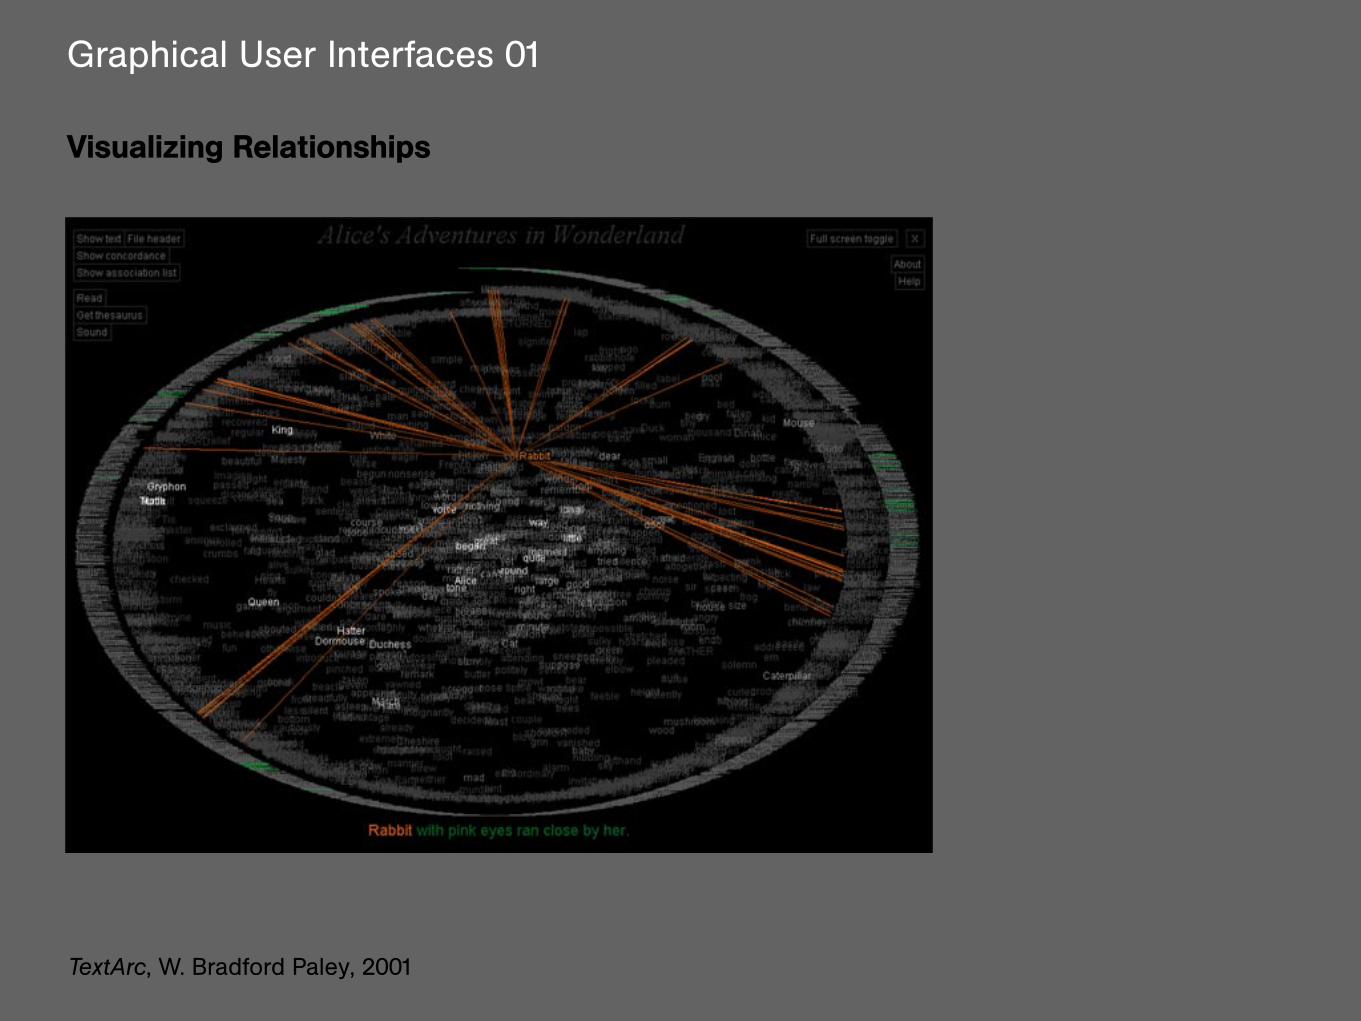
Visualizing Relationships
TextArc, W. Bradford Paley, 2001

Graphical User Interfaces 01
Visualizing Relationships
Cobot Map of Social Relations, Charles Isbell and Michael Kearns, 2000
Graphical User Interfaces 01
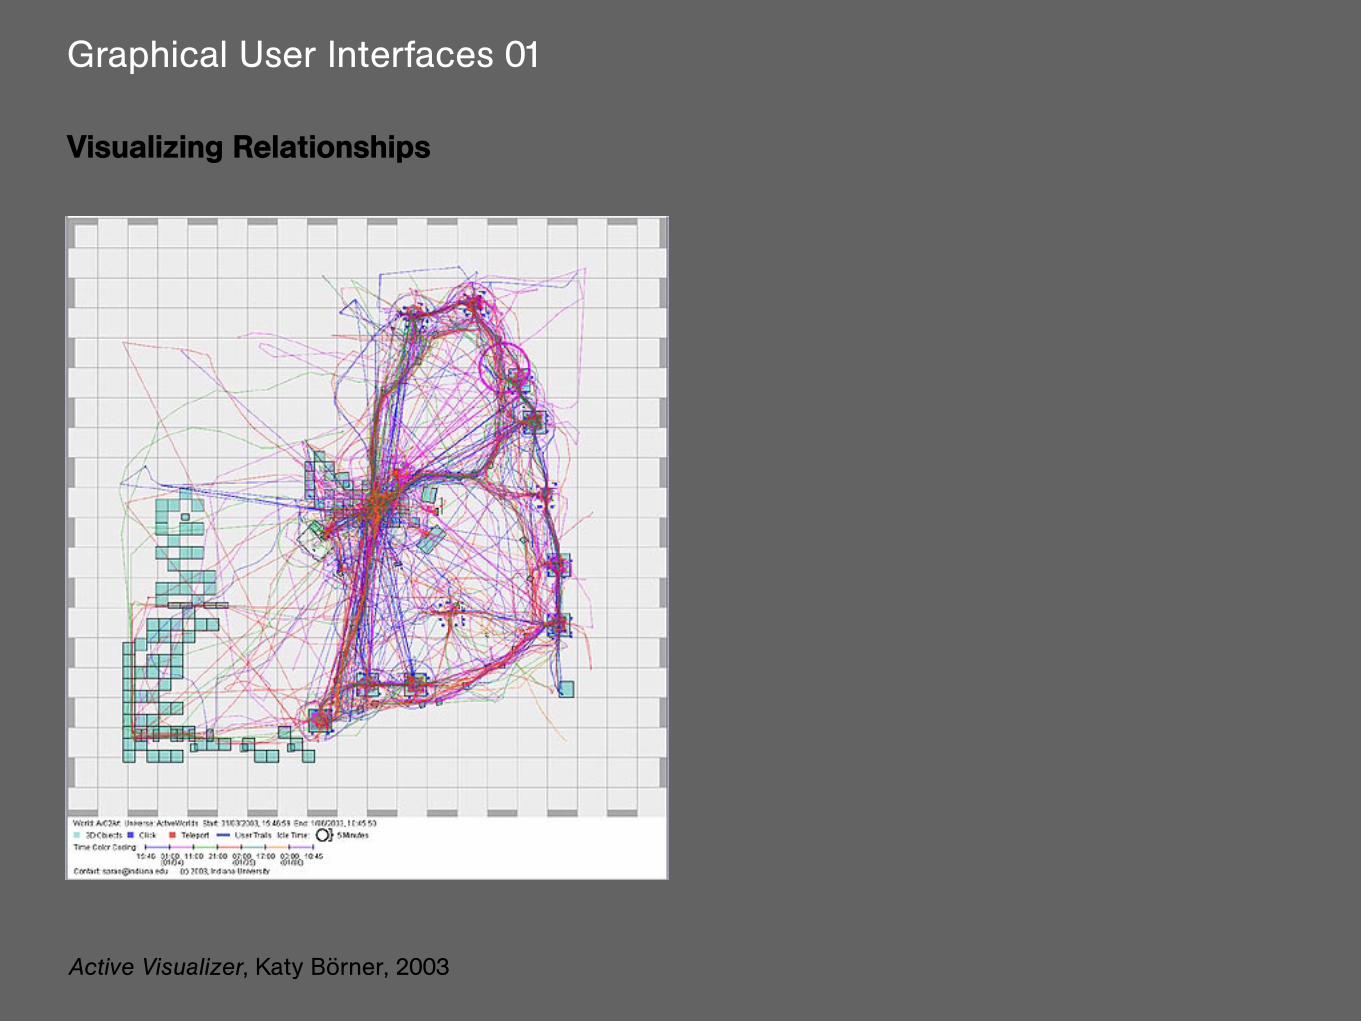
Visualizing Relationships
Active Visualizer, Katy Börner, 2003

Graphical User Interfaces 01
Visualizing Relationships
Valence Site Diagram, Benjamin Fry, 2002

Graphical User Interfaces 01
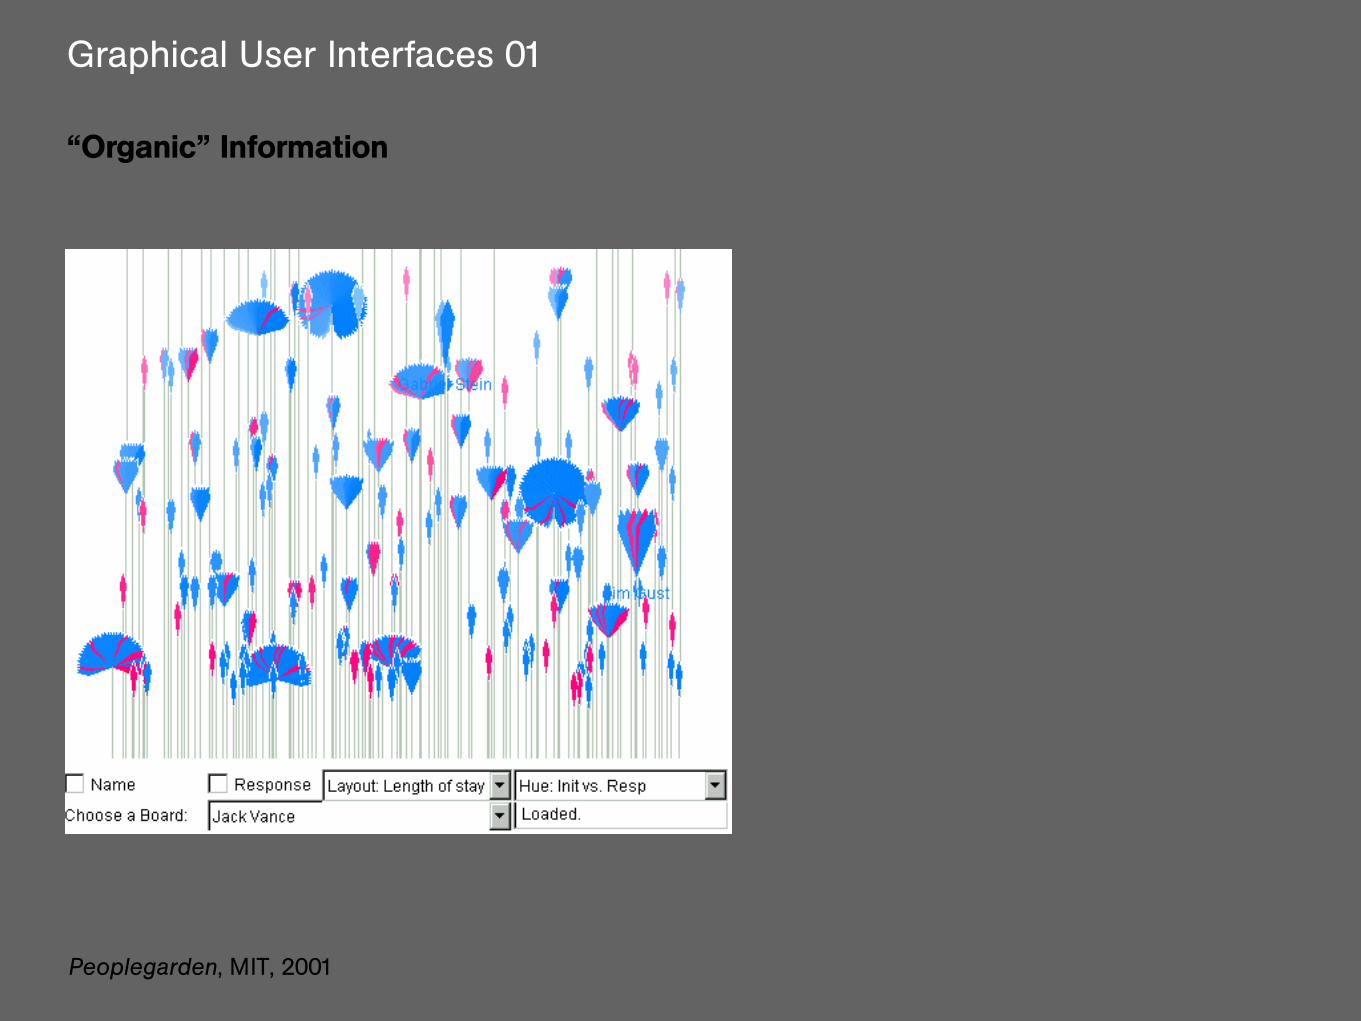
“Organic” Information
Lumeta, Map of a Corporate Intranet, 2002
Graphical User Interfaces 01
“Organic” Information
Peoplegarden, MIT, 2001

Graphical User Interfaces 01
“Organic” Information
Anemone Site Tracker, Benjamin Fry, MIT, 2003
Graphical User Interfaces 01
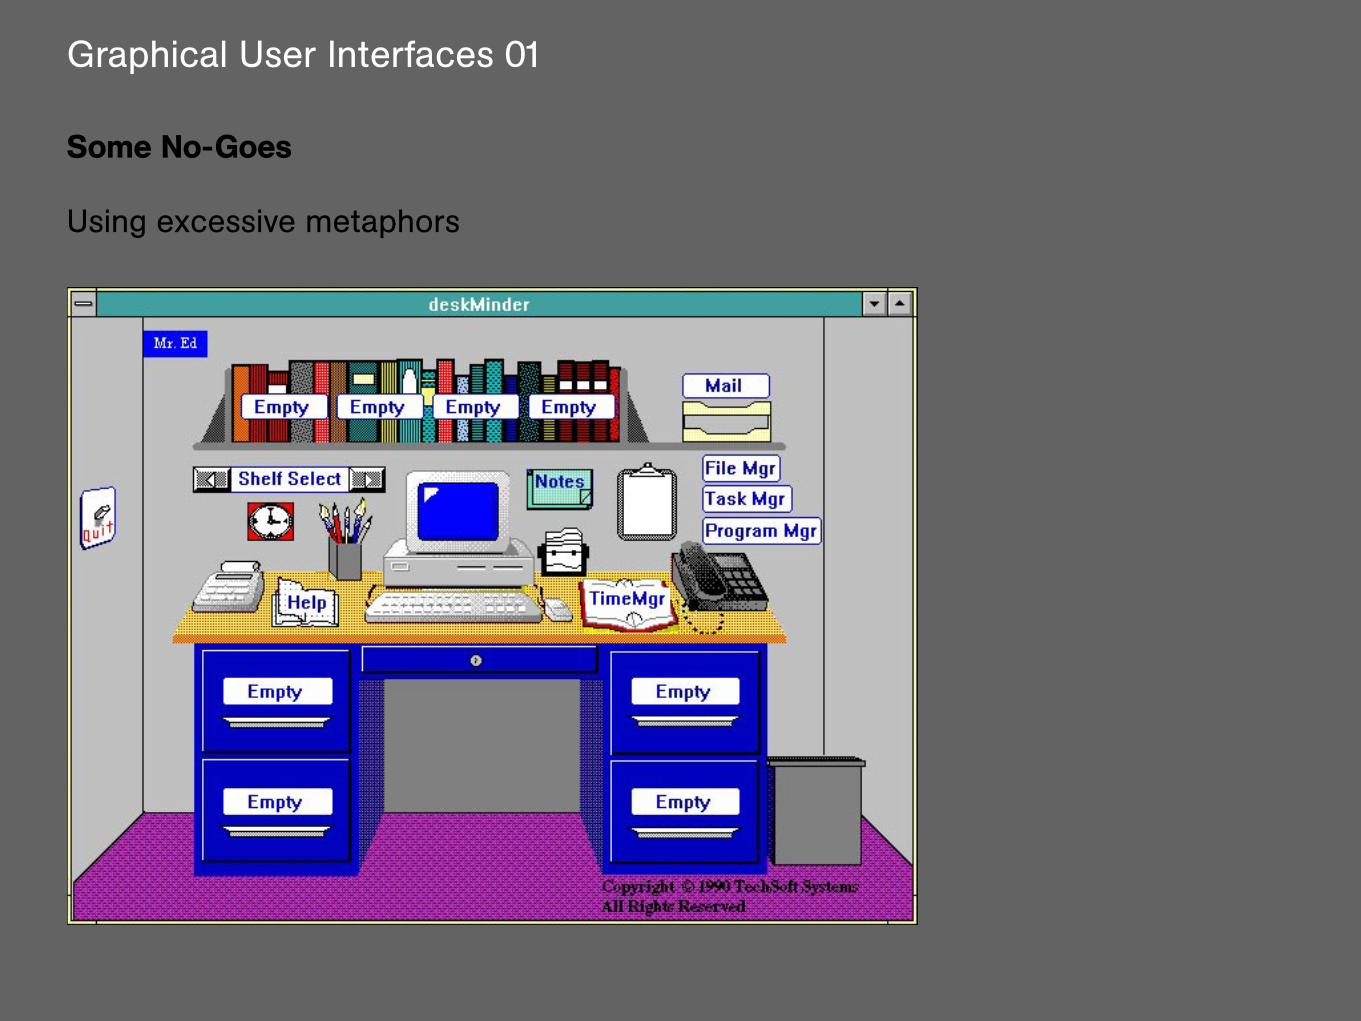
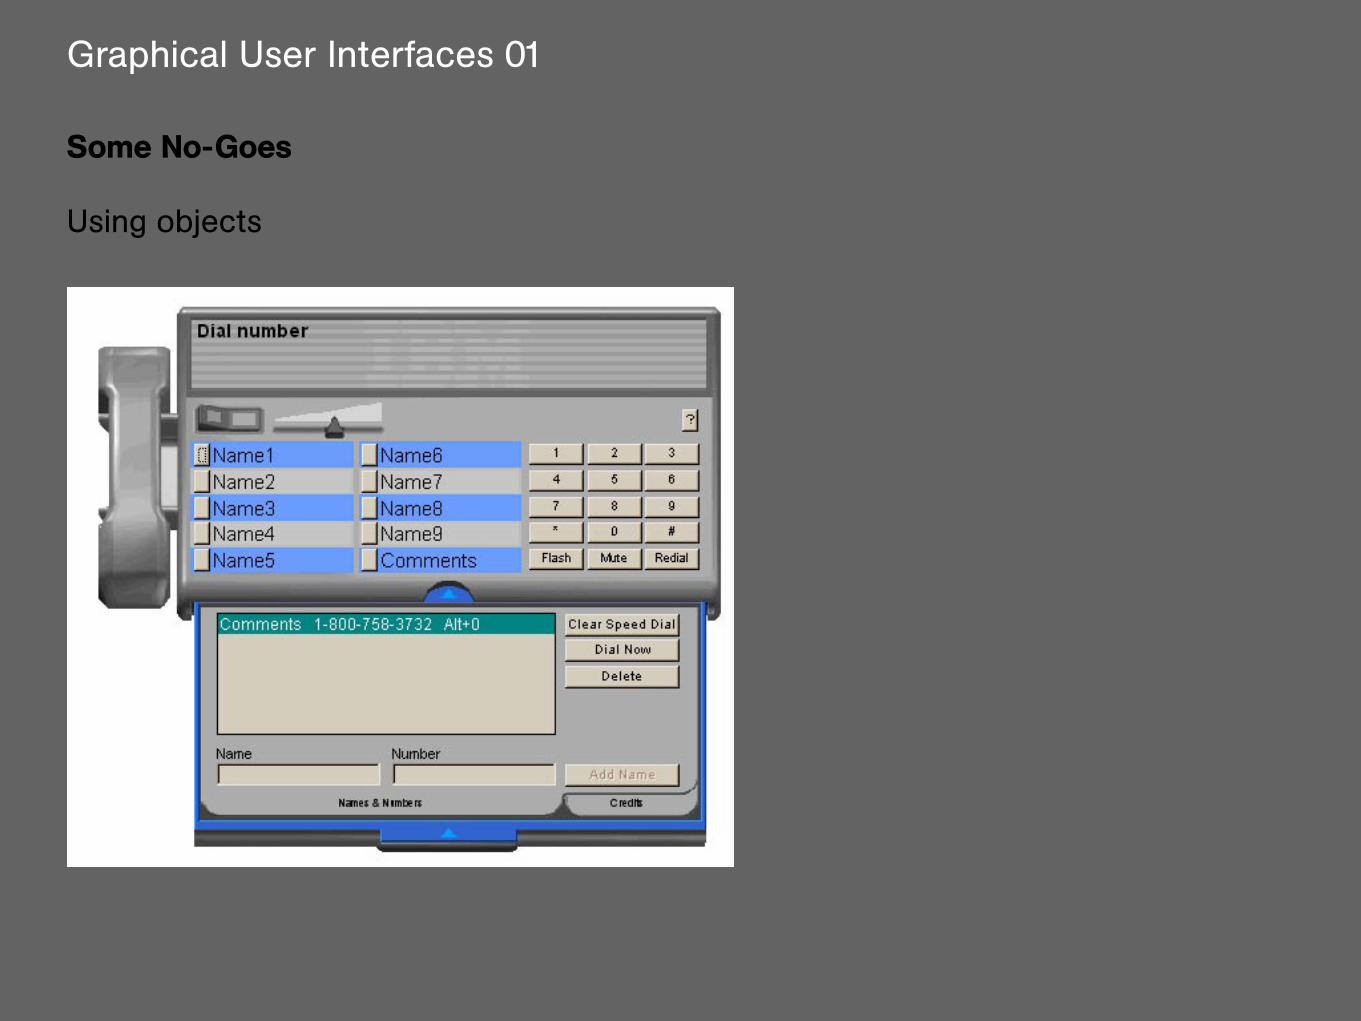
Some No-Goes
The excessive consumption of perceptual bandwidth for purely decorative or sensational purpose, to create unneeded entertainment value, or to indulge in the simple vanity of demonstrating technical virtuosity.
Graphical User Interfaces 01
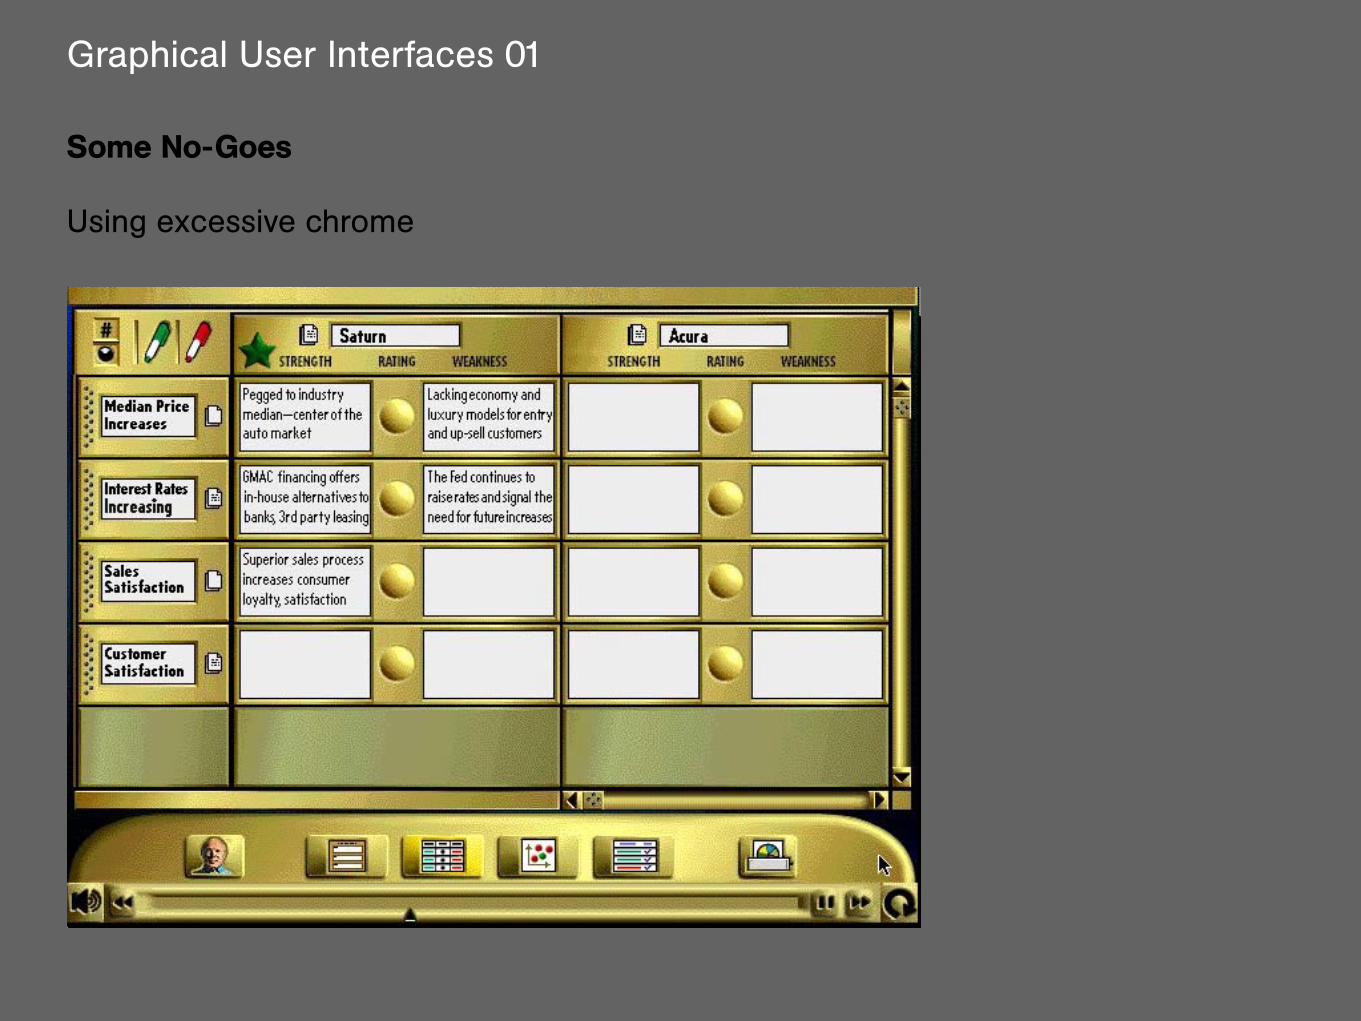
Some No-Goes
Using excessive chrome

Graphical User Interfaces 01
Some No-Goes
Using “real” things
Graphical User Interfaces 01
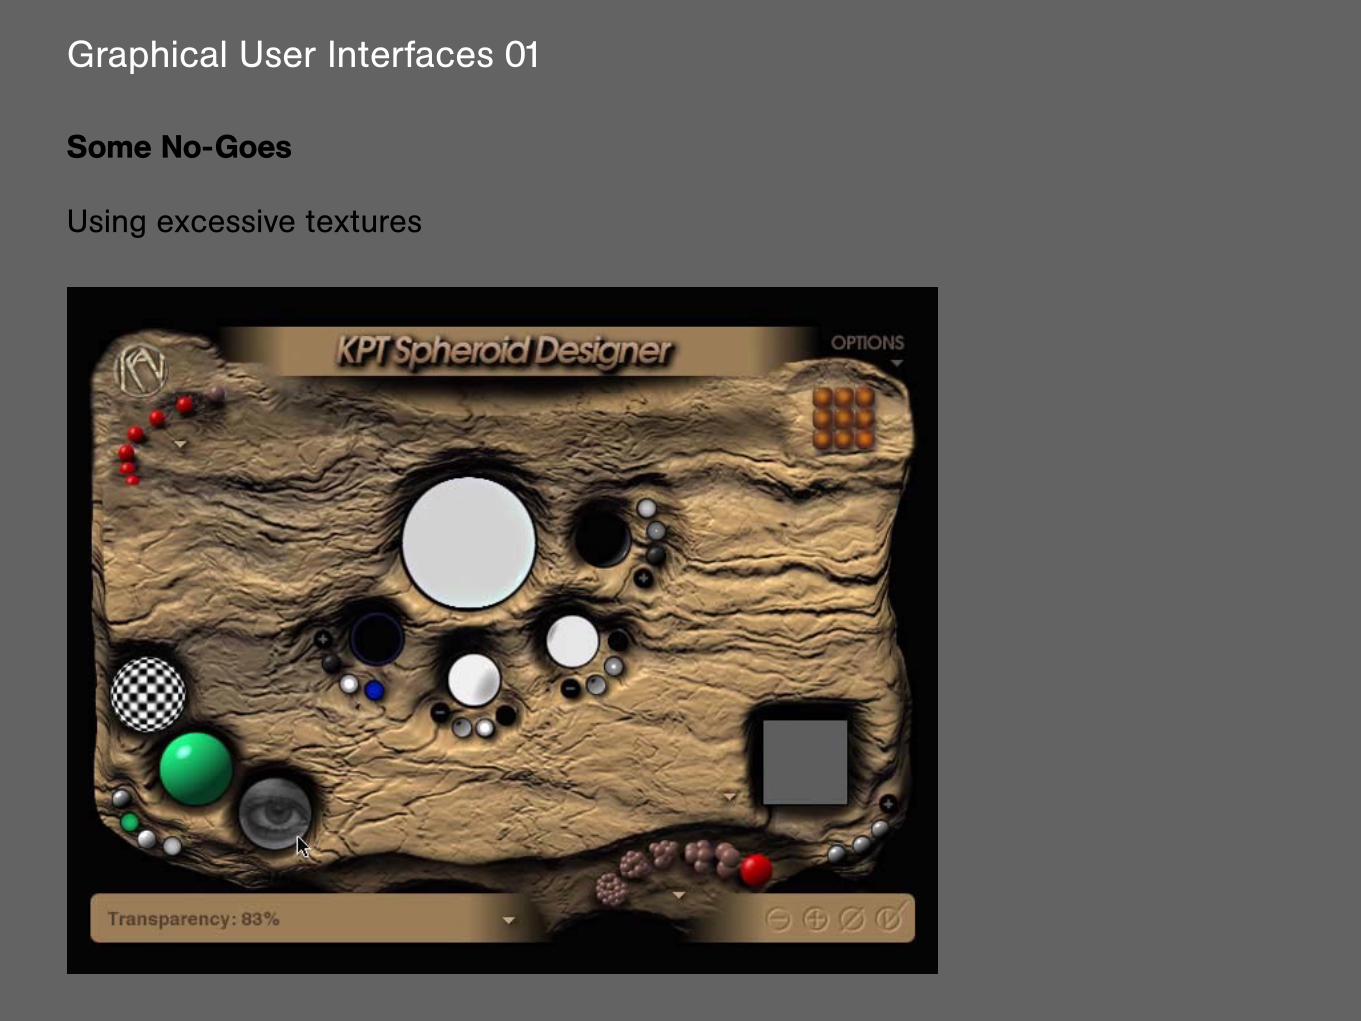
Some No-Goes
Using excessive textures
Graphical User Interfaces 01
Some No-Goes
Using excessive metaphors
Graphical User Interfaces 01
Some No-Goes
Using objects