Embed Size (px)
Citation preview
A. Holzinger 709.049 Med Informatics L091/98
Andreas HolzingerVO 709.049 Medical Informatics
09.12.2015 11:15‐12:45
Lecture 09Interactive Information Visualization
and Visual [email protected]
Tutor: [email protected]://hci‐kdd.org/biomedical‐informatics‐big‐data
A. Holzinger 709.049 Med Informatics L092/98
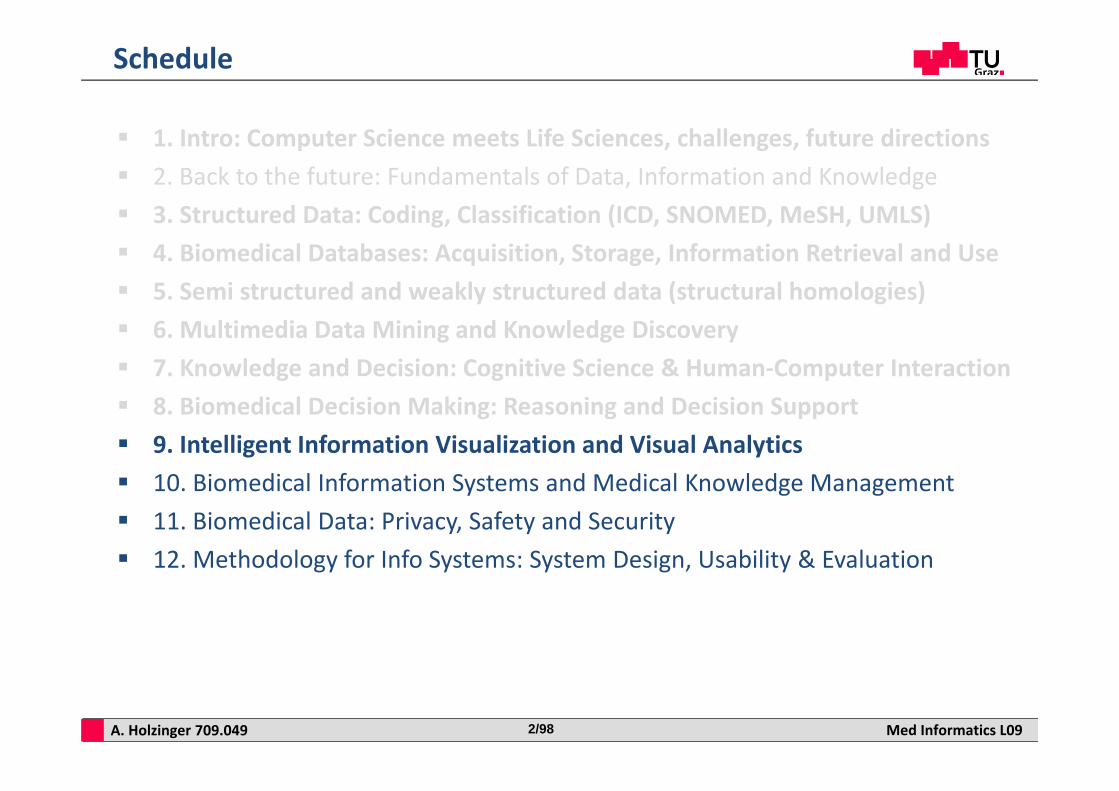
1. Intro: Computer Science meets Life Sciences, challenges, future directions 2. Back to the future: Fundamentals of Data, Information and Knowledge 3. Structured Data: Coding, Classification (ICD, SNOMED, MeSH, UMLS) 4. Biomedical Databases: Acquisition, Storage, Information Retrieval and Use 5. Semi structured and weakly structured data (structural homologies) 6. Multimedia Data Mining and Knowledge Discovery 7. Knowledge and Decision: Cognitive Science & Human‐Computer Interaction 8. Biomedical Decision Making: Reasoning and Decision Support 9. Intelligent Information Visualization and Visual Analytics 10. Biomedical Information Systems and Medical Knowledge Management 11. Biomedical Data: Privacy, Safety and Security 12. Methodology for Info Systems: System Design, Usability & Evaluation
Schedule
A. Holzinger 709.049 Med Informatics L093/98
Data visualization Flow cytometry Human‐Computer Interaction (HCI) Information visualization Interactive information visualization k‐Anonymization Longitudinal data Multivariate data Parallel coordinates RadViz Semiotics Star plots Temporal data analysis Visual analytics Visual information
Keywords of the 9th Lecture
A. Holzinger 709.049 Med Informatics L094/98
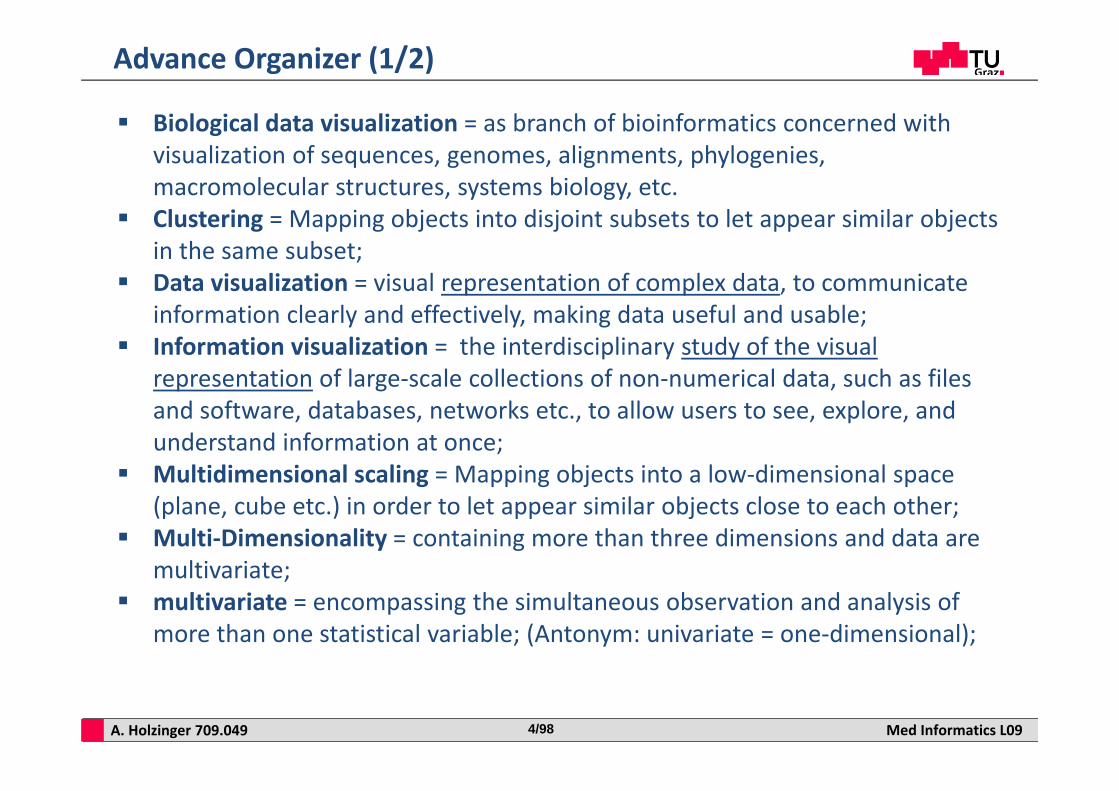
Biological data visualization = as branch of bioinformatics concerned with visualization of sequences, genomes, alignments, phylogenies, macromolecular structures, systems biology, etc.
Clustering = Mapping objects into disjoint subsets to let appear similar objects in the same subset;
Data visualization = visual representation of complex data, to communicate information clearly and effectively, making data useful and usable;
Information visualization = the interdisciplinary study of the visual representation of large‐scale collections of non‐numerical data, such as files and software, databases, networks etc., to allow users to see, explore, and understand information at once;
Multidimensional scaling = Mapping objects into a low‐dimensional space (plane, cube etc.) in order to let appear similar objects close to each other;
Multi‐Dimensionality = containing more than three dimensions and data are multivariate;
multivariate = encompassing the simultaneous observation and analysis of more than one statistical variable; (Antonym: univariate = one‐dimensional);
Advance Organizer (1/2)
A. Holzinger 709.049 Med Informatics L095/98
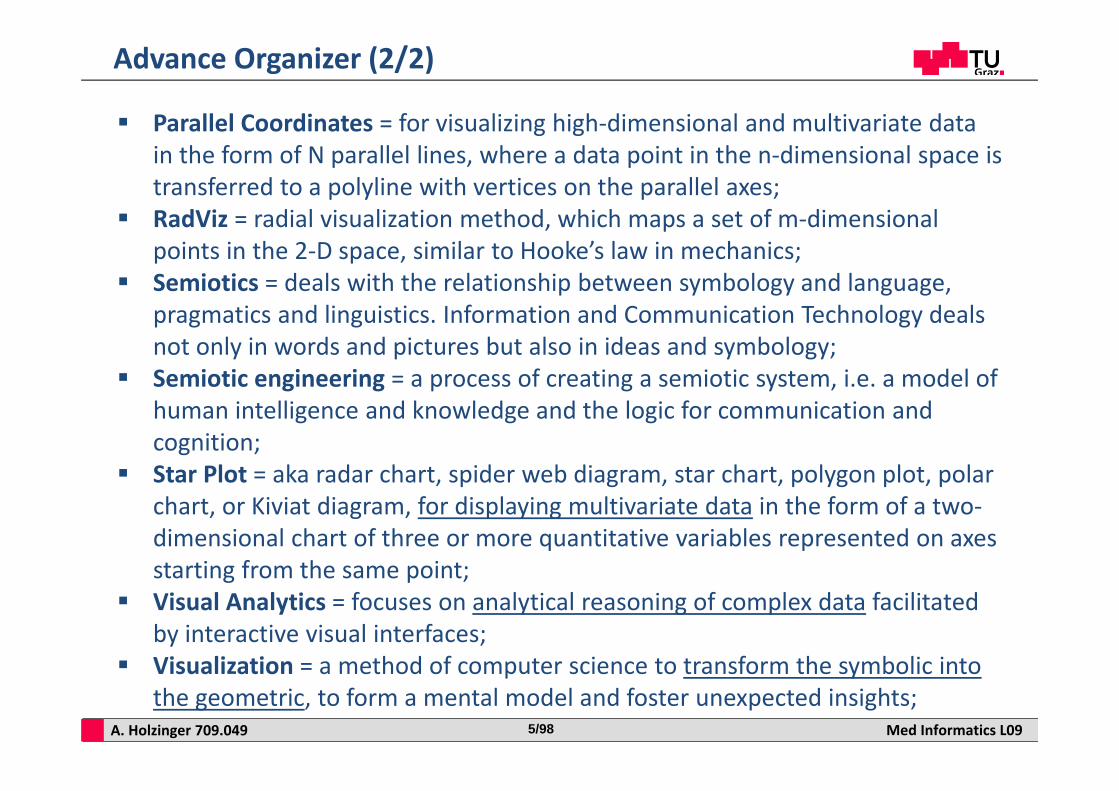
Parallel Coordinates = for visualizing high‐dimensional and multivariate data in the form of N parallel lines, where a data point in the n‐dimensional space is transferred to a polyline with vertices on the parallel axes;
RadViz = radial visualization method, which maps a set of m‐dimensional points in the 2‐D space, similar to Hooke’s law in mechanics;
Semiotics = deals with the relationship between symbology and language, pragmatics and linguistics. Information and Communication Technology deals not only in words and pictures but also in ideas and symbology;
Semiotic engineering = a process of creating a semiotic system, i.e. a model of human intelligence and knowledge and the logic for communication and cognition;
Star Plot = aka radar chart, spider web diagram, star chart, polygon plot, polar chart, or Kiviat diagram, for displaying multivariate data in the form of a two‐dimensional chart of three or more quantitative variables represented on axes starting from the same point;
Visual Analytics = focuses on analytical reasoning of complex data facilitated by interactive visual interfaces;
Visualization = a method of computer science to transform the symbolic into the geometric, to form a mental model and foster unexpected insights;
Advance Organizer (2/2)
A. Holzinger 709.049 Med Informatics L096/98
… have some background on visualization, visual analytics and content analytics; … got an overview about various possible visualization methods for multivariate data; … got an introduction into the work of and possibilities with parallel coordinates; … have seen the principles of RadViz mappings and algorithms; … are aware of the possibilities of Star Plots; … have seen that visual analytics is intelligent Human‐Computer Interaction at it finest;
Learning Goals: At the end of this 9th lecture you …
A. Holzinger 709.049 Med Informatics L097/98
How to understand high‐dimensional spaces? The transformation of results from high‐dimensional space into From the complex to the simple Low integration of visual analytics techniques into the clinical workplace Sampling, modelling, rendering, perception, cognition, decision making Trade‐off between time and accuracy How to model uncertainty
Slide 9‐1 Key Challenges
A. Holzinger 709.049 Med Informatics L098/98
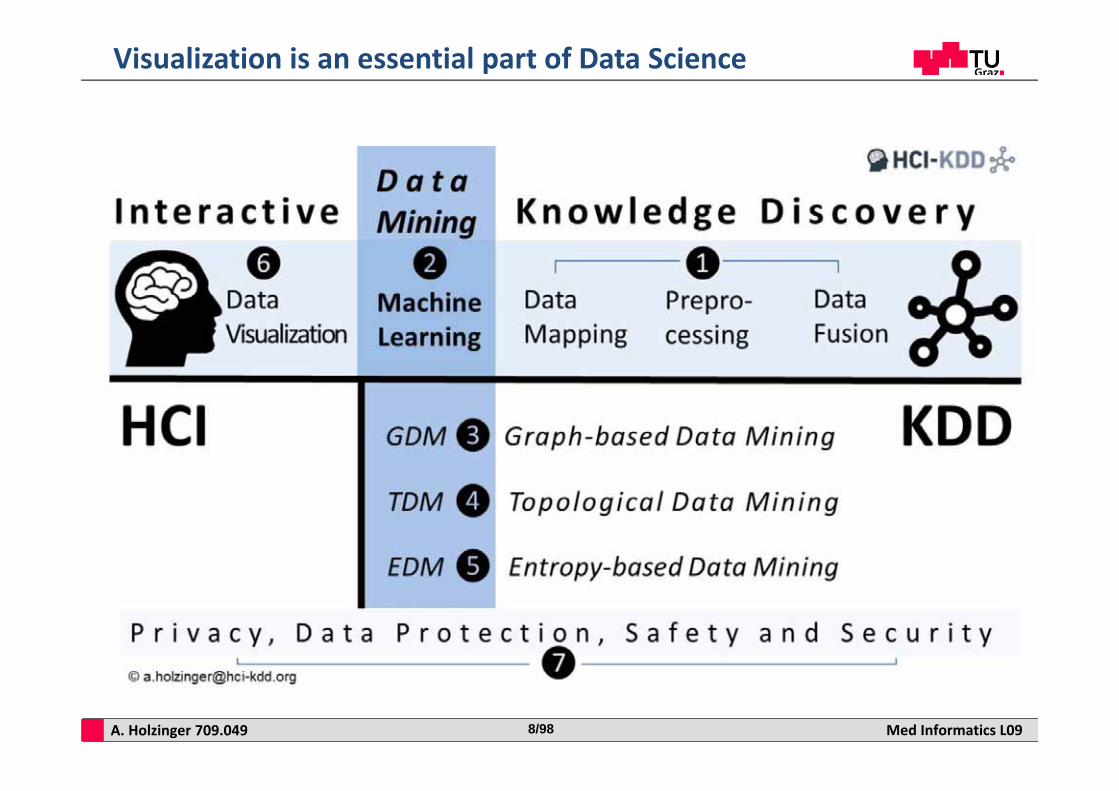
Visualization is an essential part of Data Science
A. Holzinger 709.049 Med Informatics L099/98
Verbal InformationversusVisual Information
A. Holzinger 709.049 Med Informatics L0910/98
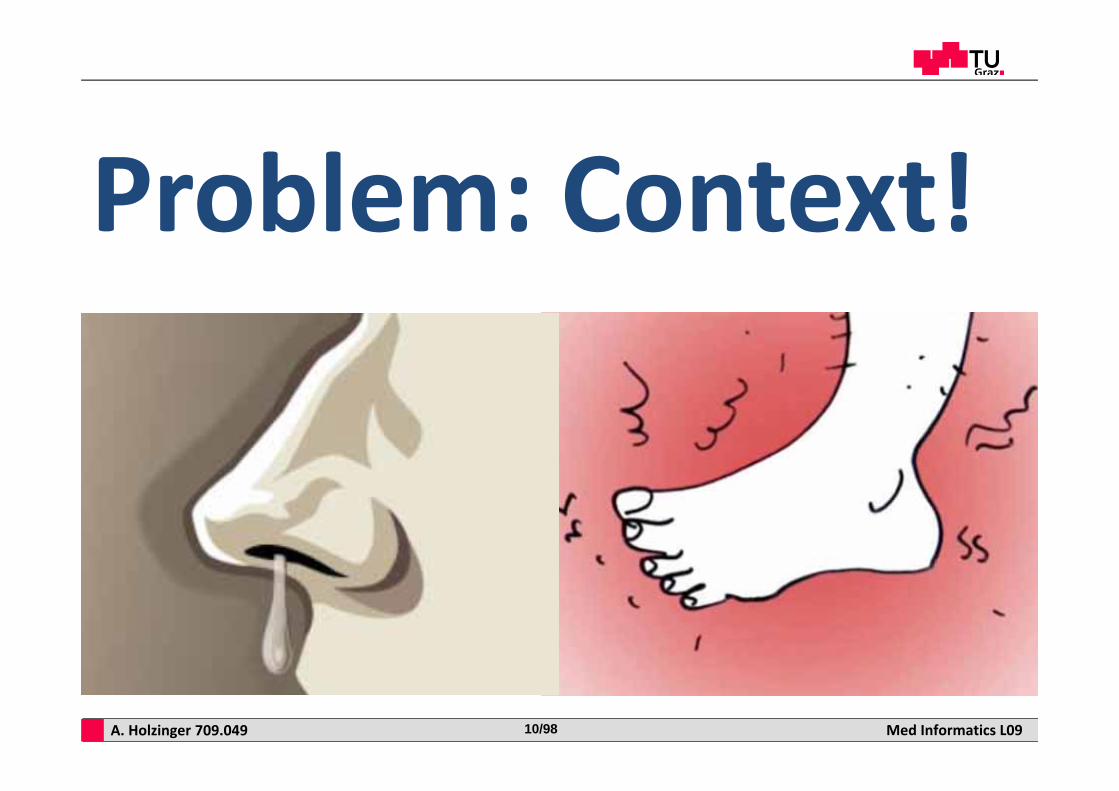
Problem: Context!
A. Holzinger 709.049 Med Informatics L0911/98
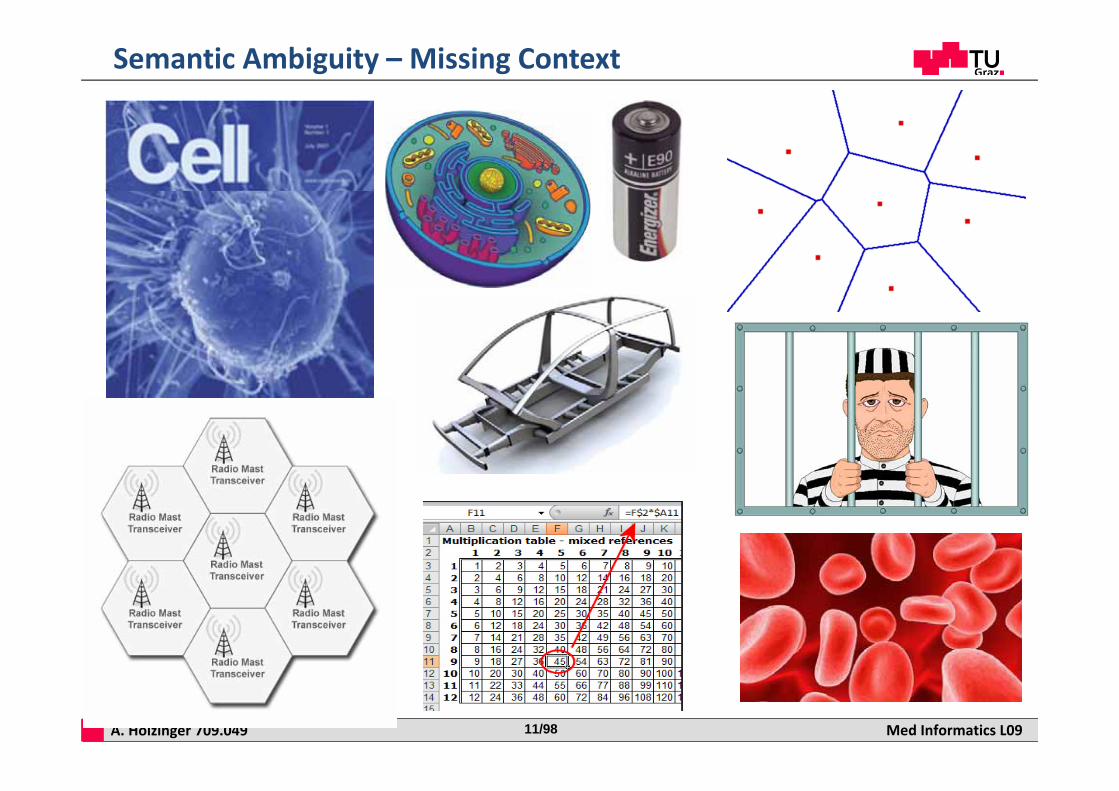
Semantic Ambiguity – Missing Context
A. Holzinger 709.049 Med Informatics L0912/98
A picture is worth a thousand words?
A. Holzinger 709.049 Med Informatics L0913/98
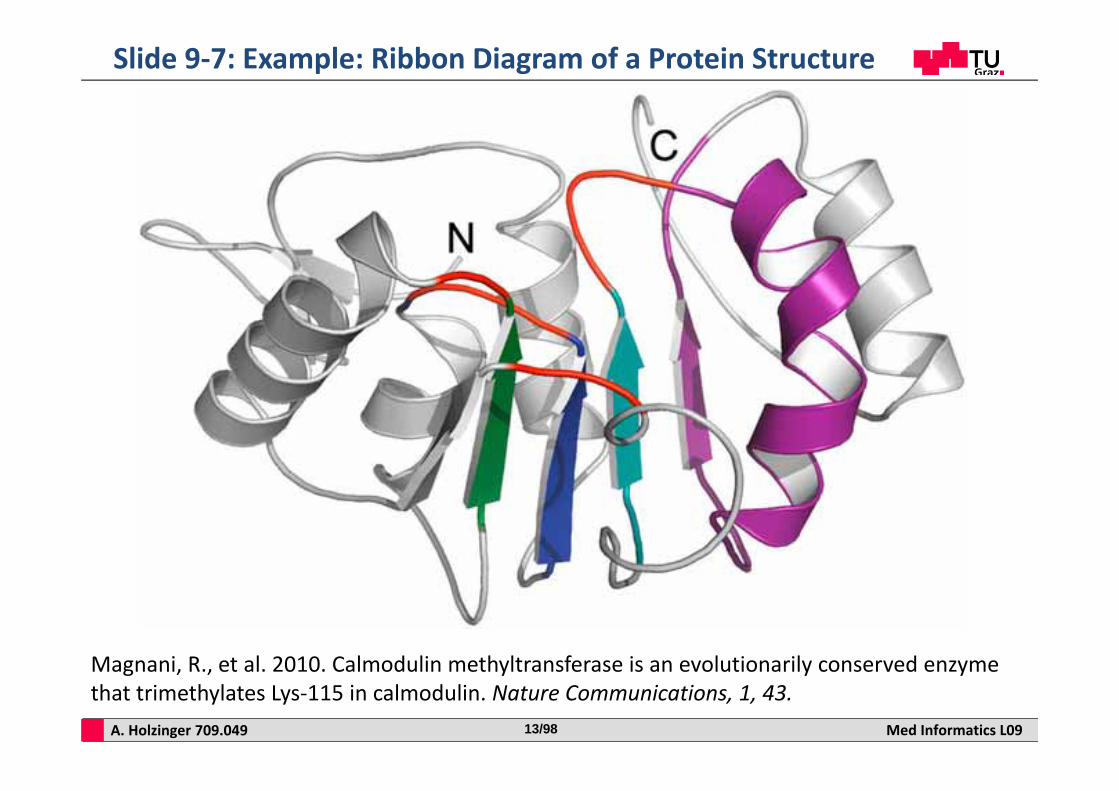
Slide 9‐7: Example: Ribbon Diagram of a Protein Structure
Magnani, R., et al. 2010. Calmodulin methyltransferase is an evolutionarily conserved enzyme that trimethylates Lys‐115 in calmodulin. Nature Communications, 1, 43.
A. Holzinger 709.049 Med Informatics L0914/98
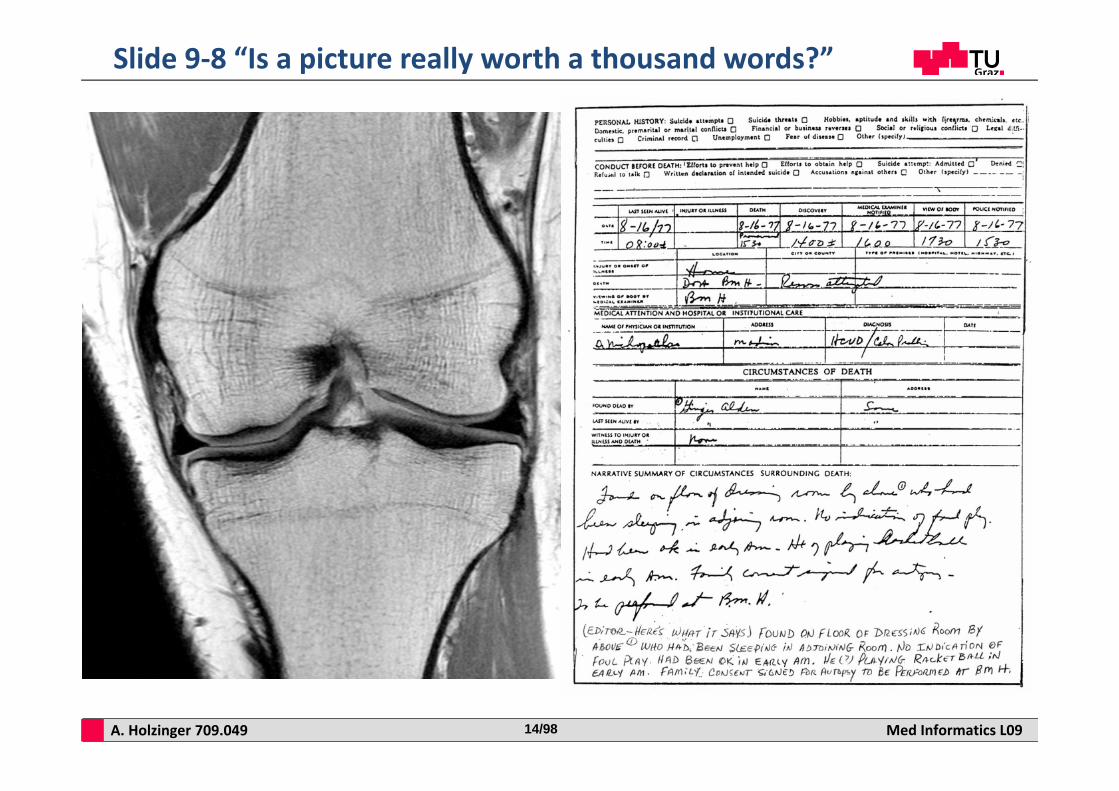
Slide 9‐8 “Is a picture really worth a thousand words?”
A. Holzinger 709.049 Med Informatics L0915/98
Informatics as Semiotics Engineering
A. Holzinger 709.049 Med Informatics L0916/98
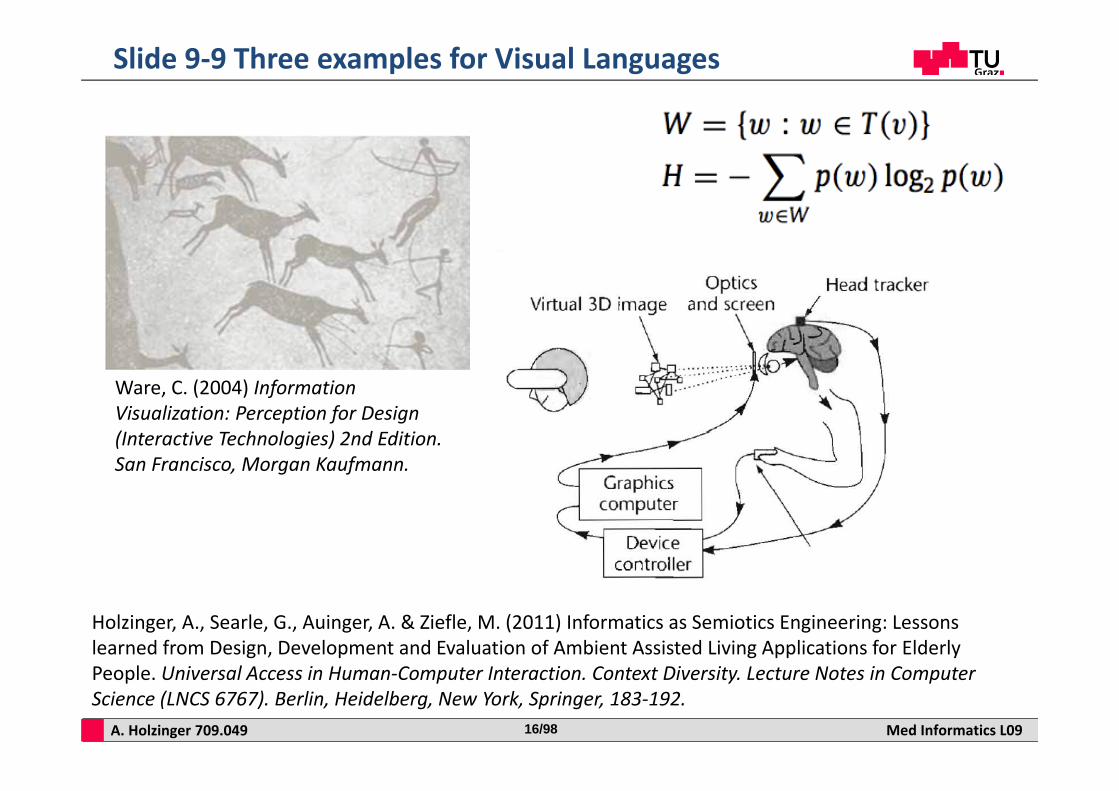
Slide 9‐9 Three examples for Visual Languages
Ware, C. (2004) Information Visualization: Perception for Design (Interactive Technologies) 2nd Edition. San Francisco, Morgan Kaufmann.
Holzinger, A., Searle, G., Auinger, A. & Ziefle, M. (2011) Informatics as Semiotics Engineering: Lessons learned from Design, Development and Evaluation of Ambient Assisted Living Applications for Elderly People. Universal Access in Human‐Computer Interaction. Context Diversity. Lecture Notes in Computer Science (LNCS 6767). Berlin, Heidelberg, New York, Springer, 183‐192.
A. Holzinger 709.049 Med Informatics L0917/98
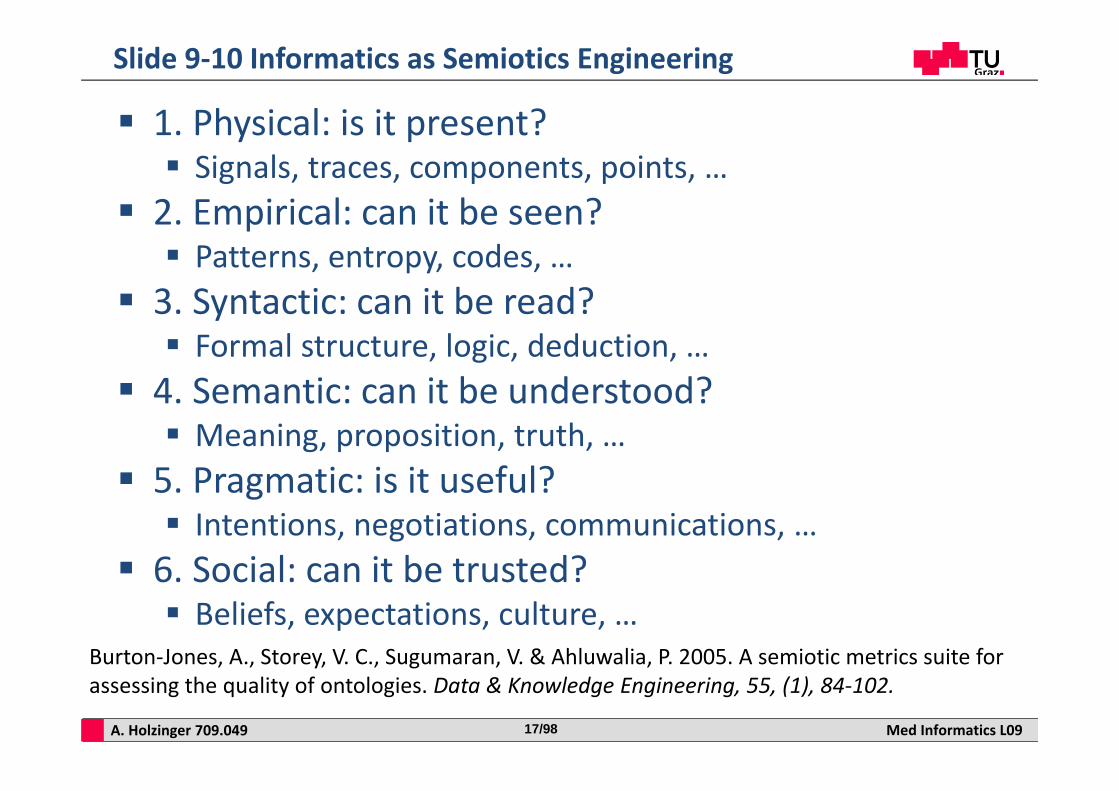
1. Physical: is it present? Signals, traces, components, points, …
2. Empirical: can it be seen? Patterns, entropy, codes, …
3. Syntactic: can it be read? Formal structure, logic, deduction, …
4. Semantic: can it be understood? Meaning, proposition, truth, …
5. Pragmatic: is it useful? Intentions, negotiations, communications, …
6. Social: can it be trusted? Beliefs, expectations, culture, …
Slide 9‐10 Informatics as Semiotics Engineering
Burton‐Jones, A., Storey, V. C., Sugumaran, V. & Ahluwalia, P. 2005. A semiotic metrics suite for assessing the quality of ontologies. Data & Knowledge Engineering, 55, (1), 84‐102.
A. Holzinger 709.049 Med Informatics L0918/98
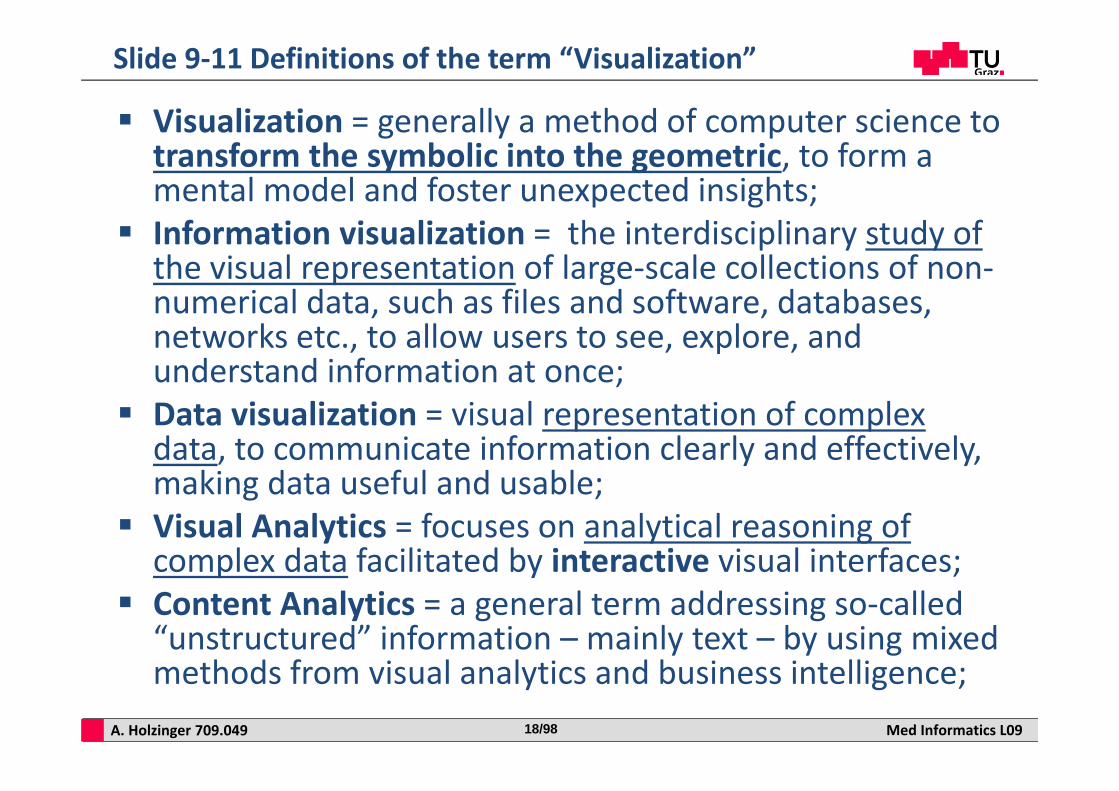
Visualization = generally a method of computer science to transform the symbolic into the geometric, to form a mental model and foster unexpected insights;
Information visualization = the interdisciplinary study of the visual representation of large‐scale collections of non‐numerical data, such as files and software, databases, networks etc., to allow users to see, explore, and understand information at once;
Data visualization = visual representation of complex data, to communicate information clearly and effectively, making data useful and usable;
Visual Analytics = focuses on analytical reasoning of complex data facilitated by interactive visual interfaces;
Content Analytics = a general term addressing so‐called “unstructured” information – mainly text – by using mixed methods from visual analytics and business intelligence;
Slide 9‐11 Definitions of the term “Visualization”
A. Holzinger 709.049 Med Informatics L0919/98
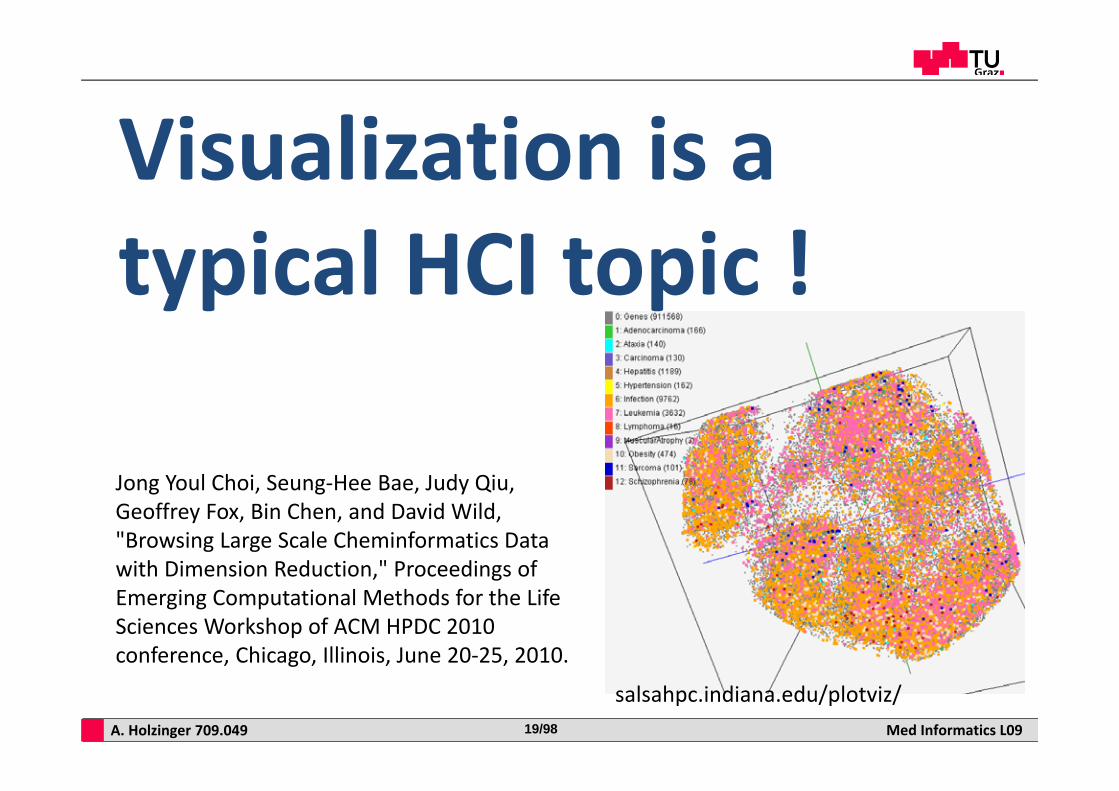
Visualization is a typical HCI topic !
salsahpc.indiana.edu/plotviz/
Jong Youl Choi, Seung‐Hee Bae, Judy Qiu, Geoffrey Fox, Bin Chen, and David Wild, "Browsing Large Scale Cheminformatics Data with Dimension Reduction," Proceedings of Emerging Computational Methods for the Life Sciences Workshop of ACM HPDC 2010 conference, Chicago, Illinois, June 20‐25, 2010.
A. Holzinger 709.049 Med Informatics L0920/98
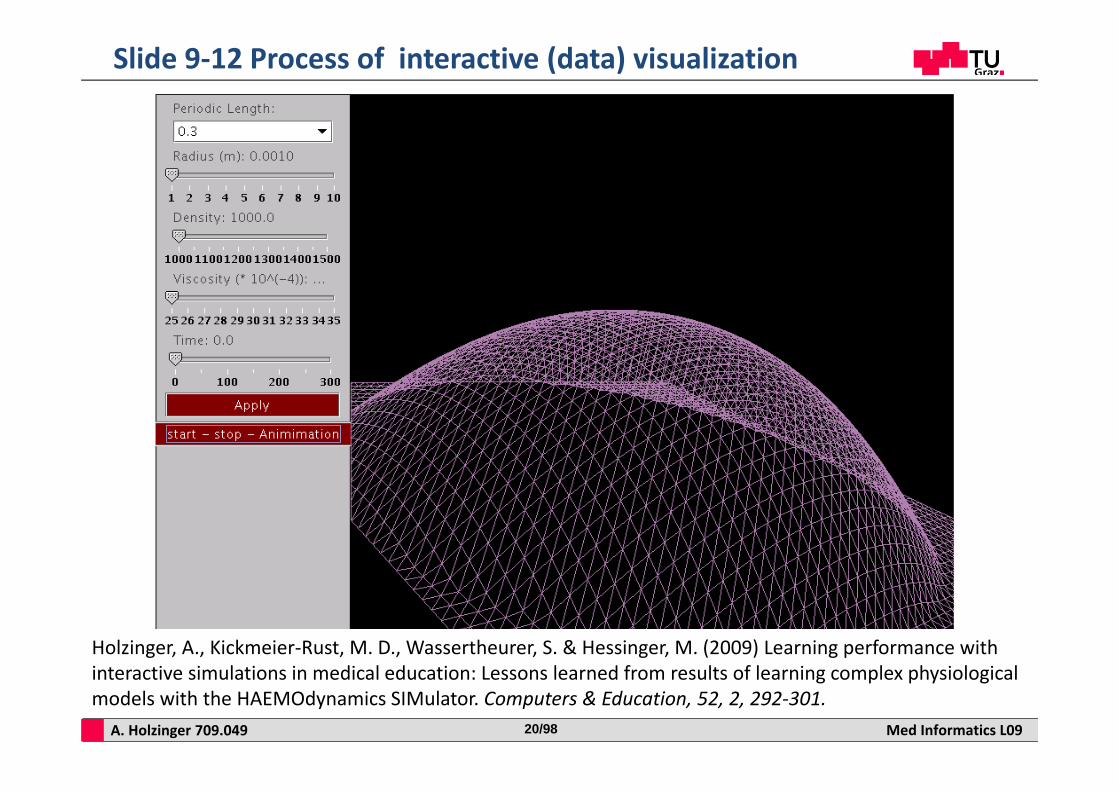
Slide 9‐12 Process of interactive (data) visualization
Holzinger, A., Kickmeier‐Rust, M. D., Wassertheurer, S. & Hessinger, M. (2009) Learning performance with interactive simulations in medical education: Lessons learned from results of learning complex physiological models with the HAEMOdynamics SIMulator. Computers & Education, 52, 2, 292‐301.
A. Holzinger 709.049 Med Informatics L0921/98
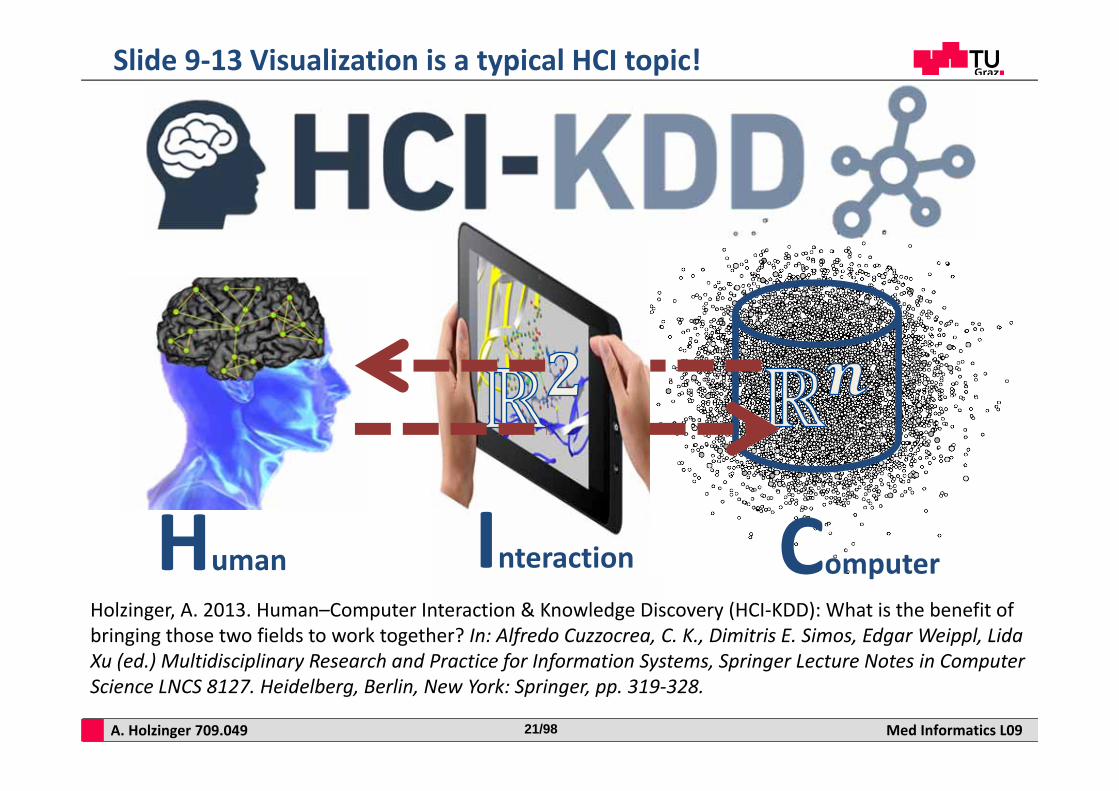
Human ComputerInteraction
Slide 9‐13 Visualization is a typical HCI topic!
Holzinger, A. 2013. Human–Computer Interaction & Knowledge Discovery (HCI‐KDD): What is the benefit of bringing those two fields to work together? In: Alfredo Cuzzocrea, C. K., Dimitris E. Simos, Edgar Weippl, LidaXu (ed.) Multidisciplinary Research and Practice for Information Systems, Springer Lecture Notes in Computer Science LNCS 8127. Heidelberg, Berlin, New York: Springer, pp. 319‐328.
A. Holzinger 709.049 Med Informatics L0922/98
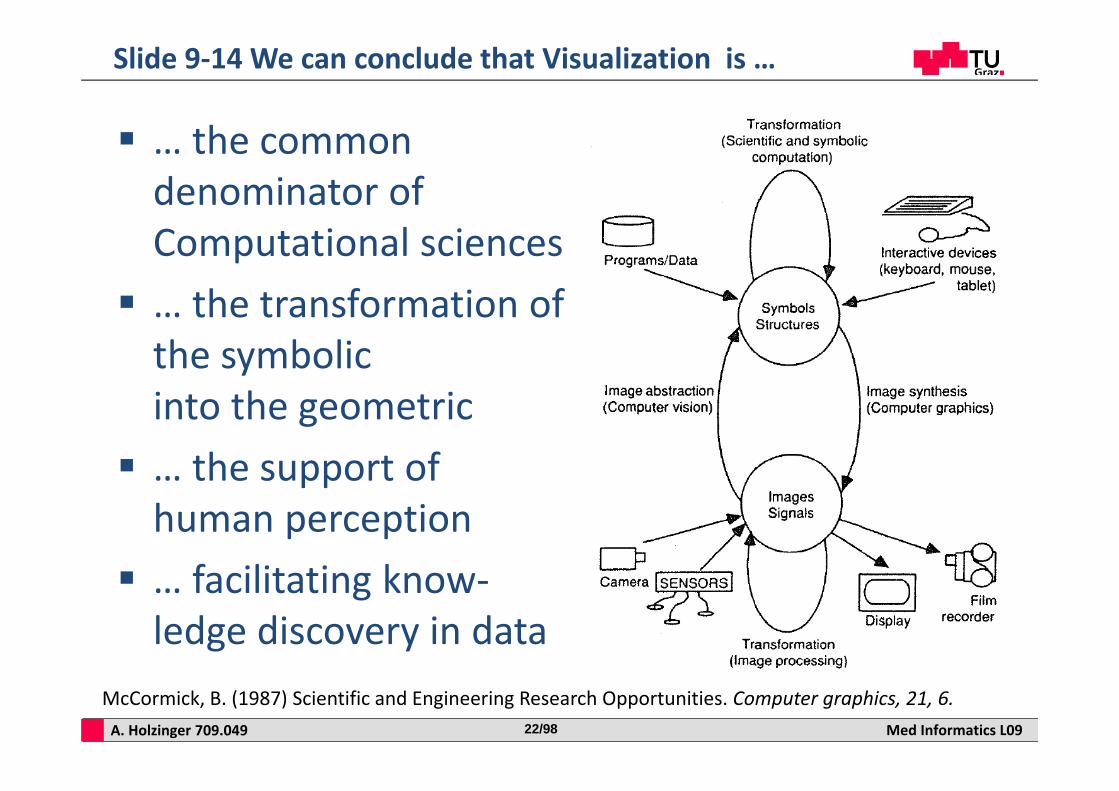
Slide 9‐14 We can conclude that Visualization is …
… the common denominator of Computational sciences … the transformation of the symbolic into the geometric … the support of human perception … facilitating know‐ledge discovery in data
McCormick, B. (1987) Scientific and Engineering Research Opportunities. Computer graphics, 21, 6.
A. Holzinger 709.049 Med Informatics L0923/98
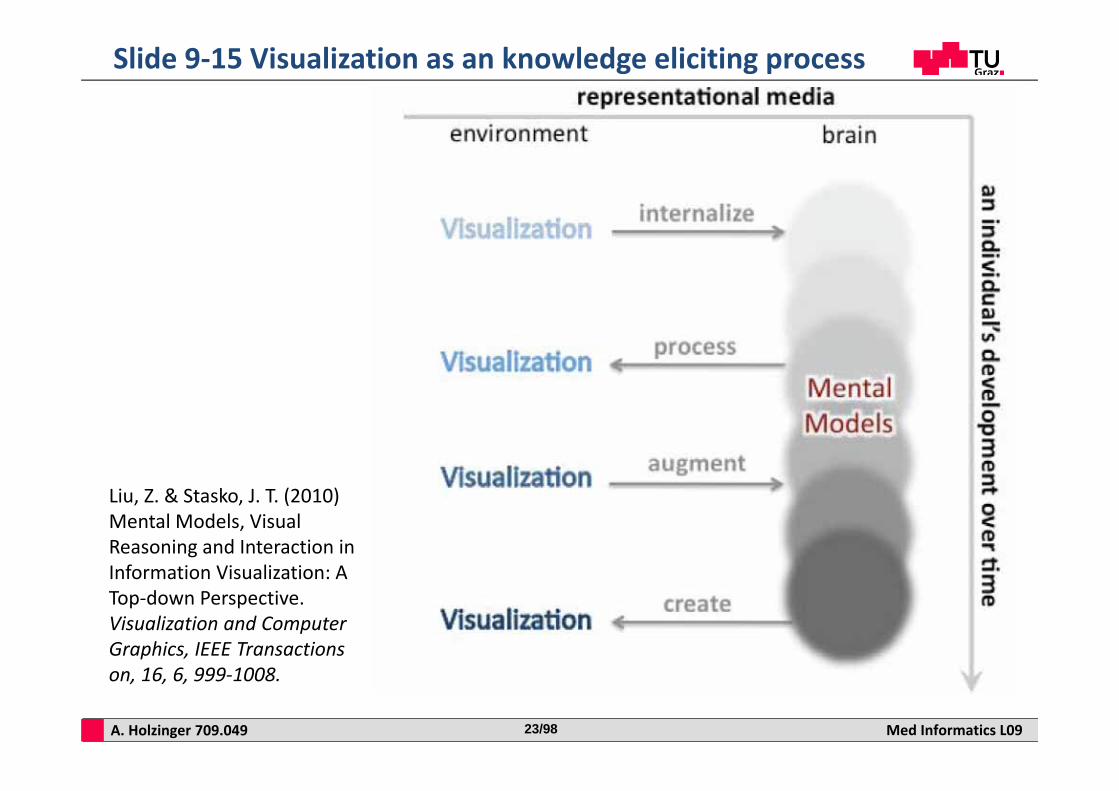
Slide 9‐15 Visualization as an knowledge eliciting process
Liu, Z. & Stasko, J. T. (2010) Mental Models, Visual Reasoning and Interaction in Information Visualization: A Top‐down Perspective. Visualization and Computer Graphics, IEEE Transactions on, 16, 6, 999‐1008.
A. Holzinger 709.049 Med Informatics L0924/98
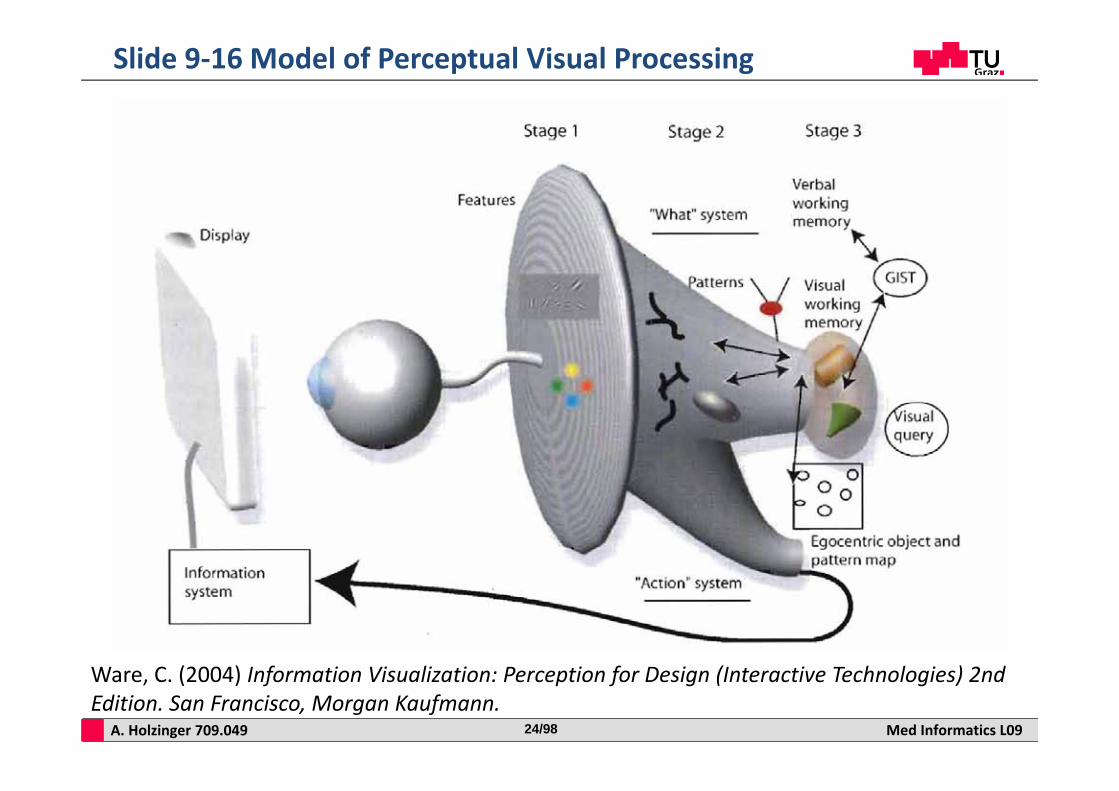
Slide 9‐16 Model of Perceptual Visual Processing
Ware, C. (2004) Information Visualization: Perception for Design (Interactive Technologies) 2nd Edition. San Francisco, Morgan Kaufmann.
A. Holzinger 709.049 Med Informatics L0925/98
Usefulness of Visualization Science
A. Holzinger 709.049 Med Informatics L0926/98
Slide 9‐17 A look back into history …
A. Holzinger 709.049 Med Informatics L0927/98
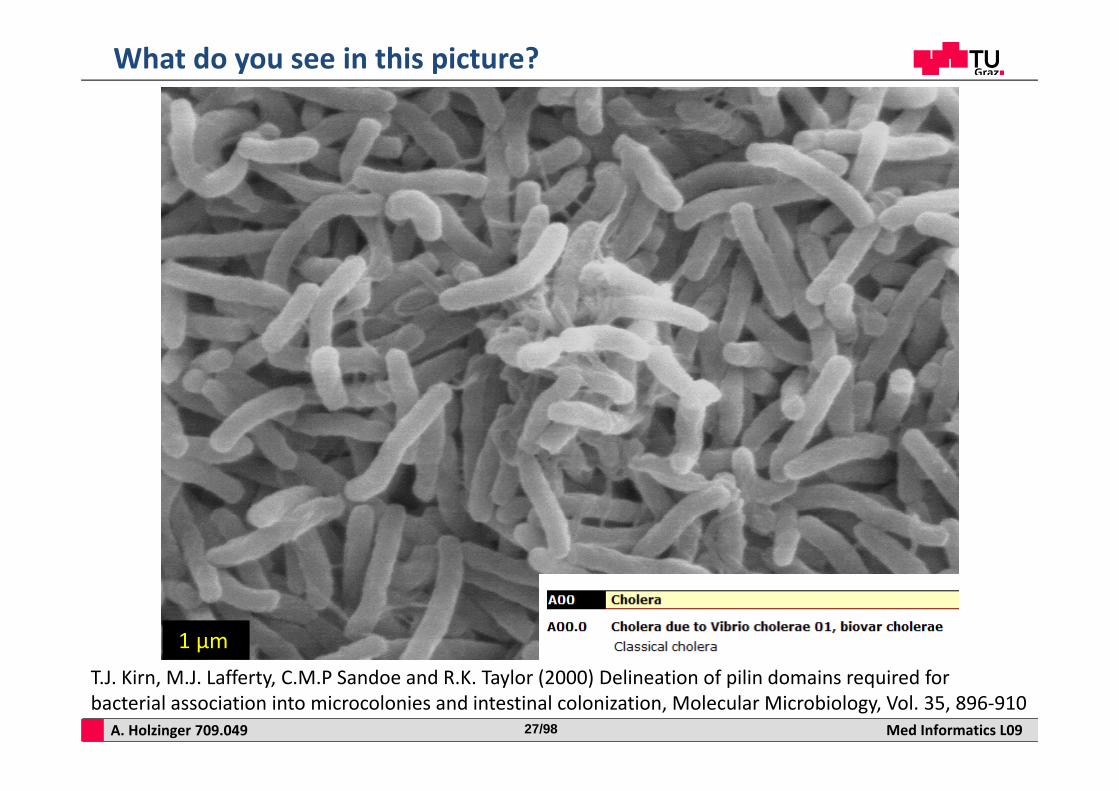
What do you see in this picture?
1 μm T.J. Kirn, M.J. Lafferty, C.M.P Sandoe and R.K. Taylor (2000) Delineation of pilin domains required for bacterial association into microcolonies and intestinal colonization, Molecular Microbiology, Vol. 35, 896‐910
A. Holzinger 709.049 Med Informatics L0928/98
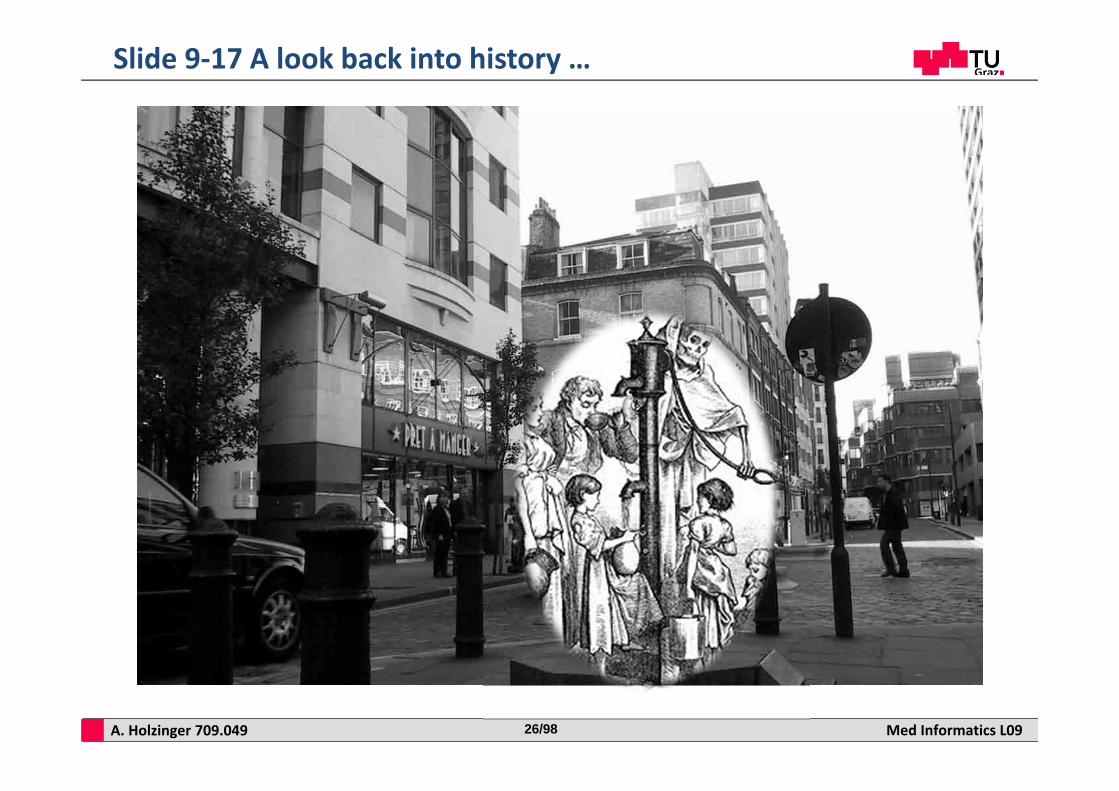
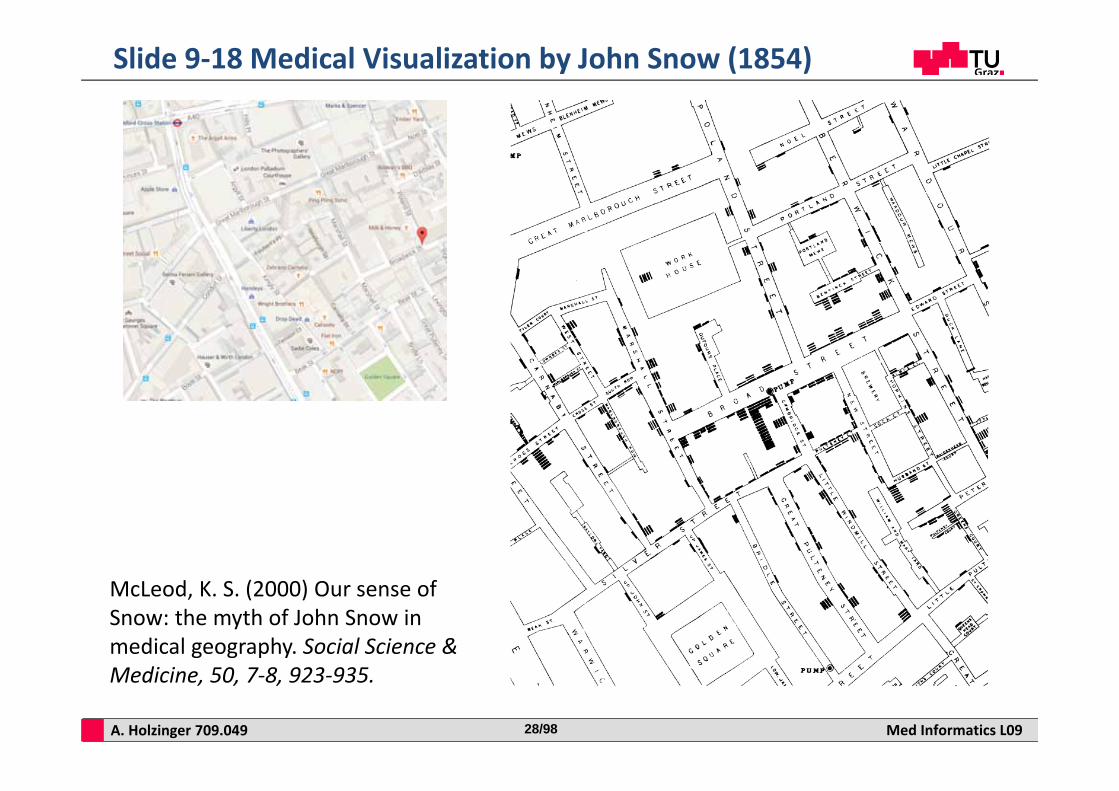
Slide 9‐18 Medical Visualization by John Snow (1854)
McLeod, K. S. (2000) Our sense of Snow: the myth of John Snow in medical geography. Social Science & Medicine, 50, 7‐8, 923‐935.
A. Holzinger 709.049 Med Informatics L0929/98
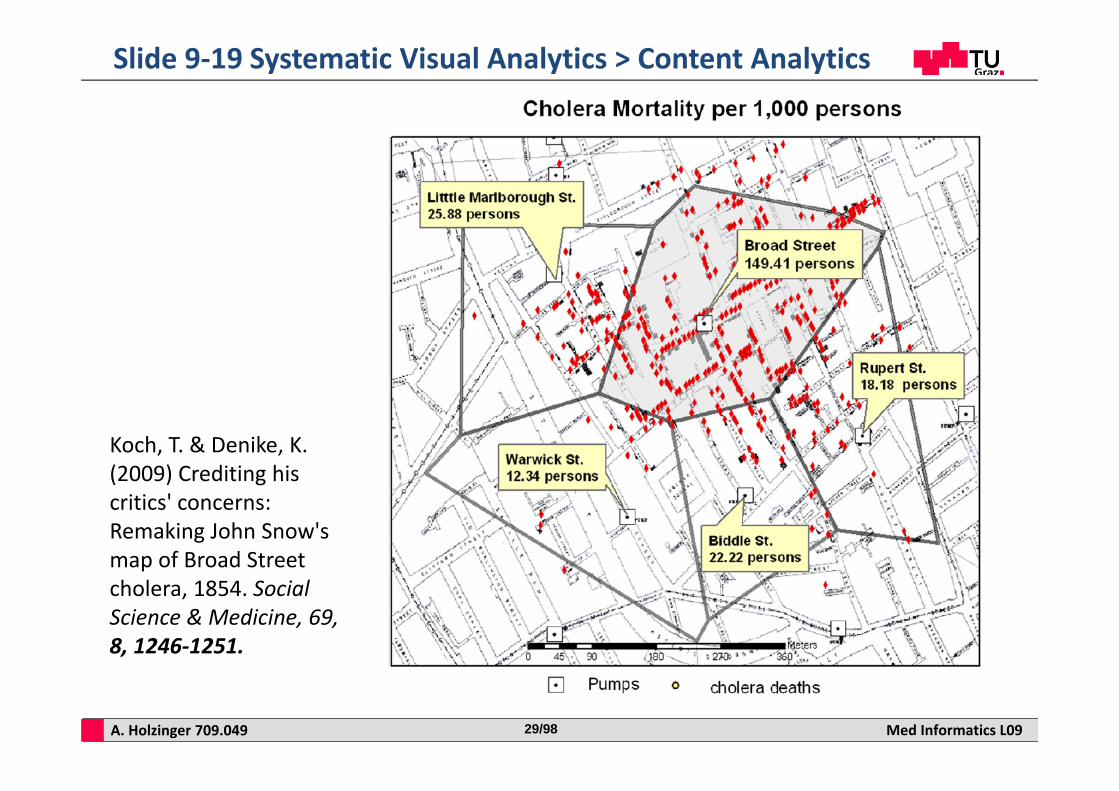
Slide 9‐19 Systematic Visual Analytics > Content Analytics
Koch, T. & Denike, K. (2009) Crediting his critics' concerns: Remaking John Snow's map of Broad Street cholera, 1854. Social Science & Medicine, 69,8, 1246‐1251.
A. Holzinger 709.049 Med Informatics L0930/98
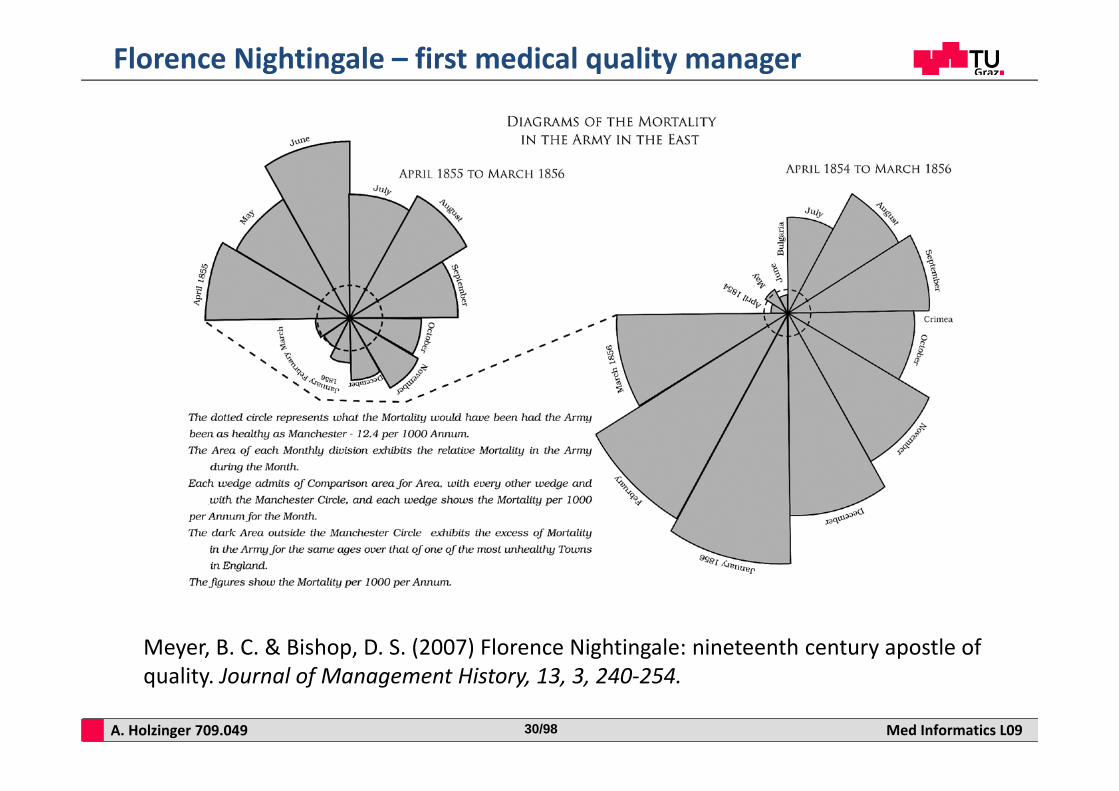
Florence Nightingale – first medical quality manager
Meyer, B. C. & Bishop, D. S. (2007) Florence Nightingale: nineteenth century apostle of quality. Journal of Management History, 13, 3, 240‐254.
A. Holzinger 709.049 Med Informatics L0931/98
How many visualization methods do exist?

A. Holzinger 709.049 Med Informatics L0932/98
Slide 9‐20 A periodic table of visualization methods
Lengler, R. & Eppler, M. J. (2007) Towards a periodic table of visualization methods for management. Proceedings of Graphics and Visualization in Engineering (GVE 2007); Online: www.visual‐literacy.org
A. Holzinger 709.049 Med Informatics L0933/98
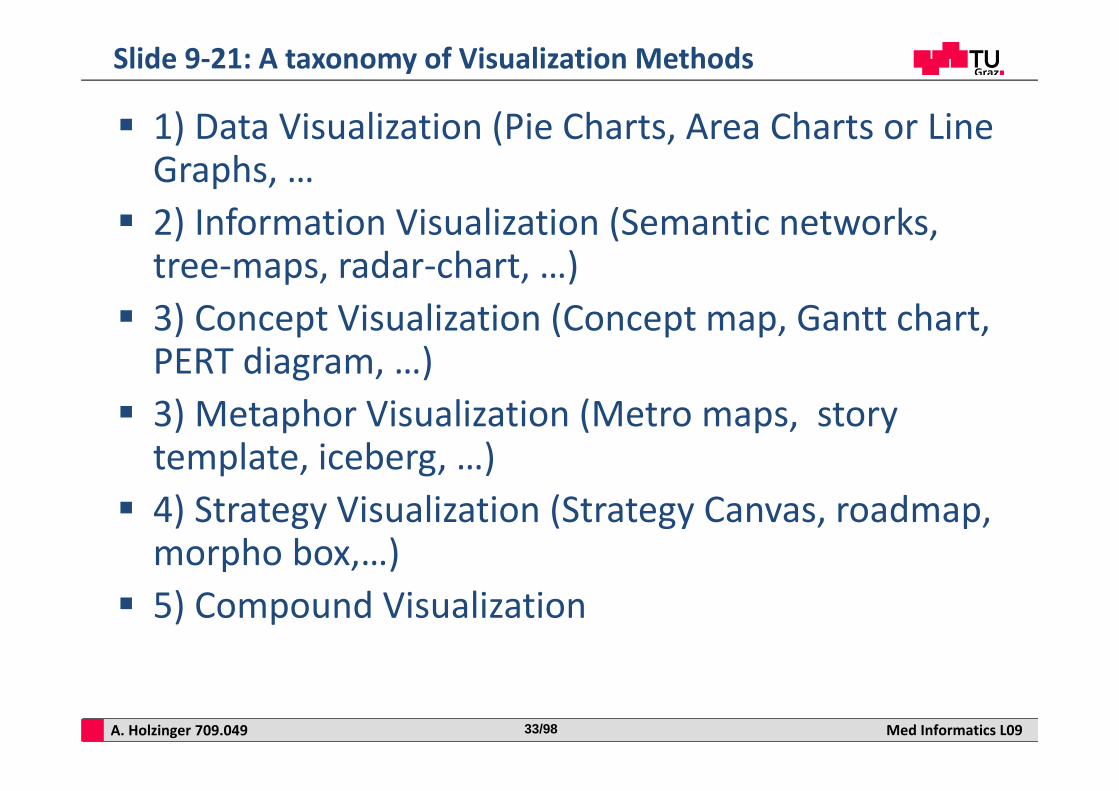
1) Data Visualization (Pie Charts, Area Charts or Line Graphs, …
2) Information Visualization (Semantic networks, tree‐maps, radar‐chart, …)
3) Concept Visualization (Concept map, Gantt chart, PERT diagram, …)
3) Metaphor Visualization (Metro maps, story template, iceberg, …)
4) Strategy Visualization (Strategy Canvas, roadmap, morpho box,…)
5) Compound Visualization
Slide 9‐21: A taxonomy of Visualization Methods
A. Holzinger 709.049 Med Informatics L0934/98
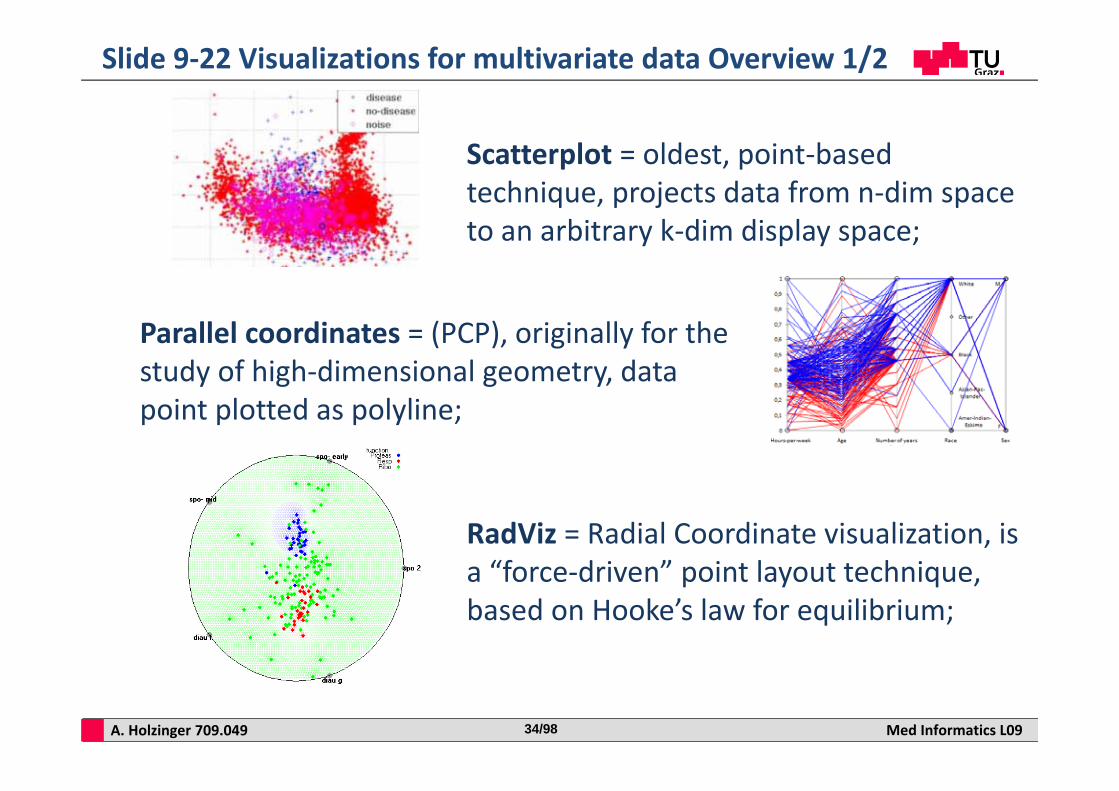
Slide 9‐22 Visualizations for multivariate data Overview 1/2
Scatterplot = oldest, point‐based technique, projects data from n‐dim space to an arbitrary k‐dim display space;
Parallel coordinates = (PCP), originally for the study of high‐dimensional geometry, data point plotted as polyline;
RadViz = Radial Coordinate visualization, is a “force‐driven” point layout technique, based on Hooke’s law for equilibrium;
A. Holzinger 709.049 Med Informatics L0935/98
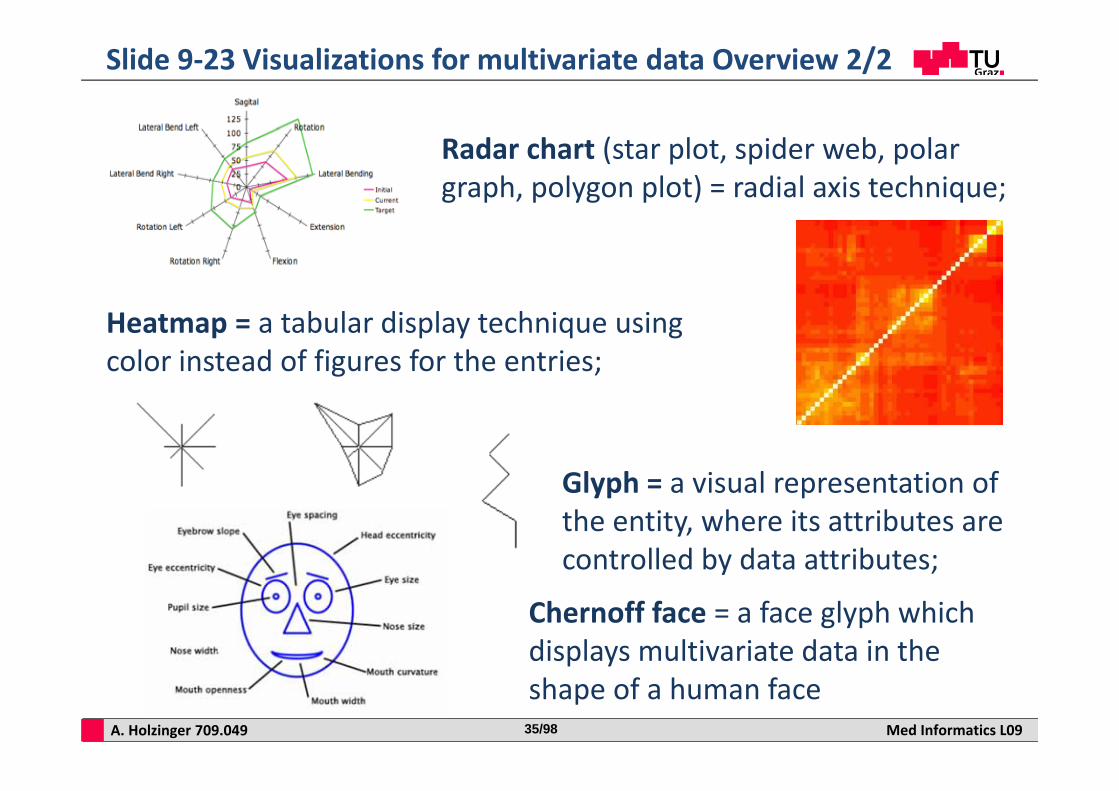
Slide 9‐23 Visualizations for multivariate data Overview 2/2
Radar chart (star plot, spider web, polar graph, polygon plot) = radial axis technique;
Heatmap = a tabular display technique using color instead of figures for the entries;
Glyph = a visual representation of the entity, where its attributes are controlled by data attributes;
Chernoff face = a face glyph which displays multivariate data in the shape of a human face
A. Holzinger 709.049 Med Informatics L0936/98
Parallel Coordinates
A. Holzinger 709.049 Med Informatics L0937/98
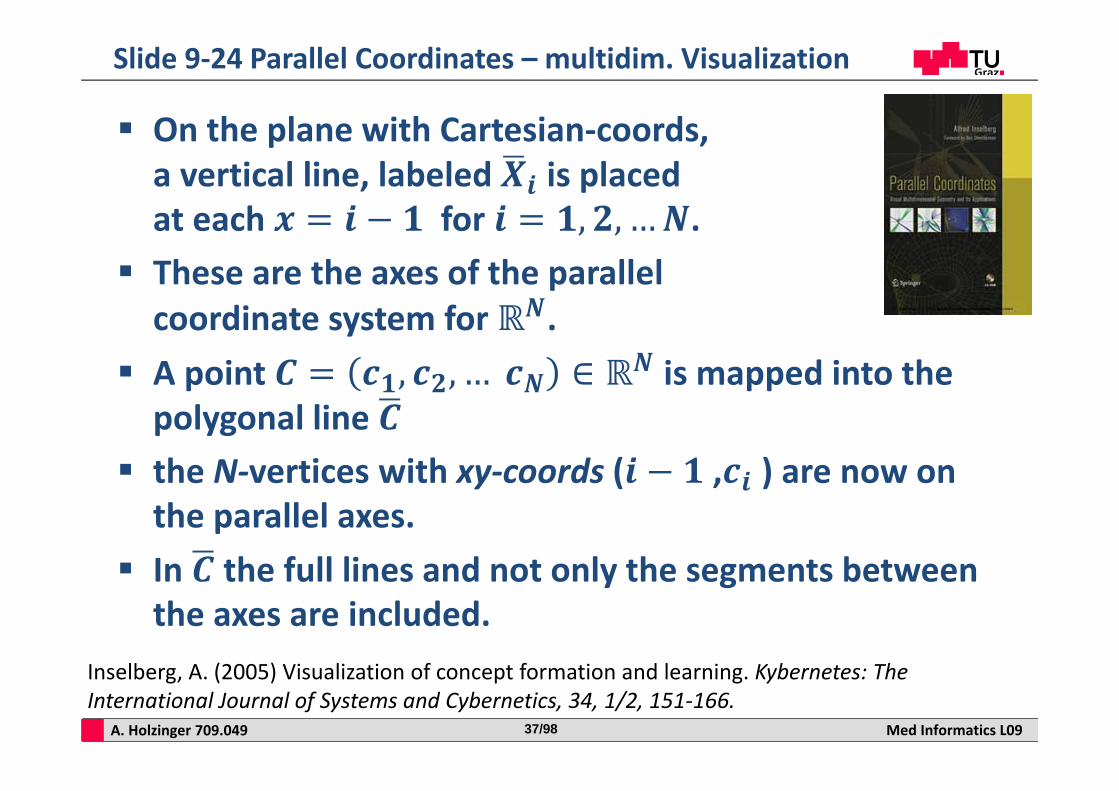
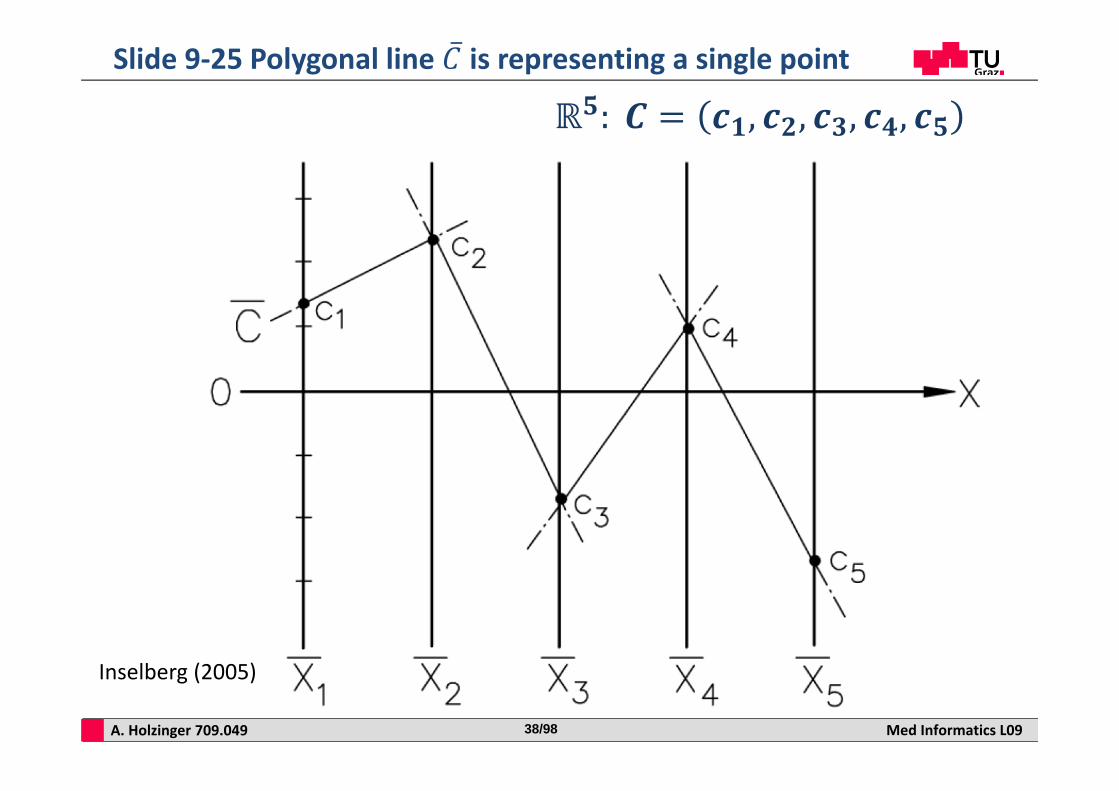
On the plane with Cartesian‐coords,a vertical line, labeled is placed at each for .
These are the axes of the parallel coordinate system for .
A point is mapped into the polygonal line
the N‐vertices with xy‐coords ( , ) are now on the parallel axes.
In the full lines and not only the segments between the axes are included.
Slide 9‐24 Parallel Coordinates – multidim. Visualization
Inselberg, A. (2005) Visualization of concept formation and learning. Kybernetes: The International Journal of Systems and Cybernetics, 34, 1/2, 151‐166.
A. Holzinger 709.049 Med Informatics L0938/98
Slide 9‐25 Polygonal line is representing a single point
Inselberg (2005)
A. Holzinger 709.049 Med Informatics L0939/98
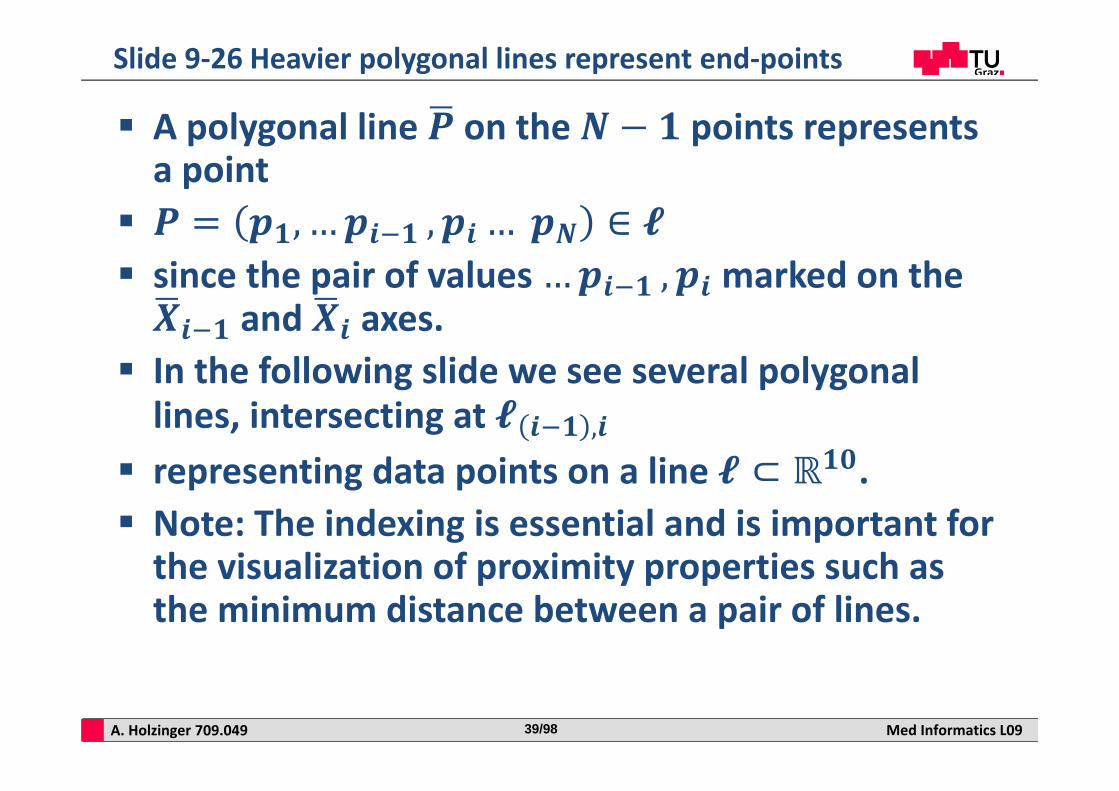
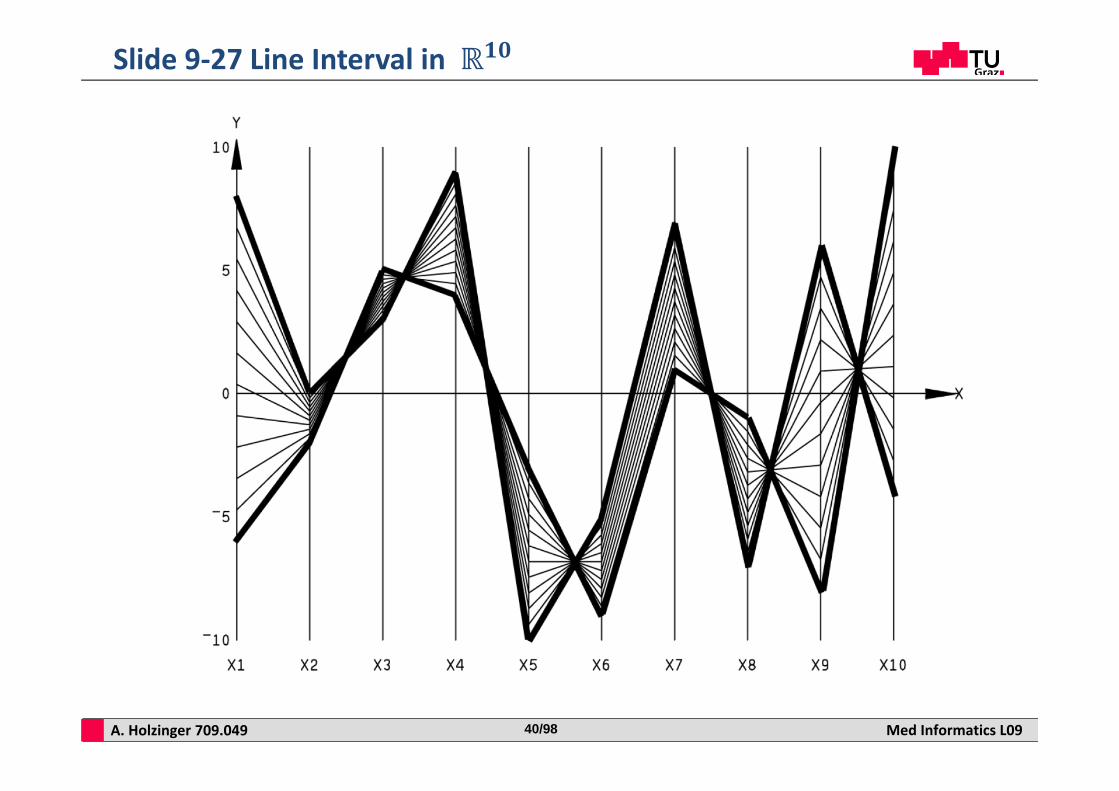
A polygonal line on the points represents a point
since the pair of values marked on the
and axes. In the following slide we see several polygonal lines, intersecting at ,
representing data points on a line . Note: The indexing is essential and is important for the visualization of proximity properties such as the minimum distance between a pair of lines.
Slide 9‐26 Heavier polygonal lines represent end‐points
A. Holzinger 709.049 Med Informatics L0940/98
Slide 9‐27 Line Interval in
A. Holzinger 709.049 Med Informatics L0941/98
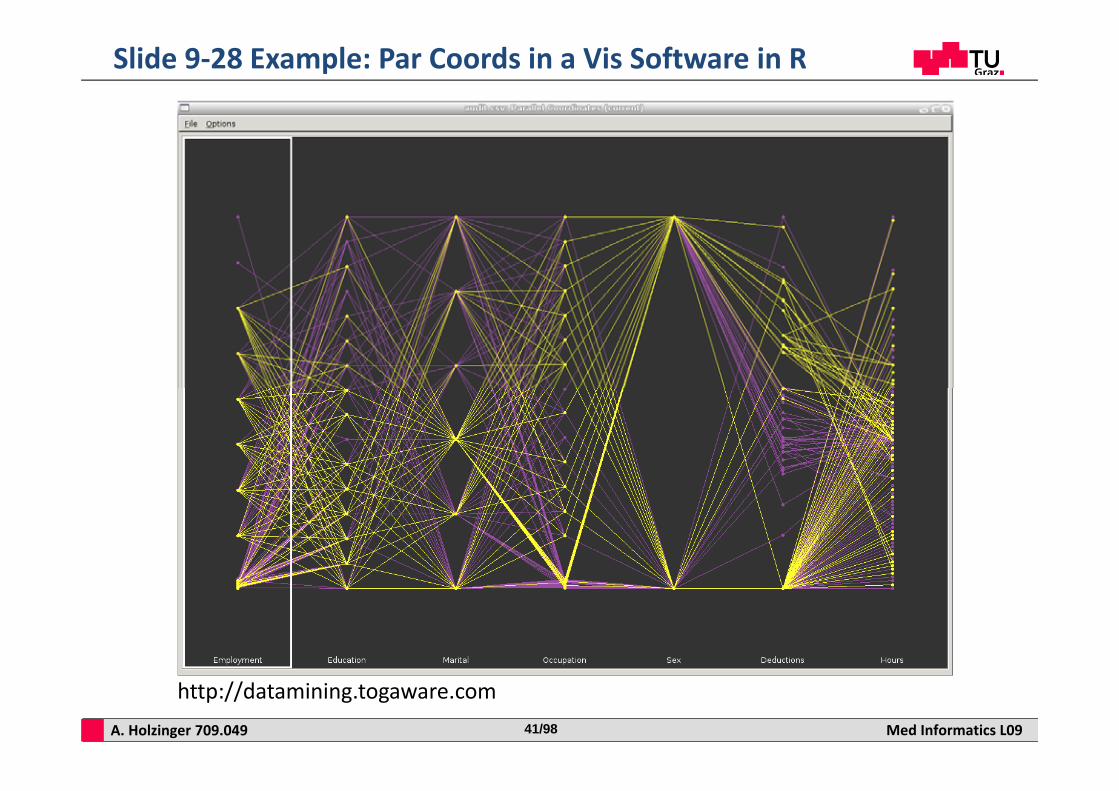
Slide 9‐28 Example: Par Coords in a Vis Software in R
http://datamining.togaware.com
A. Holzinger 709.049 Med Informatics L0942/98
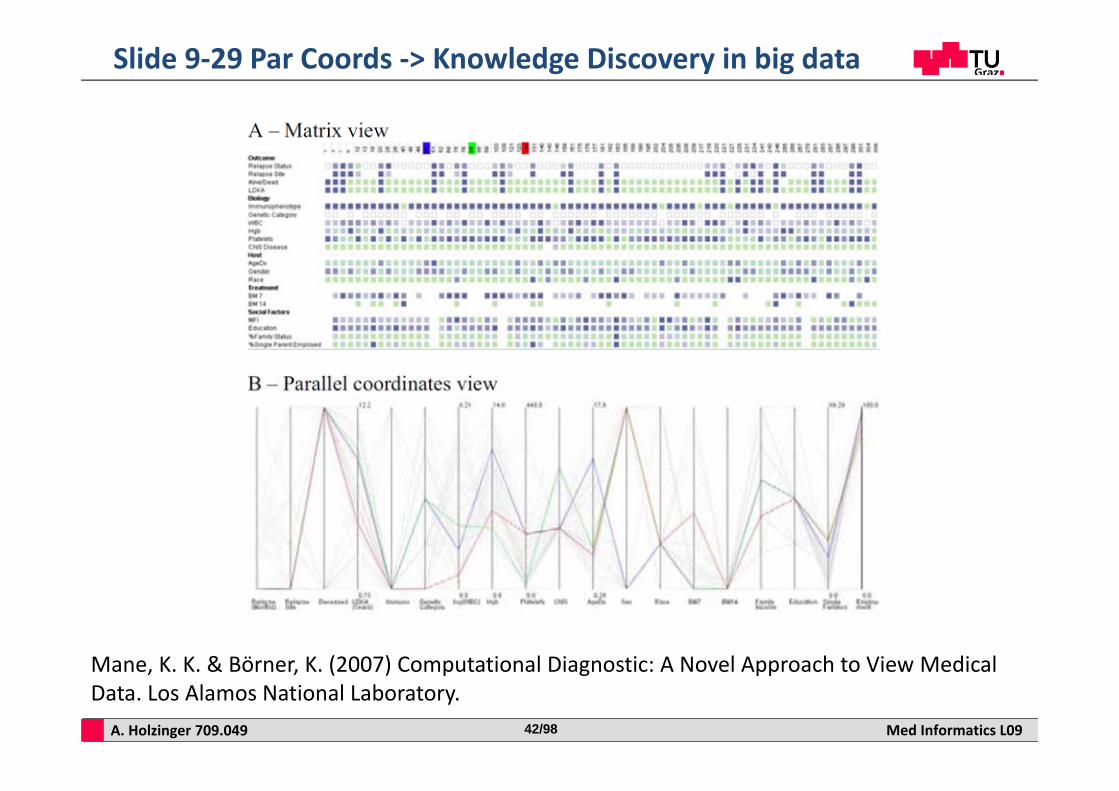
Slide 9‐29 Par Coords ‐> Knowledge Discovery in big data
Mane, K. K. & Börner, K. (2007) Computational Diagnostic: A Novel Approach to View Medical Data. Los Alamos National Laboratory.
A. Holzinger 709.049 Med Informatics L0943/98
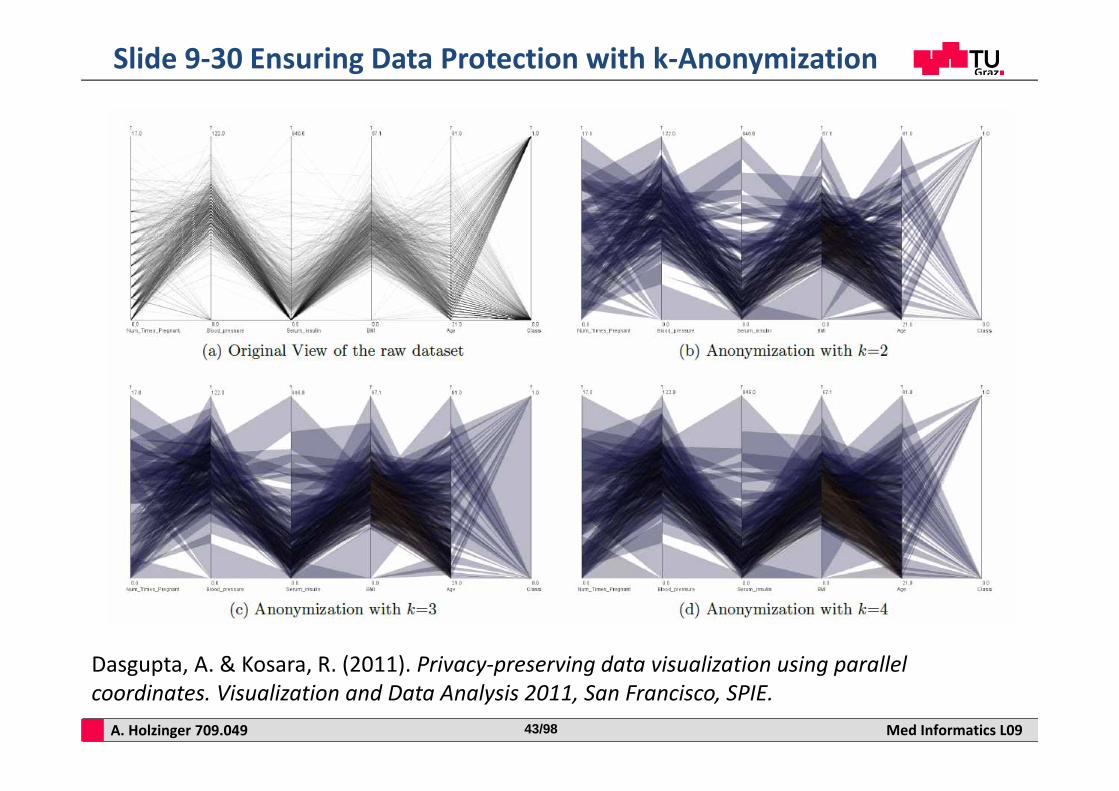
Slide 9‐30 Ensuring Data Protection with k‐Anonymization
Dasgupta, A. & Kosara, R. (2011). Privacy‐preserving data visualization using parallel coordinates. Visualization and Data Analysis 2011, San Francisco, SPIE.
A. Holzinger 709.049 Med Informatics L0944/98
Why are such approaches not used in enterprise hospital information systems?
A. Holzinger 709.049 Med Informatics L0945/98
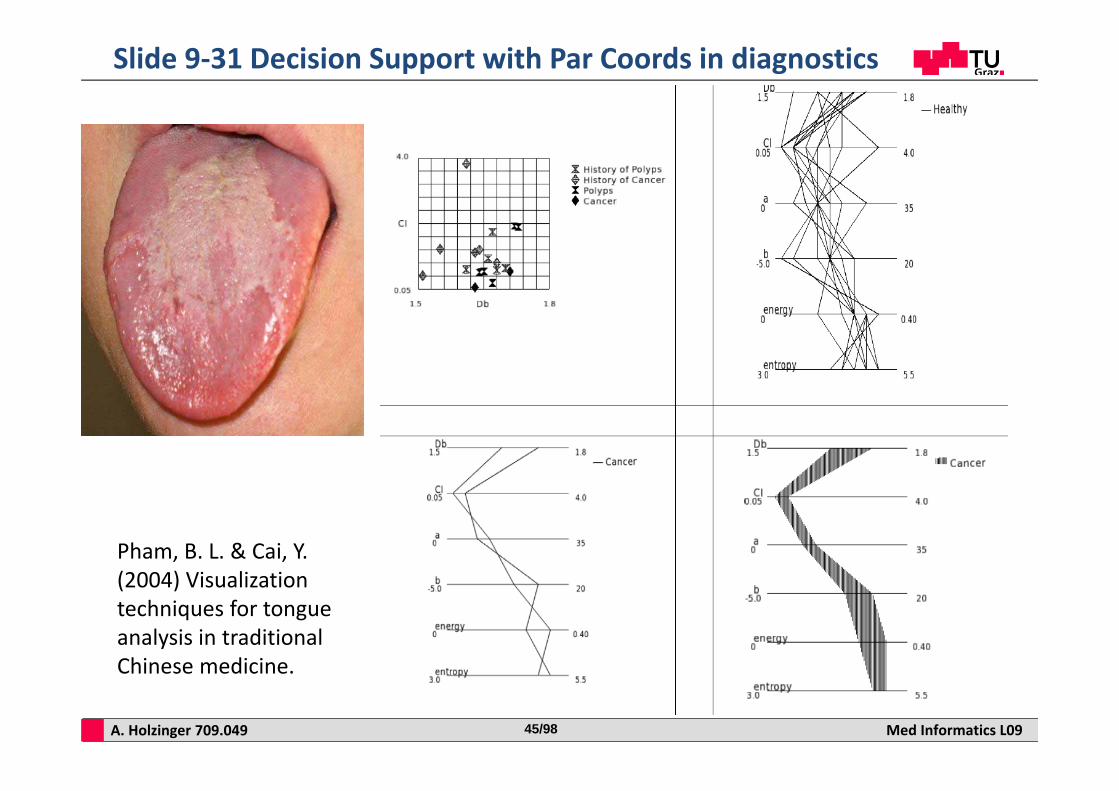
Slide 9‐31 Decision Support with Par Coords in diagnostics
Pham, B. L. & Cai, Y. (2004) Visualization techniques for tongue analysis in traditional Chinese medicine.
A. Holzinger 709.049 Med Informatics L0946/98
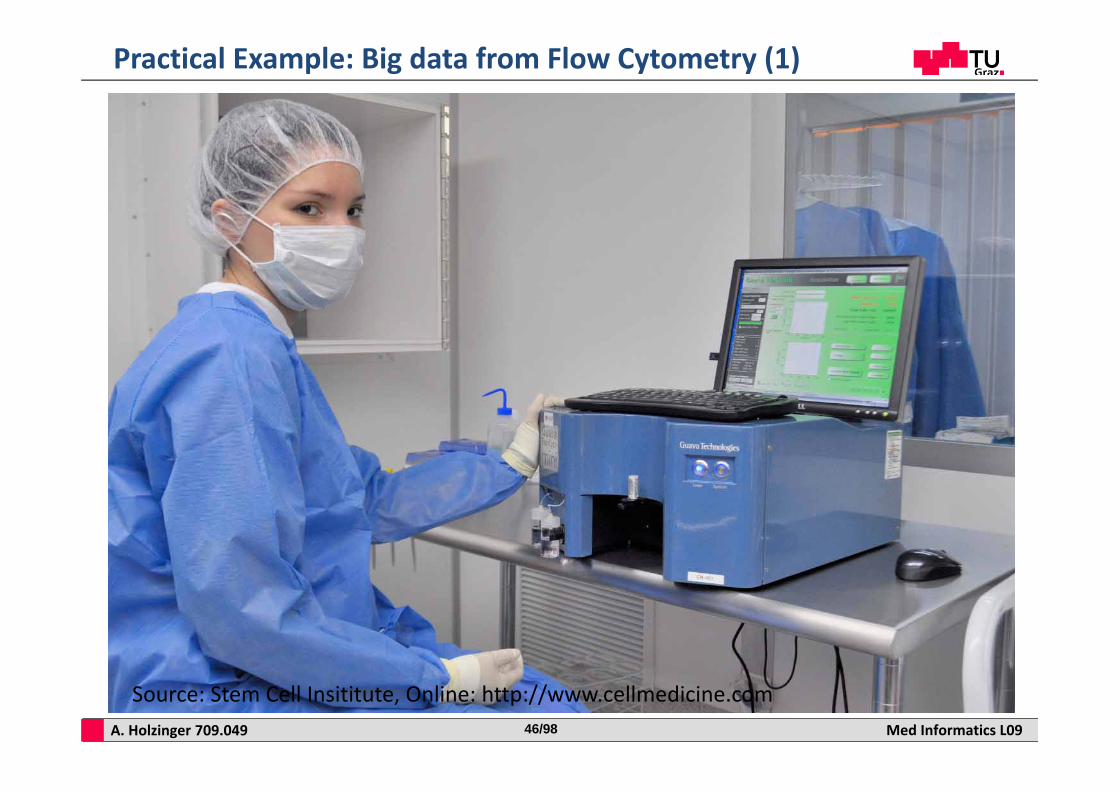
Practical Example: Big data from Flow Cytometry (1)
Source: Stem Cell Insititute, Online: http://www.cellmedicine.com
A. Holzinger 709.049 Med Informatics L0947/98
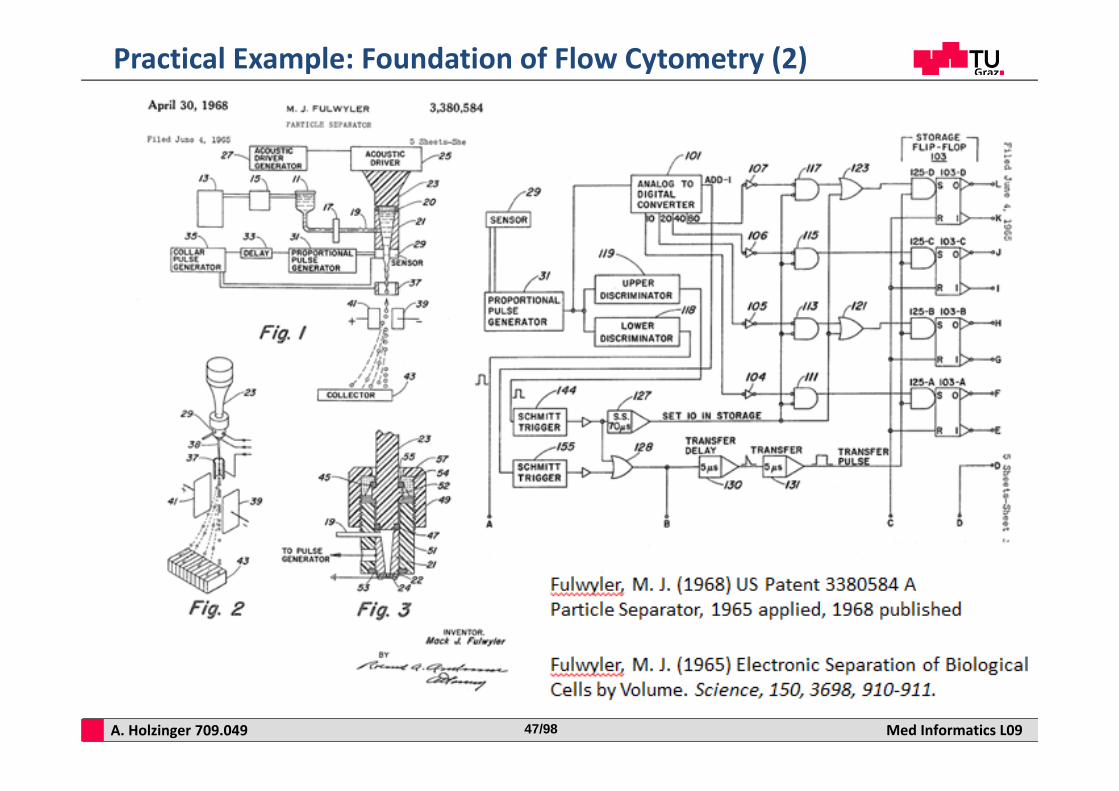
Practical Example: Foundation of Flow Cytometry (2)
Fulwyler, M. J. (1968) US Patent 3380584 A Particle Separator, 1965 applied, 1968 published
Fulwyler, M. J. (1965) Electronic Separation of Biological Cells by Volume. Science, 150, 3698, 910‐911.
A. Holzinger 709.049 Med Informatics L0948/98
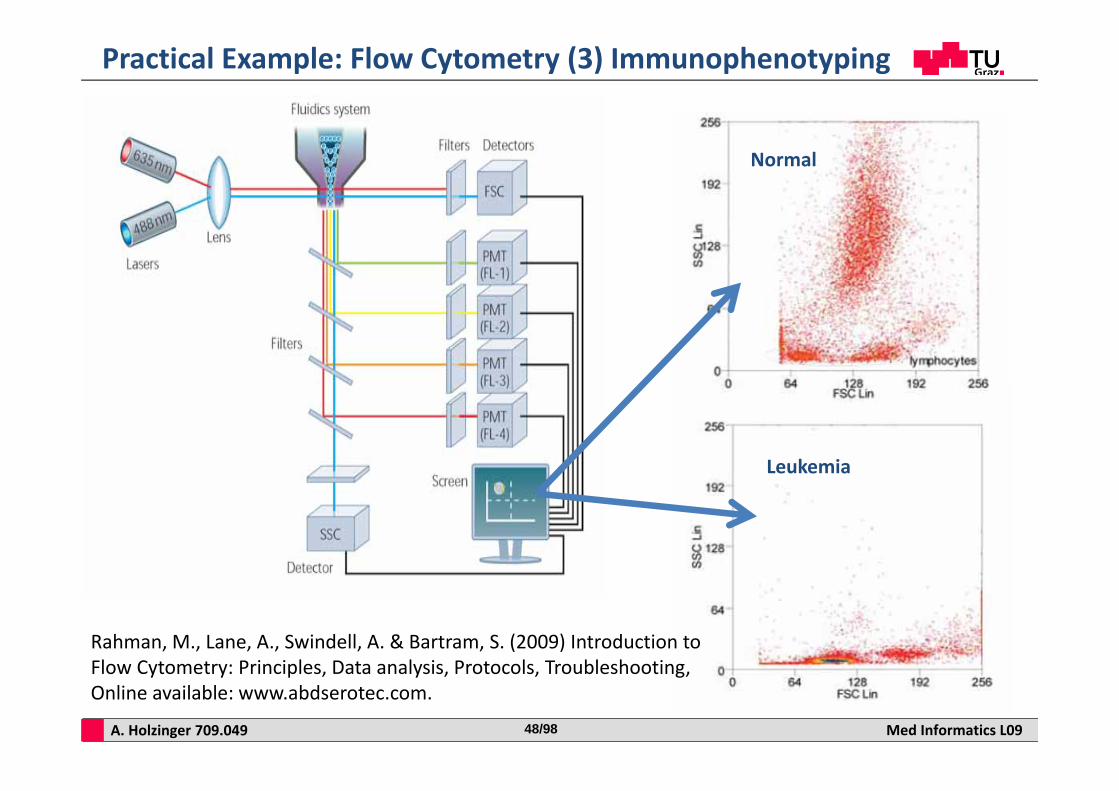
Leukemia
Practical Example: Flow Cytometry (3) Immunophenotyping
Rahman, M., Lane, A., Swindell, A. & Bartram, S. (2009) Introduction to Flow Cytometry: Principles, Data analysis, Protocols, Troubleshooting, Online available: www.abdserotec.com.
Normal
A. Holzinger 709.049 Med Informatics L0949/98
Leukemia
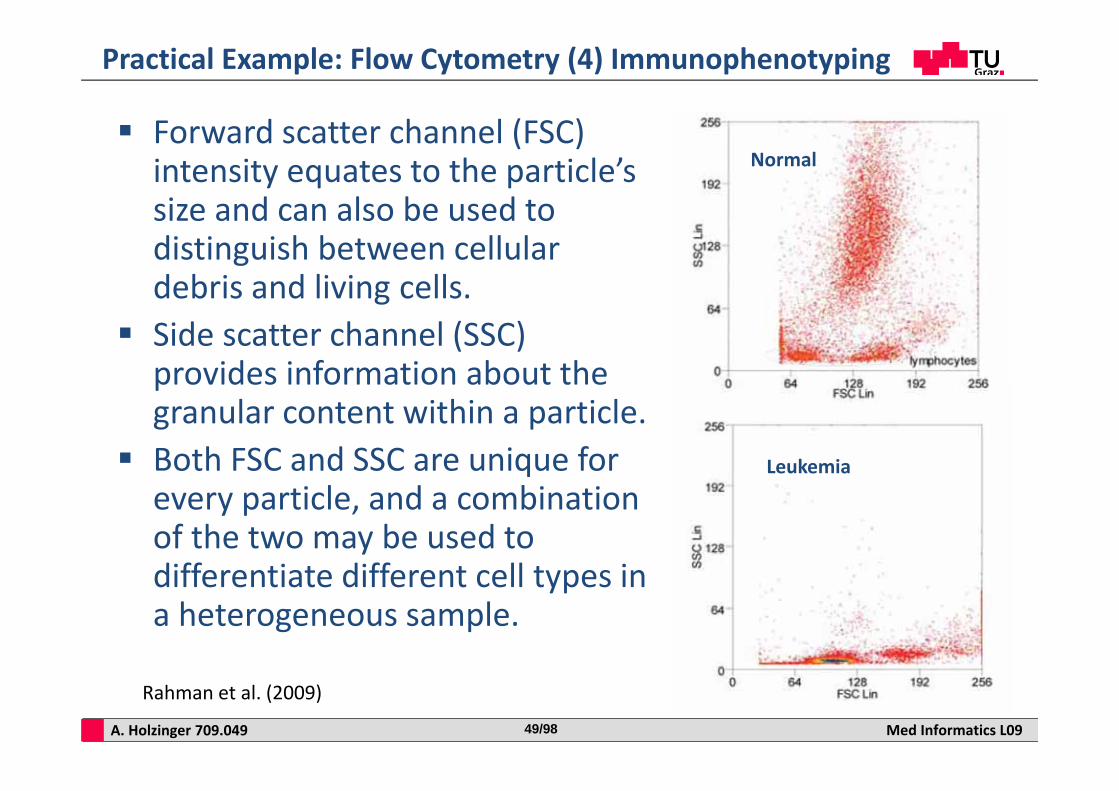
Practical Example: Flow Cytometry (4) Immunophenotyping
Forward scatter channel (FSC) intensity equates to the particle’s size and can also be used to distinguish between cellular debris and living cells.
Side scatter channel (SSC) provides information about the granular content within a particle.
Both FSC and SSC are unique for every particle, and a combination of the two may be used to differentiate different cell types in a heterogeneous sample.
Rahman et al. (2009)
Normal
A. Holzinger 709.049 Med Informatics L0950/98
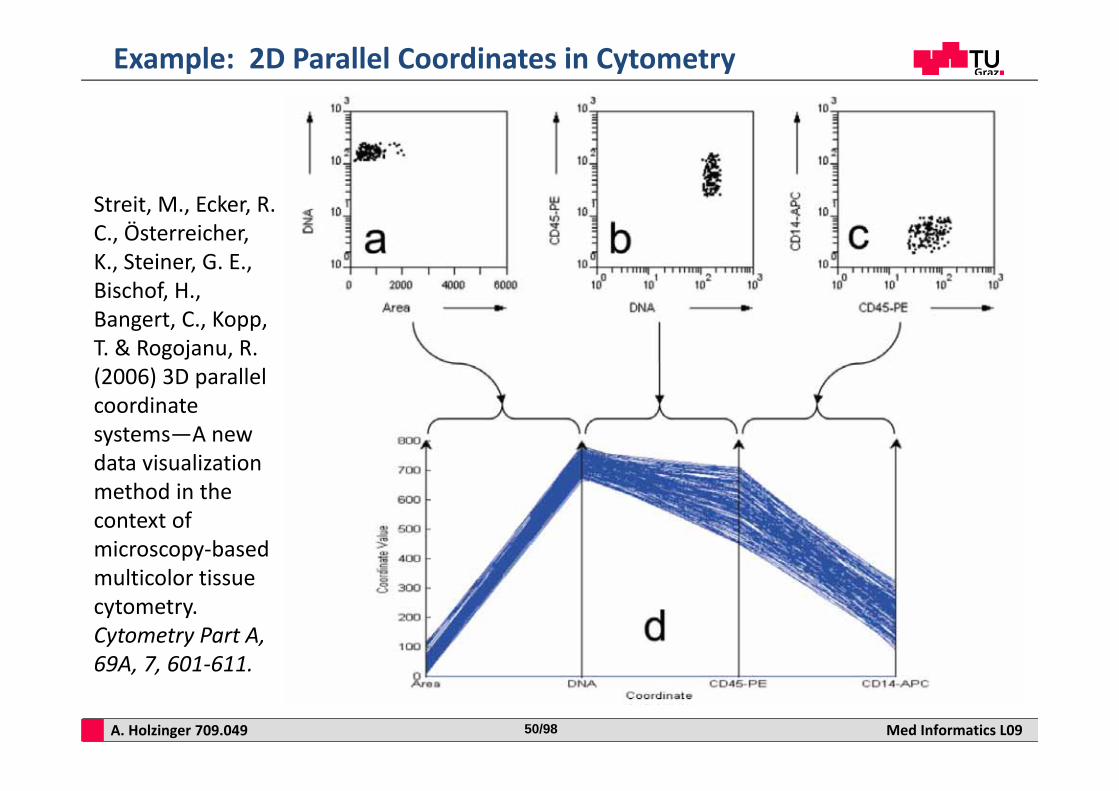
Example: 2D Parallel Coordinates in Cytometry
Streit, M., Ecker, R. C., Österreicher, K., Steiner, G. E., Bischof, H., Bangert, C., Kopp, T. & Rogojanu, R. (2006) 3D parallel coordinate systems—A new data visualization method in the context of microscopy‐based multicolor tissue cytometry. Cytometry Part A, 69A, 7, 601‐611.
A. Holzinger 709.049 Med Informatics L0951/98
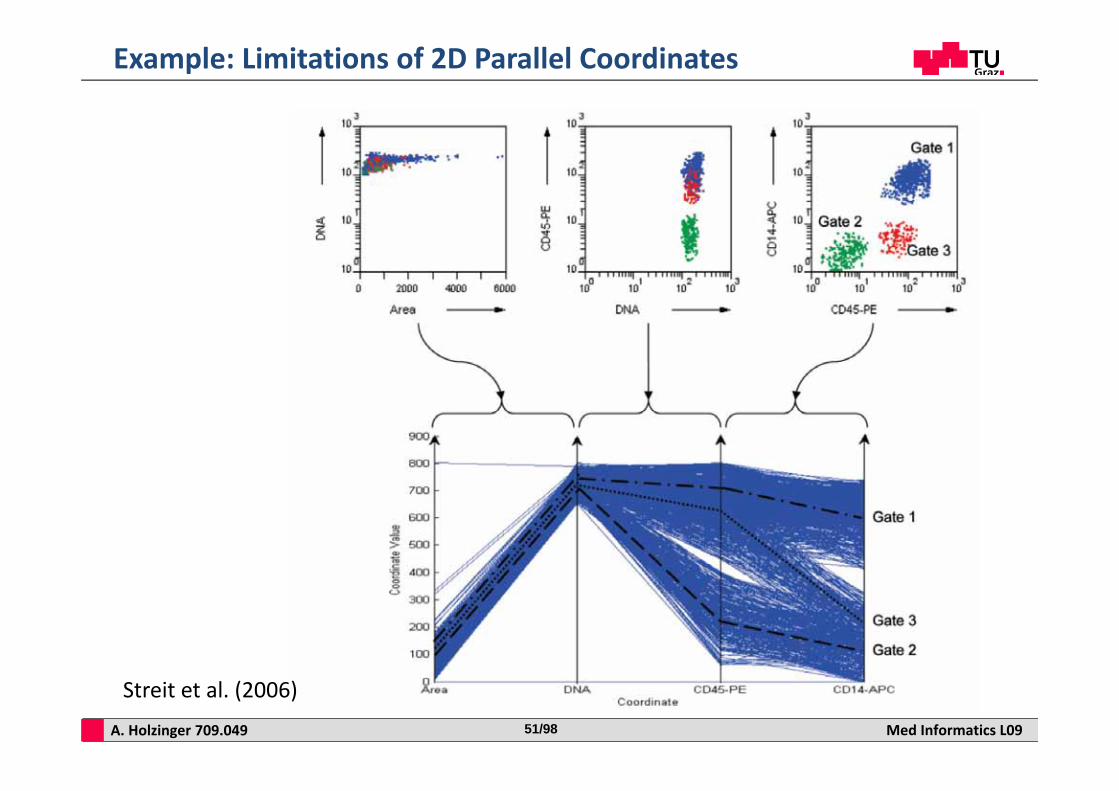
Example: Limitations of 2D Parallel Coordinates
Streit et al. (2006)
A. Holzinger 709.049 Med Informatics L0952/98
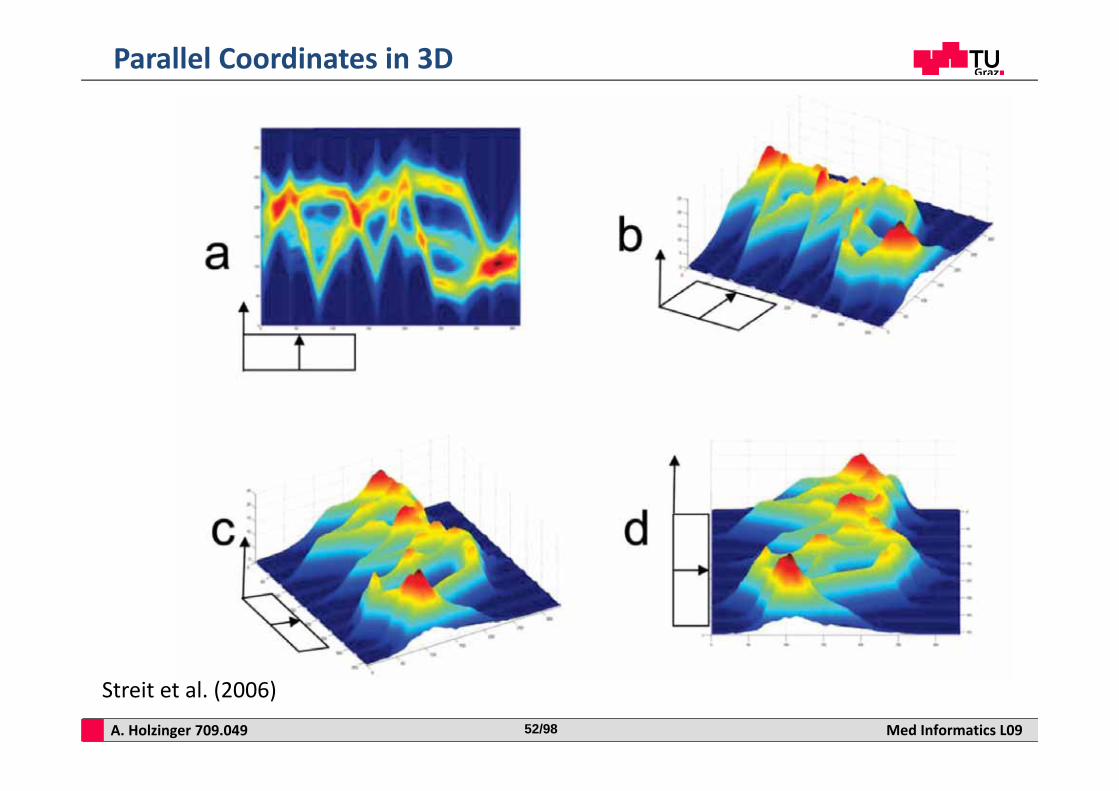
Parallel Coordinates in 3D
Streit et al. (2006)
A. Holzinger 709.049 Med Informatics L0953/98
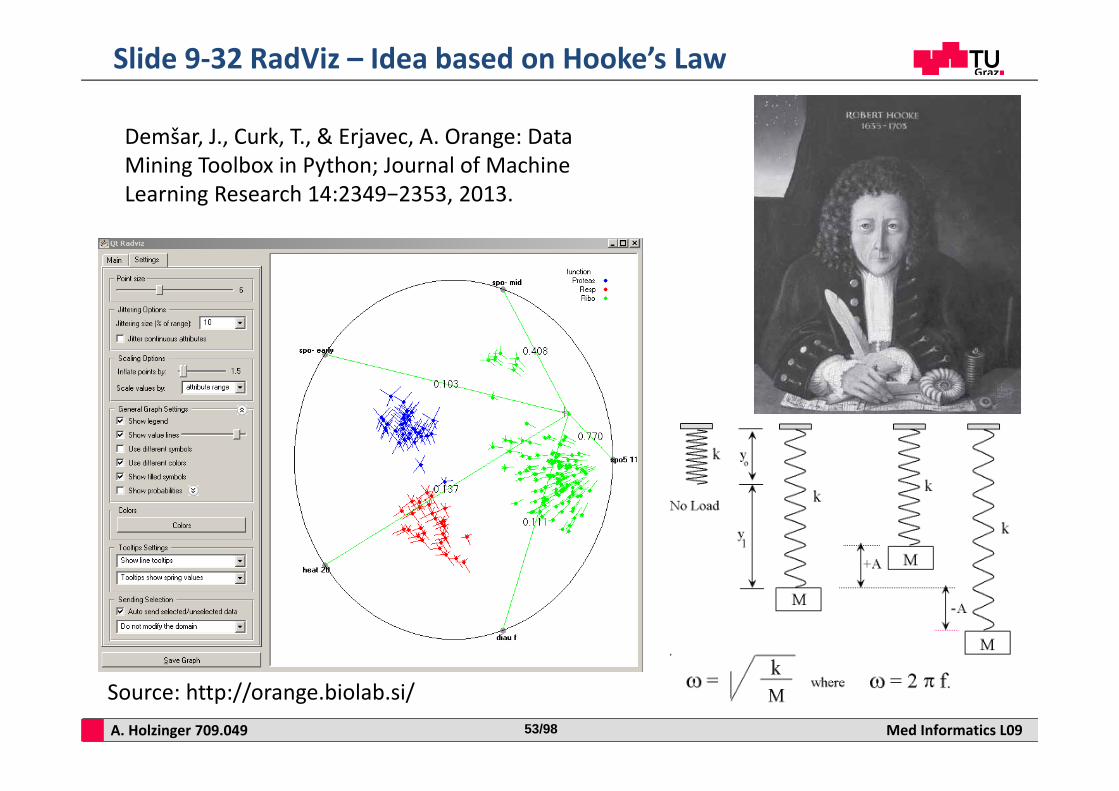
Slide 9‐32 RadViz – Idea based on Hooke’s Law
Source: http://orange.biolab.si/
Demšar, J., Curk, T., & Erjavec, A. Orange: Data Mining Toolbox in Python; Journal of Machine Learning Research 14:2349−2353, 2013.
A. Holzinger 709.049 Med Informatics L0954/98
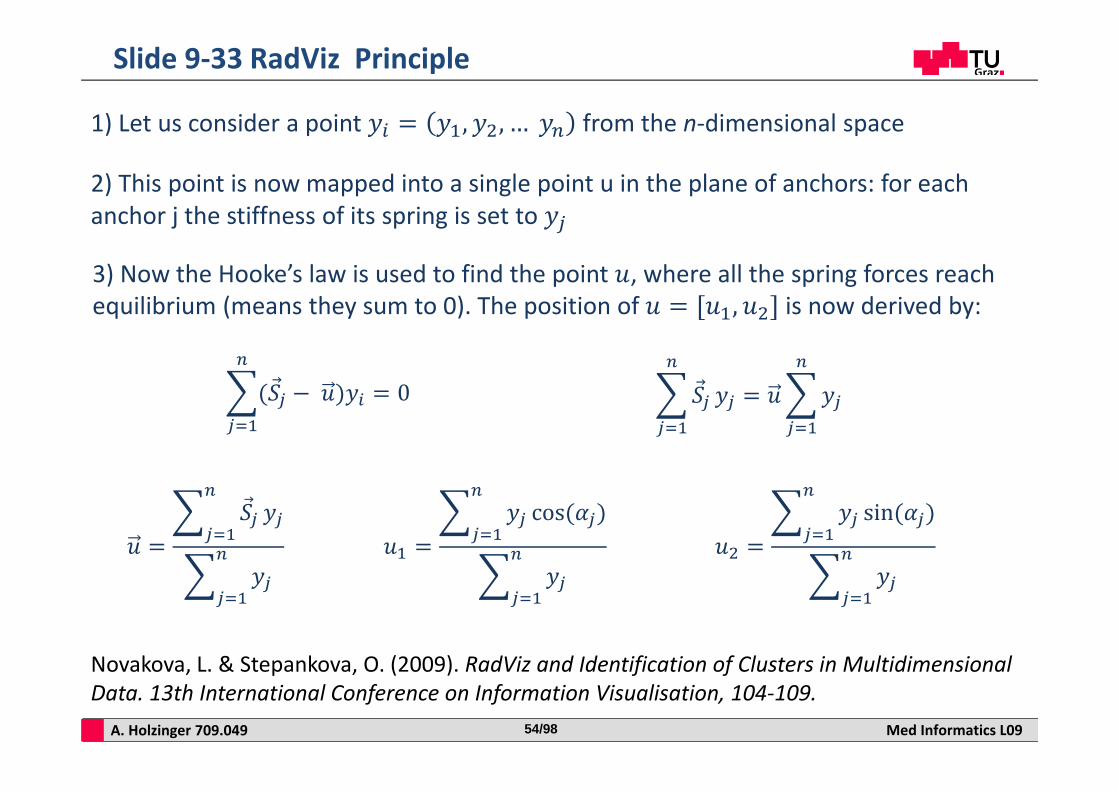
Slide 9‐33 RadViz Principle
1) Let us consider a point , , … from the n‐dimensional space
2) This point is now mapped into a single point u in the plane of anchors: for each anchor j the stiffness of its spring is set to
3) Now the Hooke’s law is used to find the point , where all the spring forces reach equilibrium (means they sum to 0). The position of , is now derived by:
0
cos sin
Novakova, L. & Stepankova, O. (2009). RadViz and Identification of Clusters in Multidimensional Data. 13th International Conference on Information Visualisation, 104‐109.
A. Holzinger 709.049 Med Informatics L0955/98
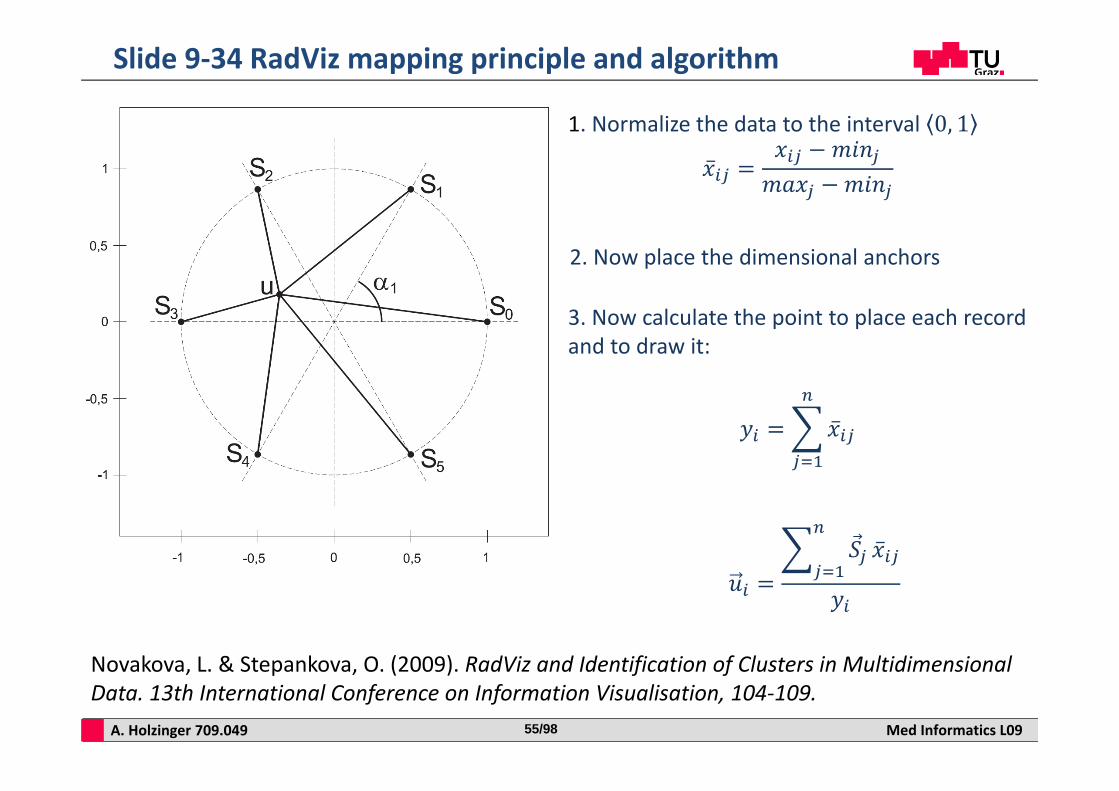
Slide 9‐34 RadViz mapping principle and algorithm
1. Normalize the data to the interval 0, 1
2. Now place the dimensional anchors
3. Now calculate the point to place each record and to draw it:
Novakova, L. & Stepankova, O. (2009). RadViz and Identification of Clusters in Multidimensional Data. 13th International Conference on Information Visualisation, 104‐109.
A. Holzinger 709.049 Med Informatics L0956/98
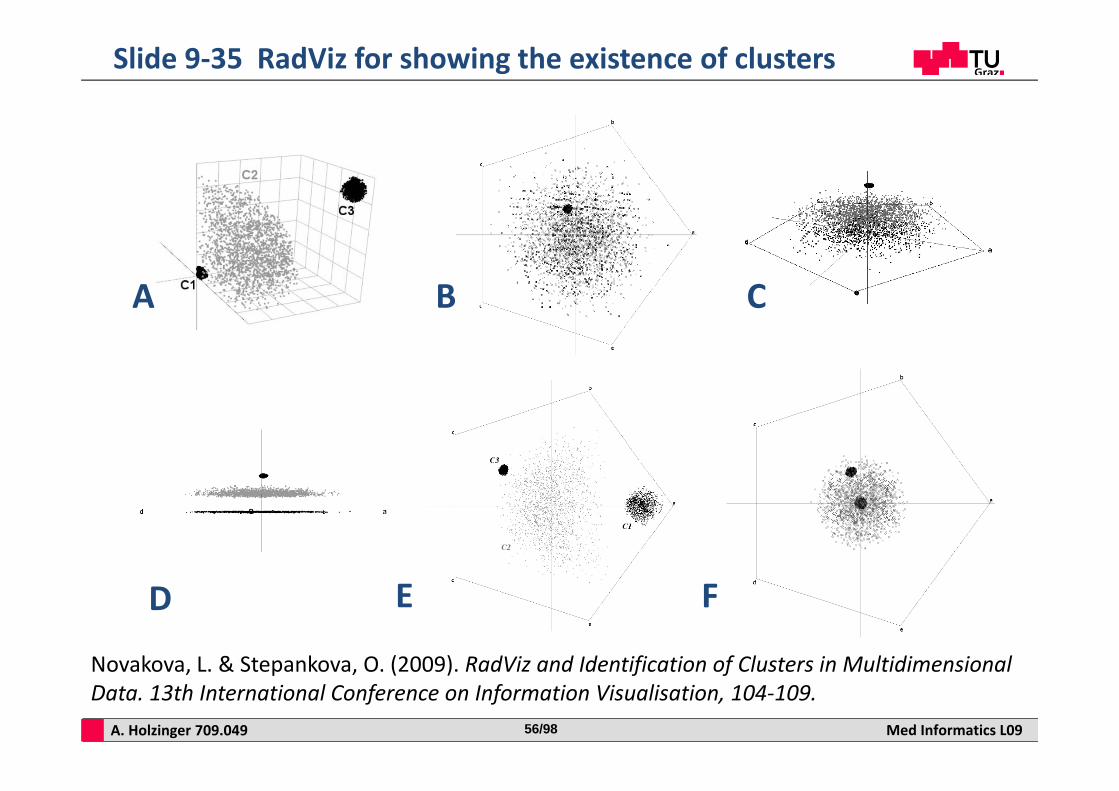
Slide 9‐35 RadViz for showing the existence of clusters
A B
D
C
FE
Novakova, L. & Stepankova, O. (2009). RadViz and Identification of Clusters in Multidimensional Data. 13th International Conference on Information Visualisation, 104‐109.
A. Holzinger 709.049 Med Informatics L0957/98
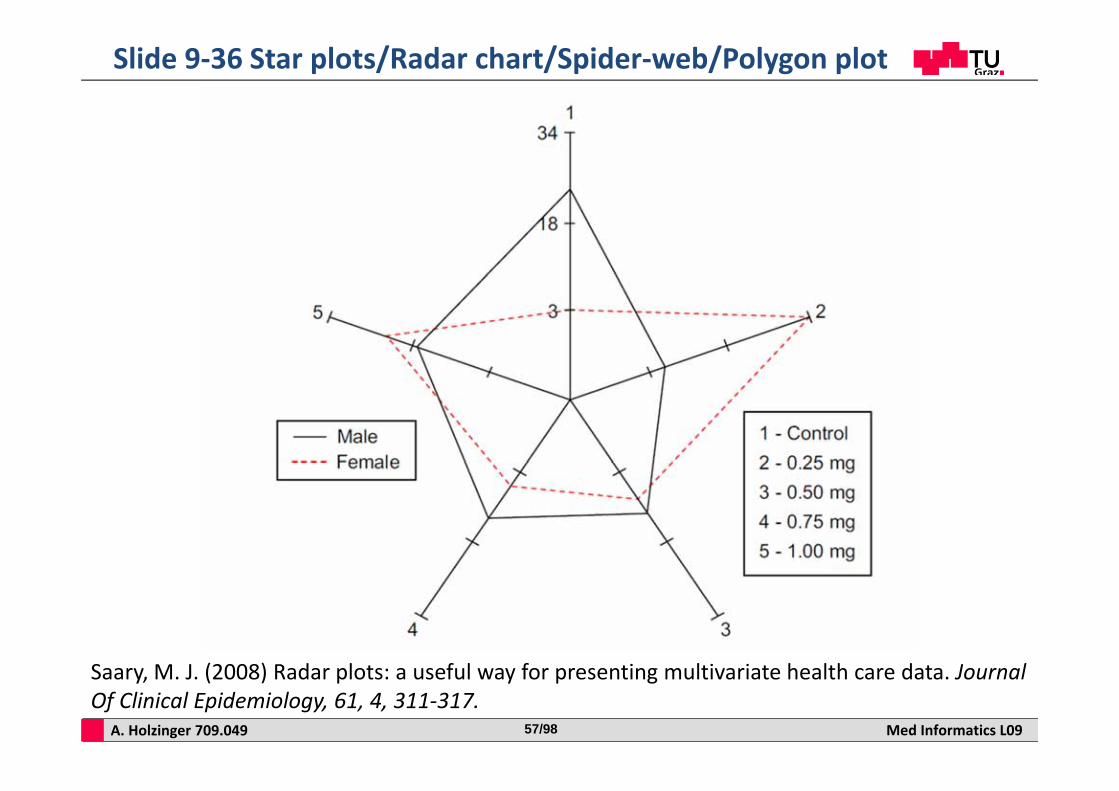
Slide 9‐36 Star plots/Radar chart/Spider‐web/Polygon plot
Saary, M. J. (2008) Radar plots: a useful way for presenting multivariate health care data. Journal Of Clinical Epidemiology, 61, 4, 311‐317.
A. Holzinger 709.049 Med Informatics L0958/98
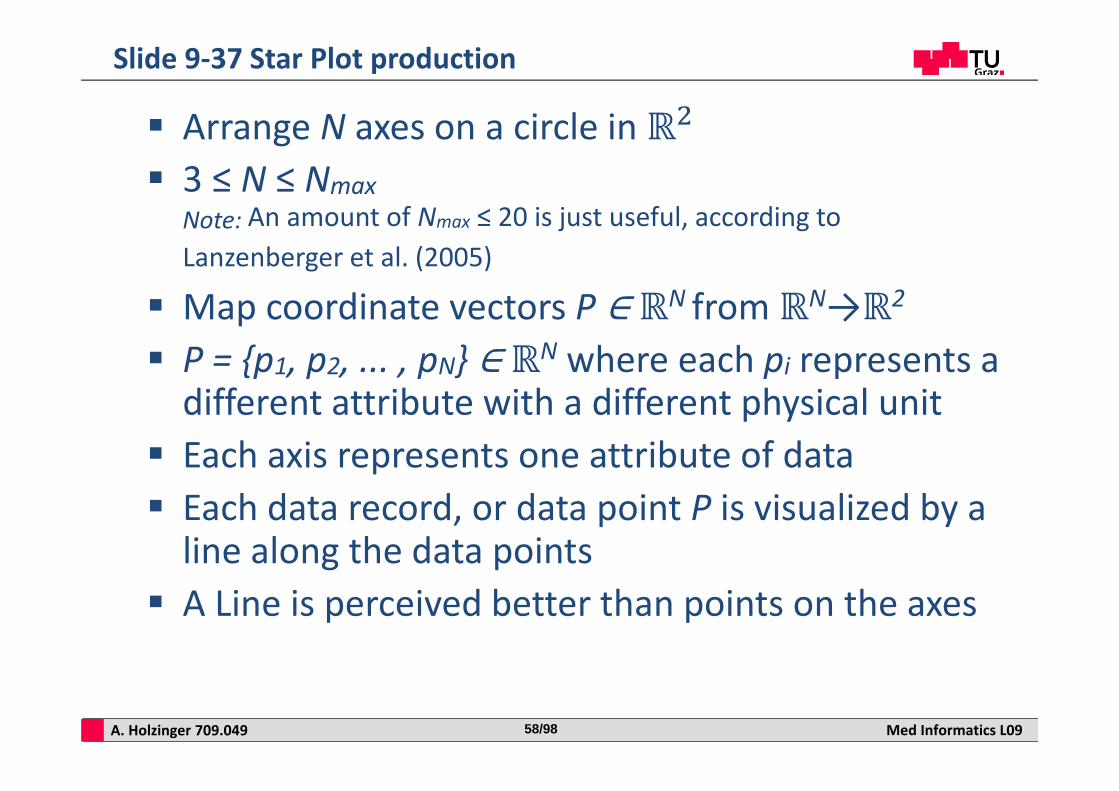
Arrange N axes on a circle in 3 ≤ N ≤ Nmax
Note: An amount of Nmax ≤ 20 is just useful, according to Lanzenberger et al. (2005)
Map coordinate vectors P N from N→ 2
P = {p1, p2, ... , pN} N where each pi represents a different attribute with a different physical unit
Each axis represents one attribute of data Each data record, or data point P is visualized by a line along the data points
A Line is perceived better than points on the axes
Slide 9‐37 Star Plot production
A. Holzinger 709.049 Med Informatics L0959/98
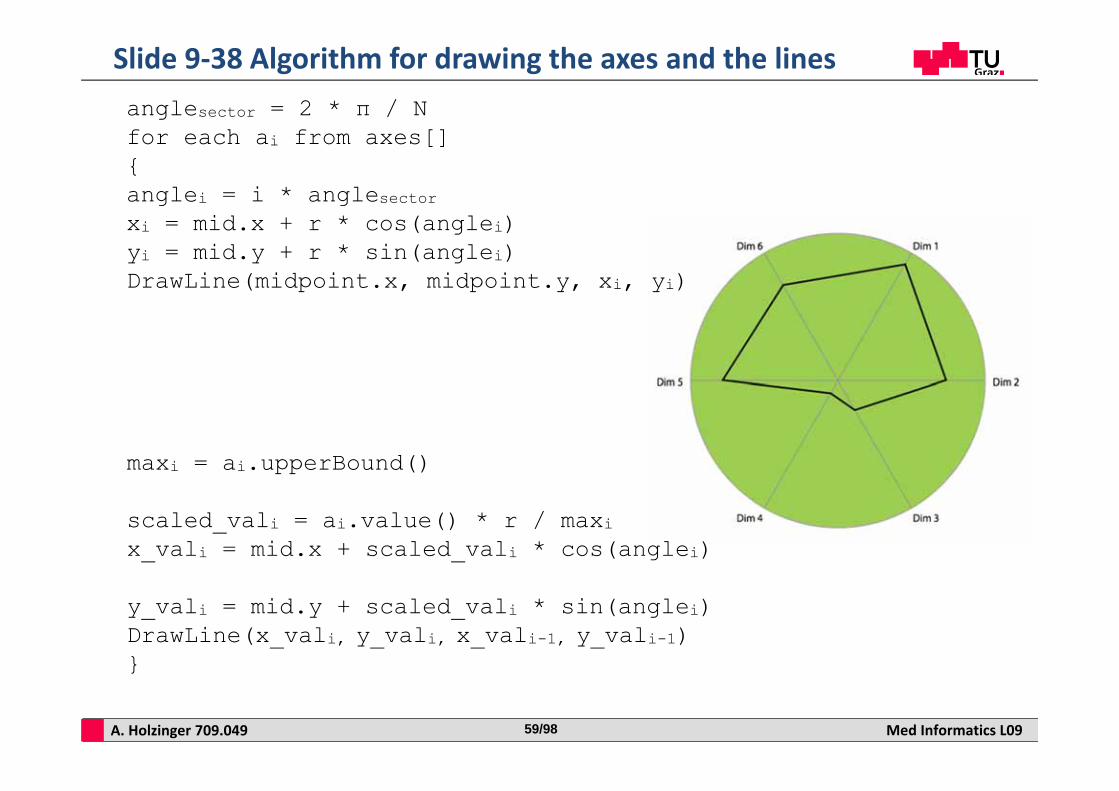
anglesector = 2 * π / Nfor each ai from axes[]{anglei = i * anglesectorxi = mid.x + r * cos(anglei)yi = mid.y + r * sin(anglei)DrawLine(midpoint.x, midpoint.y, xi, yi)
Slide 9‐38 Algorithm for drawing the axes and the lines
maxi = ai.upperBound()
scaled_vali = ai.value() * r / maxix_vali = mid.x + scaled_vali * cos(anglei)
y_vali = mid.y + scaled_vali * sin(anglei)DrawLine(x_vali, y_vali, x_vali-1, y_vali-1)}
A. Holzinger 709.049 Med Informatics L0960/98
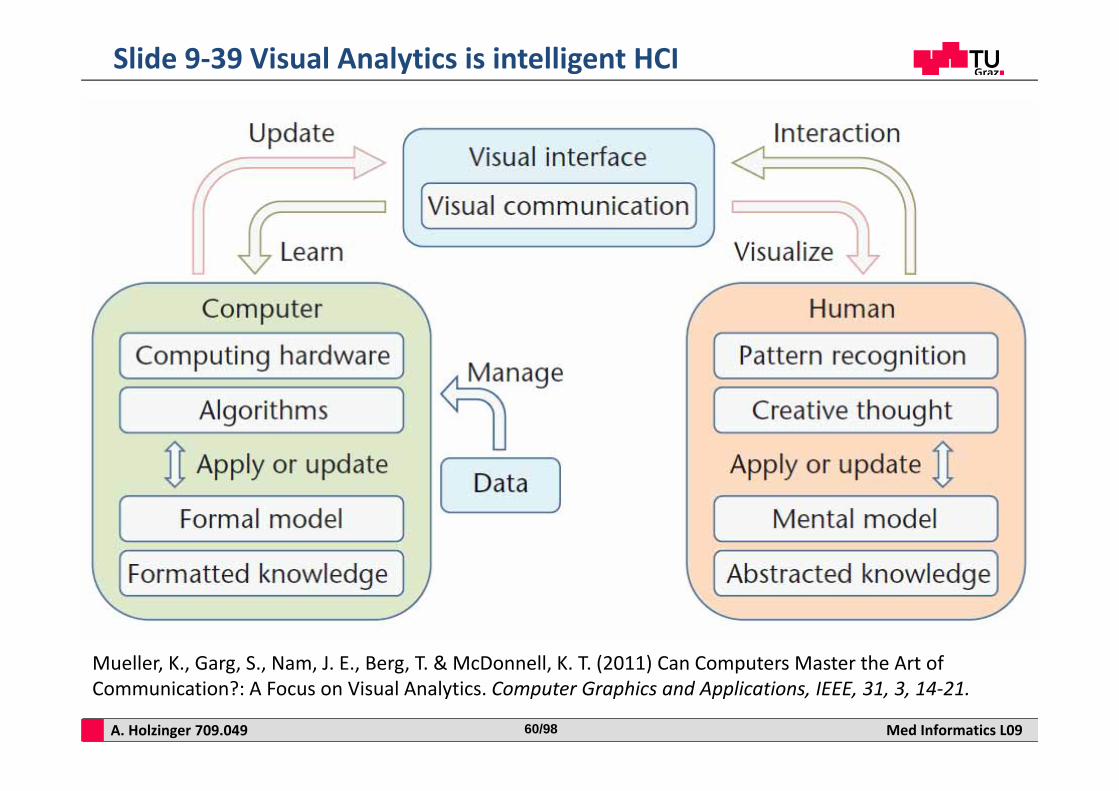
Slide 9‐39 Visual Analytics is intelligent HCI
Mueller, K., Garg, S., Nam, J. E., Berg, T. & McDonnell, K. T. (2011) Can Computers Master the Art of Communication?: A Focus on Visual Analytics. Computer Graphics and Applications, IEEE, 31, 3, 14‐21.
A. Holzinger 709.049 Med Informatics L0961/98
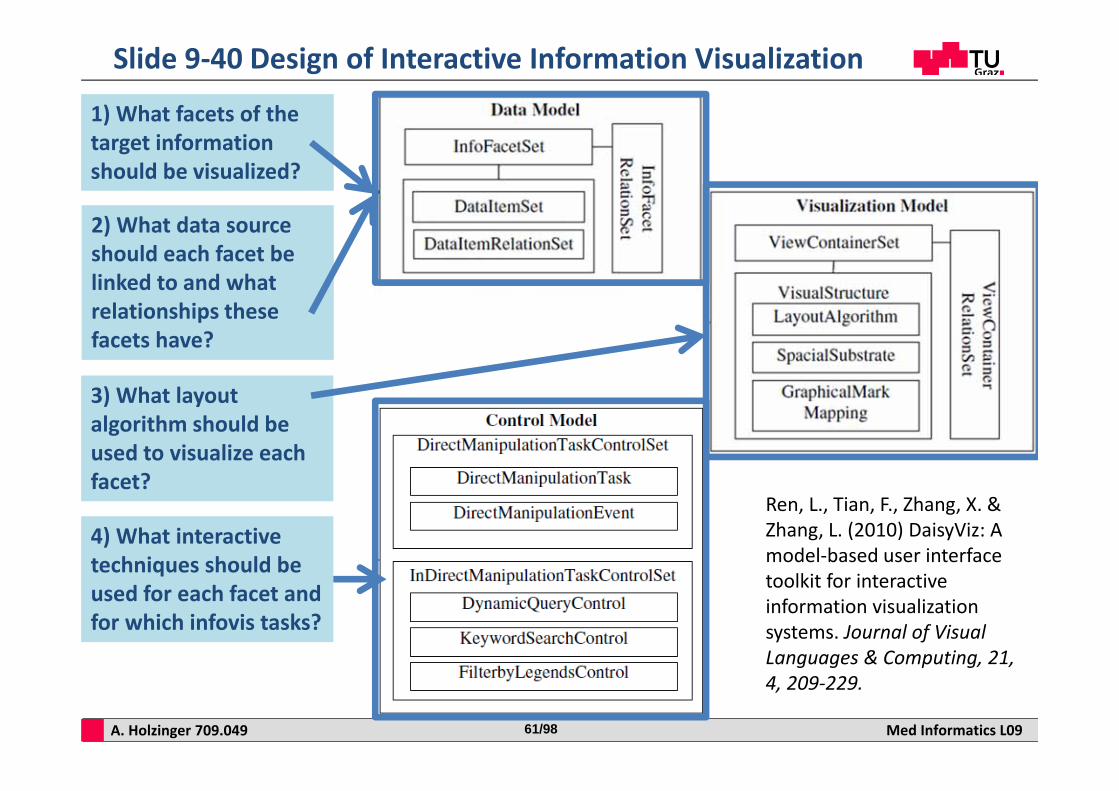
Slide 9‐40 Design of Interactive Information Visualization
Ren, L., Tian, F., Zhang, X. & Zhang, L. (2010) DaisyViz: A model‐based user interface toolkit for interactive information visualization systems. Journal of Visual Languages & Computing, 21,4, 209‐229.
1) What facets of the target information should be visualized?
2) What data source should each facet be linked to and what relationships these facets have?
3) What layout algorithm should be used to visualize each facet?
4) What interactive techniques should be used for each facet and for which infovis tasks?
A. Holzinger 709.049 Med Informatics L0962/98
1) Overview: Gain an overview about the entire data set (know your data!);
2) Zoom : Zoom in on items of interest; 3) Filter: filter out uninteresting items – get rid of distractors – eliminate irrelevant information;
4) Details‐on‐demand: Select an item or group and provide details when needed;
5) Relate: View relationships among items; 6) History: Keep a history of actions to support undo, replay, and progressive refinement;
7) Extract: Allow extraction of sub‐collections and of the query parameters;
Slide 9‐41 Overview first ‐ then zoom and filter on Demand
*) Shneiderman, B. (1996). The Eyes Have It: A Task by Data Type Taxonomy for Information Visualizations. Proceedings of the 1996 IEEE Symposium on Visual Languages, 336‐343.
A. Holzinger 709.049 Med Informatics L0963/98
Slide 9‐42 Letting the user interactively manipulate the data
Focus Selection = via direct manipulation and selection tools, e.g. multi‐touch (in data space a n‐dim location might be indicated);
Extent Selection = specifying extents for an interaction, e.g. via a vector of values (a range for each data dimension or a set of constraints;
Interaction type selection = e.g. a pair of menus: one to select the space, and the other to specify the general class of the interaction;
Interaction level selection = e.g. the magnitude of scaling that will occur at the focal point (via a slider, along with a reset button)
Ward, M., Grinstein, G. & Keim, D. (2010) Interactive Data Visualization: Foundations, Techniques and Applications. Natick (MA), Peters.
A. Holzinger 709.049 Med Informatics L0964/98
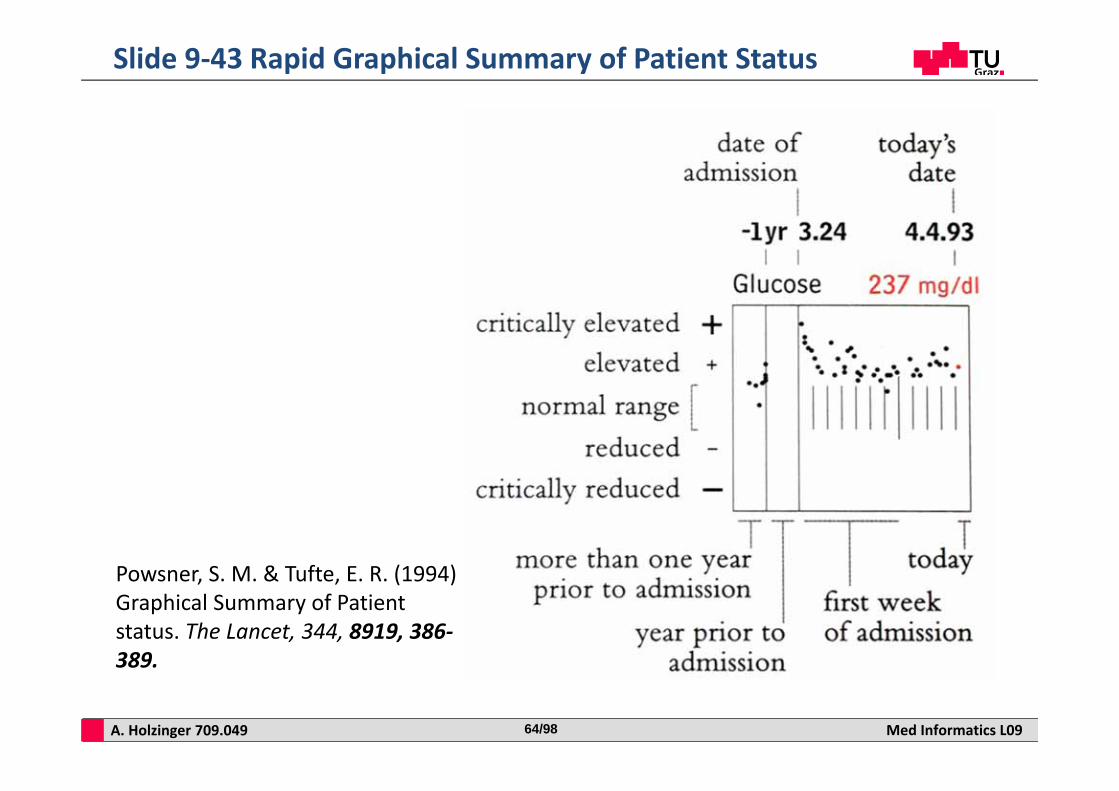
Slide 9‐43 Rapid Graphical Summary of Patient Status
Powsner, S. M. & Tufte, E. R. (1994) Graphical Summary of Patient status. The Lancet, 344, 8919, 386‐389.
A. Holzinger 709.049 Med Informatics L0965/98
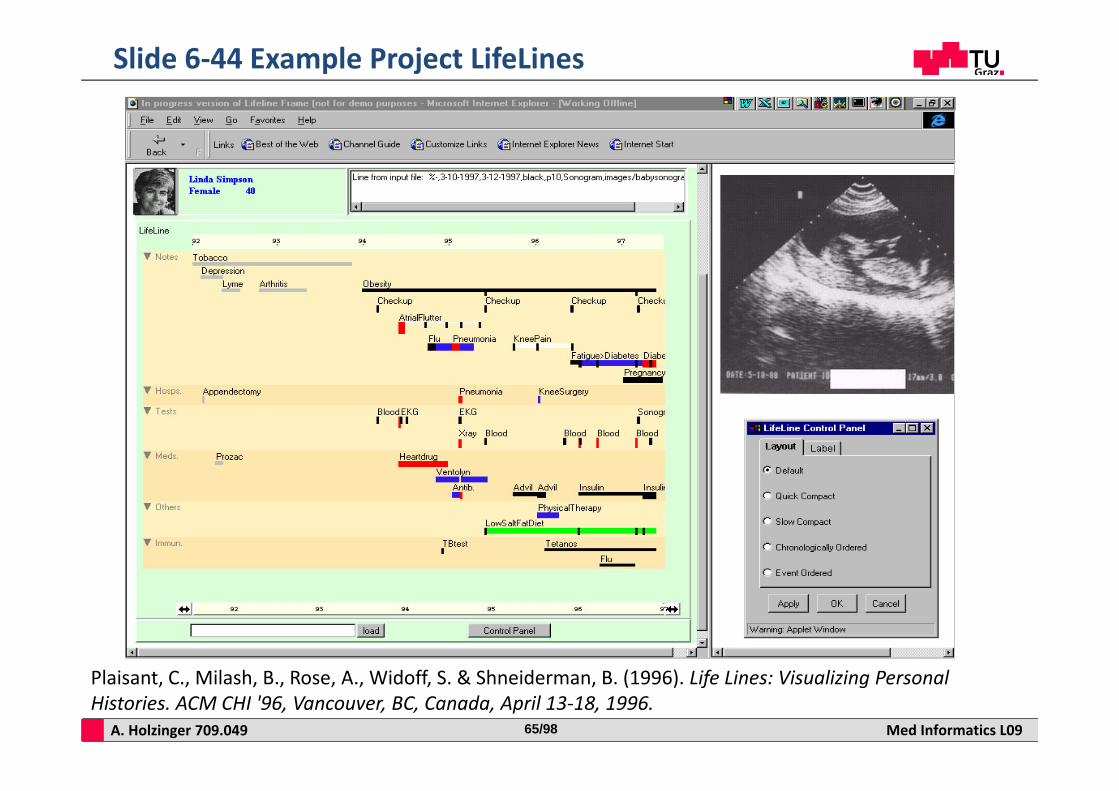
Slide 6‐44 Example Project LifeLines
Plaisant, C., Milash, B., Rose, A., Widoff, S. & Shneiderman, B. (1996). Life Lines: Visualizing Personal Histories. ACM CHI '96, Vancouver, BC, Canada, April 13‐18, 1996.
A. Holzinger 709.049 Med Informatics L0966/98
What are temporal analysis tasks?
A. Holzinger 709.049 Med Informatics L0967/98
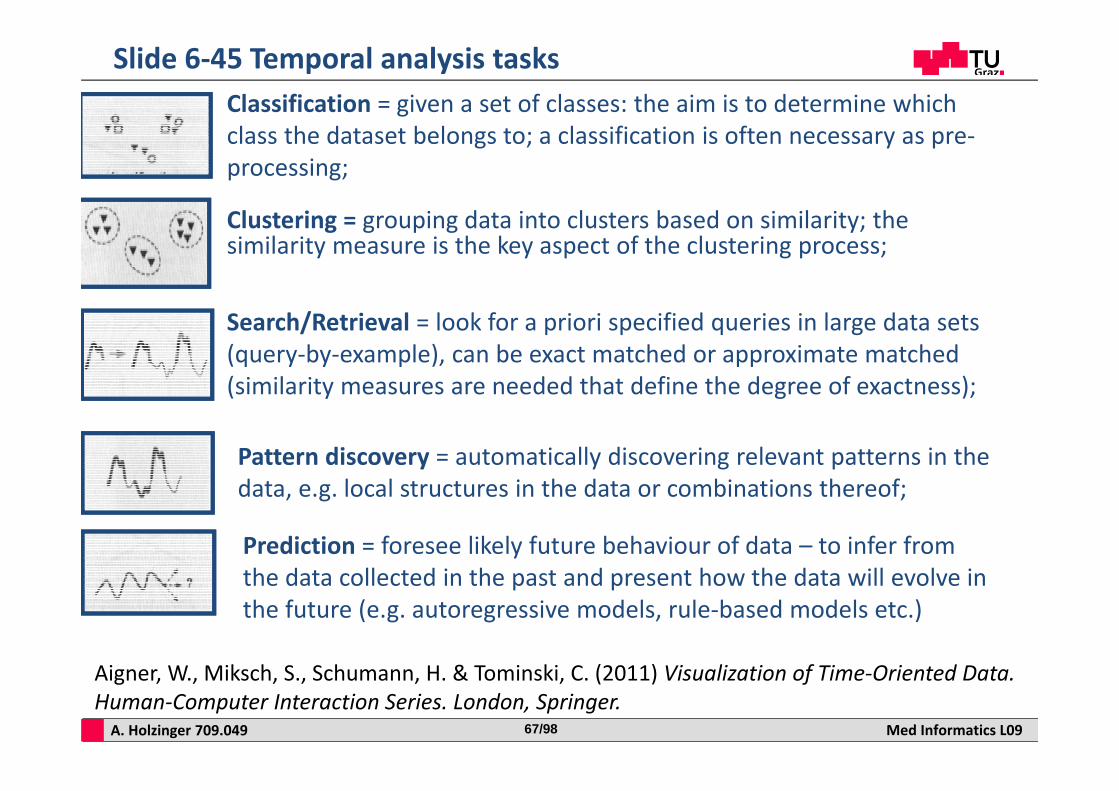
Slide 6‐45 Temporal analysis tasks
Aigner, W., Miksch, S., Schumann, H. & Tominski, C. (2011) Visualization of Time‐Oriented Data. Human‐Computer Interaction Series. London, Springer.
Clustering = grouping data into clusters based on similarity; the similarity measure is the key aspect of the clustering process;
Search/Retrieval = look for a priori specified queries in large data sets (query‐by‐example), can be exact matched or approximate matched (similarity measures are needed that define the degree of exactness);
Classification = given a set of classes: the aim is to determine which class the dataset belongs to; a classification is often necessary as pre‐processing;
Pattern discovery = automatically discovering relevant patterns in the data, e.g. local structures in the data or combinations thereof;
Prediction = foresee likely future behaviour of data – to infer from the data collected in the past and present how the data will evolve in the future (e.g. autoregressive models, rule‐based models etc.)
A. Holzinger 709.049 Med Informatics L0968/98
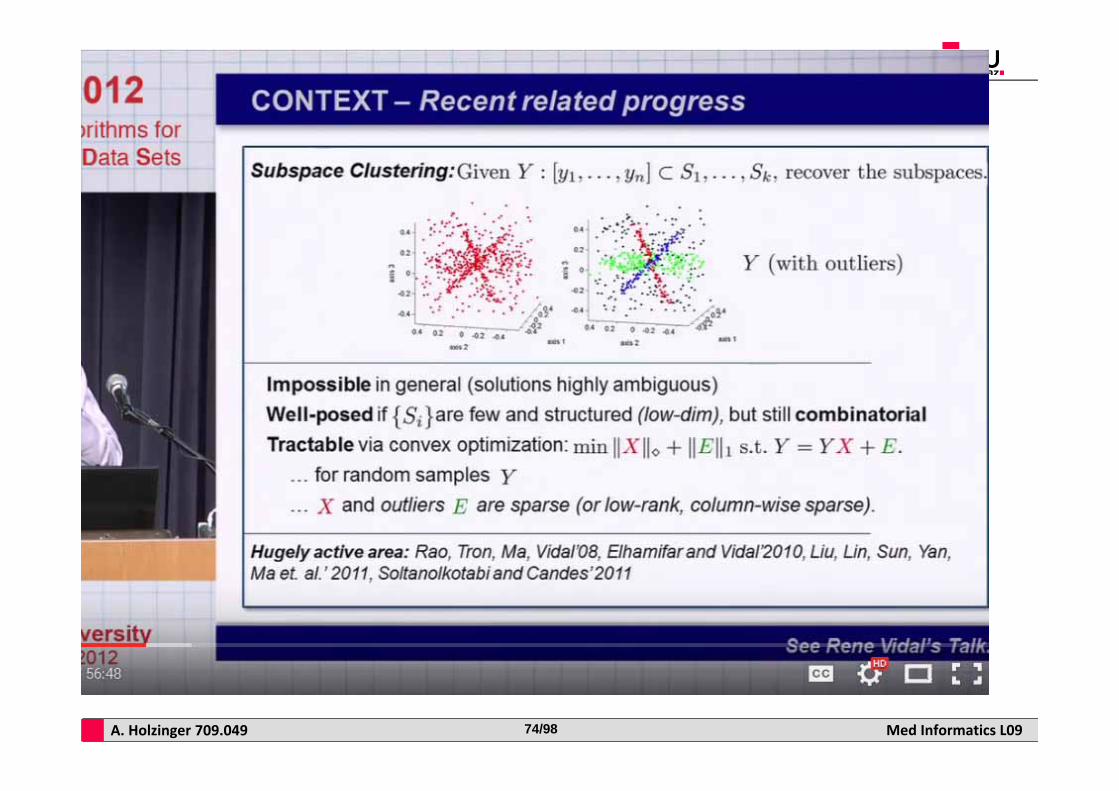
Example: Subspace Clustering
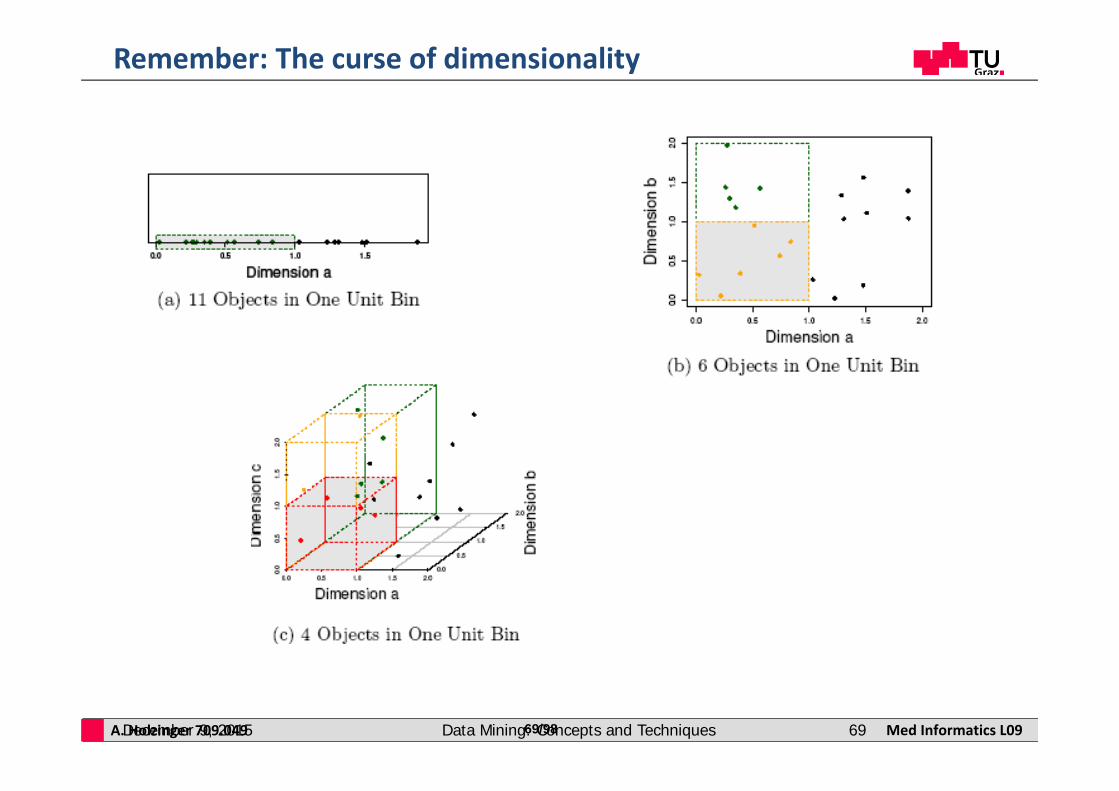
A. Holzinger 709.049 Med Informatics L0969/98December 9, 2015 Data Mining: Concepts and Techniques 69
Remember: The curse of dimensionality
A. Holzinger 709.049 Med Informatics L0970/98
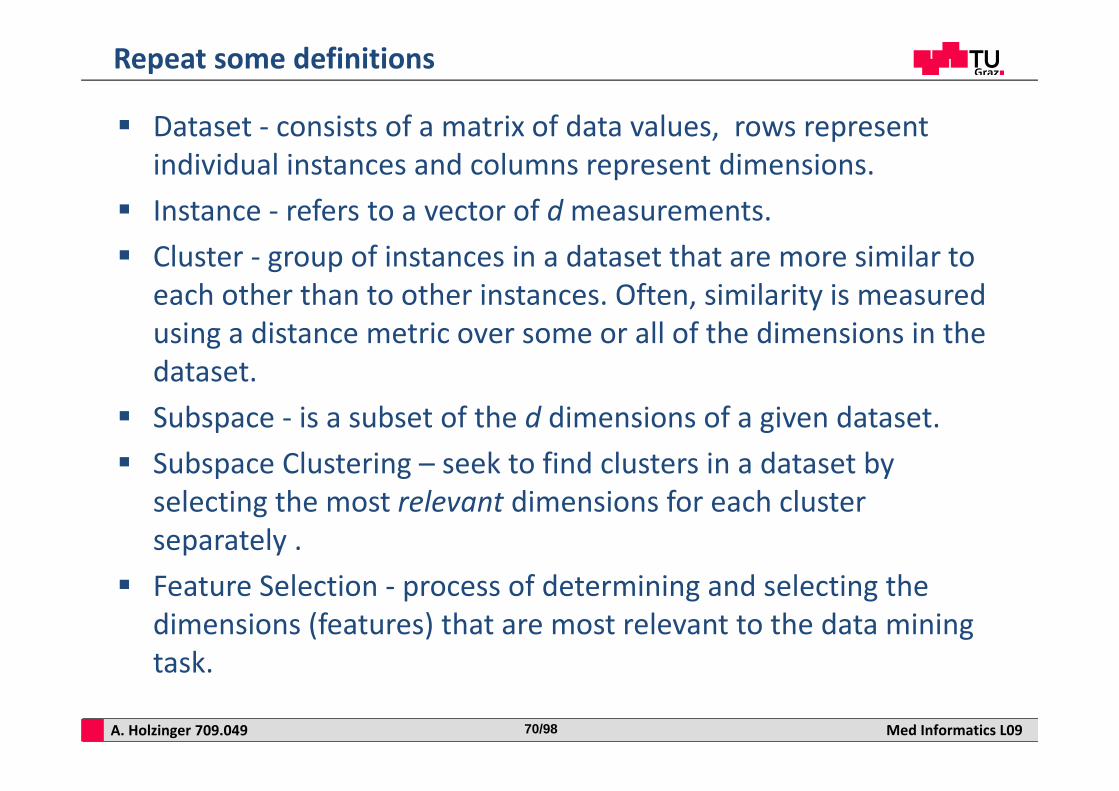
Dataset ‐ consists of a matrix of data values, rows represent individual instances and columns represent dimensions.
Instance ‐ refers to a vector of dmeasurements. Cluster ‐ group of instances in a dataset that are more similar to
each other than to other instances. Often, similarity is measured using a distance metric over some or all of the dimensions in the dataset.
Subspace ‐ is a subset of the d dimensions of a given dataset. Subspace Clustering – seek to find clusters in a dataset by
selecting the most relevant dimensions for each cluster separately .
Feature Selection ‐ process of determining and selecting the dimensions (features) that are most relevant to the data mining task.
Repeat some definitions
A. Holzinger 709.049 Med Informatics L0971/9871
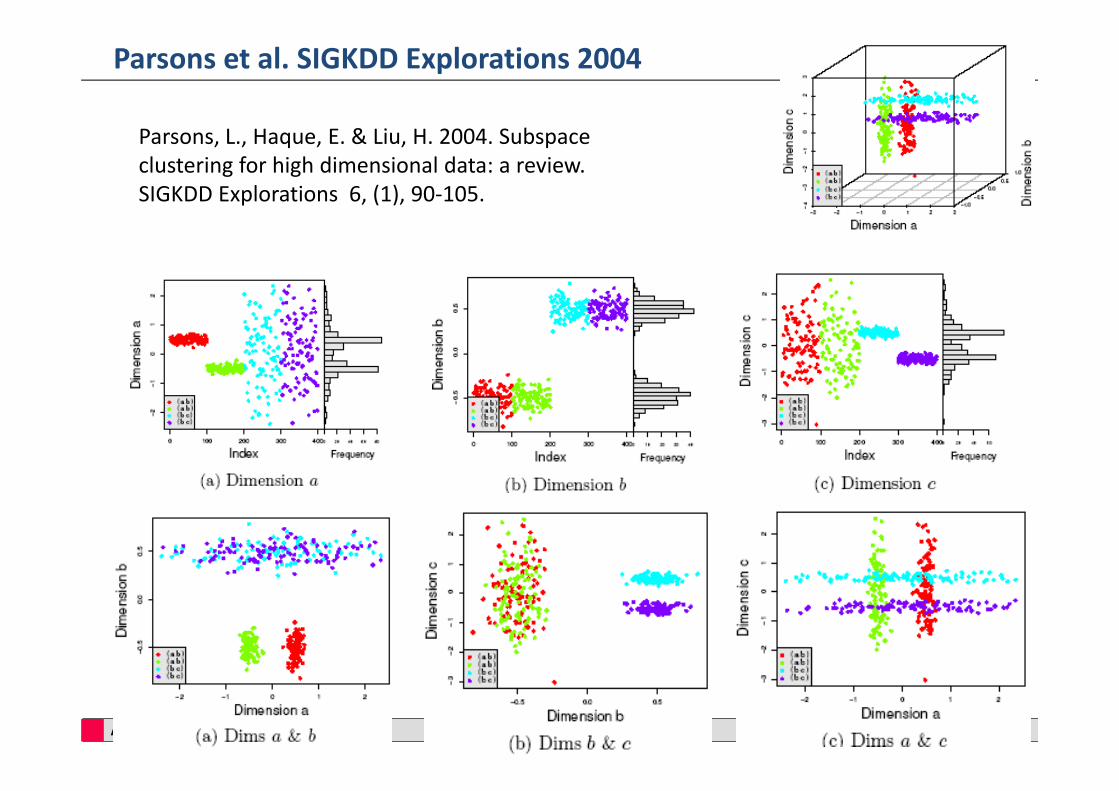
Parsons et al. SIGKDD Explorations 2004
Parsons, L., Haque, E. & Liu, H. 2004. Subspace clustering for high dimensional data: a review. SIGKDD Explorations 6, (1), 90‐105.
A. Holzinger 709.049 Med Informatics L0972/98
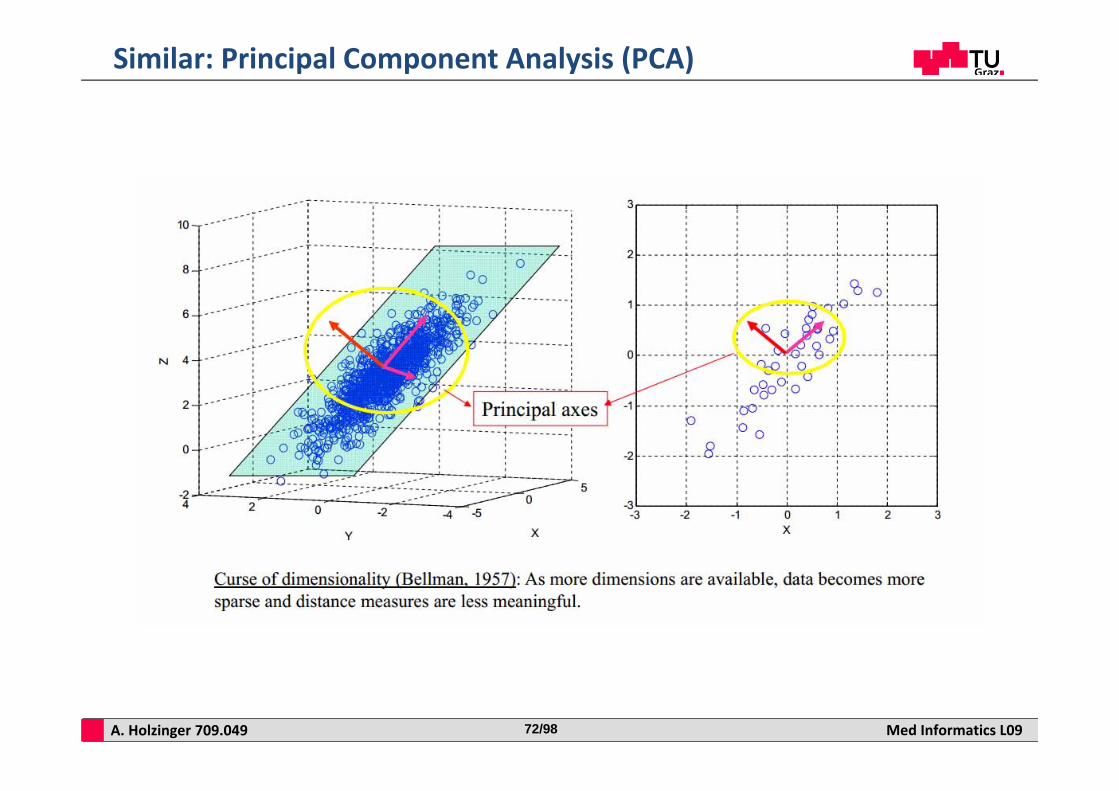
Similar: Principal Component Analysis (PCA)
A. Holzinger 709.049 Med Informatics L0973/98
A. Holzinger 709.049 Med Informatics L0974/98
A. Holzinger 709.049 Med Informatics L0975/98
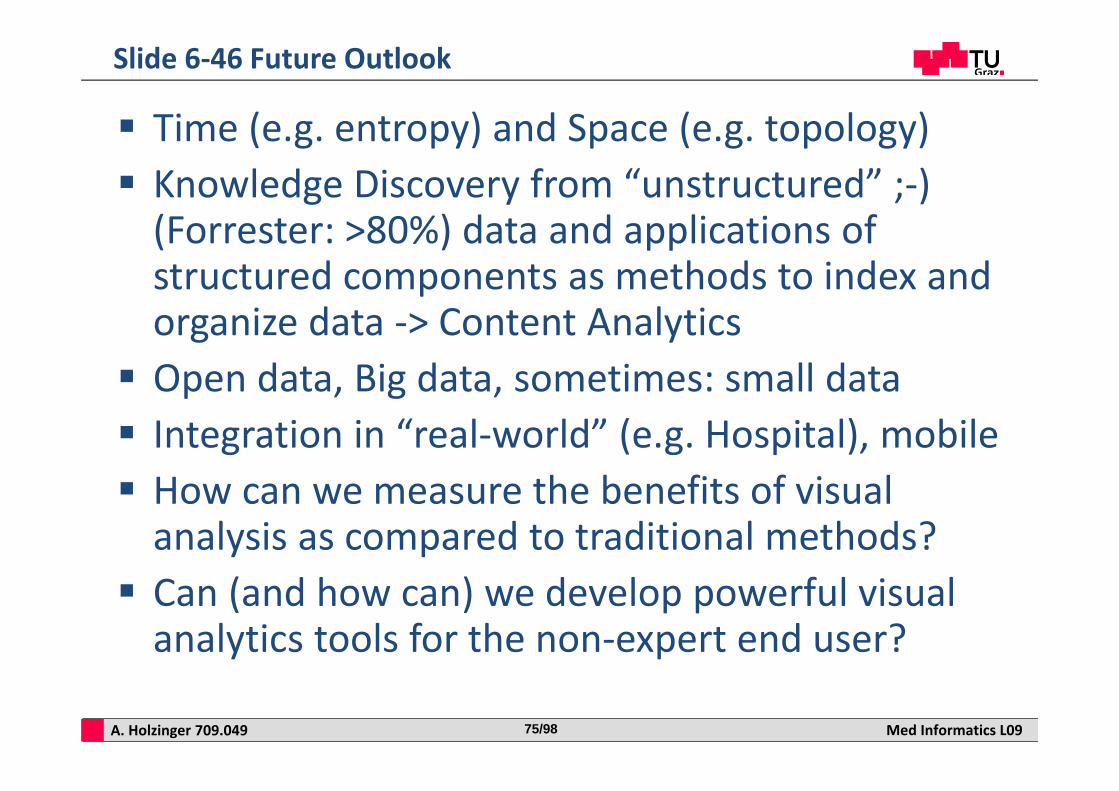
Time (e.g. entropy) and Space (e.g. topology) Knowledge Discovery from “unstructured” ;‐) (Forrester: >80%) data and applications of structured components as methods to index and organize data ‐> Content Analytics Open data, Big data, sometimes: small data Integration in “real‐world” (e.g. Hospital), mobile How can we measure the benefits of visual analysis as compared to traditional methods? Can (and how can) we develop powerful visual analytics tools for the non‐expert end user?
Slide 6‐46 Future Outlook

A. Holzinger 709.049 Med Informatics L0976/98
Thank you!
A. Holzinger 709.049 Med Informatics L0977/98
What is semiotic engineering? Please explain the process of intelligent interactive information
visualization! What is the difference between visualization and visual
analytics? Explain the model of perceptual visual processing according to
Ware (2004)! What was the historical start of systematic visual analytics?
Why is this an important example? Please describe very shortly 6 of the most important
visualization techniques! Transform five given data points into parallel coordinates! How can you ensure data protection in using parallel
coordinates? What is the basic idea of RadViz? For which problem would you use a star‐plot visualization?
Sample Questions (1)
A. Holzinger 709.049 Med Informatics L0978/98
What are the basic design principles of interactive intelligent visualization?
What is the visual information seeking mantra of Shneiderman (1996)?
Which concepts are important to let the end user interactively manipulate the data?
What is the problem involved in looking at neonatal polysomnographic recordings?
Why is time very important in medical informatics? What was the goal of LifeLines by Plaisant et al (1996)? Which temporal analysis tasks can you determine? Why is pattern discovery in medical informatics so important?
What is the aim of foreseeing the future behaviour of medical data?
Sample Questions (2)
A. Holzinger 709.049 Med Informatics L0979/98
http://vis.lbl.gov/Events/SC07/Drosophila/(some really cool examples of high‐dimensional data) http://people.cs.uchicago.edu/~wiseman/chernoff (Chernoff Faces in Java) http://lib.stat.emu.edu (Iris sample data set) http://graphics.stanford.edu/data/voldata (113‐slice MRI data set of CT studies of cadaver heads)
Some useful links
A. Holzinger 709.049 Med Informatics L0980/98
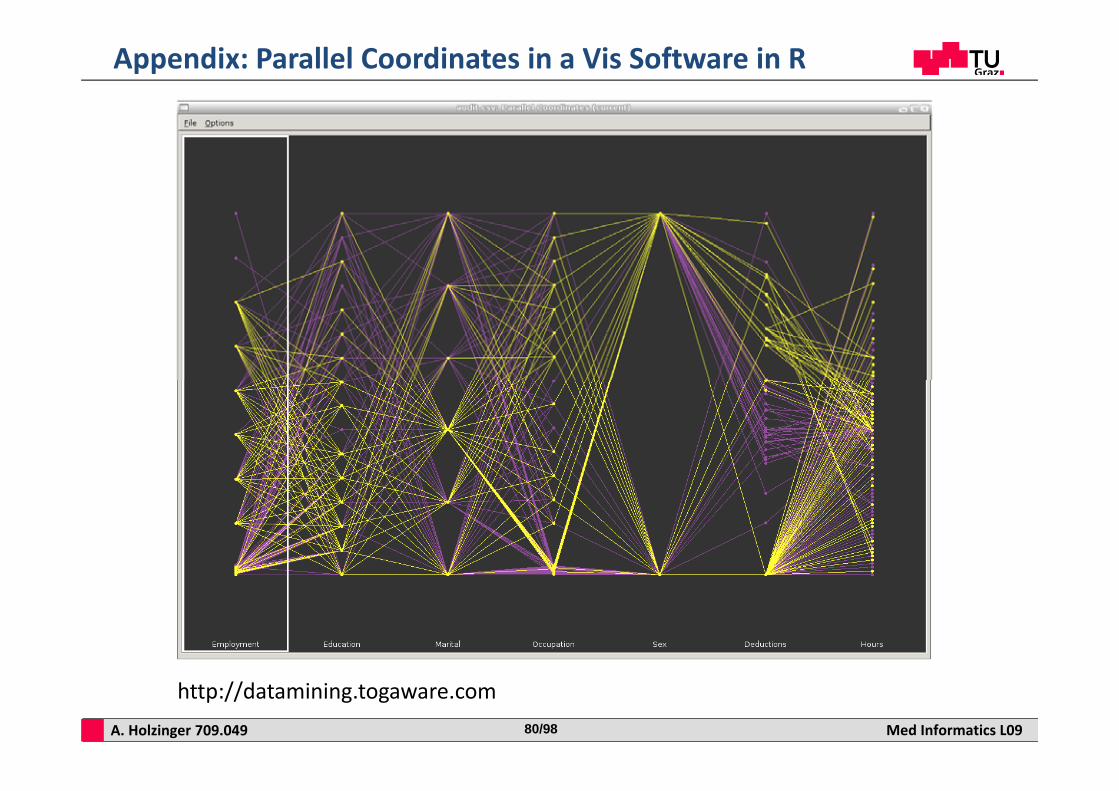
Appendix: Parallel Coordinates in a Vis Software in R
http://datamining.togaware.com
A. Holzinger 709.049 Med Informatics L0981/98
A. Holzinger 709.049 Med Informatics L0982/98
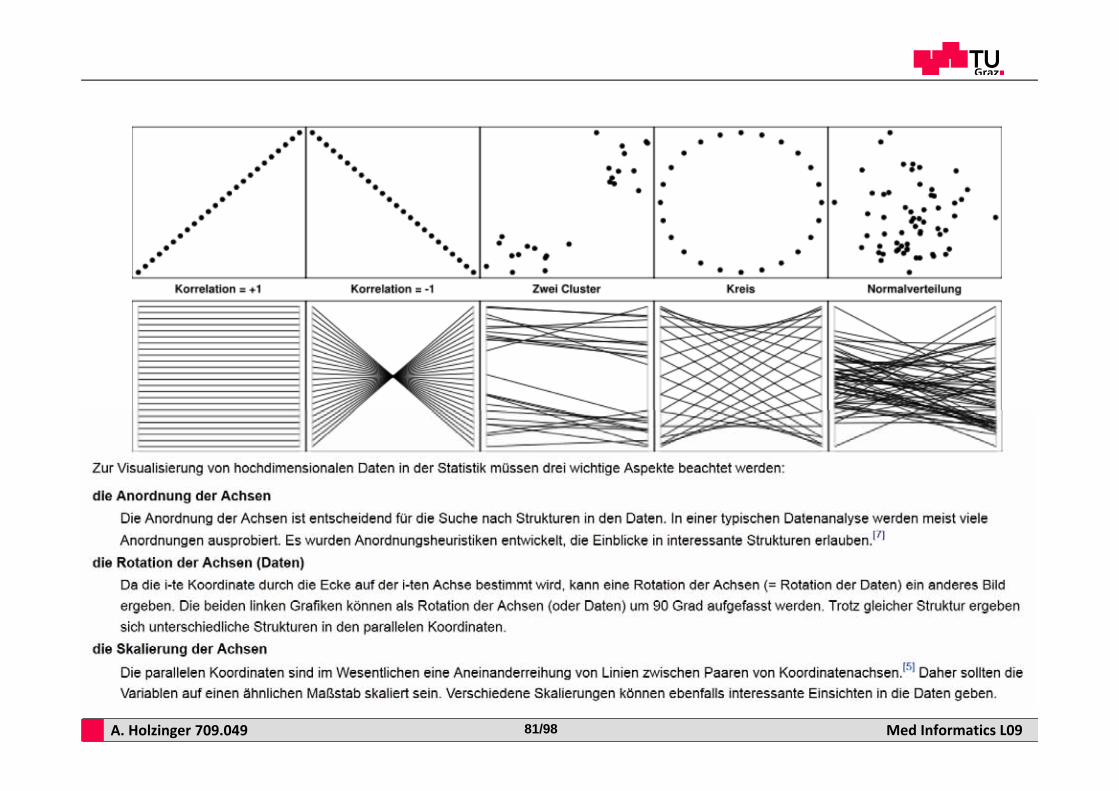
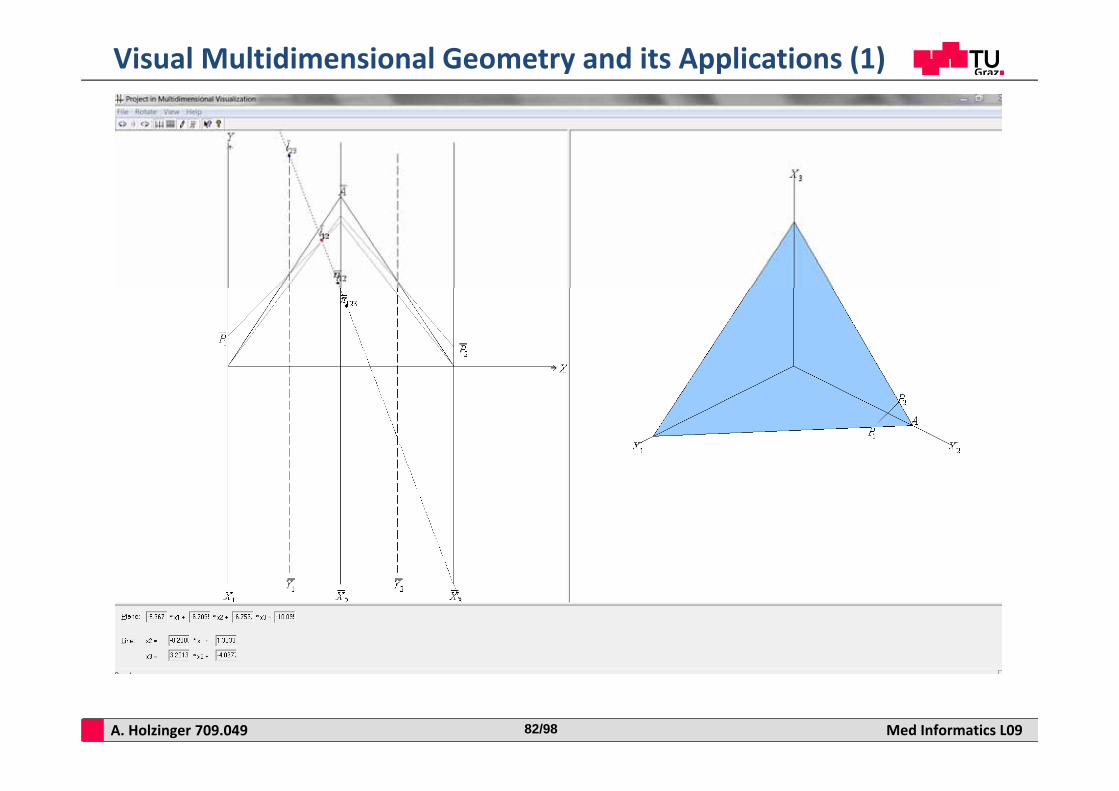
Visual Multidimensional Geometry and its Applications (1)
A. Holzinger 709.049 Med Informatics L0983/98
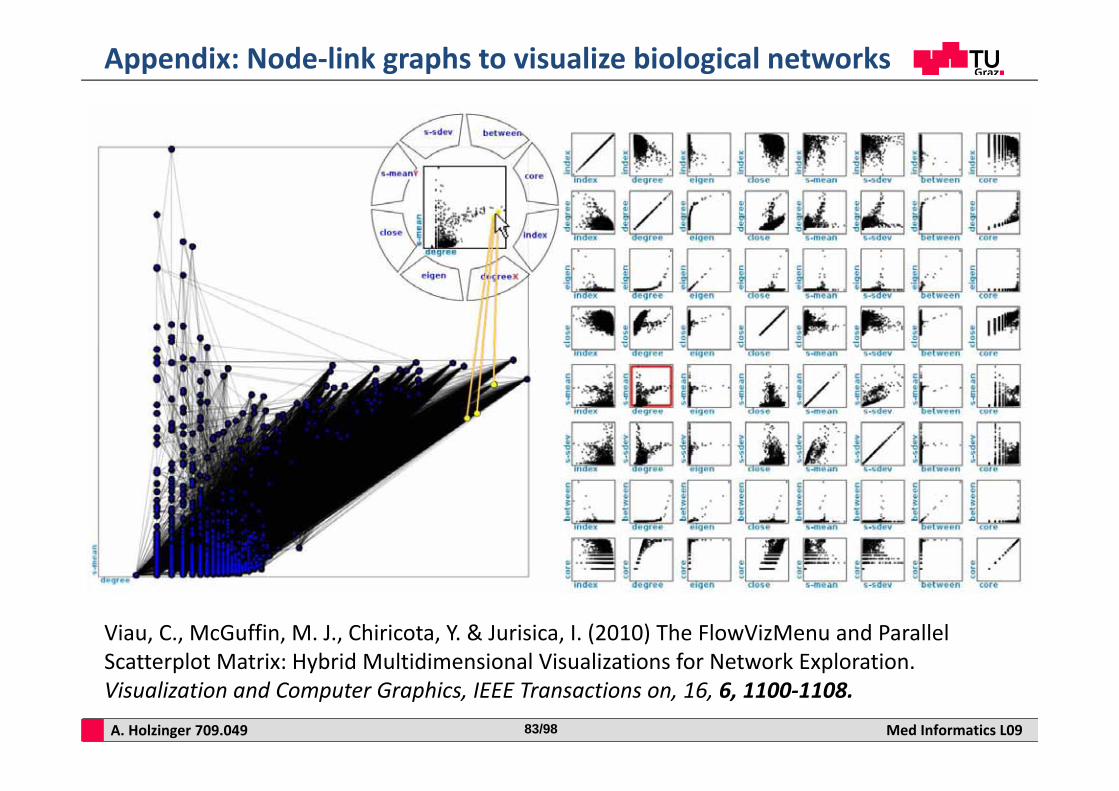
Appendix: Node‐link graphs to visualize biological networks
Viau, C., McGuffin, M. J., Chiricota, Y. & Jurisica, I. (2010) The FlowVizMenu and Parallel Scatterplot Matrix: Hybrid Multidimensional Visualizations for Network Exploration. Visualization and Computer Graphics, IEEE Transactions on, 16, 6, 1100‐1108.
A. Holzinger 709.049 Med Informatics L0984/98
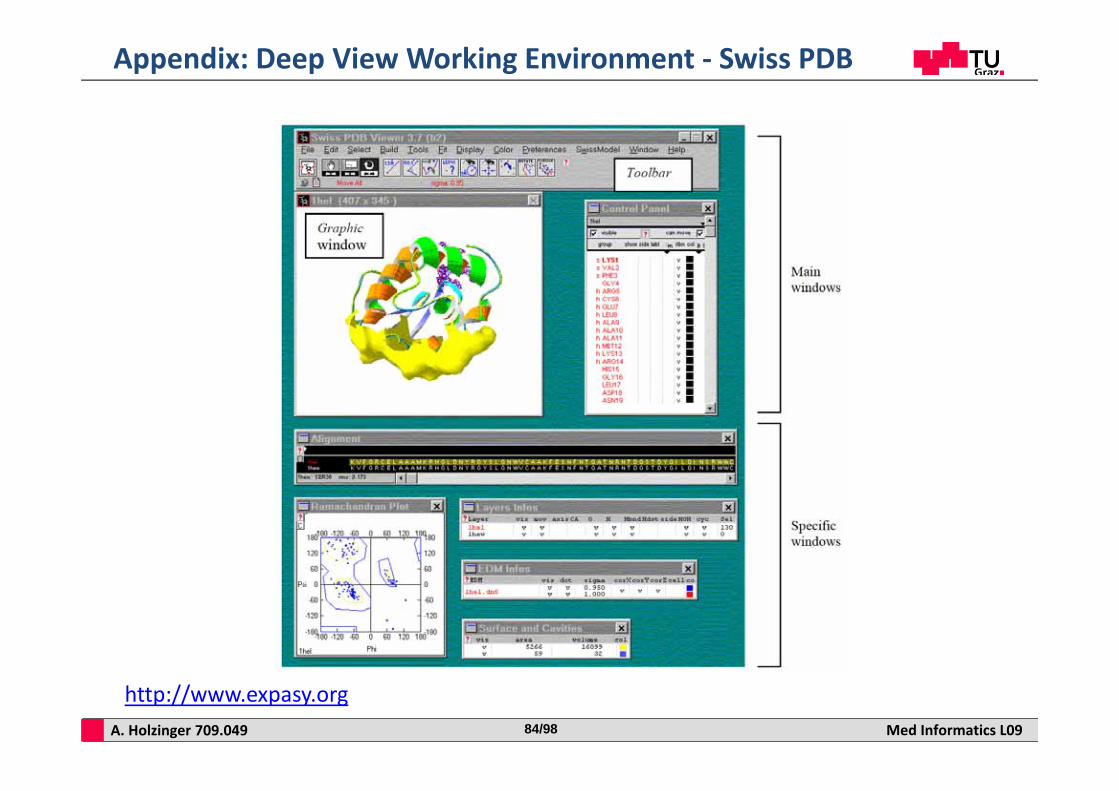
Appendix: Deep View Working Environment ‐ Swiss PDB
http://www.expasy.org
A. Holzinger 709.049 Med Informatics L0985/98
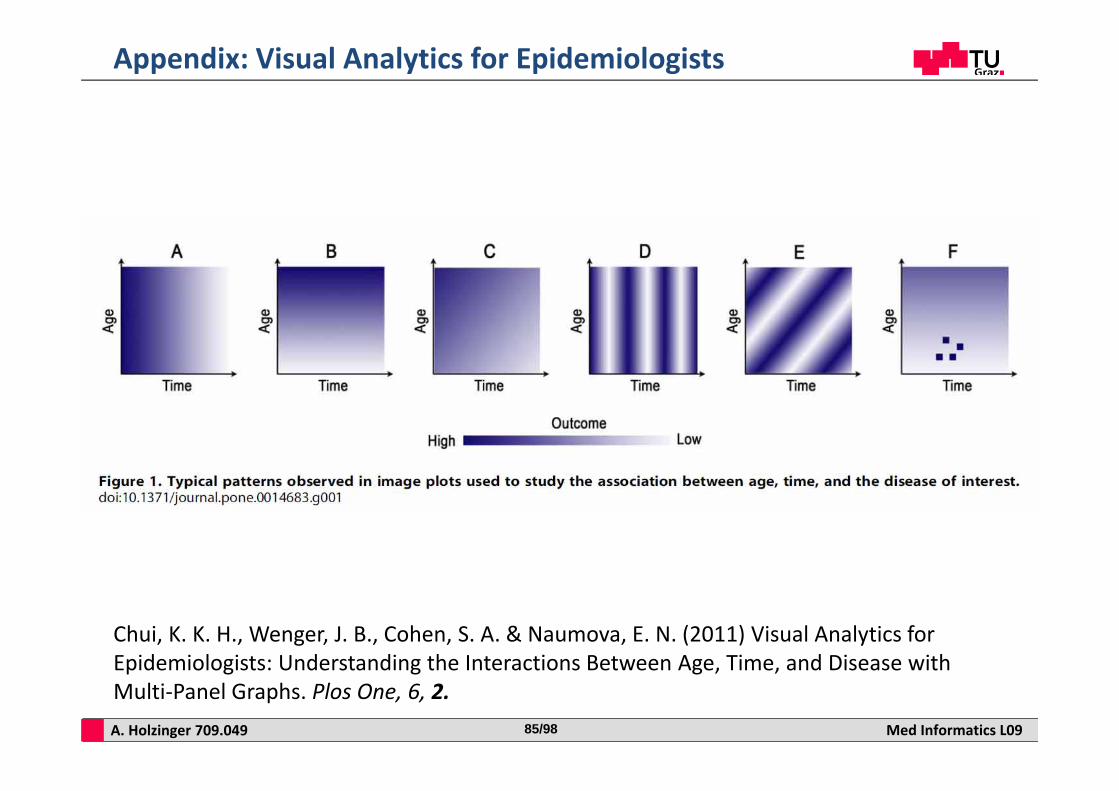
Appendix: Visual Analytics for Epidemiologists
Chui, K. K. H., Wenger, J. B., Cohen, S. A. & Naumova, E. N. (2011) Visual Analytics for Epidemiologists: Understanding the Interactions Between Age, Time, and Disease with Multi‐Panel Graphs. Plos One, 6, 2.
A. Holzinger 709.049 Med Informatics L0986/98
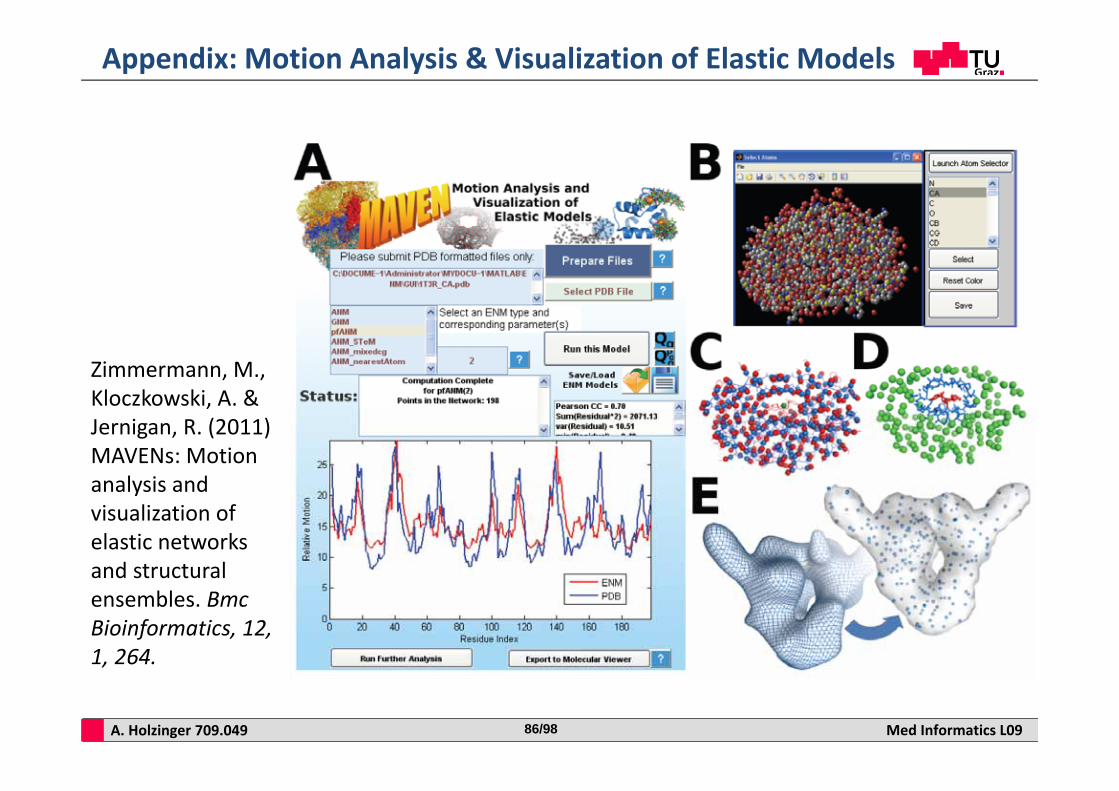
Appendix: Motion Analysis & Visualization of Elastic Models
Zimmermann, M., Kloczkowski, A. & Jernigan, R. (2011) MAVENs: Motion analysis and visualization of elastic networks and structural ensembles. BmcBioinformatics, 12,1, 264.
A. Holzinger 709.049 Med Informatics L0987/98
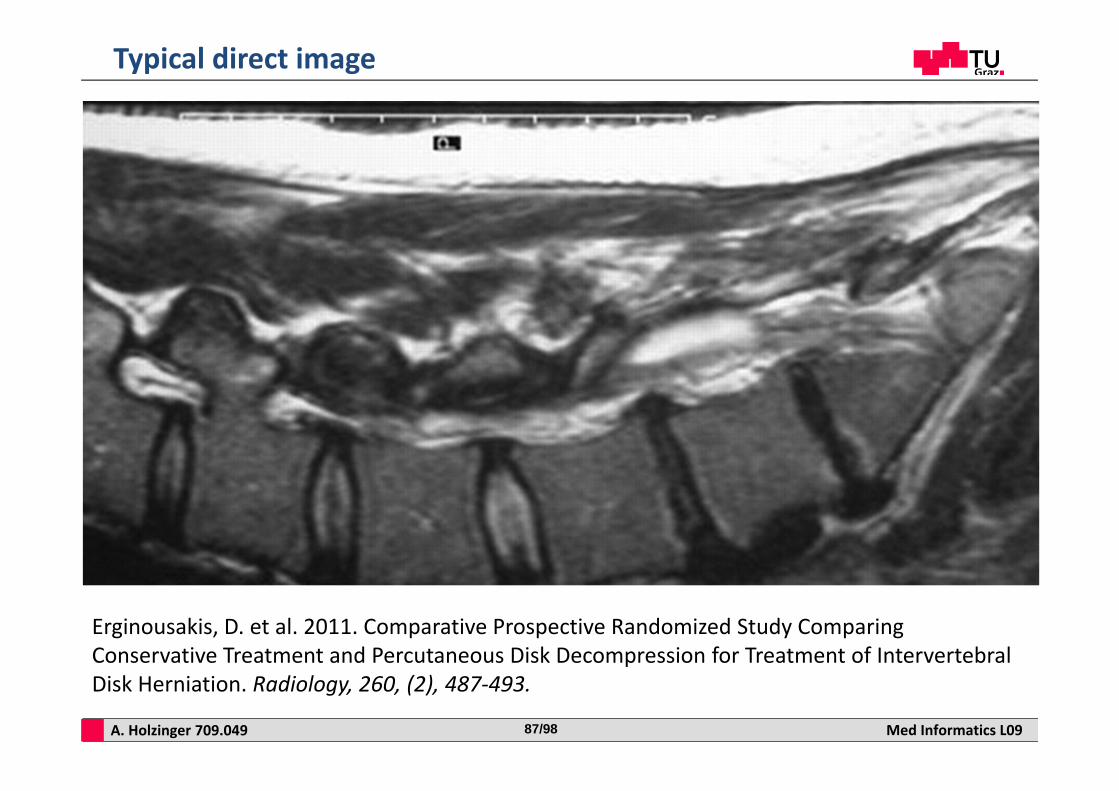
Typical direct image
Erginousakis, D. et al. 2011. Comparative Prospective Randomized Study Comparing Conservative Treatment and Percutaneous Disk Decompression for Treatment of Intervertebral Disk Herniation. Radiology, 260, (2), 487‐493.
A. Holzinger 709.049 Med Informatics L0988/98
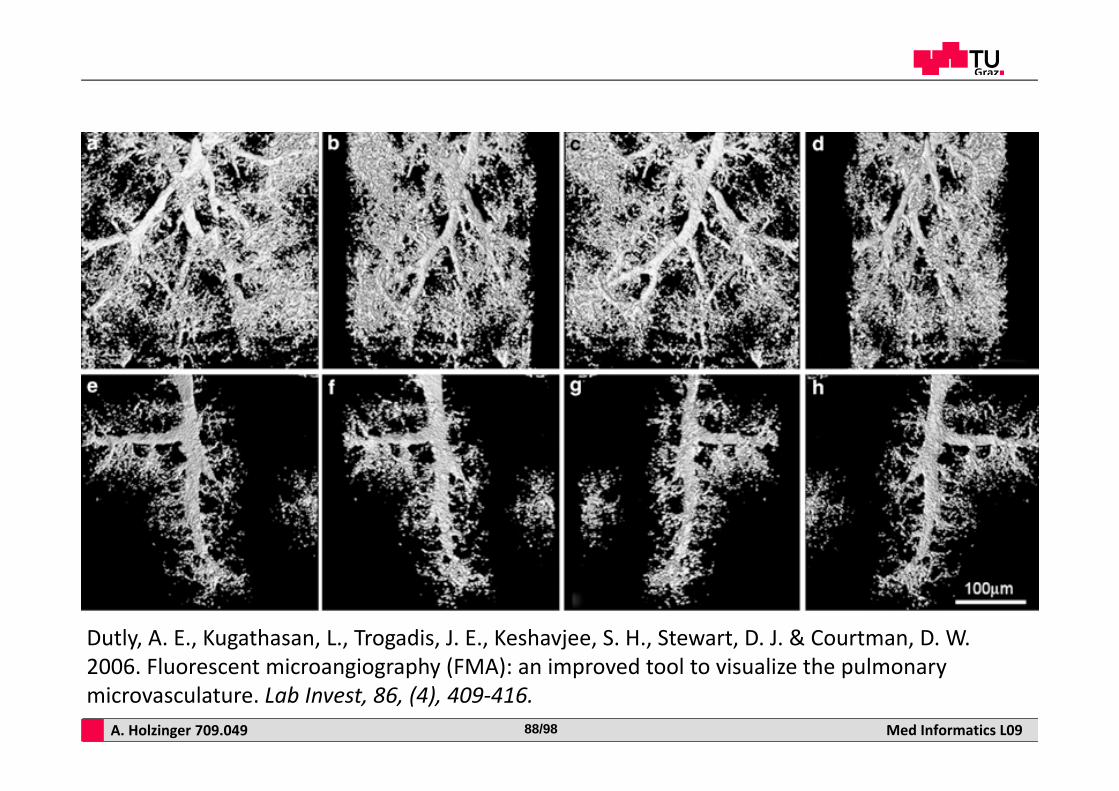
Dutly, A. E., Kugathasan, L., Trogadis, J. E., Keshavjee, S. H., Stewart, D. J. & Courtman, D. W. 2006. Fluorescent microangiography (FMA): an improved tool to visualize the pulmonary microvasculature. Lab Invest, 86, (4), 409‐416.
A. Holzinger 709.049 Med Informatics L0989/98
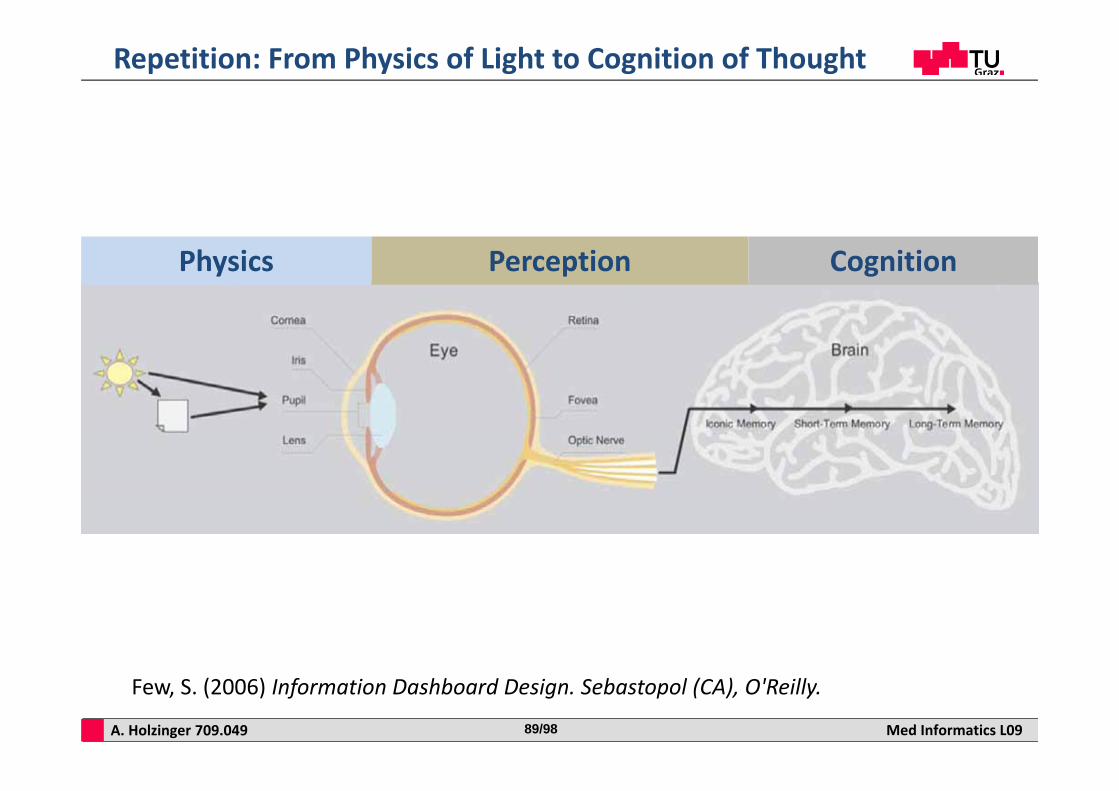
Repetition: From Physics of Light to Cognition of Thought
Few, S. (2006) Information Dashboard Design. Sebastopol (CA), O'Reilly.
Physics Perception Cognition
A. Holzinger 709.049 Med Informatics L0990/98
Remember
A. Holzinger 709.049 Med Informatics L0991/98
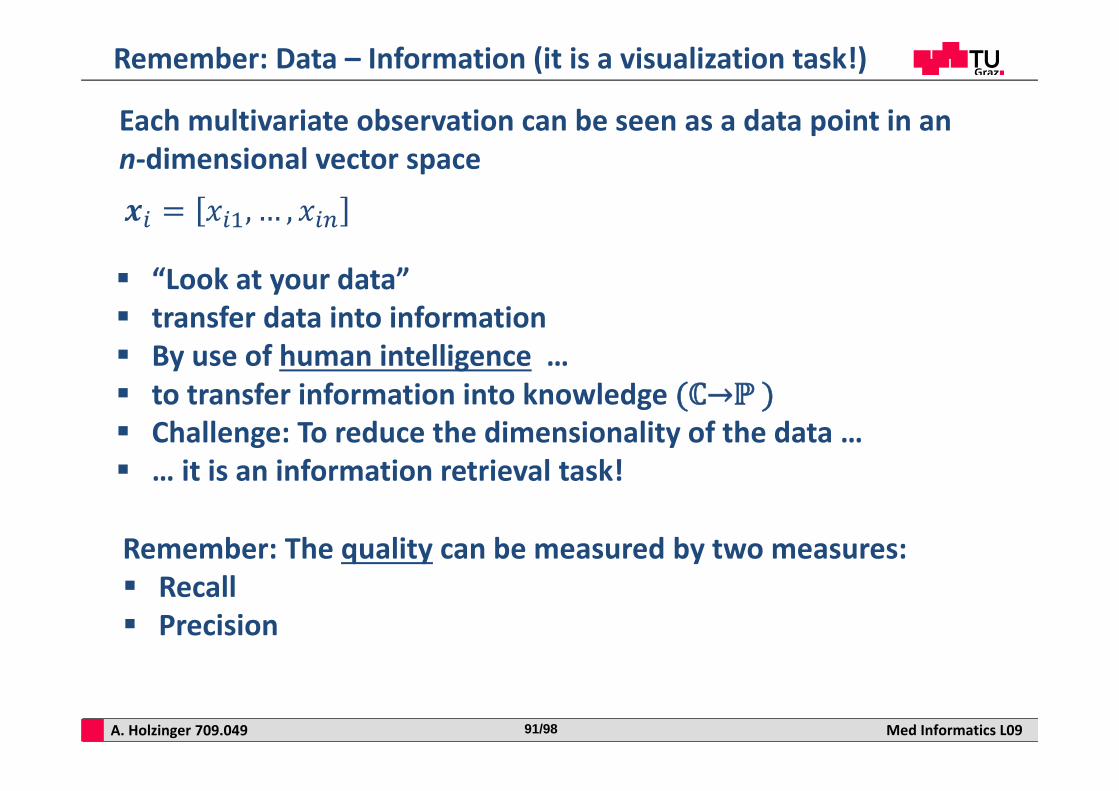
Remember: Data – Information (it is a visualization task!)
Each multivariate observation can be seen as a data point in an n‐dimensional vector space
“Look at your data” transfer data into information By use of human intelligence … to transfer information into knowledge →ℙ Challenge: To reduce the dimensionality of the data … … it is an information retrieval task!
, … ,
Remember: The quality can be measured by two measures: Recall Precision
A. Holzinger 709.049 Med Informatics L0992/98
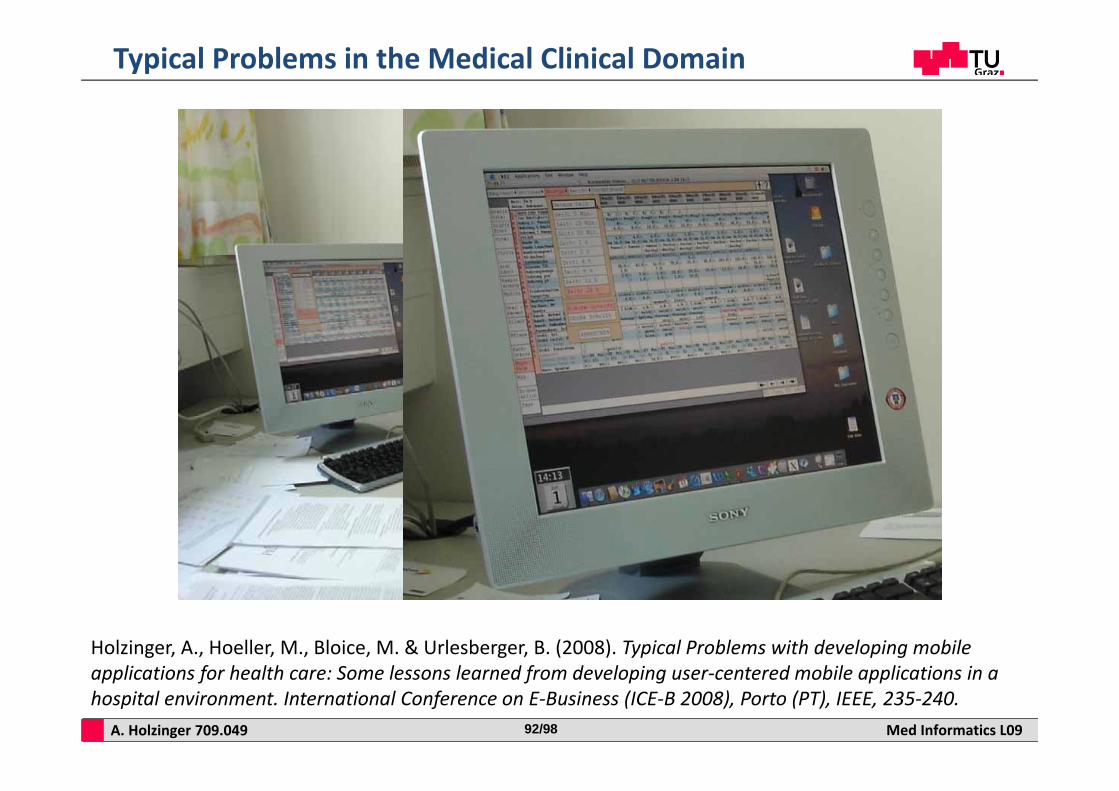
Typical Problems in the Medical Clinical Domain
Holzinger, A., Hoeller, M., Bloice, M. & Urlesberger, B. (2008). Typical Problems with developing mobile applications for health care: Some lessons learned from developing user‐centered mobile applications in a hospital environment. International Conference on E‐Business (ICE‐B 2008), Porto (PT), IEEE, 235‐240.
A. Holzinger 709.049 Med Informatics L0993/98
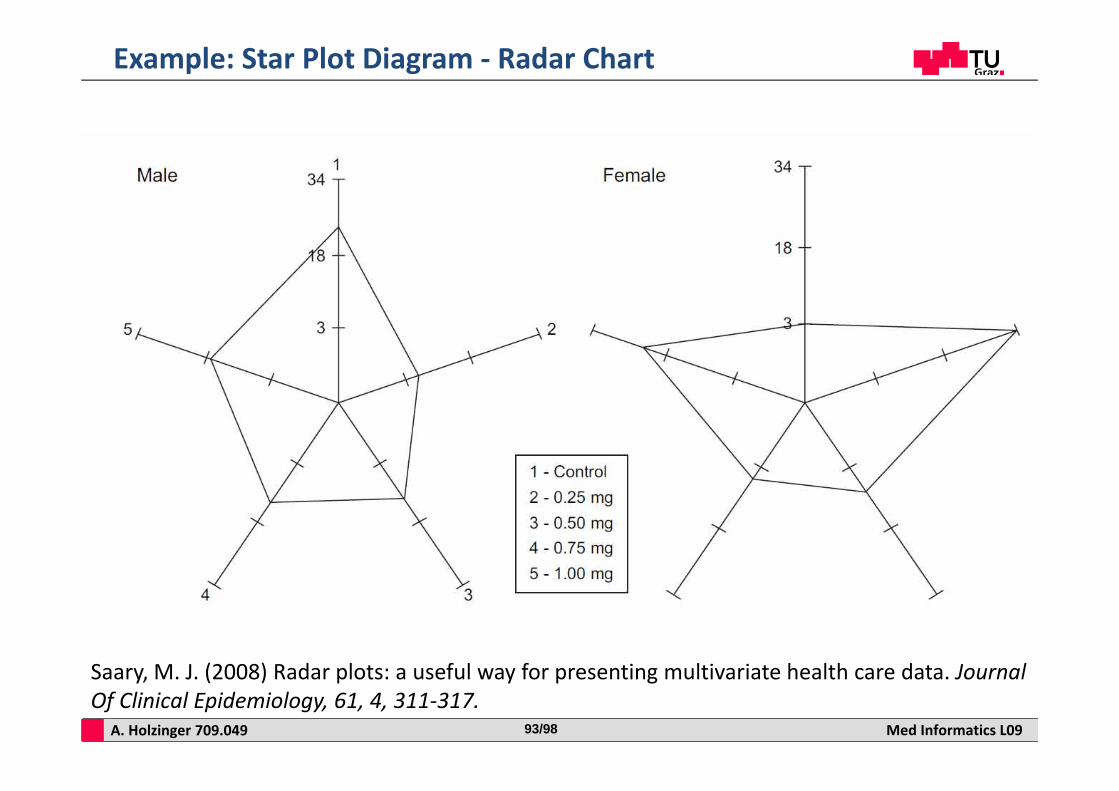
Example: Star Plot Diagram ‐ Radar Chart
Saary, M. J. (2008) Radar plots: a useful way for presenting multivariate health care data. Journal Of Clinical Epidemiology, 61, 4, 311‐317.
A. Holzinger 709.049 Med Informatics L0994/98
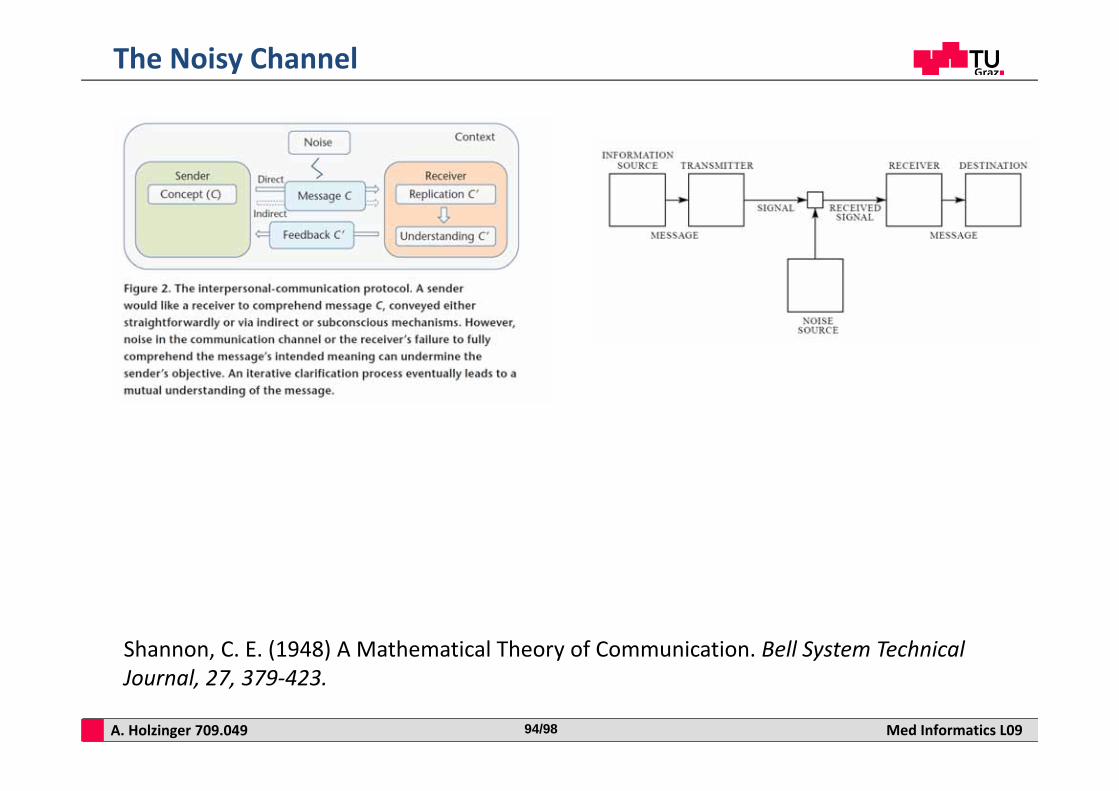
The Noisy Channel
Shannon, C. E. (1948) A Mathematical Theory of Communication. Bell System Technical Journal, 27, 379‐423.
A. Holzinger 709.049 Med Informatics L0995/98
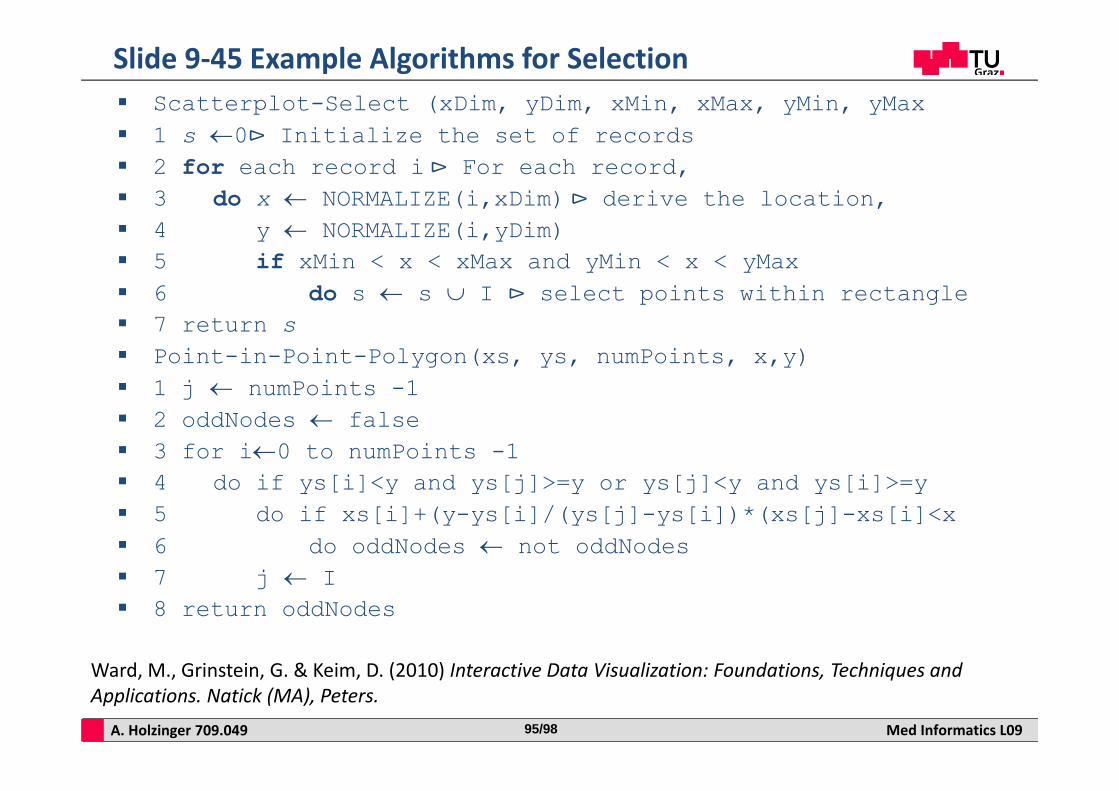
Scatterplot-Select (xDim, yDim, xMin, xMax, yMin, yMax 1 s 0⊳ Initialize the set of records 2 for each record i ⊳ For each record, 3 do x NORMALIZE(i,xDim)⊳ derive the location, 4 y NORMALIZE(i,yDim) 5 if xMin < x < xMax and yMin < x < yMax 6 do s s I ⊳ select points within rectangle 7 return s Point-in-Point-Polygon(xs, ys, numPoints, x,y) 1 j numPoints -1 2 oddNodes false 3 for i0 to numPoints -1 4 do if ys[i]<y and ys[j]>=y or ys[j]<y and ys[i]>=y 5 do if xs[i]+(y-ys[i]/(ys[j]-ys[i])*(xs[j]-xs[i]<x 6 do oddNodes not oddNodes 7 j I 8 return oddNodes
Slide 9‐45 Example Algorithms for Selection
Ward, M., Grinstein, G. & Keim, D. (2010) Interactive Data Visualization: Foundations, Techniques and Applications. Natick (MA), Peters.
A. Holzinger 709.049 Med Informatics L0996/98
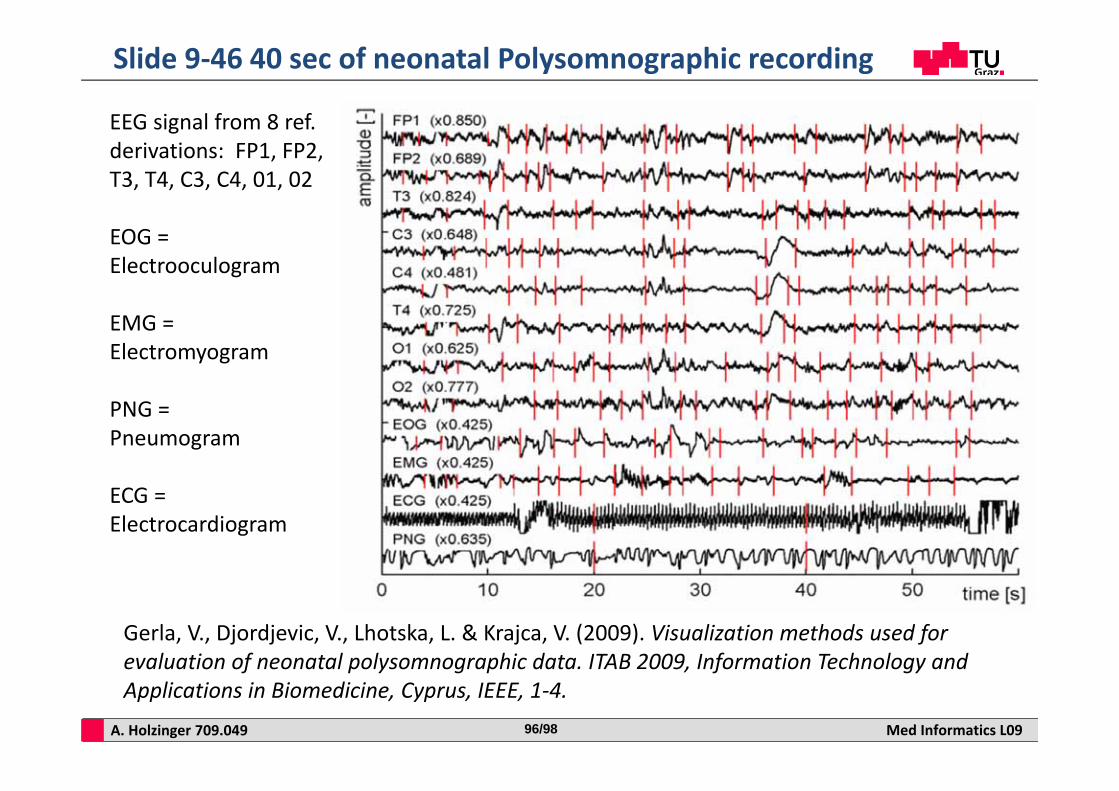
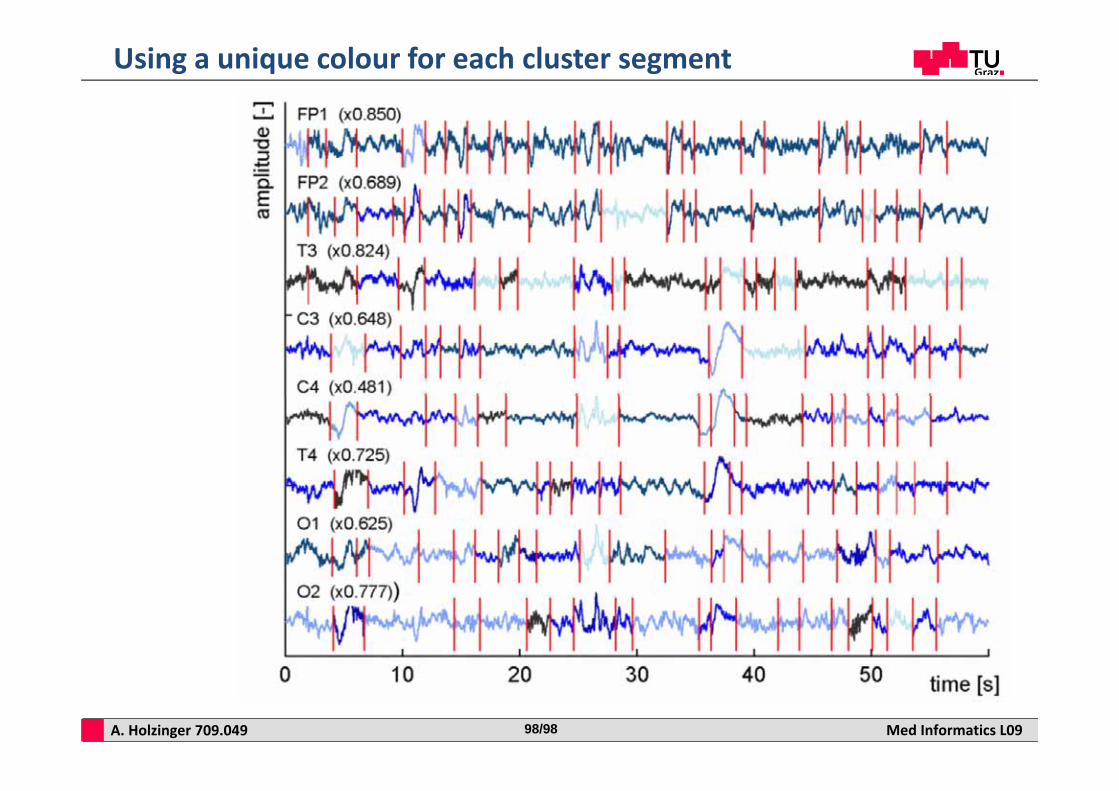
Slide 9‐46 40 sec of neonatal Polysomnographic recording
Gerla, V., Djordjevic, V., Lhotska, L. & Krajca, V. (2009). Visualization methods used for evaluation of neonatal polysomnographic data. ITAB 2009, Information Technology and Applications in Biomedicine, Cyprus, IEEE, 1‐4.
EEG signal from 8 ref. derivations: FP1, FP2, T3, T4, C3, C4, 01, 02
EOG = Electrooculogram
EMG = Electromyogram
PNG = Pneumogram
ECG = Electrocardiogram
A. Holzinger 709.049 Med Informatics L0997/98
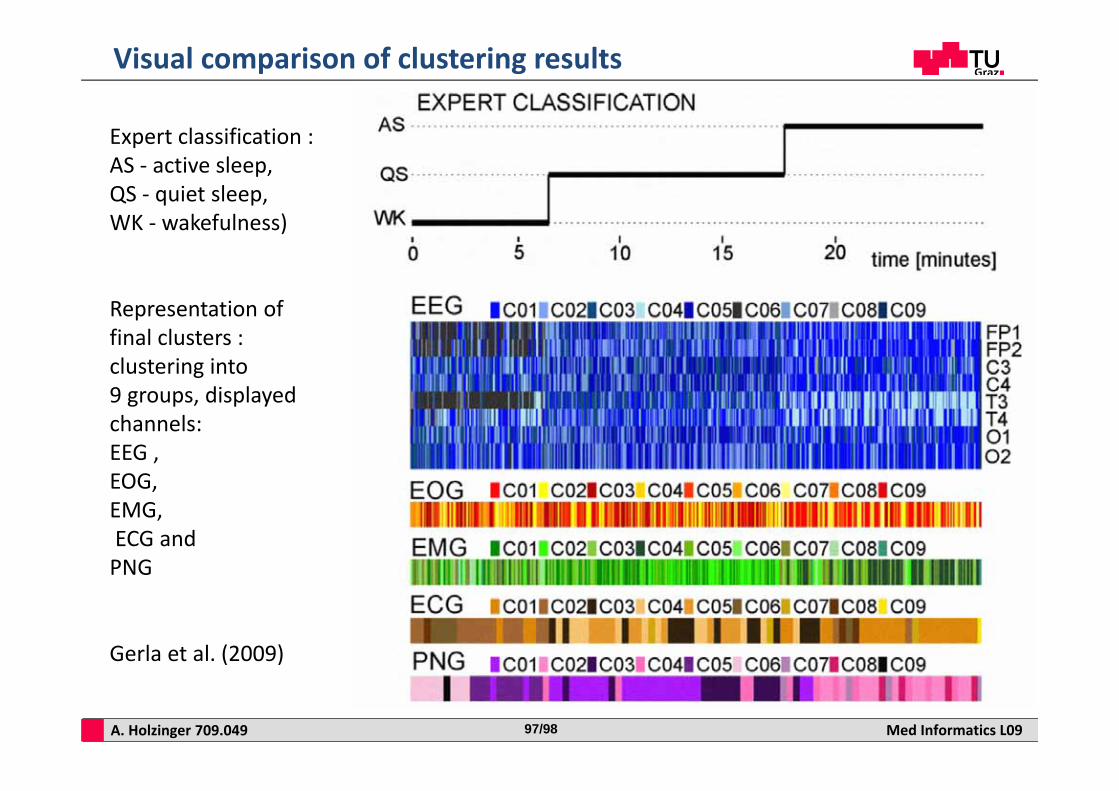
Visual comparison of clustering results
Expert classification :AS ‐ active sleep, QS ‐ quiet sleep, WK ‐ wakefulness)
Representation of final clusters :clustering into 9 groups, displayed channels: EEG , EOG, EMG,ECG and PNG
Gerla et al. (2009)
A. Holzinger 709.049 Med Informatics L0998/98
Using a unique colour for each cluster segment