Embed Size (px)
Citation preview

19th April 2005
Advanced Human Computer Interaction (HCI)
Week 7
CM30141-S2
Unit Lecturer: Dr Lisa [email protected]
Unit Tutor: Chris [email protected]

19th April 2005
House keeping
• Switching weeks 7/8 in the course

19th April 2005
Overview
1. Introduction2. External Representations and Interactivity3. Types of Representation4. Types of Interactivity

19th April 2005
A Killer Application
• The Spreadsheet• Why?

19th April 2005
External Representations
• Reduce Cognitive Load - tool for thought• Act as a store for our knowledge over time• Organize and structure information for us• However can force us to look at information in certain ways i.e.
can limit thinking. Therefore we need to have an appropriate representation for the external representation to be useful.

19th April 2005
Characteristics of graphics Need the right
representation for the type of data and the questions the user wishes to ask of it.

19th April 2005
Characteristics of graphics
With the right representation
inferences often become very obvious
Jon Snow 1845

19th April 2005
Characteristics of graphics
A representation does not need to be accurate to be useful

19th April 2005
Characteristics of graphics
• Finding the correct representation is still something of a black art– Build on representations that have be used for
a problem before– Think about the questions that need to be
asked.– Think about multiple views of the data

19th April 2005
Interactivity• Adding Interactivity to representations allows a users to
proactively ask questions of the data.
• In effect an interactive visualisation allows users to scan many hundreds of static representations very quickly - creates a dialog between the user and their problem.
• Encourages iterative exploration of the problem space.
• The locus of control has switched to the user
19th April 2005
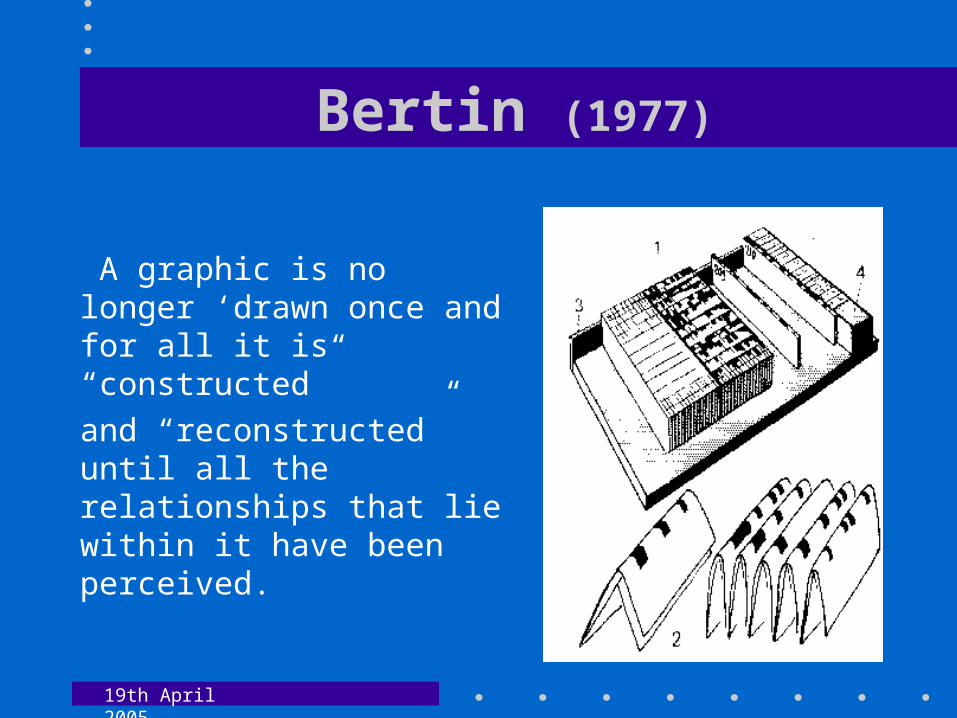
Bertin (1977)
A graphic is no longer ‘drawn once and for all it is “constructed”
and “reconstructed” until all the relationships that lie within it have been perceived.

19th April 2005
Types of Representation - Bertin 1977
• Representations of Data Values– bottom up
• Representations of Data Structure– top down
19th April 2005
Representations of Data values
show relations between subsets of the data
e.g. histograms, scatterplots etc.

19th April 2005
Dynamic Queries - Ahlberg et al (1992)

19th April 2005
Table Lens - Rao et al 1994 (PARC)

19th April 2005
Brushing - linking attribute views
Can take multiple similar representations of all
the attributes in a data set.
In some ways Bertins distinction disappears - as you can
see the structure of the whole set and the subset
in context.
In effect the representation provides the structure
and the interactivity provides the querying of
individual values and their relations.

19th April 2005
A scatterplot Matrix

19th April 2005
The Attribute Explorer - Tweedie et al (1994)

19th April 2005
Netmap - (Davidson 1993)

19th April 2005
Net map

19th April 2005
Netmap

19th April 2005
Netmap
• It is unlikely that an individual would have more than three applications for a mortgage on a single house . . . . .

19th April 2005
Parrallel Coordinate plots - Inselberg (1985)

19th April 2005
Linking Multiple representations of data values
It is often difficult to anticipate the questions a user would want to ask of the data
Different representations might be suited for answering different questions.
Thus brushing across different representations is a logical extension.

19th April 2005
Multiple representations of data values

19th April 2005
Representations of Data structure
Show relations within an entire set Bertin identified five types:
– Rectilinear - ordered lists, tables– Circular - Networks– Ordered patterns - Trees– Unordered patterns - networks and Venn diagrams– Stereograms - structure suggests a volume e.g. 3D
models

19th April 2005
Representations of Data structure
Whereas representations of Data values tend to be used for analysis - representations of data structure are often used for providing overview and navigation around an information space.

19th April 2005
Hyperbolic Browser

19th April 2005
Perspective Wall

19th April 2005
Tree Maps
Tree Map construction
19th April 2005
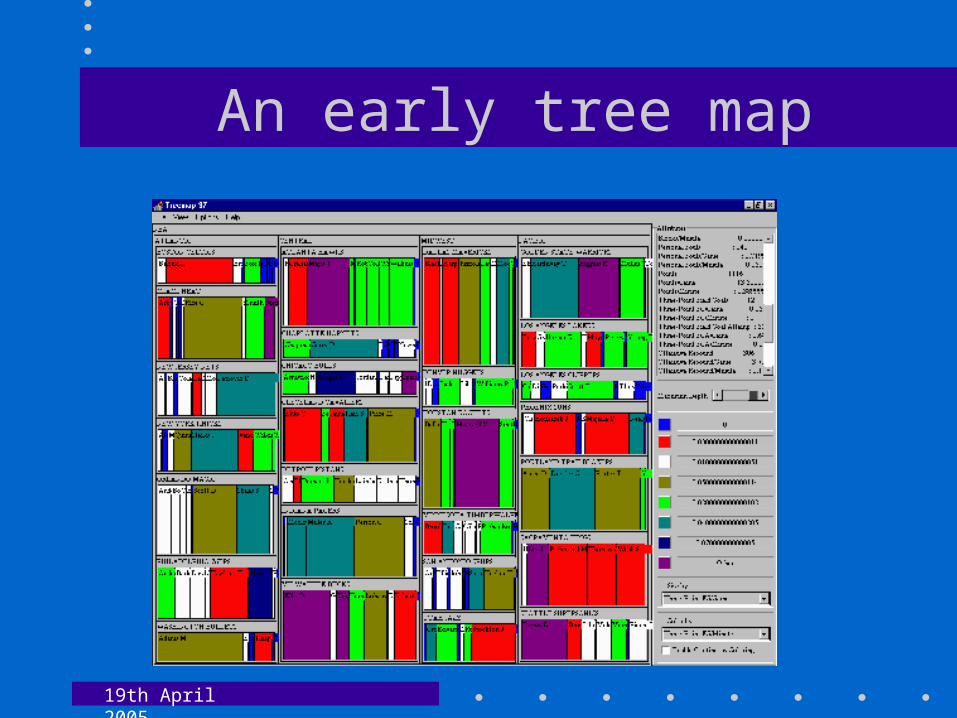
An early tree map

19th April 2005
An early tree map• Too disorderly
– What does adjacency mean?– Aspect ratios uncontrolled leads to lots of skinny
boxes that clutter
• Color not used appropriately– In fact, is meaningless here
• Wrong application– Don’t need all this to just see the largest files in the
OS

19th April 2005
An early tree map• Too disorderly
– What does adjacency mean?– Aspect ratios uncontrolled leads to lots of skinny
boxes that clutter
• Color not used appropriately– In fact, is meaningless here
• Wrong application– Don’t need all this to just see the largest files in the
OS

19th April 2005
What would make it more useful?
• Think more about the use– Break into meaningful groups– Fix these into a useful aspect ratio
• Use visual properties properly– Use color to distinguish meaningfully
• Use only two colors: – Can then distinguish one thing from another
• Provide excellent interactivity – Access to the real data– Makes it into a useful tool

19th April 2005
Smart Money

19th April 2005
Peets Coffee shop

19th April 2005
Types of interactivity
• hiding/ filtering data• labeling e.g. brushing• reordering
• providing information scent and other forms of more complex labelling• animated navigation/ algorithmic transformation
19th April 2005
Information Scent
• Relates to the issues surrounding query interfaces• How can a user be given appropriate cues to move towards their desired solution in the problem space
19th April 2005
Traditional query languagesProblems:1. The discretionary user must learn a language. Users are often not prepared to do this. Even for simple query languages controlled tests (Borgman 1986) have shown that even after an hours tuition on 25% of University Students could use the library’s online query system. And that queries created tended to be very simple.
2. Errors are not tolerated
3. Too few or too many hits often result from queries. There is no indication how a query might be reformulated to access fewer or more hits.
4. There is a significant time delay between the formulation of a query and the delivery of the result. This definitely slows the problem
solving process and probably discourages users from exploring extensively.

19th April 2005
Dynamic Queries - Ahlberg et al (1992)

19th April 2005
Complex colour coding

19th April 2005
The Model MakerFirst Order Terms
X1
X2
X3
X4
X1
X2
X3
X4
X1 X2 X3 X4
X1X2X3
X1X2X4
X1X3X4
X2X3X4
X1 X2 X3 X4
X1
X2
X3
X4
2
2
2
2
Second Order Terms
Third Order Terms

19th April 2005
Other forms of scent
• Social scent - e.g. recommender systems
- This is what others feel is valuable
• History (residue) - where have I been before?
- e.g. the blue text in the world wide web.
• Boolean colour coding and user defined labels

19th April 2005
Combining automation with visualisation
Algorithms can support users in performing their
task.
Simple algorithm animations - where the user watches an algorithm perform (e.g. data mining)
- history can then be a starting point for interactivity
- ability for user to interact directly with algorithm
Algorithmic transformations which sort and order
data creating useful metadata.

19th April 2005
Hypergami

19th April 2005
Bead - Chalmers et al (1993)

19th April 2005
Where are the killers apps?• Technology still not quite there• These things are hard to design well - need to
keep it simple• Humans take a long time to develop cultures
surrounding and learn to use new representations• matching tasks to representations still a black art.• The web is probably the domain where these
tools will emerge.