Embed Size (px)
Citation preview

1.#
1Dr. L. Christofi Spring 2009
Lecture 2
Data and Signals
ACOE412
Data Communications
Spring 2009
2Dr. L. Christofi Spring 2009
0. Overview0. Overview
In this lecture we will cover the following topics:
3. Data and signals
3.1 Analog and digital
3.2 Periodic analog signals
3.3 Digital signals
3.4 Transmission impairment
3.5 Data rate limits
3.6 Performance
3.7 Summary (part 3)

1.#
3Dr. L. Christofi Spring 2009
To be transmitted, data must be
transformed to electromagnetic signals.
Note
4Dr. L. Christofi Spring 2009
3.1 ANALOG AND DIGITAL3.1 ANALOG AND DIGITAL
Data can be Data can be analoganalog or or digitaldigital. The term . The term analog dataanalog data refers refers
to information that is continuous; to information that is continuous; digital datadigital data refers to refers to
information that has discrete states. Analog data take on information that has discrete states. Analog data take on
continuous values. Digital data take on discrete values.continuous values. Digital data take on discrete values.
Analog and Digital Data
Analog and Digital SignalsPeriodic and Nonperiodic Signals
Topics discussed in this section:Topics discussed in this section:

1.#
5Dr. L. Christofi Spring 2009
Note
Data can be analog or digital. Analog data are continuous and take continuous values.Digital data have discrete states and take discrete values.
Signals can be analog or digital. Analog signals can have an infinite number of values in a
range; digital signals can have only a limited number of values.
Note
6Dr. L. Christofi Spring 2009
Comparison of analog & digital signals

1.#
7Dr. L. Christofi Spring 2009
Periodic and Aperiodic signals
• Both analog and digital signals can take one of two forms—Periodic: completes a pattern within a measurable time frame called a period and repeats that pattern over subsequent identical periods
—Aperiodic:signal changes without exhibiting a pattern or cycle that repeats over time
In data communications, we commonly use periodic analog signals and nonperiodic digital signals.
Note
8Dr. L. Christofi Spring 2009
3.2 PERIODIC ANALOG SIGNALS3.2 PERIODIC ANALOG SIGNALS
Periodic analog signals can be classified as Periodic analog signals can be classified as simplesimple or or
compositecomposite. A simple periodic analog signal, a . A simple periodic analog signal, a sine wavesine wave, ,
cannot be decomposed into simpler signals. A compositecannot be decomposed into simpler signals. A composite
periodic analog signal is composed of multiple sine waves.periodic analog signal is composed of multiple sine waves.
Sine Wave
WavelengthTime and Frequency DomainComposite Signals
Bandwidth
Topics discussed in this section:Topics discussed in this section:

1.#
9Dr. L. Christofi Spring 2009
A sine wave
We can mathematically describe the sine wave as
s(t) = A sin(2πft + φ)
where, s is the instantaneous amplitudeA is the peak amplitudef is the frequency φ is the phaset is the timeπ is a constant (~3.14159)
10Dr. L. Christofi Spring 2009
Two signals
Same phase and frequency, but different amplitudes

1.#
11Dr. L. Christofi Spring 2009
Frequency and period are the inverse of each other.
Note
Period and frequency
Period refers to the amount of time, in seconds, a signal
needs to complete 1 cycle.
• Denoted by T, measured in seconds.
Frequency refers to the number of periods in one second
• Denoted by f, measured in Hertz (Hz)
12Dr. L. Christofi Spring 2009
Two signals
Same amplitude and phase, but different frequencies

1.#
13Dr. L. Christofi Spring 2009
Units of period and frequency
14Dr. L. Christofi Spring 2009
The power we use at home has a frequency of 50 Hz.
The period of this sine wave can be determined as follows:
Example
T= = = 0.02 s = 20 x 10-3 = 20 ms1
f
1
50

1.#
15Dr. L. Christofi Spring 2009
The period of a signal is 100 ms. What is its frequency in
kilohertz?
Example
Solution
First we change 100 ms to seconds, and then we calculate the frequency from the period (1 Hz = 10−3 kHz).
16Dr. L. Christofi Spring 2009
Frequency is the rate of change with respect to time.
Change in a short span of timemeans high frequency.
Change over a long span of
time means low frequency.
Note
More about frequency

1.#
17Dr. L. Christofi Spring 2009
If a signal does not change at all, its frequency is zero.
If a signal changes instantaneously, its frequency is
infinite.
Note
Two extremes
18Dr. L. Christofi Spring 2009
Phase describes the position of the waveform relative to time 0.
Note
Phase

1.#
19Dr. L. Christofi Spring 2009
Three sine waves
Same amplitude and frequency, but different phases
20Dr. L. Christofi Spring 2009
A sine wave is offset 1/6 cycle with respect to time 0.
What is its phase in degrees and radians?
Solution
We know that 1 complete cycle is 360°. Therefore, 1/6 cycle is
Example

1.#
21Dr. L. Christofi Spring 2009
Wavelength and period
• Wavelength is another characteristic of a signal traveling through a
transmission medium.
• The wavelength depends on both the frequency and the medium.
• The wavelength is the distance a signal can travel in one period.
λ = c/f
where, λ is the wavelength
c is the speed of light (~3x10⁸ m/s)
f is the frequency
22Dr. L. Christofi Spring 2009
Time-domain and frequency-domain plots
of a sine wave
A complete sine wave in the time domain can be represented by one single spike in the frequency domain.
Note

1.#
23Dr. L. Christofi Spring 2009
The frequency domain is more compact and useful when we are
dealing with more than one sine wave. For example, the following
figure shows three sine waves, each with different amplitude and
frequency. All can be represented by three spikes in the frequency
domain.
Example
24Dr. L. Christofi Spring 2009
A single-frequency sine wave is not useful in data communications;
we need to send a composite signal, a signal made of many simple sine waves.
Note
Composite signals
In other words, we can write a composite signal as
s(t) = A1 sin(2πf1t + φ1)+ A2 sin(2πf2t + φ2)+ A3 sin(2πf3t + φ3)+…

1.#
25Dr. L. Christofi Spring 2009
Limited bandwidth
• Any communications channel or transmission medium has a defined bandwidth, which specifies the band of sinusoidal frequency components that can be transmitted through the channel.
• We can use a mathematical technique called Fourier analysis to show that any periodic signal is made up of an infinite series of sinusoidal frequency components.—The period of the signal determines the fundamental frequency
component
—The other components have frequencies which are integer multiples of the fundamental frequency, known as the harmonics of the fundamental
26Dr. L. Christofi Spring 2009
According to Fourier analysis, any composite signal is a combination of
simple sine waves with different frequencies, amplitudes, and phases.
Note
Fourier analysis
In other words, we can write a composite signal as
s(t) = A1 sin(2πf1t + φ1)+ A2 sin(2πf2t + φ2)+ A3 sin(2πf3t + φ3)+…

1.#
27Dr. L. Christofi Spring 2009
If the composite signal is periodic, the decomposition
gives a series of signals with discrete frequencies;
if the composite signal is nonperiodic, the decomposition gives a combination of sine waves
with continuous frequencies.
Note
Signal decomposition
28Dr. L. Christofi Spring 2009
The figure shows a periodic composite signal with frequency
f. This type of signal is not typical of those found in data communications. We can consider it to be three alarm
systems, each with a different frequency. The analysis of this
signal can give us a good understanding of how to
decompose signals.
Example

1.#
29Dr. L. Christofi Spring 2009
Decomposition of a composite periodic
signal in the time and frequency domains
30Dr. L. Christofi Spring 2009
The figure shows a nonperiodic composite signal. It can be
the signal created by a microphone or a telephone set when a word or two is pronounced. In this case, the composite signal
cannot be periodic, because that implies that we are
repeating the same word or words with exactly the same
tone.
Example

1.#
31Dr. L. Christofi Spring 2009
The bandwidth of a composite signal is the difference
between the
highest and the lowest frequencies contained in that signal.
Note
Bandwidth
32Dr. L. Christofi Spring 2009
The bandwidth of periodic and
nonperiodic composite signals

1.#
33Dr. L. Christofi Spring 2009
If a periodic signal is decomposed into five sine waves with frequencies of
100, 300, 500, 700, and 900 Hz, what is its bandwidth? Draw the
spectrum, assuming all components have a maximum amplitude of 10 V.
Solution
Let fh be the highest frequency, fl the lowest frequency, and B the
bandwidth. Then
The spectrum has only five spikes, at 100, 300, 500, 700, and 900 Hz
Example
34Dr. L. Christofi Spring 2009
A periodic signal has a bandwidth of 20 Hz. The highest frequency is 60
Hz. What is the lowest frequency? Draw the spectrum if the signal
contains all integer frequencies of the same amplitude.
Solution
Let fh be the highest frequency, fl the lowest frequency, and B the
bandwidth. Then
The spectrum contains all integer frequencies. We show this by a series of
spikes as shown below
Example

1.#
35Dr. L. Christofi Spring 2009
A nonperiodic composite signal has a bandwidth of 200 kHz, with a middle
frequency of 140 kHz and peak amplitude of 20 V. The two extreme
frequencies have an amplitude of 0. Draw the frequency domain of the
signal.
Solution
The lowest frequency must be at 40 kHz and the highest at 240 kHz.
Figure below shows the frequency domain and the bandwidth.
Example
36Dr. L. Christofi Spring 2009
Another example of a nonperiodic composite signal is the
signal received by an old-fashioned analog black-and-white TV.
A TV screen is made up of pixels. If we assume a
resolution of 640 × 480, we have 307,200 pixels per
screen.
If we scan the screen 30 times per second, this is 307,200 × 30 = 9,216,000 pixels per second.
The worst-case scenario is alternating black and white
pixels. We can send 2 pixels per cycle.
Therefore, we need 9,216,000 / 2 = 4,608,000 cycles per
second, or Hz. The bandwidth needed is 4.608 MHz.
Example

1.#
37Dr. L. Christofi Spring 2009
3.3 DIGITAL SIGNALS3.3 DIGITAL SIGNALS
In addition to being represented by an analog signal, In addition to being represented by an analog signal,
information can also be represented by a information can also be represented by a digital signaldigital signal. .
For example, a 1 can be encoded as a positive voltage For example, a 1 can be encoded as a positive voltage
and a 0 as zero voltage. A digital signal can have more and a 0 as zero voltage. A digital signal can have more
than two levels. In this case, we can send more than 1 bit than two levels. In this case, we can send more than 1 bit
for each level.for each level.
Bit RateBit LengthDigital Signal as a Composite Analog SignalExamples of applications
Topics discussed in this section:Topics discussed in this section:
38Dr. L. Christofi Spring 2009
Two digital signals:
one with two signal levels and the other with four signal levels

1.#
39Dr. L. Christofi Spring 2009
A digital signal has eight levels. How many bits are needed
per level?
SolutionWe calculate the number of bits from the formula log2n
Example: signal levels vs bits
Each signal level is represented by 3 bits.
40Dr. L. Christofi Spring 2009
A digital signal has nine levels. How many bits are needed
per level?
Solution
We calculate the number of bits by using the formula log2n,
i.e. log29=3.17So each signal level is represented by 3.17 bits. However,
this answer is not realistic. The number of bits sent per level
needs to be an integer as well as a power of 2. For this
example, 4 bits can represent one level.
Example: signal levels vs bits

1.#
41Dr. L. Christofi Spring 2009
Bit rate and bit interval
• Most digital signals are aperiodic, so the period or frequency are not appropriate.
• Bit interval (instead of period) and bit rate(instead of frequency) are used to describe digital signals.
• Bit interval is the time required to send one signle bit
• Bit rate is the number of bit intervals per second
—Usually expressed as bits per second (bps)
42Dr. L. Christofi Spring 2009
Assume we need to download text documents at the rate of
100 pages per minute. What is the required bit rate of the channel?
SolutionA page is an average of 24 lines with 80 characters in each
line. If we assume that one character requires 8 bits, the bit rate is
Example: bit rate for text
1.#
43Dr. L. Christofi Spring 2009
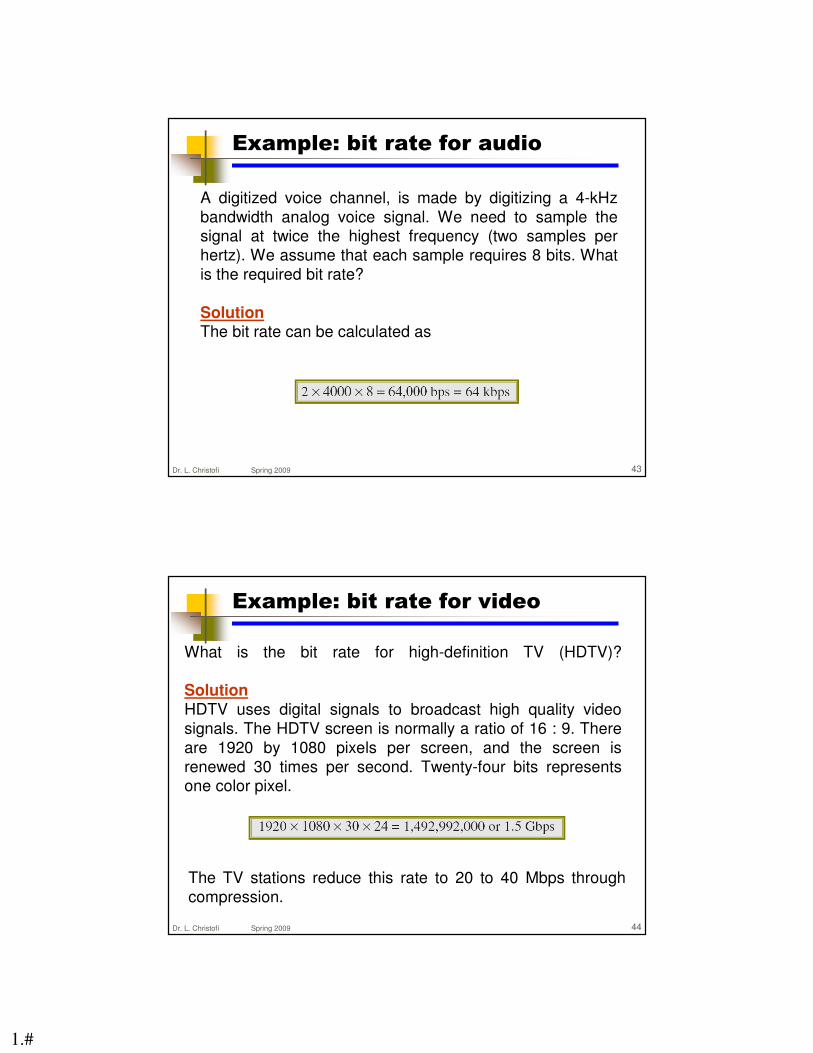
A digitized voice channel, is made by digitizing a 4-kHz
bandwidth analog voice signal. We need to sample the signal at twice the highest frequency (two samples per
hertz). We assume that each sample requires 8 bits. What
is the required bit rate?
SolutionThe bit rate can be calculated as
Example: bit rate for audio
44Dr. L. Christofi Spring 2009
What is the bit rate for high-definition TV (HDTV)?
SolutionHDTV uses digital signals to broadcast high quality video
signals. The HDTV screen is normally a ratio of 16 : 9. There
are 1920 by 1080 pixels per screen, and the screen is
renewed 30 times per second. Twenty-four bits represents one color pixel.
The TV stations reduce this rate to 20 to 40 Mbps through
compression.
Example: bit rate for video

1.#
45Dr. L. Christofi Spring 2009
The time and frequency domains of
periodic and nonperiodic digital signals
46Dr. L. Christofi Spring 2009
Baseband transmission
A digital signal is a composite analog signal with an infinite bandwidth.
Note

1.#
47Dr. L. Christofi Spring 2009
Bandwidths of two low-pass channels
48Dr. L. Christofi Spring 2009
Baseband transmission using a dedicated
medium
Baseband transmission of a digital signal that preserves the shape of the digital signal is possible
only if we have a low-pass channel with an infinite or very wide bandwidth.
Note

1.#
49Dr. L. Christofi Spring 2009
An example of a dedicated channel where the entire
bandwidth of the medium is used as one single channel is a LAN.
Almost every wired LAN today uses a dedicated channel
for two stations communicating with each other.
In a bus topology LAN with multipoint connections, only
two stations can communicate with each other at each moment in time (timesharing); the other stations need to
refrain from sending data.
In a star topology LAN, the entire channel between each
station and the hub is used for communication between
these two entities. We study LANs in a later lecture.
Example
50Dr. L. Christofi Spring 2009
Rough approximation of a digital signal
using the first harmonic for worst case
1.#
51Dr. L. Christofi Spring 2009
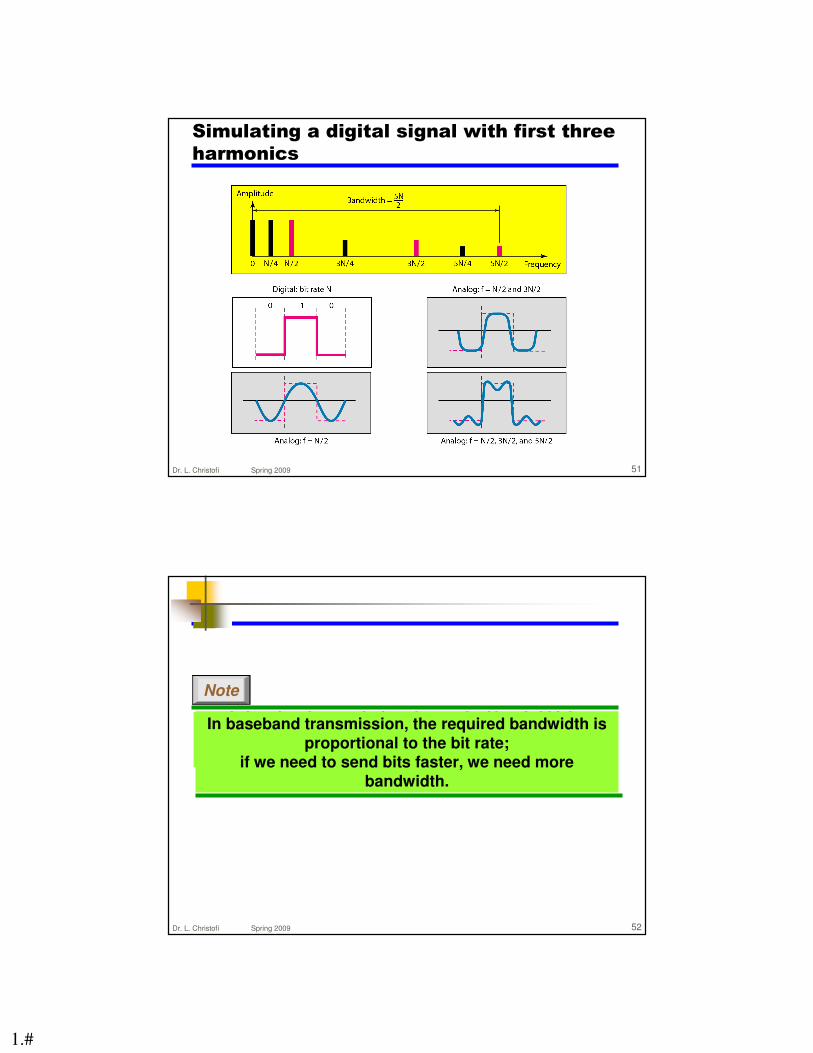
Simulating a digital signal with first three
harmonics
52Dr. L. Christofi Spring 2009
In baseband transmission, the required bandwidth is proportional to the bit rate;
if we need to send bits faster, we need more bandwidth.
Note
In baseband transmission, the required bandwidth is proportional to the bit rate;
if we need to send bits faster, we need more
bandwidth.

1.#
53Dr. L. Christofi Spring 2009
Bandwidth requirements
54Dr. L. Christofi Spring 2009
What is the required bandwidth of a low-pass channel if we
need to send 1 Mbps by using baseband transmission?
Solution
The answer depends on the accuracy desired.
a. The minimum bandwidth, is B = bit rate/2, or 500 kHz.
b. A better solution is to use the first and the third
harmonics with B = 3 × 500 kHz = 1.5 MHz.
c. Still a better solution is to use the first, third, and fifth
harmonics with B = 5 × 500 kHz = 2.5 MHz.
Example

1.#
55Dr. L. Christofi Spring 2009
We have a low-pass channel with bandwidth 100 kHz.
What is the maximum bit rate of this channel?
SolutionThe maximum bit rate can be achieved if we use the first
harmonic. The bit rate is 2 times the available bandwidth,
or 200 kbps.
Example
56Dr. L. Christofi Spring 2009
Bandwidth of a bandpass channel
If the available channel is a bandpass channel, we cannot send the digital signal directly to the channel;
we need to convert the digital signal to an analog signal before transmission.
Note

1.#
57Dr. L. Christofi Spring 2009
Modulation of a digital signal for
transmission on a bandpass channel
58Dr. L. Christofi Spring 2009
An example of broadband transmission using modulation is
the sending of computer data through a telephone subscriber line, the line connecting a resident to the central
telephone office.
These lines are designed to carry voice with a limited
bandwidth. The channel is considered a bandpass channel.
We convert the digital signal from the computer to an analog signal, and send the analog signal.
We can install two converters to change the digital signal to
analog and vice versa at the receiving end. The converter,
in this case, is called a modem which we discuss in detail in
following lectures.
Example

1.#
59Dr. L. Christofi Spring 2009
A second example is the digital cellular telephone. For
better reception, digital cellular phones convert the analog voice signal to a digital signal.
Although the bandwidth allocated to a company providing
digital cellular phone service is very wide, we still cannot
send the digital signal without conversion. The reason is
that we only have a bandpass channel available between caller and callee. We need to convert the digitized voice to
a composite analog signal before sending.
Example
60Dr. L. Christofi Spring 2009
3.4 TRANSMISSION IMPAIRMENT3.4 TRANSMISSION IMPAIRMENT
Signals travel through transmission media, which are not Signals travel through transmission media, which are not
perfect. The imperfection causes signal impairment. This perfect. The imperfection causes signal impairment. This
means that the signal at the beginning of the medium is means that the signal at the beginning of the medium is
not the same as the signal at the end of the medium. What not the same as the signal at the end of the medium. What
is sent is not what is received. Three causes of impairment is sent is not what is received. Three causes of impairment
are are attenuationattenuation, , distortiondistortion, and , and noisenoise..
Attenuation
Distortion
Noise
Topics discussed in this section:Topics discussed in this section:

1.#
61Dr. L. Christofi Spring 2009
Causes of impairment
62Dr. L. Christofi Spring 2009
Attenuation
Attenuation means loss of energy.
When a signal travels through a medium, it looses some
of its energy so that it can overcome the resistance of the medium.
To compensate for this loss, amplifiers are used to amplify
the signal.

1.#
63Dr. L. Christofi Spring 2009
Decibel
• To show that a signal has lost or gained strength, we
use the concept of the decibel (dB).
• The decibel measures the relative strengths of two
signals or a signal at two different points.
• The decibel is negative if a signal is attenuated and
positive if a signal is amplified.
dB = 10 log10(P2/P1)
where P1 and P2 are the powers of a signal at points 1
and 2, respectively
64Dr. L. Christofi Spring 2009
Suppose a signal travels through a transmission medium
and its power is reduced to one-half. This means that P2 is (1/2)P1. In this case, the attenuation (loss of power) can be
calculated as
Example
A loss of 3 dB (–3 dB) is equivalent to losing one-half the
power.

1.#
65Dr. L. Christofi Spring 2009
A signal travels through an amplifier, and its power is
increased 10 times. This means that P2 = 10P1 . In this case, the amplification (gain of power) can be calculated as
Example
66Dr. L. Christofi Spring 2009
One reason that engineers use the decibel to measure the changes in
the strength of a signal is that decibel numbers can be added (or
subtracted) when we are measuring several points (cascading)
instead of just two. In the figure below, a signal travels from point 1 to
point 4. In this case, the decibel value can be calculated as
Example

1.#
67Dr. L. Christofi Spring 2009
Sometimes the decibel is used to measure signal power in
milliwatts. In this case, it is referred to as dBm and is calculated as dBm = 10 log10 Pm
where Pm is the power in milliwatts.
Calculate the power of a signal with −30 dBm
Solution
We can calculate the power in the signal as
Example
68Dr. L. Christofi Spring 2009
The loss in a cable is usually defined in decibels per
kilometer (dB/km). If the signal at the beginning of a cable
with −0.3 dB/km has a power of 2 mW, what is the power
of the signal at 5 km?
Solution
The loss in the cable in decibels is 5 × (−0.3) = −1.5 dB.
We can calculate the power as
Example

1.#
69Dr. L. Christofi Spring 2009
Distortion
• Distortion means that the signal changes its form or shape.
• Distortion occurs in a composite signal made of different
frequencies.
• Each signal component has its own propagation speed through a
medium and therefore its own delay in arriving at the final destination.
70Dr. L. Christofi Spring 2009
Noise
Several types of noise such as thermal noise, induced
noise, crosstalk and impulse noise may corrupt the signal.

1.#
71Dr. L. Christofi Spring 2009
Signal-to-Noise ratio (SNR)
• SNR is the statistical ratio of power of the signal to the power of the noise
• In decibels it can be expressed as follows:
SNRdB= 10 log10 SNR
72Dr. L. Christofi Spring 2009
The power of a signal is 10 mW and the power of the noise is
1 µW; what are the values of SNR and SNRdB ?
Solution
The values of SNR and SNRdB can be calculated as follows:
Example

1.#
73Dr. L. Christofi Spring 2009
The values of SNR and SNRdB for a noiseless channel are
We can never achieve this ratio in real life; it is an ideal ratio.
Example
74Dr. L. Christofi Spring 2009
Two cases of SNR: a high SNR & a low SNR

1.#
75Dr. L. Christofi Spring 2009
3.5 DATA RATE LIMITS3.5 DATA RATE LIMITS
A very important consideration in data communications is A very important consideration in data communications is
how fast we can send data, in bits per second, over a how fast we can send data, in bits per second, over a
channel. Data rate depends on three factors:channel. Data rate depends on three factors:
1.1. The bandwidth availableThe bandwidth available
2.2. The level of the signals we useThe level of the signals we use
33. The quality of the channel (the level of noise). The quality of the channel (the level of noise)
Noiseless Channel: Nyquist Bit RateNoisy Channel: Shannon CapacityUsing Both Limits
Topics discussed in this section:Topics discussed in this section:
76Dr. L. Christofi Spring 2009
Noiseless channel: Nyquist bit rate
• For a noiseless channel, the Nyquist bit rate formula defines the theoretical maximum bit rate
C = 2 B log2L
where, C is the channel capacity or bit rate in bps
B is the bandwidth in Hz
L is the number of signal levels used to represent data

1.#
77Dr. L. Christofi Spring 2009
Consider a noiseless channel with a bandwidth of 3000 Hz
transmitting a signal with two signal levels (binary signal). The maximum bit rate can be calculated as
Example
Consider the same noiseless channel transmitting a signal
with four signal levels (for each level, we send 2 bits). The
maximum bit rate can be calculated as
78Dr. L. Christofi Spring 2009
We need to send 265 kbps over a noiseless channel with a
bandwidth of 20 kHz. How many signal levels do we need?
Solution
We can use the Nyquist formula as shown:
Since this result is not a power of 2, we need to either
increase the number of levels or reduce the bit rate. If we have 128 levels, the bit rate is 280 kbps. If we have 64 levels,
the bit rate is 240 kbps.
Example

1.#
79Dr. L. Christofi Spring 2009
Noisy channel: Shannon capacity
• In reality, we cannot have a noiseless channel; the channel is always noisy.
• In this case, the Shannon capacity formula is used to determine the theoretical highest data rate for a noisy channel:
C = B log2 (1+SNR)
where, C is the capacity of the channel in bps
B is the bandwidth in Hz
SNR is the signal-to-noise ratio
80Dr. L. Christofi Spring 2009
Consider an extremely noisy channel in which the value of
the signal-to-noise ratio is almost zero. In other words, the noise is so strong that the signal is faint. For this channel
the capacity C is calculated as
This means that the capacity of this channel is zero
regardless of the bandwidth. In other words, we cannot
receive any data through this channel.
Example

1.#
81Dr. L. Christofi Spring 2009
We can calculate the theoretical highest bit rate of a regular telephone line. A telephone line normally has a bandwidth
of 3000. The signal-to-noise ratio is usually 3162. For this
channel the capacity is calculated as
This means that the highest bit rate for a telephone line is 34.860 kbps. If we want to send data faster than this, we
can either increase the bandwidth of the line or improve the
signal-to-noise ratio.
Example
82Dr. L. Christofi Spring 2009
The signal-to-noise ratio is often given in decibels. Assume
that SNRdB = 36 and the channel bandwidth is 2 MHz.
The theoretical channel capacity can be calculated as
Example

1.#
83Dr. L. Christofi Spring 2009
For practical purposes, when the SNR is very high, we can
assume that SNR + 1 is almost the same as SNR. In these
cases, the theoretical channel capacity can be simplified to
For example, we can calculate the theoretical capacity of
the previous example as
Example
84Dr. L. Christofi Spring 2009
We have a channel with a 1-MHz bandwidth. The SNR for this channel
is 63. What are the appropriate bit rate and signal level?
Solution
First, we use the Shannon formula to find the upper limit.
Example
The Shannon formula gives us 6 Mbps, the upper limit. For better
performance we choose something lower, 4 Mbps, for example. Then
we use the Nyquist formula to find the number of signal levels.

1.#
85Dr. L. Christofi Spring 2009
The Shannon capacity gives us the upper limit; the
Nyquist formula tells us how many signal levels we
need.
Note
86Dr. L. Christofi Spring 2009
3.6 PERFORMANCE3.6 PERFORMANCE
One important issue in networking is the One important issue in networking is the performanceperformance of the of the
networknetwork——how good is it? We discuss quality of service, an how good is it? We discuss quality of service, an
overall measurement of network performance, in greater overall measurement of network performance, in greater
detail in Chapter 24. In this section, we introduce terms that detail in Chapter 24. In this section, we introduce terms that
we need for future chapters.we need for future chapters.
Bandwidth
ThroughputLatency (Delay)Bandwidth-Delay Product
Topics discussed in this section:Topics discussed in this section:

1.#
87Dr. L. Christofi Spring 2009
In networking, we use the term bandwidth in two
contexts.
� The first, bandwidth in hertz, refers to the range of
frequencies in a composite signal or the range of
frequencies that a channel can pass.
� The second, bandwidth in bits per second, refers to the speed of bit transmission in a channel or link.
Note
Bandwidth
88Dr. L. Christofi Spring 2009
The bandwidth of a subscriber line is 4 kHz for voice or
data. The bandwidth of this line for data transmissioncan be up to 56,000 bps using a sophisticated modem to
change the digital signal to analog.
Example
If the telephone company improves the quality of the line
and increases the bandwidth to 8 kHz, we can send 112,000 bps by using the same technology.

1.#
89Dr. L. Christofi Spring 2009
Throughput
• The throughput is the measurement of how fast data can pass through a network in one second.
• Throughput is calculated as follows:
Throughput = frames per second x bits per frame
90Dr. L. Christofi Spring 2009
A network with bandwidth of 10 Mbps can pass only an
average of 12,000 frames per minute with each frame
carrying an average of 10,000 bits. What is the throughput
of this network?
SolutionWe can calculate the throughput as
The throughput is almost one-fifth of the bandwidth in this
case.
Example

1.#
91Dr. L. Christofi Spring 2009
Propagation time and transmission time
• Propagation time measures the time required for a
signal (or a bit) to travel from one point of the transmission medium to another.
• Propagation time is calculated as follows:
• Transmission time measures the time required for a
signal to be transmitted from the sending device to the
medium.
• Transmission time is calculated as follows:
Propagation time [s] = Distance [m] / Propagation speed [m/s]
Transmission time [s] = Data [bits] / Bandwidth [bps]
92Dr. L. Christofi Spring 2009
What is the propagation time if the distance between the
two points is 12,000 km? Assume the propagation speed to be 2.4×10⁸ m/s in cable.
Solution
We can calculate the propagation time as
The example shows that a bit can go over the Atlantic
Ocean in only 50 ms if there is a direct cable between the source and the destination.
Example

1.#
93Dr. L. Christofi Spring 2009
What are the propagation time and the transmission time for a 2.5kbyte
message (an e-mail) if the bandwidth of the network is 1 Gbps?
Assume that the distance between the sender and the receiver is
12,000 km and that light travels at 2.4×10⁸ m/s.
Solution
We can calculate the propagation and transmission time as follows:
Example
Note that in this case, because the message is short and the bandwidth is
high, the dominant factor is the propagation time, not the transmission
time. The transmission time can be ignored.
94Dr. L. Christofi Spring 2009
What are the propagation time and the transmission time for a 5-Mbyte
message (an image) if the bandwidth of the network is 1 Mbps? Assume
that the distance between the sender and the receiver is 12,000 km and
that light travels at 2.4 × 10⁸ m/s.
Solution
We can calculate the propagation and transmission times as shown on the
next slide.
Example
Note that in this case, because the message is very long and the
bandwidth is not very high, the dominant factor is the transmission time,
not the propagation time. The propagation time can be ignored.

1.#
95Dr. L. Christofi Spring 2009
3.7 SUMMARY (part 3)
• Data must be transformed into electromagnetic signals prior to transmission across a network.
• Data and signals can be either analog or digital.
• A signal is periodic if it consists of a continuously repeating pattern.
• Each sine wave can be characterized by its amplitude, frequency, and phase.
• Frequency and period are inverses of each other.
• A time-domain graph plots amplitude as a function of time.
• A frequency-domain graph plots each sine wave’s peak amplitude against its frequency.
• By using Fourier analysis, any composite signal can be represented as a combination of simple sine waves.
• The spectrum of a signal consists of the sine waves that make up the signal.
• The bandwidth of a signal is the range of frequencies the signal occupies. Bandwidth is determined by finding the difference between the highest and lowest frequency components.
• Bit rate (number of bits per second) and bit interval (duration of 1 bit) are terms used to describe digital signals.
• A digital signal is a composite signal with an infinite bandwidth.
• Bit rate and bandwidth are proportional to each other.
• The Nyquist formula determines the theoretical data rate for a noiseless channel.
• The Shannon capacity determines the theoretical maximum data rate for a noisy channel.
• Attenuation, distortion, and noise can impair a signal.
• Attenuation is the loss of a signal’s energy due to the resistance of the medium.
• The decibel measures the relative strength of two signals or a signal at two different points.
• Distortion is the alteration of a signal due to the differing propagation speeds of each of the frequencies that make up a signal.
• Noise is the external energy that corrupts a signal.
• We can evaluate transmission media by throughput, propagation speed, and propagation time.
• The wavelength of a frequency is defined as the propagation speed divided by the frequency.
96Dr. L. Christofi Spring 2009
References
• W. Stalling, Local and Metropolitan Area Networks, 6th edition, Prentice Hall, 2000
• F. Halsall, Data Communications, Computer Networks and Open Systems, 4th edition, Addison Wesley, 1995
• B.A. Forouzan, Data Communications and Networking, 4th edition, McGraw-Hill, 2007
• W. Stallings, Data and Computer Communications, 7th edition, Prentice Hall, 2004