Embed Size (px)
Citation preview

Lecture 1
Principle of Microwave Radiometry
Dr. Fuzhong Weng Center for Satellite Applications and Research
National Environmental Satellites, Data and Information Service National Oceanic and Atmospheric Administration
2012 Update
Outline
1. Solar Radiation Spectrum 2. Microwave Radiometry System 3. History of Microwave Instruments 4. Calibration and Validation 5. Microwave Data, Products and Applications 6. Future Challenges 7. Summary

The visible portion of the spectrum may be measured using wavelength in unit of µm nm eV (electron volts)
Electromagnetic (EM) Spectrum The Sun produces a continuous spectrum of energy from gamma rays to radio waves that continually bathe the Earth in energy.
All units are Interchangeable.
Sun Earth

Blackbody Radiation Curves
Rel
ativ
e R
adia
tion
Ene
rgy
Wavelenth (µm)
6000 K Sun
300 K Earth
3000 K Tungsten filament
800 K Red hot object
150 K Dry ice
79 K Liquid air
Visible light
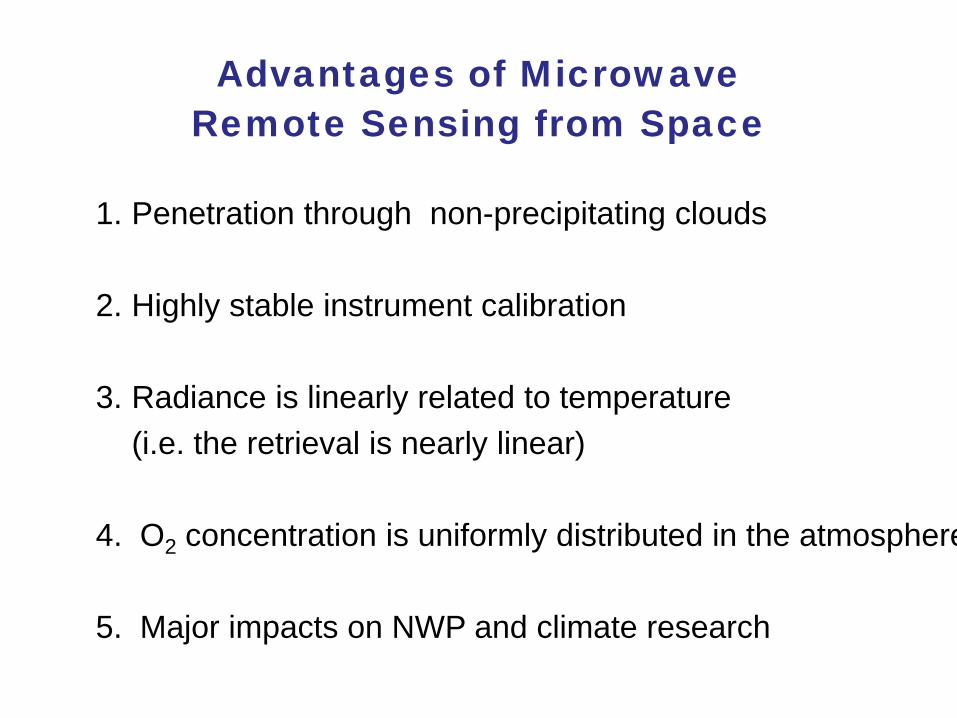
Advantages of Microwave Remote Sensing from Space
1. Penetration through non-precipitating clouds
2. Highly stable instrument calibration
3. Radiance is linearly related to temperature (i.e. the retrieval is nearly linear)
4. O2 concentration is uniformly distributed in the atmosphere
5. Major impacts on NWP and climate research

Microwave Radiometers
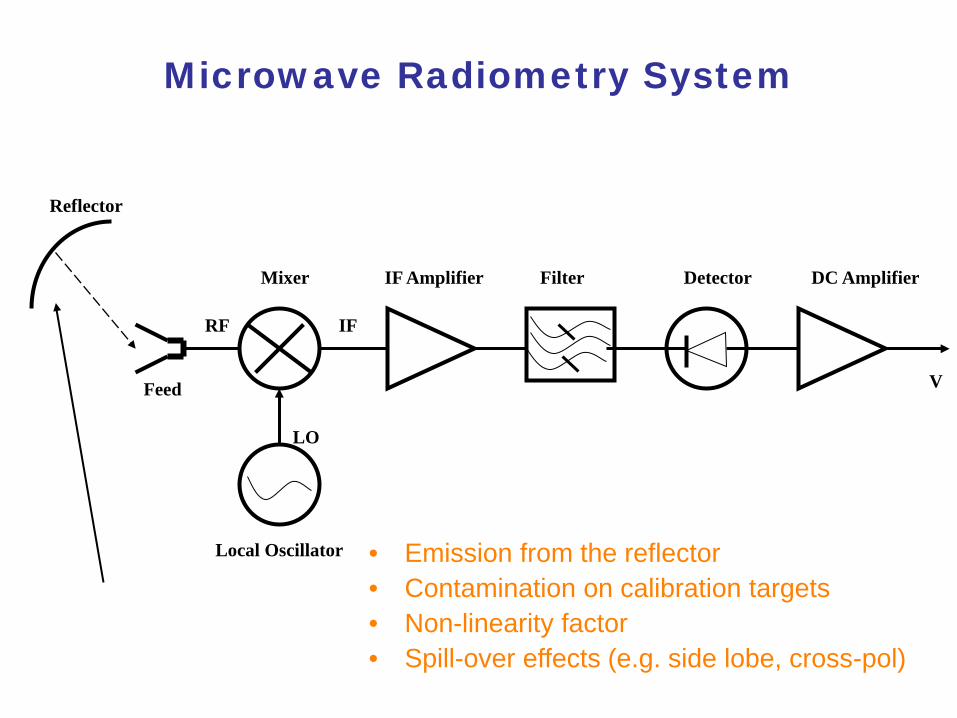
Microwave Radiometry System
Local Oscillator
Mixer IF Amplifier Filter Detector DC Amplifier
LO
RF IF
V Feed
Reflector
• Emission from the reflector • Contamination on calibration targets • Non-linearity factor • Spill-over effects (e.g. side lobe, cross-pol)
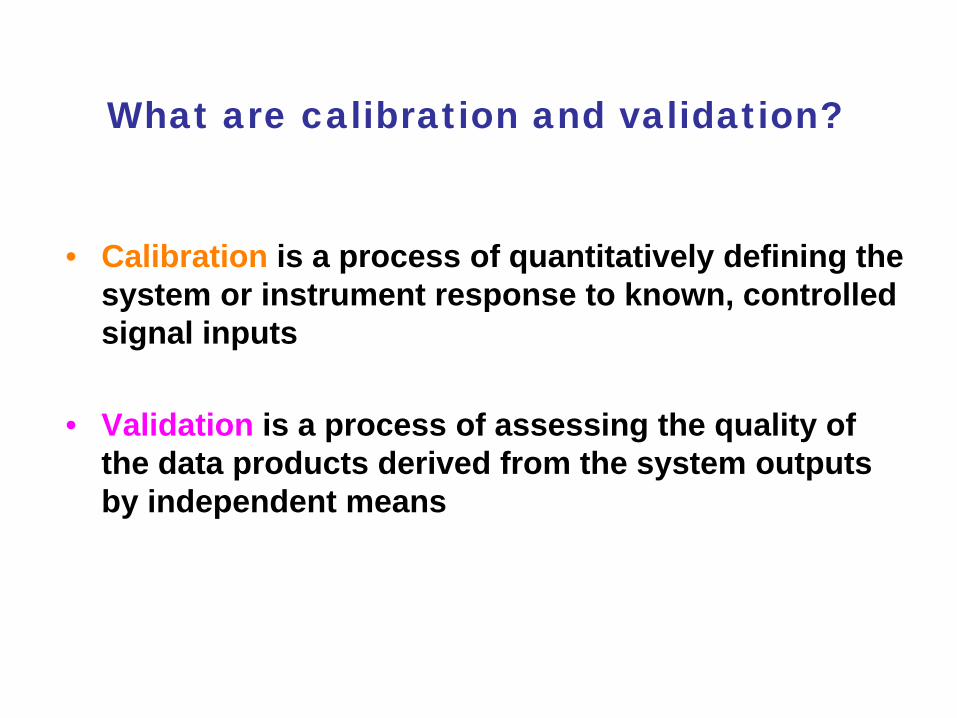
What are calibration and validation?
• Calibration is a process of quantitatively defining the system or instrument response to known, controlled signal inputs
• Validation is a process of assessing the quality of
the data products derived from the system outputs by independent means
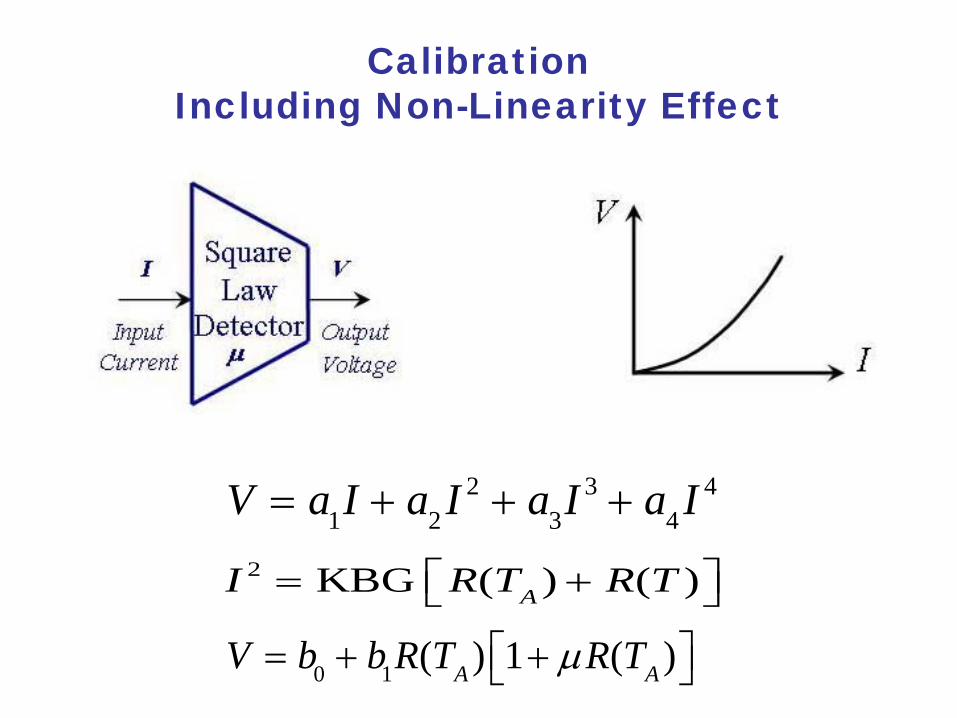
Calibration Including Non-Linearity Effect
V = a1I + a2 I 2 + a3I 3 + a4 I 4
I 2 = KBG R(TA ) + R(T )
V = b0 + b1R(TA ) 1+ µR(TA )
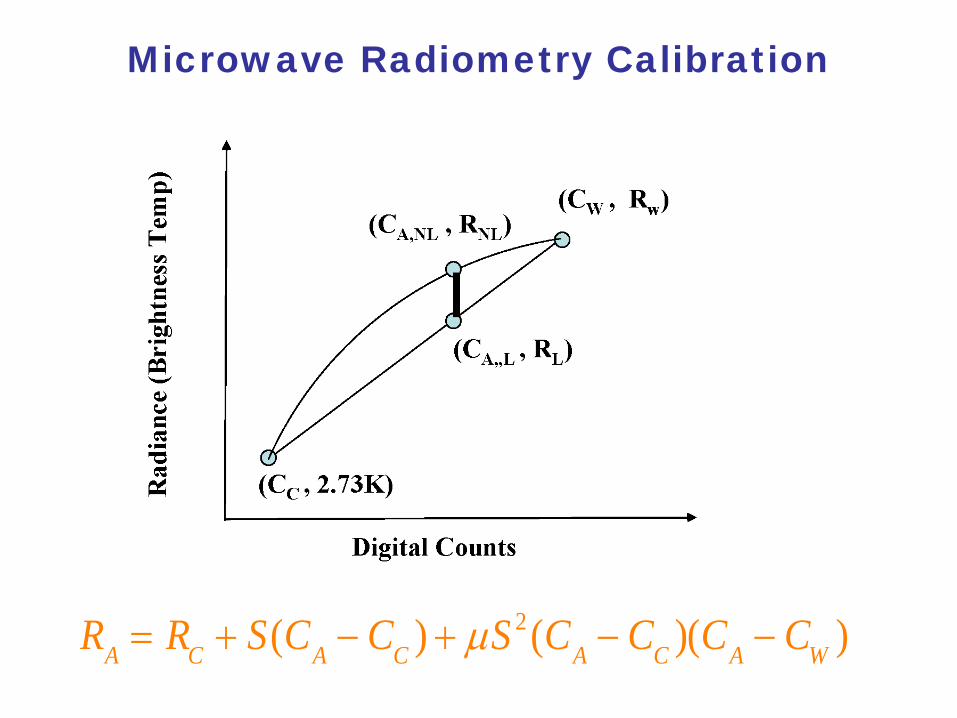
Microwave Radiometry Calibration
RA = RC + S(CA − CC ) + µS 2 (CA − CC )(CA − CW )

Microwave Instrument Calibration Components
• Energy sources entering feed for a reflector configuration
• Earth scene component • Reflector emission • Sensor emission viewed through
reflector • Sensor reflection viewed through
reflector • Spacecraft emission viewed through
reflector • Spacecraft reflection viewed through
reflector • Spillover directly from space • Spillover emission from sensor • Spillover reflected off sensor from
spacecraft • Spillover reflected off sensor from
space • Spillover emission from spacecraft

Microwave Measurement Data Records
L1A/B

True y
Measured y
Precision: p
Uncertainty: u = √a2+p2
Traits: Accuracy, Precision and Uncertainty (After Stephens, 2003)

True y
p(t1)
p(t2)
y(t1)
y(t2)
Accuracy, Precision, Stability (after Stephens)
Accuracy = True y - mean y Precision = standard deviation of y Stability = change of accuracy with time
y

F13 provided a stable and longest time series for inter-sensor calibration!
DMSP SSM/I Orbital Draft

16
Conical vs Cross Track Sounding
• Large scan swath width (no orbit gap) • Same resolution for all frequencies • Mixing pol as scan from nadir to limb • Res varies with scan angle
• Narrow scan swath with orbit gap • FOV size is the same everywhere but varies with frequencies • Same pol for all scan positions
17
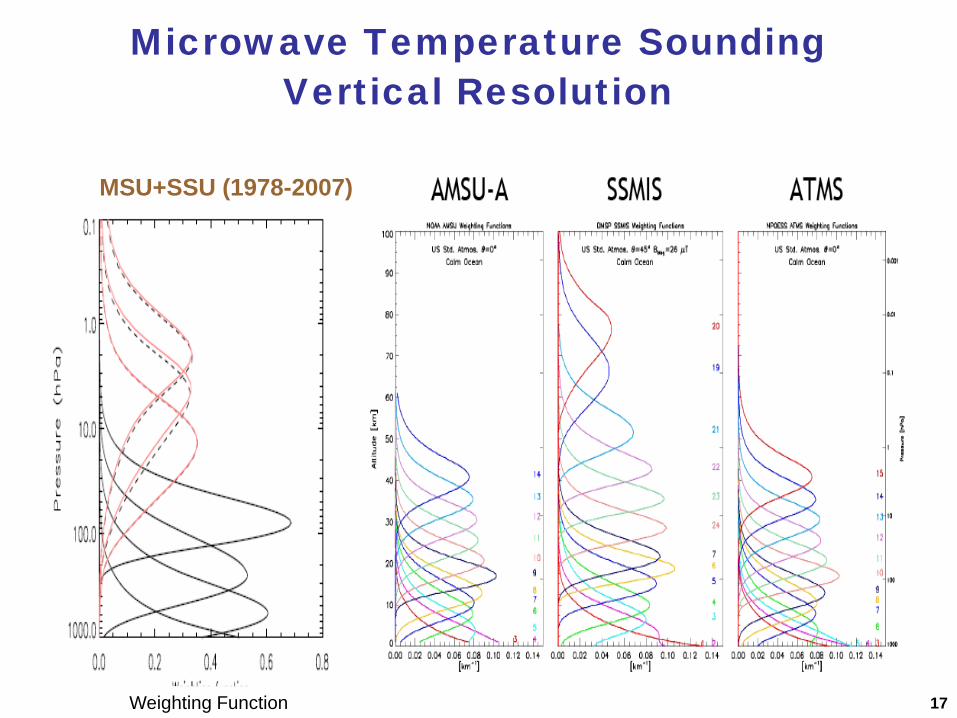
Microwave Temperature Sounding Vertical Resolution
MSU+SSU (1978-2007)
Weighting Function
18
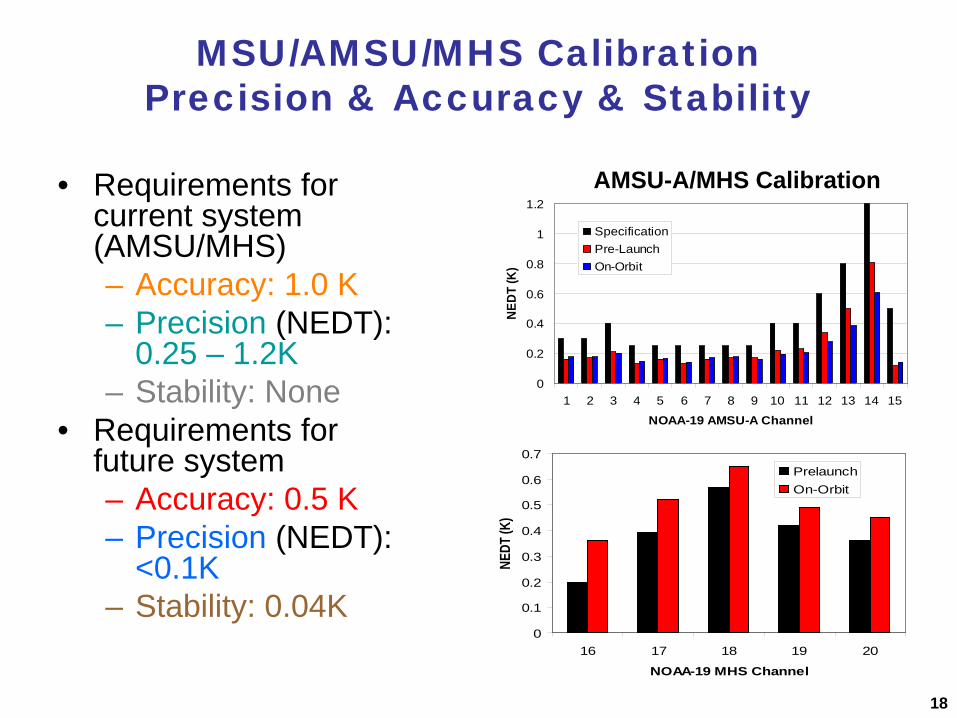
MSU/AMSU/MHS Calibration Precision & Accuracy & Stability
• Requirements for current system (AMSU/MHS) – Accuracy: 1.0 K – Precision (NEDT):
0.25 – 1.2K – Stability: None
• Requirements for future system – Accuracy: 0.5 K – Precision (NEDT):
<0.1K – Stability: 0.04K
0
0.2
0.4
0.6
0.8
1
1.2
1 2 3 4 5 6 7 8 9 10 11 12 13 14 15
NOAA-19 AMSU-A Channel
NEDT
(K)
SpecificationPre-LaunchOn-Orbit
0
0.1
0.2
0.3
0.4
0.5
0.6
0.7
16 17 18 19 20
NOAA-19 MHS Channel
NEDT
(K)
PrelaunchOn-Orbit
AMSU-A/MHS Calibration
Physical Basis and Phenomenology
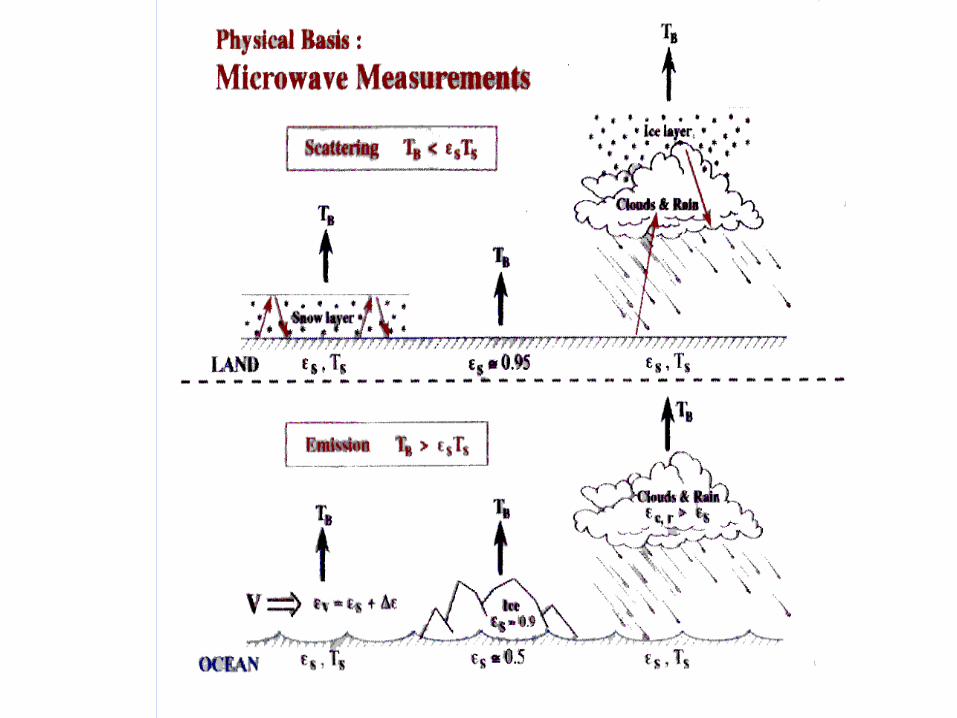
• In microwave region, surface emissivity over oceans is typically low and therefore emits less thermal radiation
• Clouds and raindrops in atmosphere absorb the emitted radiation from surface and re-emit higher radiation
• A retrieval of a lower amount of cloud liquid water is significantly affected by sea surface conditions
• The absorption coefficient of cloud liquid water is dependent on cloud temperature
• Accuracy in remote sensing of cloud retrieval over land is poor due to large variability of emissivity
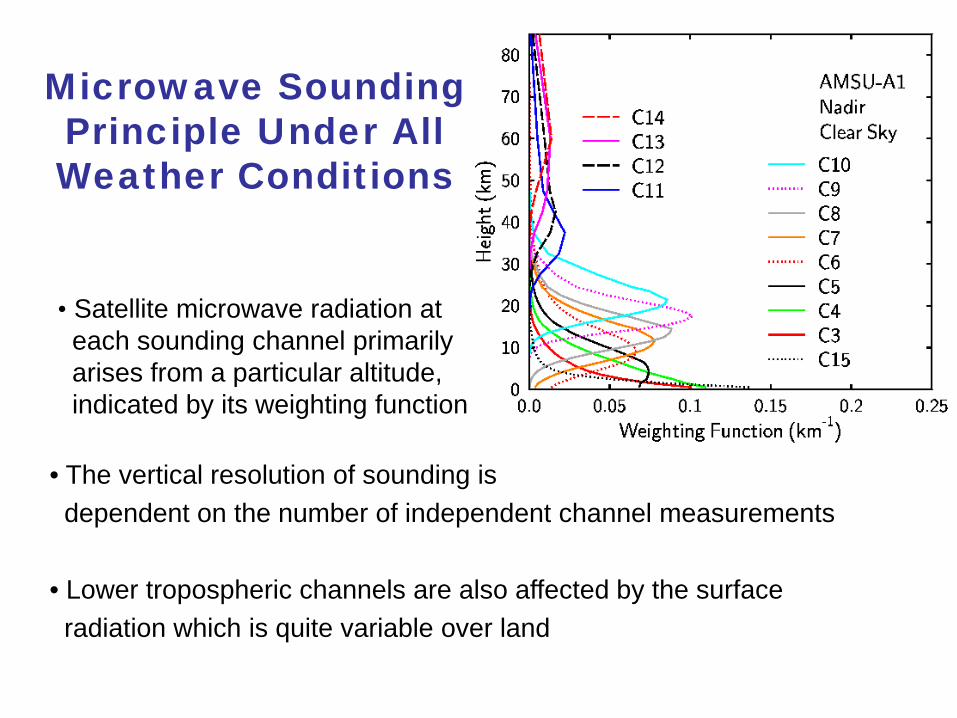
Microwave Sounding Principle Under All Weather Conditions
• The vertical resolution of sounding is dependent on the number of independent channel measurements • Lower tropospheric channels are also affected by the surface radiation which is quite variable over land
• Satellite microwave radiation at each sounding channel primarily arises from a particular altitude, indicated by its weighting function

Advanced Microwave Sounding Unit Window Channels
23.8 GHz 31.4 GHz
89 GHz 150 GHz

Advanced Microwave Sounding Unit Sounding Channels
53.7 GHz 52.8 GHz
183+-1 GHz 183+-3 GHz

240
250
260
270
280
0.0 0.1 0.2 0.3 0.4 0.5 0.6 0.7
Liquid Water Path (mm)
Bri
ghtn
ess
Tem
p. (
K)
85h85v91h91v
Cloud Emission and Scattering (over Oceans)
235
245
255
265
275
0.0 0.2 0.4 0.6 0.8
Ice Water Path (mm)
Brig
htne
ss T
emp.
(K) 85h
85v91h91v

5 5
2009 2010 2004 2005 2006 2007 2008 2011 2012 2013 2014 2015 2016 2017 2018
2019 2020
PM Orbit
NOAA 17
Mid-AM Orbit
Early-AM Orbit
DMSP 17 DMSP 19
DMSP 20
METOP-B METOP-C
METOP-A
DMSP 13
DMSP 16
DMSP 18
NOAA 18 NOAA 19
JPSS : ATMS
NOAA 16
EOS AQUA AMSU-A
DMSP SSMI/S
METOP: AMSU-A/MHS
NOAA: AMSU-A/MHS
NPP: ATMS
US Polar Missions with MW Sensors for Operational Uses

26
From AMSU/MHS to ATMS
– 70x40x60 cm – 110 W – 85 kg
– 8 year life
AMSU-A1
AMSU-A2
MHS
Reduce the volume by 3x
• 75x70x64 cm • 24 W • 50 kg
• 3-yr life
• 73x30x61 cm • 67 W • 54 kg
• 3-yr life
• 75x56x69 cm • 61 W • 50 kg
• 4-yr life
From Bill Blackwell, MIT

Content
• Long-Term Monitoring System for Suomi NPP/JPSS Operational CalVal
• Suomi NPP SDR Product Maturity
• CalVal Results and New Sciences
• Summary and Conclusions
Vern Suomi
Suomi NPP satellite was successfully launched on October 28, 2011!!!!

Suomi NPP Instruments (the Same as JPSS-1)
JPSS Instrument Measurement
ATMS - Advanced Technology Microwave Sounder
ATMS and CrIS together provide high vertical resolution temperature and water vapor information needed to maintain and improve forecast skill out to 5 to 7 days in advance for extreme weather events, including hurricanes and severe weather outbreaks
CrIS - Cross-track Infrared Sounder
VIIRS – Visible Infrared Imaging Radiometer Suite
VIIRS provides many critical imagery products including snow/ice cover, clouds, fog, aerosols, fire, smoke plumes, vegetation health, phytoplankton abundance/chlorophyll
OMPS - Ozone Mapping and Profiler Suite
Ozone spectrometers for monitoring ozone hole and recovery of stratospheric ozone and for UV index forecasts
CERES - Clouds and the Earth’s Radiant Energy System
Scanning radiometer which supports studies of Earth Radiation Budget
29
Summary of Suomi NPP TDR/SDR Algorithm Schedule
C
C C C C C C C C C C C C C
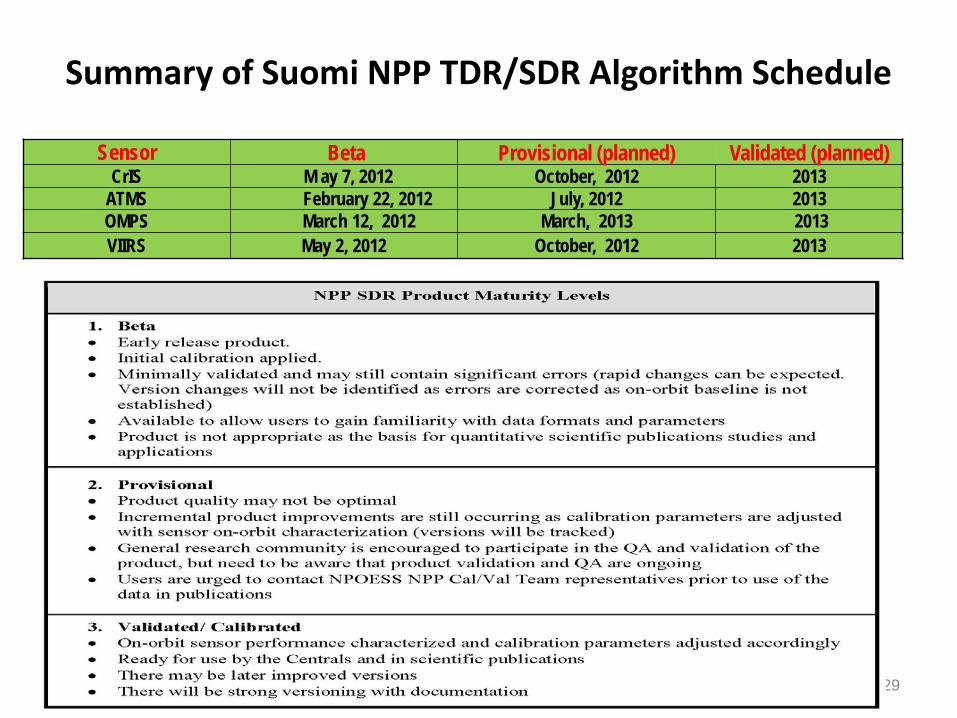
Sensor Beta Provisional (planned) Validated (planned) CrIS M ay 7, 2012 October, 2012 2013
ATMS February 22, 2012 July, 2012 2013 OMPS March 12, 2012 March, 2013 2013 VIIRS May 2, 2012 October, 2012 2013

NOAA Instrument Long-Term Monitoring System
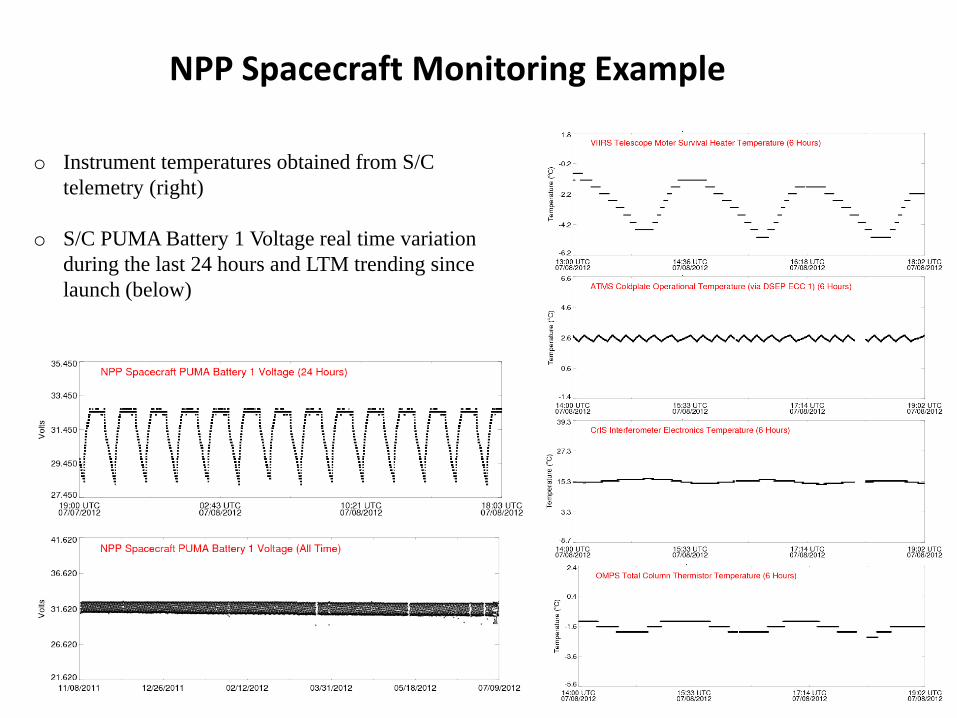
NPP Spacecraft Monitoring Example
o Instrument temperatures obtained from S/C telemetry (right)
o S/C PUMA Battery 1 Voltage real time variation during the last 24 hours and LTM trending since launch (below)

ATMS Space View Count
• NPP ATMS space view calibration counts are stable • NPP ATMS warm load calibration counts and gain are also stable (not shown)

ATMS Calibration Target Monitoring
o Lunar intrusion effects on ATMS space view readings and channels are different (right)
o ATMS 4-Wire PRTs anomalies are observed in individual readings of all bands (below)

ATMS Bias Monitoring
o ATMS angular dependent bias character obtained from RTM (right)
o ATMS daily global images (below) and data quality distribution

ATMS Data Types
Antenna Data Record (TDR): brightness temperatures at all 22 channels at the original field of view (FOV) derived from two-point calibration with non-linearity correction and geolocation
Sensor Data Record (SDR): brightness temperatures with all 22 channels at their original field of view resolution with corrections of antenna gain and side-slope effects to TDR data
Remap Sensor Data Record (RSDR): SDR data at each channel other than ch 1 and 2 are resampled to the CrIS field of regard (3x3 field of views) which is equivalent to about AMSU-A antenna beam width (3.3 degree)
Raw Data Record (RDR): digital counts with full calibration and geo-location information for all 22 channels at the original field of view (FOV)
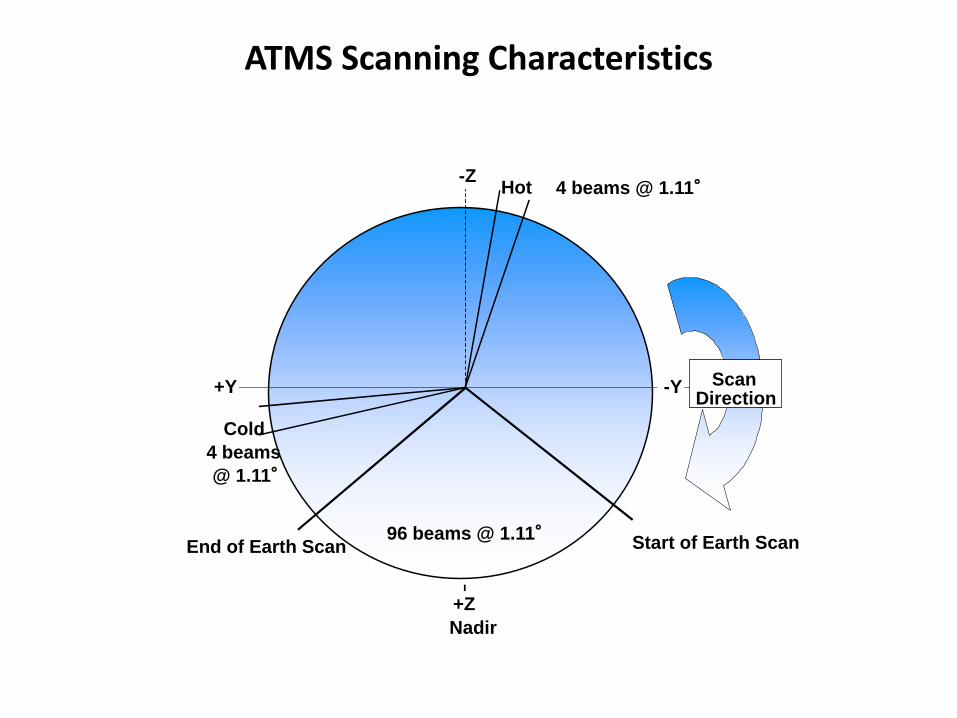
ATMS Scanning Characteristics
Nadir
Start of Earth Scan End of Earth Scan
Cold
Hot
96 beams @ 1.11°
4 beams @ 1.11°
4 beams @ 1.11°
Scan Direction
-Z
-Y +Y
+Z

Spectral Differences
Ch GHz Pol Ch GHz Pol
1 23.8 QV 1 23.8 QV
2 31.399 QV 2 31.4 QV
3 50.299 QV 3 50.3 QH
4 51.76 QH
4 52.8 QV 5 52.8 QH
5 53.595 ± 0.115 QH 6 53.596 ± 0.115 QH
6 54.4 QH 7 54.4 QH
7 54.94 QV 8 54.94 QH
8 55.5 QH 9 55.5 QH
9 fo = 57.29 QH 10 fo = 57.29 QH
10 fo ± 0.217 QH 11 fo±0.3222±0.217 QH
11 fo±0.3222±0.048 QH 12 fo± 0.3222±0.048 QH
12 fo ±0.3222±0.022 QH 13 fo±0.3222±0.022 QH
13 fo± 0.3222±0.010 QH 14 fo±0.3222 ±0.010 QH
14 fo±0.3222±0.0045 QH 15 fo± 0.3222±0.0045 QH
15 89.0 QV
16 89.0 QV 16 88.2 QV
17 157.0 QV 17 165.5 QH
18 183.31 ± 1 QH 18 183.31 ± 7 QH
19 183.31 ± 3 QH 19 183.31 ± 4.5 QH
20 191.31 QV 20 183.31 ± 3 QH
21 183.31 ± 1.8 QH
22 183.31 ± 1 QH
Exact match to AMSU/MHS
Only Polarization different Unique Passband
Unique Passband, and Pol. different from closest AMSU/MHS channels
MH
S A
MSU
-A
AMSU/MHS
ATMS has 22 channels and
AMSU/MHS have 20, with polarization differences between some channels
− QV = Quasi-vertical polarization vector is parallel to the scan plane at nadir
− QH = Quasi-horizontal polarization vector is perpendicular to the scan plane at nadir
38
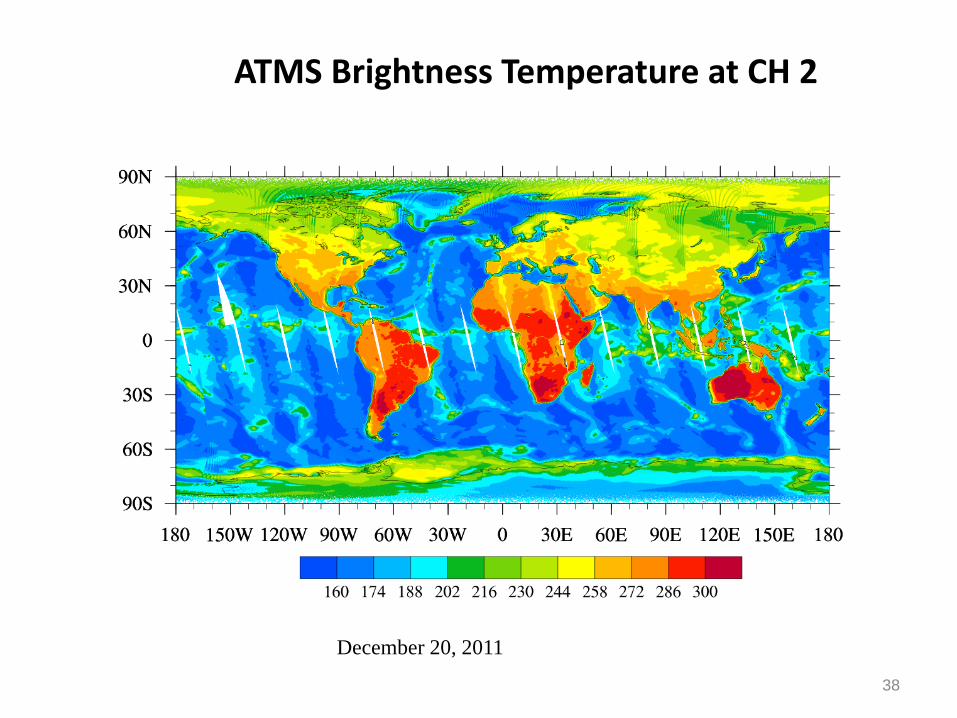
December 20, 2011
ATMS Brightness Temperature at CH 2

AMSU-A LWP (mm)
0.01 0.04 0.07 0.1 0.2 0.3 0.4 0.5 1 1.5
ATMS LWP (mm)

ATMS Noise Equivalent Differential Temperature (NEDT)
On-orbit ATMS noise magnitudes are about twice as large as those AMSUMHS but much lower than specification. The re-sampled ATMS data within CrIS FOR or equivalent AMSU-A FOV would result in noise much lower than that of AMSU-A/MHS
1 2 3 4 5 6 7 8 9 10 11 12 13 14 15 16 17 18 19 20 21 22
NEΔ
T (K
)
Channel Number

Building High Quality NPP SDR Products for Science Community: Or-Orbit ATMS Absolute Calibration Using
COSMIC and LBL RT Model
1. High vertical resolution 2. No contamination from clouds 3. No system calibration required 4. High accuracy and precision:
The global mean differences between COSMIC and high-
quality reanalyses is ~0.65K between 8 and 30km (Kishore et al. 2008)
The precision of COSMIC GPS RO soundings is ~0.05K in the upper troposphere and lower stratosphere (Anthes et al. 2008)

NPP Data Collocation with COSMIC
• Time period of data search:
January, 2012
• Collocation of CloudSat and COSMIC data: Time difference < 0.5 hour Spatial distance < 30 km (GPS geolocation at 10km altitude is used for spatial collocation)
3056 collocated measurements
Courtesy of Lin Lin, STAR

Pres
sure
(hPa
)
Weighting Function
ATMS WF (U.S. Standard Atmosphere)
GPS Sounding Top
1051 UTC on January 1, 2012
Add 1976 U.S. Standard Atmosphere State to GPS
Soundings
GPS Sounding Top

MonoRTM
Microwave sounding channels at 50-60 GHz O2 absorption band can be best simulated under a cloud-free atmosphere using line by line calculation
all gases O2 H2O other gases
•Perform a line by line radiative transfer calculation •Accurate atmospheric spectroscopy data base •Only gaseous absorption •Vertical stratification

Effects of ATMS Spectral Response Function

ATMS Bias Obs (TDR) - GPS Simulated Ch 6 Ch 7
Ch 10
Ch 11 Ch 10
O-GPS (K) O-GPS (K)
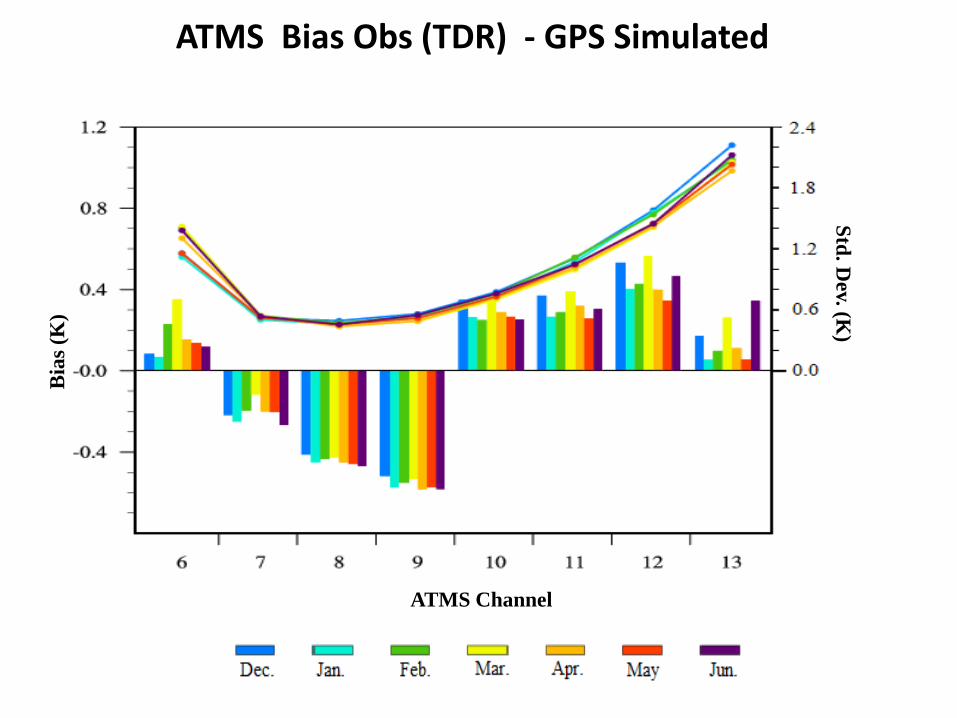
ATMS Bias Obs (TDR) - GPS Simulated B
ias (
K)
Std. Dev. (K
)
ATMS Channel
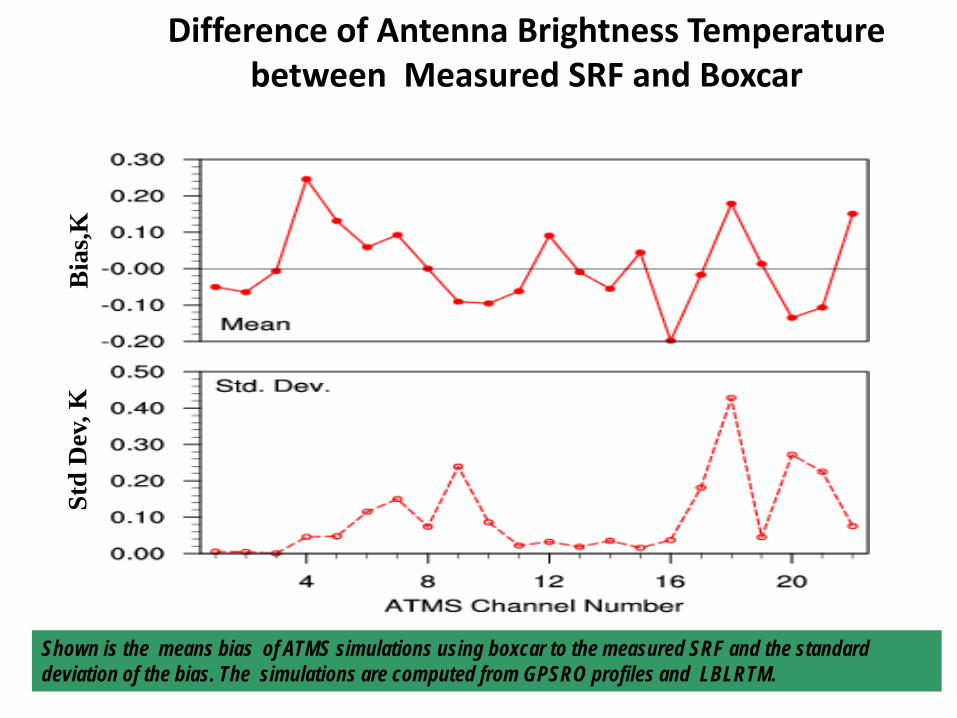
Difference of Antenna Brightness Temperature between Measured SRF and Boxcar
Shown is the means bias of ATMS simulations using boxcar to the measured SRF and the standard deviation of the bias. The simulations are computed from GPSRO profiles and LBLRTM.
Bia
s,K
Std
Dev
, K
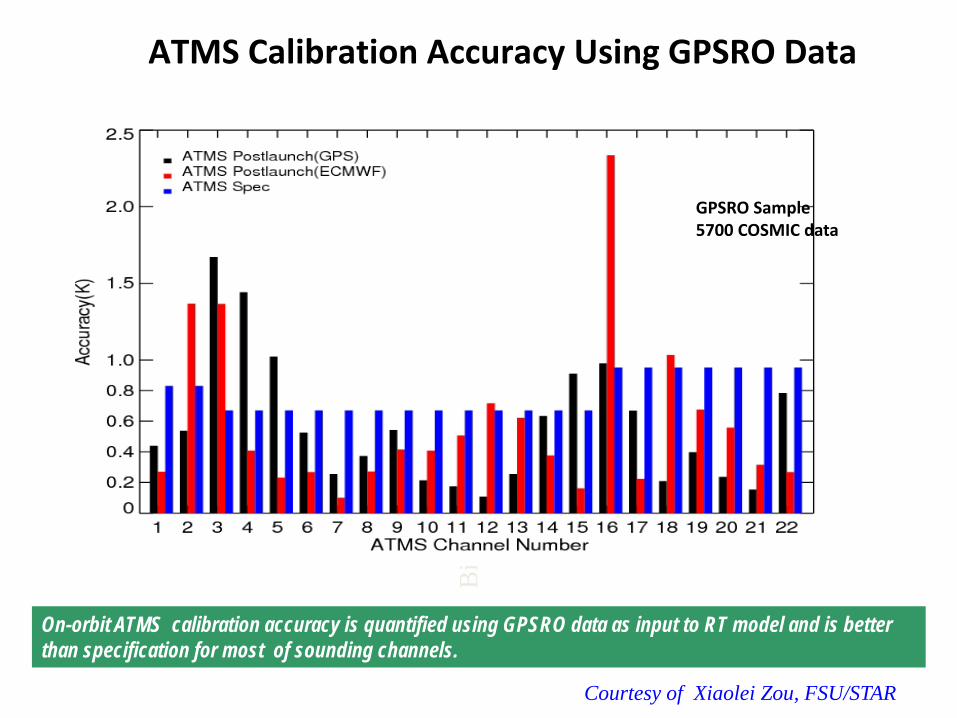
ATMS Calibration Accuracy Using GPSRO Data
Bia
s (K
)
GPSRO Sample 5700 COSMIC data
On-orbit ATMS calibration accuracy is quantified using GPSRO data as input to RT model and is better than specification for most of sounding channels.
Courtesy of Xiaolei Zou, FSU/STAR

Impacts of ATMS Spatial Re-sampling on NWP O-B
ATMS Field of View Size for the beam width of 2.2o – black line
ATMS Resample to the Field of View Size for the beam width of 3.3o- blue line

Scene-Temperature Dependence of Biases
Ch8
Ch9
Ch7 O
–B
(K)
O (K)
ATMS FOV
Remap FOV
• Dynamics range • Biases • Noises
Notice the differences between ATMS raw and remap data:

52
Channel Number
Bia
s (K
)
ST
D (K
)
ATMS SDR Global Biases and Standard Deviations
Within 60S-60N, clear-sky, ocean only, 20-27 December 2011
-0.8
-0.6
-0.4
-0.2
0
0.2
0.4
0.6
0.8
5 6 7 8 9 10 11 12 13 14 15
0
0.5
1
1.5
2
2.5
5 6 7 8 9 10 11 12 13 14 15
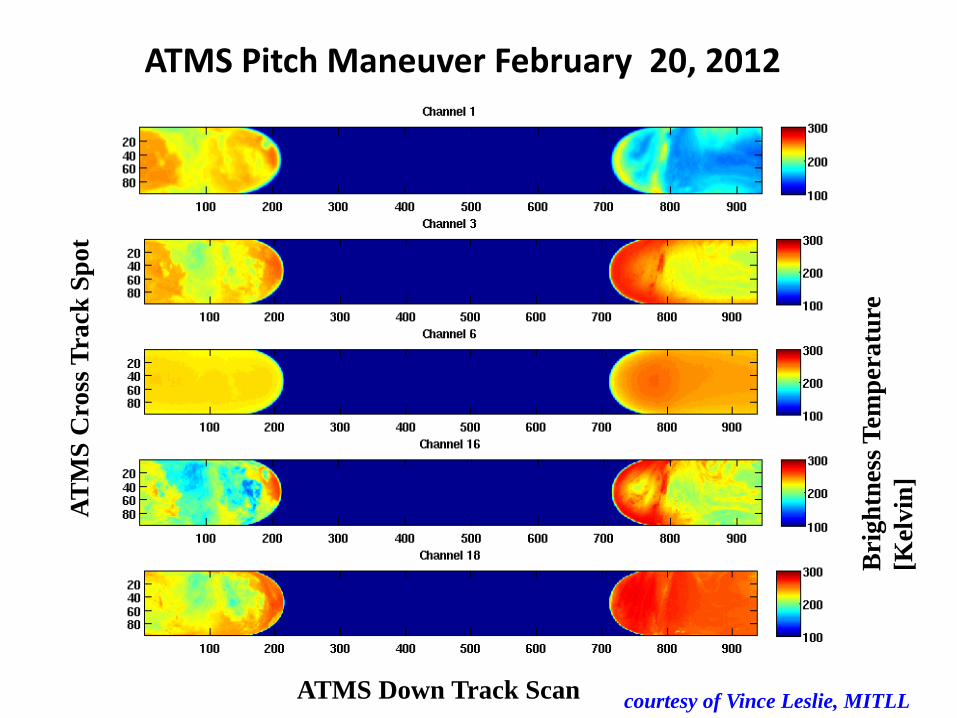
ATMS Pitch Maneuver February 20, 2012
ATMS Down Track Scan
ATM
S C
ross
Tra
ck S
pot
Bri
ghtn
ess T
empe
ratu
re
[Kel
vin]
courtesy of Vince Leslie, MITLL

Channel 1 Channel 2
Channel 3 Channel 4

ATMS Pitch Maneuver Antenna Temperature Model
Smile
Frown
A smile pattern QV- antenna temperature:
A frown pattern QH- antenna temperature:
β : the slope and scale parameters related to spacecraft emission and reflection. It is not well understood in the past. NPP pitch maneuver offers a unique opportunity for us to characterize the term for better characterizations of the earth view bias along the scanline.
20 1( ) sinqv vv hv c v v
a m m bT Tη η β β θ= + + +
20 1( ) cosqh hh vh c h h
a m m bT Tη η β β θ= + + +

ECMWF and UK Met Office provided clear evidence of increased NWP benefit of microwave measurements from two versus only one polar orbiting AMSU. 500 hPa geopotential showing one day increase in forecast skill over Europe at 5 days with two AMSU over none in 50 cases.
Impacts of AMSU on Global Medium Range Forecasting

Microwave Environmental Data Records
SDR/EDR POES/METOP AMSU-A/B; MHS
DMSP SSMIS
NPOESS ATMS/MIS
Radiances
Temp. profile
Moist. profile
Total precipitable water*
Hydr. profile
Precip rate*
Snow cover*
Snow water equivalent*
Sea ice *
Cloud water*
Ice water*
Land temp*
Land emis*
Soil moisture/Wetness Index
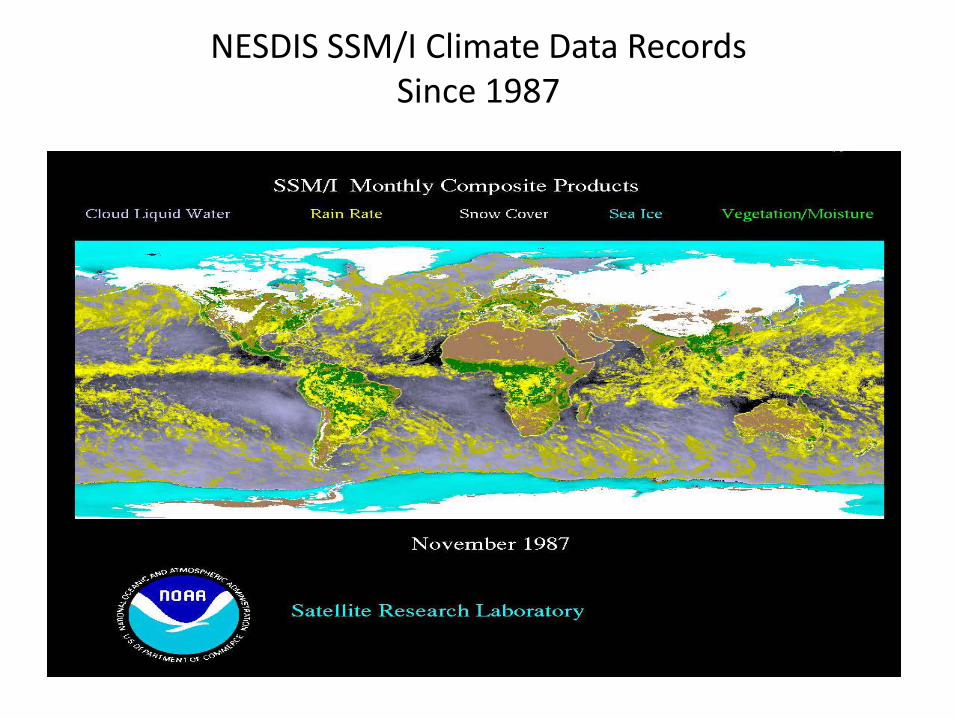
NESDIS SSM/I Climate Data Records Since 1987

Microwave Products from NOAA Operational Sensor: AMSU
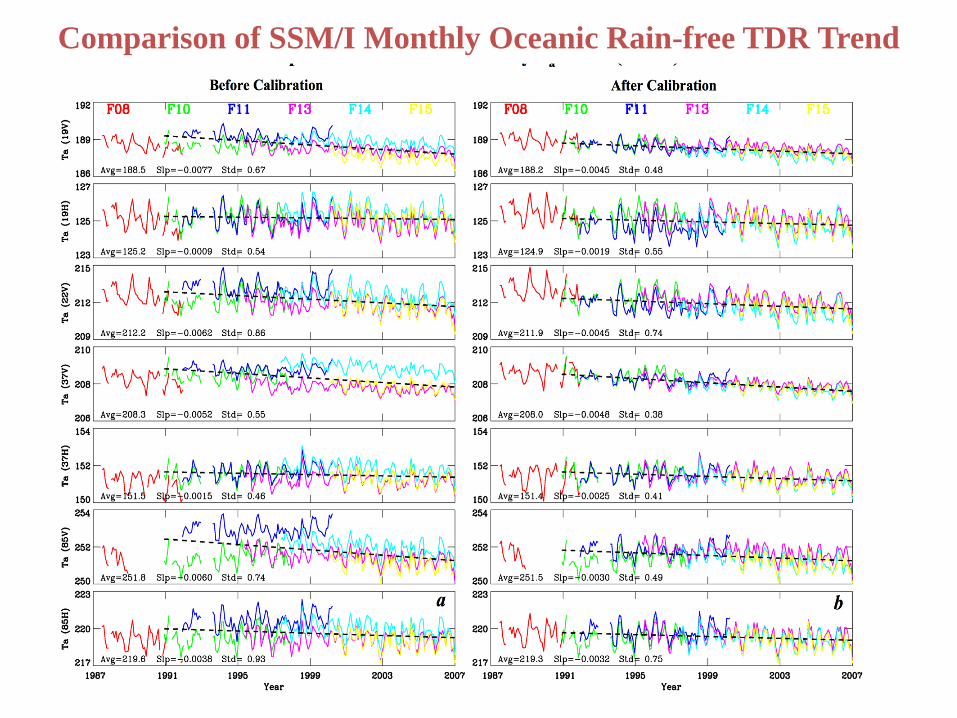
Comparison of SSM/I Monthly Oceanic Rain-free TDR Trend

Monthly-Mean TPW Bias between Overlapped Sensors Before Inter-Calibration
Large TPW biases between F10-F11 and F10-F13 are obvious. Since TPW = 232.89-.1486*TV19-.3695*TV37-(1.8291-.006193*TV22)*TV22, (Alishouse et al., 1991), any radiance biases in lower SSM/I frequencies will be directly translated into TPW biases.

Monthly TPW Bias between Overlapped Sensors After Inter-Calibration
The inter-sensor TPW biases become much smaller and consistent between different sensors. The averaged absolute bias after calibration is reduced by 75% and 21% over global ocean and over tropical ocean, respectively .

Future Advances in Microwave Technology in Space
1. Probe higher atmosphere by adding more sounding channels
2. Polarization or polarimetry for microwave imager
3. Combination of sounder and imager in a single scanning mode
4. Low instrument noise and high instrument stability
5. Longevity (5-10 years) beyond the mission life span

Technology Barriers in Microwave Instrument Developments
1. Course spatial resolutions from uses of solid aperture antenna
2. Slow progress in using low noise amplifier for lower frequencies
3. Difficult uses of microwave imager data in NWP systems through direct radiance assimilation

Summary
1. Microwave thermal radiation from the Earth is of much smaller magnitude, compared to VIS/IR
2. Satellite Microwave Observations are critical for atmospheric sounding and imaging under all weather conditions
3. Microwave Sensor Calibration converts analog signal to physical quantity using both linear and nonlinear systems
4. Climate Data Record can be obtained from satellites through cross sensor calibrations that remove inter-sensor biases
5. Microwave Sensing Principle is based on imaging clouds over ocean with lower emissivity, and sounding atmosphere from O2 and H2O absorption lines


![Quantum Microwave Radiometry with a Superconducting Qubit · 2019-09-30 · A classical microwave radiometer [11] typically consists of a radio receiver followed by a square-law detector](https://img.dokumen.tips/doc/110x75/5f35d9f5da760769e114f3fc/quantum-microwave-radiometry-with-a-superconducting-qubit-2019-09-30-a-classical.jpg)