Embed Size (px)
Citation preview
CONVERGENCE OR CAPABILITIES? EXPLAINING FIRM HETEROGENEITY IN LEARNING BY EXPORTING
ROBERT SALOMON Stern School of Business
New York University 44 W. 4th St., KMC 7-59
New York, NY 10012 Phone: 212-998-0223 Fax: 212-995-4234
E-mail: [email protected]
BYUNGCHAE JIN Robert H. Smith School of Business
University of Maryland Department of Management and Organization
1308 Van Munching Hall College Park, MD 20742
Tel: 301-263-4884 E-mail: [email protected]
Version: January 11, 2006

CONVERGENCE OR CAPABILITIES?
EXPLAINING FIRM HETEROGENEITY IN LEARNING BY EXPORTING
Abstract An interesting theoretical debate arises with respect to learning-by-exporting when considering macro-economic convergence and firm capability arguments side-by-side. Convergence theory intimates that technologically lagging firms stand to benefit most from exporting because exposure to the advanced technological knowledge in foreign markets allows them to make up for the disparity in capabilities and close the gap with their technologically endowed counterparts. By contrast, the capabilities literature posits that technologically superior firms stand to benefit most from trade since they are better equipped to translate knowledge inputs derived from foreign markets into innovative outcomes. In this paper, we focus on the effect of exporting on innovation and empirically explore whether technologically leading or lagging firms benefit disproportionately. Using a sample of Spanish manufacturing firms from 1990-1997, we empirically investigate how exporting differentially influences the patent output of technologically leading and lagging firms. We find that exporting is associated with the ex post increase in innovative productivity for both technologically leading and lagging firms. Moreover, the results provide support for the firm capability claim. Notably, technologically leading firms apply for more patents subsequent to exporting than technologically lagging firms. Keywords: learning by exporting; knowledge transfer; technological innovation; convergence; capabilities; absorptive capacity
1

INTRODUCTION
Theoretical work in international business and international trade proposes that open
economies benefit nations through enhanced growth. Empirical results corroborate that
conjecture, suggesting that trade openness leads to income growth. One mechanism that
acts as an engine to such outcomes is the learning that occurs as a result of engaging in
trade. That is, the exchange of tangible goods facilitates the exchange of intangible
knowledge across borders, and the learning that results helps increase productivity and
fosters income growth.
Although the macro-economic literature suggests that countries can benefit from an
open economy, what remains less clear is whether, and how, trade improves firm
performance. Little research has been directed at the potential for firm-level learning from
exporting. Moreover, to the extent that such firm-level learning exists, we understand little
about the conditions that moderate these effects. For example, the macro-economic
convergence literature, on the one hand, suggests that we might plausibly expect
technologically lagging firms benefit most from international trade. On the other hand, firm
capability arguments suggest that technologically superior firms, replete with some form of
technological capabilities, stand to benefit most from exporting. An interesting debate
arises when we consider these two perspectives side-by-side.
The purpose of this study therefore is to examine learning from exporting arguments
at the micro- level by exploring whether, and how, firm heterogeneity moderates the
relationship between exporting and innovation. In particular, we explore whether
technologically lagging firms learn more from exporting (as convergence arguments would
suggest) or whether technologically leading firms learn more from exporting (as firm
2
capability arguments suggest). Our research question of interest then becomes: Do
technologically leading or lagging firms learn more from exporting?
In order to test these arguments, we examine the export behavior and ex post
innovative outcomes of a sample of 2137 Spanish manufacturing firms from 17 distinct
industries over the 1990 to 1997 period. In order to explore the moderating effects of firm
heterogeneity in technological capabilities, we discriminate technologically leading firms
from technological lagging firms based upon relative expenditures in R&D. We define the
latter as firms that lag the technological frontier. We define the former as firms that are at,
or near, the technological frontier. We regress firm-level patent application counts (our
dependent variable) on exporting across both sets of firms. We find that exporting is
associated with the ex post increases in innovative productivity for firms in both the
technological leader and technological laggard conditions; however, technological leaders
apply for more patents subsequent to exporting than technological laggards. We interpret
this finding as evidence that technologically leading firms learn from exporting at a faster
rate than technologically lagging firms. The results therefore support for the firm capability
claim.
In the next section, we briefly review the convergence and firm capability literatures
in the context of learning-by-exporting. Based on this review, we generate two competing
hypotheses. We subsequently describe our method and the data we use to test such effects.
The following section presents results. The final section concludes.
THEORY
3

Research in macro economics has long emphasized the potential gains from trade.
Authors in this stream have highlighted the role that trade, and open economies, can play in
the exchange of knowledge across borders. Grossman and Helpman (1991b) propose a
formal model in which intangible ideas spillover through the exchange of tangible
commodities. The assumption is that each country possesses a different stock of knowledge,
and interaction through trade encourages this knowledge to spread among trading partners.
The logic runs as follows: Trade opens a country to a distinct body of knowledge possessed
by its trading partners. As that knowledge filters back to the domestic country and is
incorporated into the domestic production function through technology transfer, the home
country experiences higher growth. This phenomenon has been referred to as “learning-by-
exporting” (for a review see Grossman and Helpman, 1991a; 1991b).
Researchers assert that open economies foster the speed of knowledge transfer and as
such, should lead technological and income gaps between trading partners to shrink
(Grossman and Helpman, 1994). However, there has been some debate in the literature as
to whether developing or developed nations benefit more from trade. Feeney (1999) argues
that both developed and developing economies stand to benefit equally from trade.
Likewise, Ben-David and Loewy (1998) assert that free trade can reduce the income gap
between developing and developed countries as well as among developed countries. By
contrast, Grossman and Helpman (1991a) argue that trade openness allows developing
countries access to the advanced technological knowledge that they lack, and as such, to
grow more rapidly. The greater the disparities between developing and developed countries,
the more developing countries stand to benefit.
Following these fundamental insights, scholars have attempted to verify such
4
phenomena empirically, and the focus has been predominantly at the macro-economy level.
The research question of interest has centered on whether countries can benefit from free
trade (e.g., Edwards, 1993; Frankel and Romer, 1999). Although the results have been
contentious, there seems to be some evidence that trade leads to income growth and
convergence, and that developing countries stand to benefit from trade openness (for a
review see Edwards, 1993; Slaughter, 1997). Research highlights the benefits of export-led
growth policies for developing nations such as South Korea and Chile, which benefited
from advanced knowledge in developed countries (see Edwards, 1993; Guillén, 2001).
At the more micro level, some scholars highlight inter-sectoral heterogeneity in
learning-by-exporting outcomes. For example, Salomon and Jin (2006) find that industry
heterogeneity moderates the relationship between exporting and a firm’s innovative
outcomes. They find variance in learning-by-exporting outcomes across industries in Spain.
Aw and Hwang (1995) likewise find the relationship between exporting and firm
productivity in Taiwan to be highly dependent on product-specific environments. In a
follow-up study, Aw, Chung, and Roberts (2000) find that productivity improved for
Taiwanese firms in the textile and apparel industries after commencing exporting, but did
not improve for firms in plastics, electronics, or transportation equipment industries.
Although scholars have highlighted the potential for learning from exporting at the
nation and industry levels, the empirical literature has just begun to examine these
relationships at the firm level (e.g., MacGarvie, 2006; Salomon and Shaver, 2005a).
Researchers have long recognized the importance of studying export behavior at the firm
level; however, this stream has not received nearly the attention devoted to macro- level
issues for two reasons. First, many research questions are predominantly concerned with
5

macro-economic factors – especially questions motivated by economic and legislative
policy makers. Second, more practically, the data necessary to examine micro- level trade
phenomena have been difficult to obtain.
In order to examine such effects at the firm level, scholars generally look to see if
total factor productivity increases after firms become exporters. Although some authors fail
to find support for such productivity increases (e.g., Bernard and Jensen, 1999; Clerides,
Lach, and Tybout, 1998; Delgado, Fariñas, and Ruano, 2002), others do find evidence
consistent with learning (e.g., Aw et al., 2000; Ozler and Yilmaz, 2001; Blalock and Gertler,
2004). More recently, research suggests that the mixed empirical findings might be due to
using productivity as the dependent variable (e.g., MacGarvie 2006; Salomon and Shaver,
2005a). They argue that in order to evaluate whether firms have learned, a better measure
would directly assess that learning outcome. Because a variety of factors stand to influence
the net effect of exporting on productivity, productivity effects can be difficult to tease out.
Therefore, firms’ innovation productivity, rather than total factor productivity, may better
capture the learning-by-exporting phenomenon. Using innovative productivity as the
dependent variable, Salomon and Shaver (2005a) find a consistent increase in innovation
for firms after they become exporters. Specifically, exporters tend to introduce more new
product innovations very quickly after market entry and file for significantly more patents
several years after entry into export markets. Likewise, MacGarvie (2006) demonstrates
that exporting firms are more likely to cite foreign patents than their domestic counterparts
after commencing exporting.
Hypotheses
6

As with the firm-level studies mentioned above, the perspective that we adopt in
this study is that firms, not nations, engage in trade. Although goods flow between nations,
it is generally firms that make export decisions, and firm outcomes that are impacted by
those decisions. It is therefore important to consider learning-by-exporting outcomes at the
firm level. Moreover, building upon the Salomon and Shaver (2005a) findings, we focus on
the impact of exporting on firm innovation in order to accurately gauge learning outcomes.
Although the empirical literature has begun to weigh in on learning-by-exporting
issues at the firm level, we understand less than we should about the heterogeneity that
exists in these learning benefits across firms. Firms, like countries or industries, are not
homogeneous in terms of their technological capabilities (Barney, 1991; Cohen and Levinth
al, 1990; Henderson and Cockburn, 1996; Peteraf, 1993; Wernerfelt, 1984; 1995). We
therefore expect to find variance in learning outcomes across firms based on their extant
capabilities. However, the literature does not clearly suggest whether we should expect
technologically inferior, or technologically superior, firms to benefit more from exporting.
In fact, there is literature to support both contradictory positions.
Prevailing logic suggests that exporting firms, through interaction with foreign
agents, are exposed to knowledge inputs not available to firms whose operations are
confined to the domestic market. Competing in a foreign market allows exporting firms to
amass market and technological information. For instance, exporters benefit from the
technological expertise of their buyers (Clerides et al., 1998). Moreover, exporters receive
valuable information about consumer product preferences and competing products (Vernon,
1966; 1979). In addition to the information gathered from customers, exporters confront
competitors in the host country that might otherwise escape their purview, and firms may
7

benefit from competitive spillovers. All these suggest that as information collected in the
foreign market (whatever the source) filters back to the parent firm, it should incorporate
the knowledge into its production function. This is likely to manifest as increased
innovation (Salomon and Shaver, 2005a).
With respect to the differential benefits that accrue to exporters, the macro-economic
convergence literature suggests that exporting stands to benefit the disadvantaged. Results
from various macro- level studies indicate that trade openness disproportionately benefits
developing countries (for a review see Edwards, 1993; Slaughter, 1997; Salomon and Jin,
2006). This is because interaction with export intermediaries, customers, and other agents
provides firms from developing economies a greater opportunity to benefit from the
advanced knowledge that they lack, and that does not exist in the home country. Moreover,
the greater the disparity between a country and its trading partner, the more that country
stands to gain (Grossman and Helpman, 1991a).
The corollary at the firm level would imply that technologically disadvantaged firms
benefit more from exporting. Because exporting provides technologically lagging firms
exposure to advanced technological knowledge in their destination markets, these firms
gain a window into state-of-the-art technologies, and exporting affords them the
opportunity to benefit from technological insights that thereby help them innovate. By
contrast, since technological leaders are already at the technological frontier, they should
benefit less from exporting because they will have little to learn. Based on convergence
arguments then, the expectation is that the more a firm lags the technological frontier, the
more it stands to benefit from exporting to improve its capabilities. That is, ex post
innovation rates should be greater for technologically lagging exporters vis-à-vis their
8

technologically leading counterparts. Stated formally,
Hypothesis 1a: All else equal, technologically lagging firms will learn more from exporting than technologically leading firms.
An interesting theoretical debate arises however when considering convergence and
capabilities arguments side-by-side. Although convergence arguments would suggest that
technologically lagging firms stand to benefit most from international trade, the capabilities
perspective derives an alternative conclusion.
Strategy scholars have long recognized that firm-specific capabilities are critical to a
firm’s success (Barney, 1991; Peteraf, 1993; Wernerfelt, 1984; 1995). Consistent with this
underlying conviction, empirical research has shown that distinctive technological,
marketing, and managerial capabilities can be value creating for firms (see Mahoney and
Pandian, 1992 for a review). Moreover, when it comes to innovative performance,
technological capabilities play a central role. For example, in an empirical examination of
the pharmaceutical industry, Henderson and Cockburn (1996) attributed a large proportion
of the variance in innovative productivity to firm fixed effects. They surmised that
innovative productivity was driven by firm heterogeneity in technological capabilities.
Cohen and Levinthal (1990) argue for a firm-specific technological capability they
describe as “absorptive capacity”. This construct captures “the ability of a firm to recognize
the value of new external information, assimilate it, and apply it to commercial ends”
(Cohen and Levinthal, 1990: 128). Absorptive capacity therefore confers upon a firm the
ability to recognize the usefulness of external knowledge and use that knowledge to
innovative ends. Moreover, according to Cohen and Levinthal (1990), absorptive capacity
is a by-product of firm investments in R&D. Similarly, Henderson and Cockburn (1994)
9
propose a construct referred to as “architectural competence” which refers to a firm’s
ability to assimilate knowledge from outside firm boundaries. They find that architectural
competence increases innovative productivity.
So while exporting increases the breadth, and potentially the flow, of knowledge
inputs not available to firms in the domestic market, the capabilities literature would
suggest that firms with existing technological capabilities are best suited to use those
knowledge inputs to innovative ends. This is because technologically leading firms are
better able to acquire and use information present in the external environment. Without
such capabilities, a firm may lack the ability to assimilate complex external knowledge and
use it to achieve innovation. Although the access to knowledge inputs through exporting
may not differ from technologically leading firms, firms lacking technological capabilities
may not be able to effectively use the information available from sources in the host
environment. Thus, without technological capabilities, the requisite knowledge to achieve
innovation may not spillover effectively to the focal firm. In fact, Penner-Hahn and Shaver
(2005) find that firms that invested abroad innovate more in the years following those
investments in the presence of, versus in the absence of, absorptive capacity.
The firm capabilities and macro-economic convergence literatures would therefore
diverge with respect to which firms stand to benefit most from exporting. While
convergence arguments suggest that we might plausibly expect technologically lagging
firms to benefit more from exporting, the firm capabilities literature draws the converse
conclusion. Because firm-level technological capabilities affect the amount of external
information that firms are able to assimilate, technological capabilities will positively
moderate the relationship between exporting and innovation. Based on capabilities
10

arguments then, the expectation is that the closer a firm is to the technological frontier, the
greater its technological capabilities, and the more it stands to benefit from exporting. That
is, ex post innovation rates should be greater for technologically leading exporters vis-à-vis
their technologically lagging counterparts. Stated formally,
Hypothesis 1b: All else equal, technologically leading firms will learn more from exporting than technologically lagging firms.
DATA AND METHODS
Sample
The data we use in this study are from a yearly survey conducted by the Fundación
Empresa Pública with the support of the Spanish Ministry of Industry. The Fundación
surveys a sample of Spanish manufacturing firms to get a representative picture of the
country’s manufacturing sector. Although the Fundación first administered the survey in
1990 and continues to do so, we were able to get access to the data from 1990 through 1997.
The data cover the entire population of Spanish manufacturing firms with 200 or more
employees and include a random sample of 5% of the population of firms with at least 10,
but fewer than 200, employees. The initial sample included information on 2188 firms from
18 industries; however, in order to remain consistent with additional data that we collected,
we removed all firms from the sample that were classified into the “Miscellaneous
Manufacturing” industry. We are therefore left with an initial set of 2137 firms from 17
distinct industries. We present the industry breakdown for the initial sample year in Table 1.
*** Insert Table 1 about here ***
11
Although our initial sample was comprised of 2137 firms, when a firm drops from
the sample in any given year, another of similar size, from the same industry, replaces it.
This results in a base sample of 2957 firms. From the resultant 2957 firms we removed all
11 that reported engaging in foreign direct investment. For this set of firms there exist other,
more direct, mechanisms to facilitate information exchange from outside the domestic
market, and we do not want to spuriously attribute results from learning from foreign direct
investment.1 In addition, 3828 observations were missing data. Moreover, given an
empirical approach in which we incorporate dynamics (we describe the method in detail
below); we sacrifice an additional 7017 observations. Given this restriction, our usable
sample reduces to 6544 firm-year observations from 1755 unique firms.
In order to complement the Fundación data, and to identify whether a firm is a
technological laggard (leader), we collected R&D expenditure and gross production data
from the OECD. The OECD publishes yearly R&D figures in the ANBERD database.
ANBERD contains information on industry level R&D expenditures from 27 countries –
the 30 OECD member countries, excluding Austria, Luxembourg, and Switzerland – from
1987-1999. The OECD also publishes industry-level gross production data. Gross
production represents the market value of finished goods aggregated up to the industry-
level. The data are available for 22 countries (excluding Czech Republic, Hungary, Ireland,
Luxembourg, Poland, Slovak Republic, Switzerland, and Turkey) from 1990-1997. We
1 Although Spanish firms in some sectors aggressively invested abroad in the 1990’s, most of this investment was in the service sector (see Guillén, 2001; 2005). Spanish firms in the banking (notably BBV and Banco Santander), travel (e.g., Grupo Sol Melia), and telecommunications (Telefonica) industries were rather aggressive in investing abroad, especially in Latin America. However, Spanish firms are not nearly as strong globally in the manufacturing sector as in the service sector (Guillén, 2001; 2005). Because these data solely focus on manufacturing firms, much of this investment is not captured in our data. For that reason, and because these data come from reliable government sources, we believe the level of FDI represented in these data are accurate – although seemingly low; and when we include firms with foreign ownership in the analysis, we find results that are consistent with those presented.
12

describe how we use these data to generate our measures in the section that follows.
Dependent Variable
Since we attempt to measure the existence and the extent of learning-by-exporting,
our dependent variable is innovative productivity. We proxy for innovative productivity
using a count of patent applications. The survey administered by the Fundación Empresa
Pública collects information on the number of patents applied for by the focal firm in a
given year. Those seeking patent protection must file an application with the appropriate
agency that governs patenting in the country or region in which it seeks protection. The
European Patent Office (EPO), established as a result of the European Patent Convention
(EPC) of Munich in October 1973, currently oversees and governs patent applications and
grants in 19 European countries (EPO, 2000). Spain formally became a member of the EPC
and aligned its national patent laws with prevailing European law on March 20, 1986
(Ulloa and Salas, 1993). However, it still maintains a national patent office. Thus, any firm
choosing to patent its technology in Spain has two available options. The firm may submit
its application to the EPO and designate Spain as one of the countries in which it seeks
protection. Alternatively, it may apply directly to the Spanish Industrial Property Registry
(SIPR). Both offices use identical criteria for granting patents and both methods offer the
same protection to patent holders in Spain (Ulloa and Salas, 1993). While it costs more to
file with the EPO and the grant process takes longer (an average of 18 months for the EPO
versus 12 with the SIPR), if applying for protection in more than one EPC country,
applying through the EPO saves on paperwork and administrative costs (EPO, 2000). The
variable that we label PATENT APPLICATIONS captures the number of patent
13
applications filed for protection in Spain, whether via the Spanish Industrial Property
Registry or the EPO.
Patent data and patent counts have been used extensively in industrial economics
research on technology and innovation as a measure of innovative productivity (e.g.,
Basberg, 1982, 1987; Comanor and Scherer, 1969; Henderson and Cockburn, 1994, 1996;
Scherer, 1965). Authors have argued that patents accurately capture the intellectual property
of the focal firm and therefore serve as a direct and observable outcome of the innovation
process (e.g., Archibugi and Pianta, 1996). Moreover, researchers have demonstrated how
patent counts empirically capture an underlying, latent ‘innovation’ construct. For example,
Acs and Audretsch (1989), using both patent and product innovation counts as dependent
variables, find a significant correspondence between results across many industries.
Likewise, Hagedoorn and Cloodt (2003) demonstrate congruence among various measures
of innovative performance such as patent counts, patent citations, and new product
introductions. Taken together, these results indicate that patent counts can serve as a valid
proxy for innovative productivity. Further, this manifestation of innovative productivity is
consistent with measures of learning employed in the broader international business and
innovation literatures (e.g., Cohen and Levin, 1989; Salomon and Shaver, 2005a).
Although patent counts have been shown to be valid indicators of innovative output,
they are not without drawbacks. In particular, the propensity to patent is not constant across
firms or industries (Cohen and Levin, 1989; Griliches, 1990). It could therefore be argued
that because patents do not mean the same thing for each firm, they cannot be meaningfully
compared across firms. However, as Griliches (1990) points out, with the proper controls,
patents can still be used effectively in cross-firm, cross-industry studies. Because our data
14
include a panel of firm-year observations from the Spanish economy at large, we
incorporate lagged values of the dependent variable to control for firm heterogeneity in
patent behavior. We can therefore be more confident that our results capture the differential
learning benefits across firms – and not simply patenting heterogeneity across firms or
industries.
Independent Variables
Grossman and Helpman (1991b: 518) argue that exporting “tangible commodities
facilitates the exchange of intangible ideas.” As such, a measure of whether a firm has
access to those ideas lies in whether or not it participates in export markets. Export status
(EXPORT) was collected in the survey. This measure captures whether or not the focal firm
sold to foreign markets in a given year. The variable EXPORT takes the value 1 if the firm
exported in a given period, zero otherwise. Because knowledge takes time to filter back to
the focal firm, the benefit of exporting may not be realized until future periods. For that
reason, we lag the export status variable. Based on the length of our panel and prior
research, we use lags of one, two, and three years (Bernard and Jensen, 1999; Clerides et al.,
1998; Salomon and Shaver, 2005a).
Research suggests that relative R&D expenditures can proxy for a firm’s
technological capabilities, and its position in technological space (Caves, 1996; Chung and
Alcácer, 2002; Cohen and Levinthal, 1990). R&D expenditures are a correlate of
knowledge stock; and the technological capabilities of individual firms in Spain vis-à-vis
the technological frontier can therefore be assessed by comparing them to some external
metric on the basis of their R&D investments (Chung and Alcácer, 2002; Porter, 1990). In
15

order to identify whether a firm is a technological laggard (leader), we compare firms in
these data to comparable others (from the same industry) in the OECD on the basis of their
R&D expenditures.
In order to make these comparisons, we rely on industry-level R&D expenditure and
production data published by the OECD. The R&D expenditure data comes from the
ANBERD Database on Research and Development Expenditures. Expenditures are
expressed in millions of purchasing power parity equivalent U.S. dollars. We complement
the ANBERD data with OECD data on gross production by industry.2 Gross production
data were expressed in the local country’s national currency; however, we were able to
transform them into purchasing power parity U.S. dollars using OECD published
purchasing power parity exchange rates. Both R&D expenditure and industry production
data are reported at the four-digit ISIC industry level. Because the Fundación data are at the
three-digit ISIC level, we recoded the original OECD data in accordance with the ISIC
revision 3 (OECD, 2001) to match the 17 three-digit ISIC industries in our data.
We then develop two indices to discriminate technological leaders from
technological laggards. The first measures the focal firm’s relative R&D intensity compared
to the average industry R&D expenditures in 21 OECD countries (other than Spain). This
gauges the firm’s relative technological standing with respect to the average of other firms
within the same industry from developed (OECD) countries. As such, it captures the firm’s
proximity to the global technological frontier and can be used to identify firms as either
technological leaders or laggards (Salomon and Jin, 2006).
We calculate this Research and Development Index (RDI) as follows: We begin by
2 Because gross production captures the market value of finished goods within a given industry, it can be compared to sales at the firm level. It can be viewed as the aggregated, macro-equivalent of firm sales.
16

scaling the R&D expenditures of firm i in industry j at time t by its sales at time t in order
to eliminate size effects. We similarly scale the R&D expenditure in industry j from country
k at time t by its gross production (GP) in industry j at time t. We average this R&D/GP
variable across all countries for which we have data (other than Spain) at time t. We
subsequently subtract the average R&D expenditure (scaled by GP) in industry j from the
R&D expenditures of firm i from industry j at time t.3 This produces a time-varying, firm-
specific index comparing the firms in these data to the average R&D expenditures from its
corresponding industry in developed countries. Increasing values of the index indicate that
a firm is a relative technological leader whereas decreasing values indicate that a firm is a
relative technological laggard. This measure is consistent with prior empirical research in
international business (e.g., Benvignati, 1990; Chung and Alcácer, 2002; Kravis and Lipsey
1992; Salomon and Jin, 2006). Equation 1 expresses this measure formally:
nGPRDSalesRDRDI
n
kjktjktijtijt
OECDijt
1)/(/1
×⎥⎦
⎤⎢⎣
⎡−= ∑
=
(1),
where,
OECDijtRDI : R&D Index for firm i from industry j in year t
ijtRD : R&D expenditures of firm i from industry j in year t
ijtSales : Total sales of firm i from industry j in year t
jktRD : R&D expenditures in industry j from country k in year t
jktGP : Gross production in industry j from country k in year t n : Total number of OECD countries (21 nations, not including Spain).
Although the RDIOECD measure proxies for the technological capabilities of the focal
firm vis-à-vis the global technological frontier (i.e., versus comparable firms in developed,
3 We alternatively scaled the R&D expenditures by GDP and population. Using GDP or population instead of gross production as the scaling factor yielded equivalent results.
17

OECD economies), it may inhere some bias to the extent that Spain is comparatively
advantaged in given industries. We therefore complement our first RDI measure with a
second that compares firms in these data to their industry average (as reported in
ANBERD) within Spain. This captures the firm’s technological standing within Spain.
We calculate the second index similar to the first; however, instead of subtracting the
OECD average R&D expenditure from industry j at time t, we now subtract Spain’s
average R&D expenditure (scaled by GP) from industry j at time t from the R&D
expenditure of firm i from industry j at time t. Again, increasing values of the index
indicate that a firm is a relative technological leader vis-à-vis its industry whereas
decreasing values indicate that a firm is a technological laggard. Equation 2 expresses this
measure formally:
Spainjt
Spainjtijtijt
Spainijt GPRDSalesRDRDI // −= (2).
Calculating two distinct RDI measures provides several benefits for our purposes.
Assessing both mitigates some of the deficiencies inherent in selecting one measure to the
exclusion of the other. Moreover, because each variable might pick up different aspects of
technological capabilities and technological leadership, we can use this variation in
expected outcome to help inform our interpretation of the results. Although we expect the
results to be consistent across measures, corroborating results add validity to our findings.
We are interested in the moderating effects of RDI on the relationship between
exporting and innovation. There are two general means to assess such moderation: using
multiplicative interaction terms; or creating sub-sample splits based on the median or mean
of the variable of interest (for a review see Jaccard, Turrisi, and Wan, 1990). In this study
we employ the latter technique. We do so because interpreting interaction terms in non-
18

linear regression formats is complicated by the underlying distribution of the dependent
variable (in this case Poisson). We therefore split the sample into two groups using the
industry-specific median of RDI. We consider firms above its industry-specific median
relative technological leaders, and those below its industry-specific median relative
technological laggards. We assess moderating effects by comparing the marginal effects of
the coefficients across the two groups.4
***Insert Table 2 about here***
Table 2 presents the medians and means of RDI across all industries in this study.
The medians and means of RDISpain are relatively smaller than those of RDIOECD. Taken
together, this indicates that the firms in Fundación data are marginally technologically
superior, on average, to those in Spain, but technologically inferior to comparable firms in
other OECD countries. That is, the firms in these data are technologically well-endowed
domestic firms, but not at the absolute global technological frontier.
Control Variables
Researchers have long considered the influence of firm size on innovative
productivity (e.g., Schumpeter, 1942). Because exporters are generally larger than non-
exporters, a reported effect of exports on innovation may spuriously capture the influence
of size on innovation. We therefore control for firm size in order to diminish the potential
for a size effect in these data. We define the variable SIZE as the natural log of total
employees within the focal firm in a given year. 4 Similar results maintained when we conducted the sub-sample splits at the mean, at the quartiles, and at zero.
19

Scholars have similarly explored the influence of R&D inputs on innovative
productivity (for a review see Cohen and Levin, 1989). We control for the effect of such
R&D investments by including an R&D intensity measure. R&D INTENSITY is defined as
R&D expenditures divided by total sales expressed as a percentage.
Theories of firm specific advantage suggest a link between a firm’s intangible
capabilities and its international business activity such as exporting (see Caves, 1996;
Salomon and Shaver, 2005b). Researchers typically proxy for such firm level advantages
using R&D and advertising intensities (see e.g., Caves, 1996; Morck and Yeung, 1991,
1992). We therefore include ADVERTISING INTENSITY, in addition to R&D intensity, as
a measure of a firm’s marketing capabilities. The intuition is that firms that dedicate a
greater proportion of their sales to advertising likely have a greater consumer orientation,
and as such, a greater incentive to innovate. We define ADVERTISING INTENSITY as
advertising expenditures divided by sales expressed as a percentage.
Statistical Method
When selecting the appropriate multivariate method, we must take into account the
nature of the dependent variable. Our dependent variable is a count measure that can only
take non-negative integer values. Moreover, many of the observations are bunched close to
zero. Authors suggest a Poisson regression model to deal with dependent count variables of
this sort (Greene, 2003; Kennedy, 1998; Maddala, 1993). Myriad studies of innovation rely
on this non-linear estimation technique (e.g., Graves and Langowitz, 1993; Hausman, Hall,
and Griliches, 1984). We therefore begin with a Poisson framework. Equation (2) presents
the probability density function of the Poisson distribution with parameter λi:
20

!)|(
i
yi
ii ye
xyfii λλ−
= , K,2,1,0=iy (2).
This equation represents the probability that yi will occur given a set of explanatory
variables where yi is a scalar of the number of occurrences of a certain event, xi is a vector
of explanatory variables, and λi is a parameter of the function. Exogenous variables can be
incorporated into the model by making lambda a function of the covariates. This is
expressed formally in the following equation:
)exp( 2,1 itptiit Wx ββλ += − , 3,2,1=p (3),
where λit represents the expected number of innovations for firm i at time t, xi,t-p represents
the exporting variable of interest for firm i at time t-p, and Wit is a vector of control
variables. The betas are parameter estimates.
The Poisson regression is quite sensitive to its distributional assumptions. For
instance, both the mean and variance are assumed to be equal to lambda. Should the mean
and variance for the observed sample not equal lambda, the likelihood function would be
misspecified leading standard errors to be underestimated and to erroneous results.5 The
negative binomial regression allows for relaxation of the Poisson assumption that the mean
and variance equal lambda by introducing an individual unobserved disturbance to the
model (e.g., Hausman et al., 1984; Henderson and Cockburn, 1996). Introducing the
unobserved disturbance term to the Poisson model, equation (3) becomes:
)exp( 2,1 ititptiit Wx εββλ ++= − , 3,2,1=p (4),
where εit is the unobserved error term. In this model, εit is assumed to have a standard
gamma distribution.
5 When we tested for overdispersion using Cameron and Trivedi’s (1986) diagnostic, we found evidence of such. Therefore, we prefer the negative binomial model.
21
Given the panel structure of our data with several observations per firm, the
possibility arises that εit will not be independent across time within firms. Otherwise stated,
a systematic component may be embedded in the error leading to serial correlation of
residuals across observations within firms, and spurious regression results. Hausman et al.
(1984) introduce a negative binomial model with fixed effects to control for serial
correlation of this sort; however, there has been considerable debate regarding whether this
method effectively controls for individual effects (Allison and Waterman, 2002).
We therefore turn to a dynamic longitudinal model to deal with the potential for such
serial correlation. We incorporate an INAR autoregressive process that includes lagged
values of the dependent variable as regressors (see Alzaid and Al-Osh, 1990).6 Including
firm dynamics provides three general benefits: First, it effectively reduces the potential for
serial correlation of the errors; second, it allows for a dynamic component in the firm-
specific effect, rather than the static nature of most fixed effects; and third, to the extent that
previous values of the dependent variable are associated with a firm’s propensity to export,
it controls for the possible endogeneity of exporting (Cameron and Trivedi, 1998; Greene,
2003). Because we use three-year lags of the independent variable of interest (exporting),
we incorporate three lags of the dependent variable into every specification. We estimate
the following model:
)exp( 2,13,32,21,1 ititptitititiit uWxyyy +++++= −−−− ββρρρλ , (5) 3,2,1=p
where λit is the expected number of innovations for firm i at time t, yi,t-1~3 are the lags of the
6 For continuous dependent variables, the autoregressive model that includes exogenous regressors and lagged dependent variables has been proposed as a method of controlling for firm-specific effects (Greene, 2003). Al-Osh and Alzaid (1987) and Brännäs (1994) argue that the traditional AR(1) model can be extended to the integer-valued autoregressive (INAR(1)) model applied to count data. Moreover, Alzaid and Al-Osh (1990) refine an integer-valued pth-order autoregressive structure (INAR(p)) process and address differences between the INAR(p) and AR(p) processes. We apply the INAR(p) process to our negative binomial model.
22

dependent variable for firm i at time t, xi,t-p represents the export status variable for firm i at
time t, Wit is a vector of other explanatory variables, and uit is an unobserved disturbance
term that we can now more confidently assume is free of serial correlation. The rhos and
betas represent coefficient estimates.
RESULTS
Descriptive Statistics and Correlations
Table 3 presents descriptive statistics and a correlation matrix. Consistent with
learning-by-exporting, we find positive correlations between each of the EXPORT lags and
the dependent variable. Not surprisingly, R&D INTENSITY and ADVERTISING
INTENSITY are also positively correlated with innovative outcomes. In addition, each of
the EXPORT lags is positively correlated with R&D INTENSITY, ADVERTISING
INTENSTITY, and SIZE. This suggests that exporting firms spend more on R&D and
advertising, and are generally larger than purely domestic firms.
The means of RDISpain and RDIOECD variables are 0.01 and -0.00 respectively. This
implies that the firms in these data invest more in R&D than their industry counterparts in
Spain, but less than comparable firms in other OECD countries. Not surprisingly, the
RDISpain, RDIOECD, and R&D Intensity measures are highly correlated. Because the RDI
measures have an embedded firm specific component, they necessarily increase in a firm’s
R&D intensity because the industry specific component does not vary across firms within a
given industry. Moreover, the similarity across the two RDI measures implies a remarkable
concatenation between Spain and the rest of the developed world in R&D expenditures –
that is, industries in Spain tend to be similarly R&D intensive in their OECD counterparts,
23

and the variances in R&D expenditures in both Spain and the OECD follow a similar
pattern across industries over time.
*** Insert Table 3 about here ***
We compare the innovative activity of non-exporting firms to exporting firms in both
the low-RDI and high-RDI conditions in Figures 1 and 2. Exporters (regardless of whether
technologically leading or lagging) consistently have greater average patent application
counts than their non-exporting counterparts. Moreover, the results illustrate a slightly
greater propensity to patent among technologically capable exporters (in the high-RDI
condition). This relationship becomes pronounced toward the latter years of the panel.
While consistent with the firm capabilities argument, this effect should be interpreted with
caution for several reasons. First, based on the patterns across the low- and high- RDI
conditions, it is unclear whether the differences are statistically and/or economically
meaningful. Second, this effect is solely illustrated contemporaneously. It does not assess if
the direction of causality runs from innovation to exporting, vice versa, or both. Finally, it
does not control for many other firm effects that we include in the multivariate analyses.
Therefore, to better understand the nature of this relationship, we turn to the multivariate
regression analyses.
***Insert Figures 1 and 2 about here***
Regression Results
24

Negative binomial regression results for the patent application dependent variable
appear in Table 3. We present the results using median splits of RDIOECD in order to explore
the moderating effects of technological leadership on the exporting-innovation relationship
(Jaccard et al., 1990). We label the firms below the RDIOECD median as “relative”
technological laggards and the firms with values above the median as “relative”
technological leaders. The assumption inherent in considering these firms as “relative”
leaders/laggards is that such a split meaningfully captures the proximity to the global
technological frontier. That is, Spanish firms that we characterize as “relative”
technological leaders possess greater technological capabilities, and are closer to the global
technological frontier, than those that we consider as “relative” technological laggards. As
such, we can plausibly expect to observe systematic variance in learning from exporting
outcomes, in one direction or the other, in firms across conditions.7
As we mentioned earlier, we control for unobserved firm heterogeneity by including
an INAR(3) dynamic process into the model – e.g., incorporating three lags of the
dependent variable. Although not reported, we also include year dummies to control for
systematic time effects.
*** Insert Table 4 about here ***
Columns 1 and 5 present base models with control variables only. For both sets of
firms the one-year lag of patent applications has a positive and significant effect on current
7 We prefer median splits rather than splitting the data at the level of zero in order to make the sample balanced across the technological leader and laggard conditions. A balanced sample aids with inference. Nonetheless, we explored different cutoffs for creating the splits; and regardless of whether the splits were conducted at the mean, at the median, at zero, or at the quartiles, results do not change.
25

patent applications. This suggests that firms that applied for patents in the prior year apply
for significantly more patents in the current year. Moreover, as we would expect, these
effects tend to diminish over time; that is, the influence of current patent applications on
future patent applications is strongest in the near term. SIZE is positive and significantly
related to patent applications for the set of technological leaders, but not significant for the
set of technological laggards except in column 5. The results on R&D INTENSITY and
ADVERTISING INTENSITY are positive but not significant for both sets of firms.8
In order to test our hypotheses, we introduce one-, two-, and three-year lags of the
exporting variable in columns 2, 3, 4, 6, 7, and 8. To determine whether or not there are
statistically significant differences between the base models and the models including the
lagged export variable, we employ the likelihood ratio test (Cameron and Trivedi, 1998).
The likelihood ratio statistics comparing each export lag specification to the appropriate
base case are reported at the bottom of the table. The differences in the log-likelihoods
between the base models and all other models are statistically significant in every case
(p<.01 for models 2, 3, and 4; p<.05 for model 6 and 7; and p<.10 for models 8).9 This
suggests that each of the models including a lagged value of exporting performs better in
explaining a firm’s innovative output than the base model alone. The change in likelihood
ratio is greatest for the three-year export lag (column 4) in the technological leader
condition, and for the one-year export lag (column 6) in the technological laggard condition.
The specifications in columns 4 and 6 therefore fit the data best.
8 The correlations between the RDI variables on the one hand and the R&D Intensity variable on the other lead to some question as to whether R&D Intensity should be included as a control variable in the regression analysis. We opted to include R&D Intensity in the analyses because there was significant variation among firms within groups (i.e., across the relative leader and laggard conditions). When we eliminated R&D Intensity from the specification, results did not change. 9 For example, in the case of column 1 and column 2, the log likelihood test statistic is 11.389 -2 ((-1220.222)-(-1214.527)). The p-value of this statistic (distributed Chi-square) is less than .01.
26

In all specifications in columns 2, 3, 4, 6, 7, and 8, we find a positive and significant
relationship between previous exporting and current innovation. These results are consistent
with a main effect of exporting on innovation and suggest that exporting provides some
learning benefits for all firms. This is consistent with recent literature suggesting that firms
stand to gain from exporting (e.g., Salomon and Shaver, 2005a).
With regard to the moderating effects, our results imply some learning differences
across the technological leader and technological laggard conditions. Specifically, for
technologically lagging firms, the one-year lag of the export status variable has the
strongest statistical effect on patent applications, and this effect diminishes in statistical
magnitude over time. By contrast, for firms with greater technological capabilities (the
technologically leading condition), the three-year lag has the strongest statistical effect on
current patent applications.
In order to compare results across treatments, the standard approach is to use a
comparison of coefficients (t-tests). However, using a simple comparison of coefficients (t-
tests) in a nonlinear maximum likelihood framework can cloud interpretation due to the
inherent non-linearity of the underlying p.d.f. function, and the specific location on the
curve at which the coefficients are estimated. Therefore, we calculate, and compare, the
marginal effects across conditions.10 We find that the marginal effects of exporting on
patent applications for firms with technological capabilities (the technological leader group)
are consistently higher than for those firms lacking such capabilities (technological laggard
group). For example, for the one-year lag (EXPORTt-1), we would expect firms in the
technological leader group to gain an additional 0.07 of a patent (0.09 – 0.02) from
exporting. This result provides support for hypothesis 1b. That is, the results imply a 10 The marginal effects represent the partial derivatives with respect to the mean of the variable in question.
27

moderating effect of technological capabilities on the exporting-innovation relationship
such that technological leaders learn more from exporting.
***Insert Table 5 about here***
In Table 5, we re-estimate the results from Table 4 using the median split of the
RDISpain variable. This provides another assessment of whether interaction with foreign
agents leads to greater knowledge spillovers and enhanced learning for technologically
leading or lagging firms. The evidence across columns 2-4 and 5-7 corroborate our
previous findings. The results confirm that firms with technological capabilities benefit
more (learn at a faster rate) from exporting than those that lack such capabilities. Taken
together then, the results from Tables 4 and 5 reject hypothesis 1a in favor of hypothesis 1b.
DISCUSSION AND CONCLUSION
Although extant research has highlighted the potential for learning from exporting at
the macro-economy level, the empirical literature has just begun to examine these
relationships at the micro- level. Research identifies opportunities for firms to learn from
exporting, but we understand less about the micro- level determinants of learning from
exporting. In this paper, we focus on a particular theoretical debate that arises when
considering macro-economic convergence and firm capabilities explanations for firm
heterogeneity in learning-by-exporting. We attempt to reconcile this debate.
Convergence arguments suggest that technologically lagging firms stand to gain
more from exporting, and as a result, subsequently catch up with (converge to) their
28

technologically leading counterparts. By contrast, the firm capabilities literature suggests
that technologically leading firms stand to gain more from exporting because they are better
suited to use the knowledge available in export markets to commercial ends. Although we
find that exporting provides the opportunity for all firms to benefit from exposure to the
knowledge available in their destination markets, the results indicate that heterogeneity
exists across firms in learning-by-exporting outcomes. Specifically, we find evidence that
firms with superior technological capabilities learn at a faster rate than those that lack those
capabilities, supporting the firm capabilities claim.
The outcomes of this study hold several important implications for both research and
practice. First, in both technologically leading and lagging conditions, we find that
exporters increase their patent applications subsequent to exporting. This main effect of
exporting on innovation is consistent with recent findings in the learning-by-exporting
literature (Aw et al., 2000; Blalock and Gertler, 2004; Ozler and Yilmaz, 2001; Salomon
and Shaver, 2005a). This study therefore corroborates existing evidence that suggests that
exporting provides firms more than just an outlet for their products, but that firms also
benefit from the learning that accrues from trade.
Second, this paper contributes to the extant strategy and international business
literatures by measuring, and exploring, the moderating effects of technological capabilities
on the exporting-learning relationship. Our findings suggest that substantial heterogeneity
exists across firms in learning-by-exporting outcomes. The results indicate that
technologically capable firms stand to benefit most from exporting; and although
technologically lagging firms did benefit from exporting, exporting did not allow them to
close the gap with their technologically leading counterparts.
29

Third, these findings hold implications for the literatures on international expansion
and firm performance. One of the basic premises of research on international expansion is
that in order to succeed abroad, firms must possess some advantageous, intangible
knowledge-based assets (Buckley & Casson, 1976; Hymer, 1976). Moreover, this research
shows that international expansion is value creating for firms with distinctive technological
capabilities (for reviews see Caves, 1996; Dunning, 1993; Morck and Yeung, 1991, 1992;
Salomon and Shaver, 2005b). The results from this study are consistent with those from the
broader international strategy literature, with one exception. Not only do these results imply
that technologically endowed firms are better suited to expand abroad, but that such an
expansion allows those firms to build upon, and reinforce, that existing advantage.
Finally, our findings provide some practical implications for managers. Regardless
of the motivation for entering foreign markets, not all firms will benefit equally. In order to
maximize the learning benefits of exporting, managers should be aware of the impact of
their existing technological capabilities, with the understanding that those with existing
technological capabilities are best positioned to benefit from knowledge spillovers. For
technologically capable firms therefore, exporting can be considered a strategic action
through which firms can enhance their competitive position. Moreover, the learning that
accrues as a result of exporting provides value to firms beyond simply providing a sales
outlet for existing products, and those benefits should be valued accordingly.
While the outcomes from this research show some promise for continued study and
have implications for both scholars and practitioners, it is important to acknowledge one
caveat. Although these findings provide support for the firm capabilities story at the micro-
level, this does not necessarily invalidate the arguments proffered by convergence theory,
30

especially at the macro-economy level. For example, it could be that firms from developing
countries benefit more from exporting than firms from developed countries, with
technologically capable firms from developing countries benefiting the most. Said results
would certainly reconcile the predictions of the disparate literatures. Although our findings
do not support such a view, we cannot meaningfully test such a conjecture given the single
country context of this study. In addition, given Arrow’s (1951) impossibility theorem
demonstrating the difficulty of aggregating individual actions to the macro- level, it would
be both premature, and unwise, to summarily dismiss the convergence view. For these
reasons, we are cautious to generalize our results. Further corroboratory research is needed
before we can draw stronger conclusions. But its limitations notwithstanding, these results
stand to make contributions to the fields of strategy, economics, and international business;
and we hope to have presented a first pass at what is surely a much more complicated
phenomenon. We hope others will refine and improve upon our contribution by looking at
improved data sets with more fine-grained measures.
31

References
Acs ZJ, Audretsch DB. 1989 Patents as a measure of innovative activity. Kyklos 42(2): 171-180.
Allison PD, Waterman R. 2002 Fixed-effects negative binomial models. Sociological Methodology 32: 247-266.
Al-Osh MA, Alzaid AA. 1987. First order integer-valued autoregressive (INAR (1)) process. Journal of Time Series Analysis 8: 261-275.
Alzaid AA, Al-Osh MA. 1990. An integer-valued pth-order autoregressive structure (INAR (P)) process. Journal of Applied Probability 27: 314-324.
Archibugi D, Pianta M. 1996. Measuring technological change through patents and innovation surveys. Technovation 16(9): 451-467.
Arrow KJ. 1951. Social Choice and Individual Values. Wiley & Sons: New York.
Aw BY, Chung S, Roberts MJ. 2000. Productivity and turnover in the export market: micro evidence from Taiwan and South Korea. World Bank Economic Review 14(January): 65-90.
Aw BY, Hwang AR. 1995. Productivity and the export market: a firm-level analysis. Journal of Development Economics 47: 313-332.
Barney J. 1991. Firm resources and sustained competitive advantage. Journal of Management 17: 99-120.
Basberg BL. 1982. Technological change in the Norwegian whaling industry: a case study in the use of patent statistics as a technology indicator. Research Policy 11(3): 163-171.
Basberg BL. 1987. Patents and the measurement of technological change: a survey of the literature. Research Policy 16: 131-141.
Ben-David D, Loewy MB. 1998. Free trade, growth, and convergence. Journal of Economic Growth 3: 143-170.
Ben-David D, Loewy MB. 2000. Knowledge dissemination, capital accumulation, trade, and endogenous growth. Oxford Economic Papers 52: 637-650.
Benvignati A. 1990. Industry determinants and “differences” in U.S. intrafirm and arms-length exports. The Review of Economics and Statistics 72: 481-488.
Bernard AB, Jensen JB. 1999. Exceptional exporter performance: cause, effect, or both? Journal of International Economics 47: 1-25.
Blalock G, Gertler PJ. 2004. Learning from exporting revisited in a less developed setting. Journal of Development Economics 75: 397-416.
Brännäs K. 1994. Estimating and testing in integer-valued AR(1) models. Umea Economic Studies 335.
Buckley PJ, Casson M. 1976. The Future of the Multinational Enterprise. Holmes & Meier: London.
Cameron AC, Trivedi PK. 1986. Econometric models based on count data: comparisons
32

and applications of some estimators and tests. Journal of Applied Econometrics 1: 29-54.
Cameron AC, Trivedi PK. 1998. Regression Analysis of Count Data. Cambridge University Press: New York.
Caves RE. 1996. Multinational Enterprise and Economic Analysis (2nd edn). Cambridge University Press: Cambridge.
Chung W, Alcácer J. 2002. Knowledge seeking and location choice of foreign direct investment in the United States. Management Science 48(12): 1534-1554.
Clerides SK, Lach S, Tybout JR. 1998. Is learning by exporting important? micro-dynamic evidence from Columbia, Mexico, and Morocco. Quarterly Journal of Economics August: 903-947.
Cohen WM, Levin RC. 1989. Empirical studies of innovation and market structure. in Handbook of Industrial Organization, Schmalensee R, Willig RD (eds). North-Holland: New York.
Cohen WM, Levinthal DA. 1990. Absorptive capacity: a new perspective on learning and innovation. Administrative Science Quarterly 35: 128-152.
Comanor WS, Scherer FM. 1969. Patent statistics as a measure of technical change. Journal of Political Economy 77: 392-398.
Delgado MA, Fariñas JC, Ruano S. 2002. Firm productivity and export markets: a non-parametric approach. Journal of International Economics 57: 397-422.
Dunning J. 1993. Multinational Enterprises and the Global Economy. Addison-Wesley: Reading MA.
Edwards S. 1993. Openness, trade liberalization, and growth in developing countries. Journal of Economic Literature 31(3): 1358-1393.
European Patent Office. 2000. Facts and Figures.
Feeney J. 1999. International risk sharing, learning by doing, and growth. Journal of Development Economics 58: 297-318.
Frankel JA, Romer D. 1999. Does trade cause growth? American Economic Review 89(3): 379-399.
Graves S, Langowitz N. 1993. Innovative productivity and returns to scale in the pharmaceutical Industry. Strategic Management Journal 14: 593-605.
Greene WH. 2003. Econometric Analysis (5th edn). Prentice Hall: Upper Saddle River NJ.
Griliches Z. 1990. Patent statistics as economic indicators: a Survey. Journal of Economic Literature 28(4): 1661-1797.
Grossman GM, Helpman E. 1991a. Innovation and Growth in the Global Economy. MIT Press: Cambridge MA.
Grossman GM, Helpman E. 1991b. Trade, knowledge spillovers, and growth. European Economic Review 35(3): 517-526.
Grossman GM, Helpman E. 1994. Endogenous innovation in the theory of growth. Journal
33

of Economic Perspectives 8(1): 23-44.
Guillén MF. 2001. The Limits of Convergence: Globalization and Organizational Change in Argentina, South Korea, and Spain. Princeton University Press: Princeton NJ.
Guillén MF. 2005. The Rise of Spanish Multinationals. Cambridge University Press: Cambridge UK.
Hagedoorn J, Cloodt M. 2003. Measuring innovative performance: is there an advantage in using multiple indicators?. Research Policy 32: 1365-1379.
Hausman J, Hall BH, Griliches Z. 1984 Econometric models for count data with an application to the patents-R&D relationship. Econometrica 52: 909-938.
Henderson R, Cockburn I. 1994. Measuring competence? Exploring firm effects in pharmaceutical research. Strategic Management Journal 15: 63-84.
Henderson R, Cockburn I. 1996. Scale, scope, and spillovers: the determinants of research productivity in drug discovery. Rand Journal of Economics 27(1): 32-60.
Hymer SH. 1976. The International Operations of National Firms: A Study of Direct Foreign Investment. The MIT Press: Cambridge MA.
Jaccard J, Turrisi R, Wan CK. 1990. Interaction Effects in Multiple Regression. Sage Publications Inc.: Newbury Park CA.
Kennedy P. 1998. A Guide to Econometrics (4th edn). The MIT Press: Cambridge MA.
Kravis I, Lipsey R. 1992. Sources of competitiveness of the United States and of its multinational firms. The Review of Economics and Statistics 74: 193-201.
MacGarvie M. 2006. Do firms learn from international trade? The Review of Economics and Statistics 88(1): 46-60.
Maddala G. 1993. Limited Dependent and Qualitative Variables in Econometrics. Cambridge University Press: Cambridge UK.
Mahoney JT, Pandian JR. 1992. The resource-based view within the conversation of strategic management. Strategic Management Journal 13: 363-380.
Morck R, Yeung B. 1991. Why investors value multinationality. Journal of Business 64(2): 165-187.
Morck R, Yeung B. 1992. Internalization: an event study test. Journal of International Economics 33: 41-56.
OECD. 2001. Research and Development Expenditure in Industry, 1987-1999. OECD Publication Service: Paris France.
Ozler S, Yilmaz K. 2001, Does trade liberalization improve productivity? plant level evidence from the Turkish manufacturing industry. Working Paper, University of California, Los Angeles.
Penner-Hahn J, Shaver JM. 2005. Does international research and development increase patent output? an analysis of Japanese pharmaceutical firms. Strategic Management Journal 26(2): 121-140.
34

Peteraf M. 1993. The cornerstones of competitive advantage: a resources-based view. Strategic Management Journal 14: 179-191.
Porter ME. 1990. The Competitive Advantage of Nations. The Free Press: New York.
Salomon R, Jin B. 2006. Does knowledge spill to leaders or laggards? exploring industry heterogeneity in learning by exporting. Working Paper, New York University, New York.
Salomon R, Shaver JM. 2005a. Learning by exporting: new insights from examining firm innovation. Journal of Economics and Management Strategy 14(2): 431-460.
Salomon R, Shaver JM. 2005b. Export and domestic sales: their interrelationship and determinants. Strategic Management Journal 26: 855-871.
Scherer FM. 1965. Firm size, market structure, opportunity and the output of patented inventions. American Economic Review 55: 1097-1125.
Schumpeter JA. 1942. Capitalism, Socialism, and Democracy. Harper and Brothers: New York.
Slaughter MJ. 1997. Per capita income convergence and the role of international trade. American Economic Review 87(2): 194-199.
Ulloa G. Salas E. 1993. The Basic Features of Spain's Patents and Models. Patent Yearbook.
Vernon R. 1966. International investment and international trade in the product cycle. Quarterly Journal of Economics 80: 190-207.
Vernon R. 1979. The product cycle hypothesis in a new international environment. Oxford Bulletin of Economics and Statistics 41: 255-268.
Wernerfelt B. 1984. A resource-based view of the firm. Strategic Management Journal 5: 171-180.
Wernerfelt B. 1995. The resource-based view of the firm: ten years after. Strategic Management Journal 16: 171-174.
35

Table 1. Industry breakdown of the sample
Industry Number of Firms
Percentage of Total
1. Ferrous and non-ferrous metals 45 2.11% 2. Non-metallic products 161 7.53% 3. Chemical products 149 6.97% 4. Metallurgy and metallic products 223 10.44% 5. Agricultural machinery 125 5.85% 6. Office products and data processing 22 1.03% 7. Electrical accessories and materials 201 9.41% 8. Automobiles and motors 81 3.79% 9. Transport material 54 2.53% 10. Meat products 59 2.76% 11. Food and tobacco 229 10.72% 12. Beverages 53 2.48% 13. Textiles and clothing 249 11.65% 14. Leather and footwear 76 3.56% 15. Wood and wood products 146 6.83% 16. Paper and publishing 163 7.63% 17. Rubber and plastic products 101 4.73%
Total 2137 100.00%
36
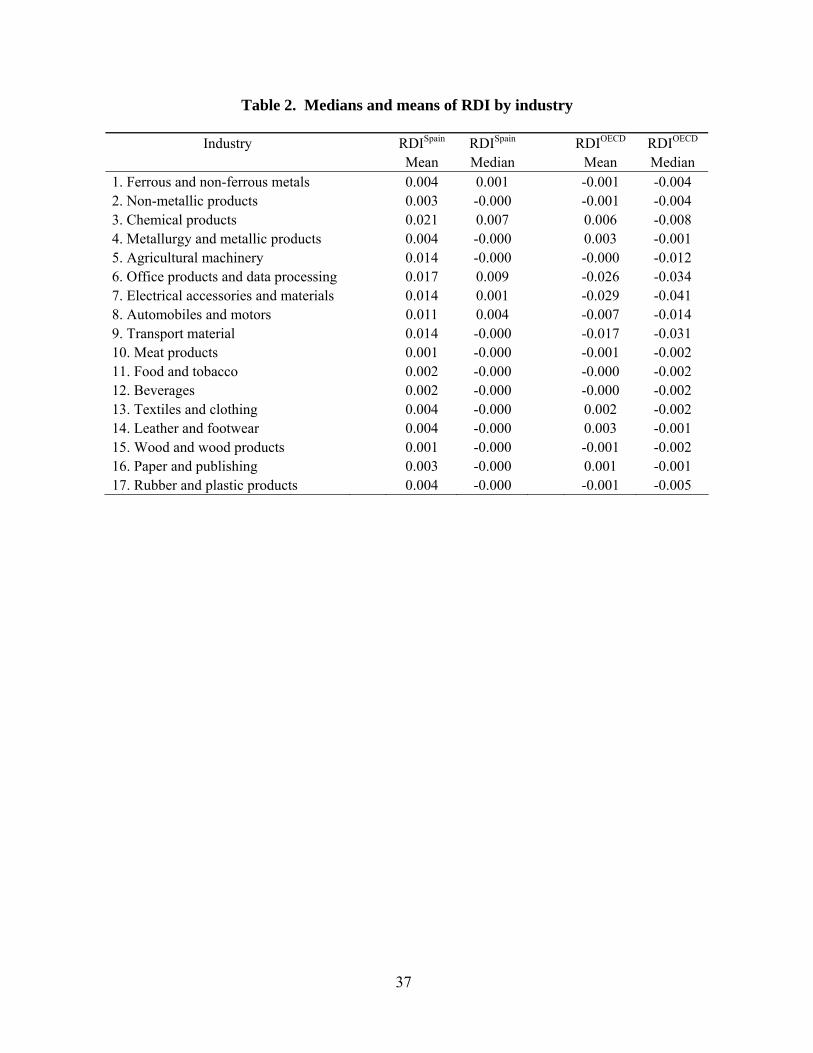
Table 2. Medians and means of RDI by industry
Industry RDISpain RDISpain RDIOECD RDIOECD Mean Median Mean Median 1. Ferrous and non-ferrous metals 0.004 0.001 -0.001 -0.004 2. Non-metallic products 0.003 -0.000 -0.001 -0.004 3. Chemical products 0.021 0.007 0.006 -0.008 4. Metallurgy and metallic products 0.004 -0.000 0.003 -0.001 5. Agricultural machinery 0.014 -0.000 -0.000 -0.012 6. Office products and data processing 0.017 0.009 -0.026 -0.034 7. Electrical accessories and materials 0.014 0.001 -0.029 -0.041 8. Automobiles and motors 0.011 0.004 -0.007 -0.014 9. Transport material 0.014 -0.000 -0.017 -0.031 10. Meat products 0.001 -0.000 -0.001 -0.002 11. Food and tobacco 0.002 -0.000 -0.000 -0.002 12. Beverages 0.002 -0.000 -0.000 -0.002 13. Textiles and clothing 0.004 -0.000 0.002 -0.002 14. Leather and footwear 0.004 -0.000 0.003 -0.001 15. Wood and wood products 0.001 -0.000 -0.001 -0.002 16. Paper and publishing 0.003 -0.000 0.001 -0.001 17. Rubber and plastic products 0.004 -0.000 -0.001 -0.005
37

38
Table 3. Descriptive statistics and correlations
Variable 1 2 3 4 5 6 7 8 9 10 11 12 1. Patent applications(t) 1.00
2. Patent applications(t-1) 0.36 1.00
3. Patent applications(t-2) 0.25 0.32 1.00
4. Patent applications(t-3) 0.29 0.22 0.32 1.00
5. Export(t-1) 0.07 0.08 0.08 0.09 1.00
6. Export(t-2) 0.07 0.07 0.09 0.09 0.86 1.00
7. Export(t-3) 0.10 0.07 0.07 0.09 0.80 0.86 1.00
8. RDISpain(t) 0.10 0.12 0.11 0.10 0.18 0.19 0.19 1.00
9. RDIOECD(t) 0.07 0.08 0.08 0.08 0.08 0.09 0.09 0.82 1.00
10. R&D intensity(t) 0.10 0.12 0.11 0.10 0.18 0.19 0.19 1.00 0.82 1.00
11. Advertising intensity(t) 0.07 0.07 0.06 0.05 0.19 0.20 0.20 0.11 0.11 0.11 1.00
12. Size(t) 0.10 0.10 0.09 0.08 0.55 0.56 0.56 0.21 0.08 0.21 0.22 1.00 Mean 0.20 0.22 0.24 0.24 0.53 0.52 0.52 0.01 -0.00 0.64 1.36 4.17 S.D. 1.54 1.70 1.85 1.87 0.50 0.50 0.50 0.02 0.02 2.04 3.06 1.57 Min 0 0 0 0 0 0 0 -0.00 -0.05 0 0 0 Max 92 92 92 92 1 1 1 0.64 0.62 63.70 48.00 10.14
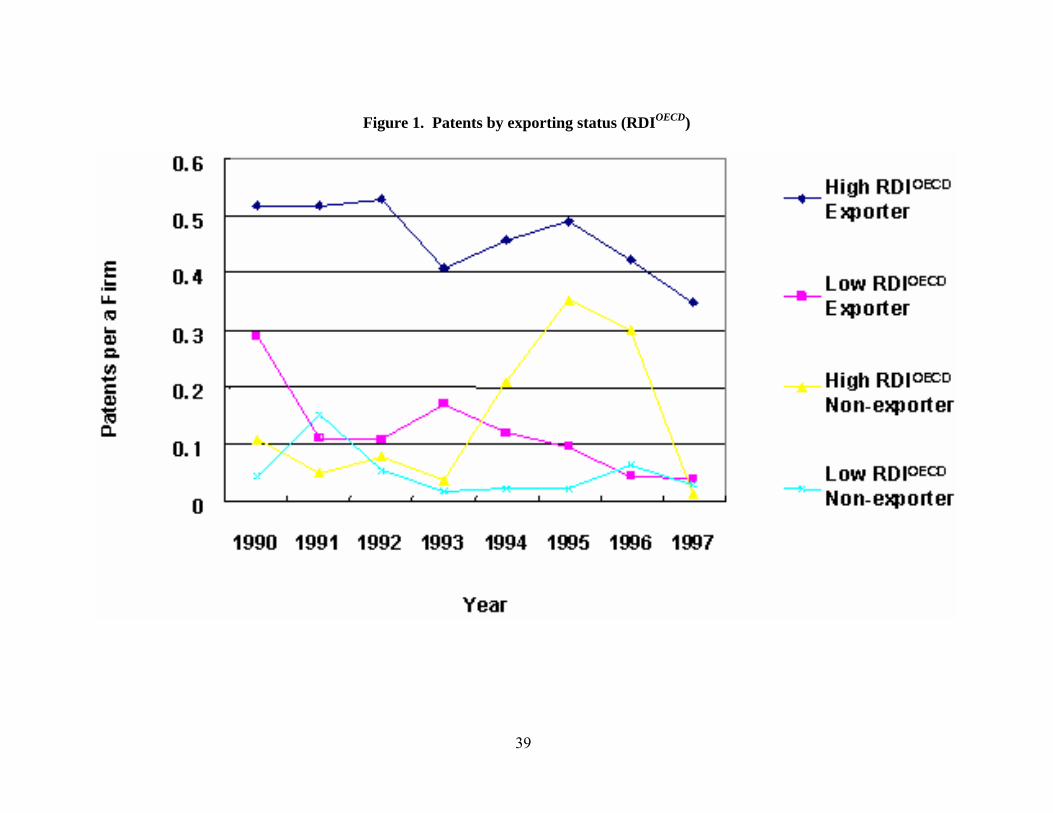
Figure 1. Patents by exporting status (RDIOECD)
39

40
Figure 2. Patents by exporting status (RDISpain)

Table 4. Negative binomial regressions (Median split by RDIOECD) (Dependent variable = Patent application)
Relative Technological Leaders Relative Technological Laggards Variable 1 2 3 4 5 6 7 8
Export(t-1) 0.776*** (3.36) [0.09]
0.600** (2.26) [0.02]
Export(t-2) 0.745*** (3.30) [0.09]
0.539** (2.01) [0.02]
Export(t-3) 0.831*** (3.71) [0.09]
0.469** (1.77) [0.01]
Patent application(t-1) 0.462*** (6.89) [0.06]
0.456*** (6.94) [0.06]
0.448*** (6.82) [0.06]
0.445*** (6.84) [0.06]
0.779*** (3.45) [0.02]
0.779*** (3.57) [0.02]
0.780*** (3.55) [0.02]
0.776*** (3.51) [0.02]
Patent application(t-2) 0.202*** (3.19) [0.03]
0.212*** (3.32) [0.03]
0.212*** (3.34) [0.03]
0.217*** (3.49) [0.03]
0.347** (1.69) [0.01]
0.325* (1.59) [0.01]
0.316* (1.58) [0.01]
0.321* (1.58) [0.01]
Patent application(t-3) 0.171*** (2.83) [0.02]
0.146*** (2.45) [0.02]
0.147*** (2.47) [0.02]
0.139*** (2.37) [0.02]
-0.036 (-0.24) [0.00]
-0.058 (-0.36) [0.00]
-0.045 (-0.30) [0.00]
-0.044 (-0.29) [0.00]
R&D intensity(t) 0.010 (0.34) [0.00]
0.011 (0.40) [0.00]
0.011 (0.41) [0.00]
0.011 (0.41) [0.00]
0.974 (0.61) [0.03]
0.636 (0.40) [0.02]
0.680 (0.43) [0.02]
0.771 (0.48) [0.02]
Advertising intensity(t) 0.021 (0.96) [0.00]
0.012 (0.54) [0.00]
0.013 (0.60) [0.00]
0.013 (0.59) [0.00]
0.025 (0.44) [0.00]
0.012 (0.22) [0.00]
0.015 (0.26) [0.00]
0.017 (0.31) [0.00]
Size(t) 0.252*** (4.76) [0.04]
0.194*** (3.47) [0.03]
0.197*** (3.54) [0.03]
0.190*** (3.41) [0.02]
0.123* (1.35) [0.00]
0.051 (0.53) [0.00]
0.053 (0.55) [0.00]
0.064 (0.66) [0.00]
Constant -4.050*** (-12.58)
-4.336*** (-12.66)
-4.297*** (-12.72)
-4.298*** (-12.78)
-4.308*** (-9.27)
-4.348*** (-9.33)
-4.274*** (-9.19)
-4.287*** (-9.21)
Year Effects Included Included Included Included Included Included Included Included
N 2531 2531 2531 2531 4013 4013 4013 4013 Log likelihood -1220.222 -1214.527 -1214.730 -1213.282 -534.870 -532.327 -532.850 -533.288
-2∆L 11.389*** 10.984*** 13.879*** 5.085** 4.039** 3.164* *: p<.10; **: p<.05; ***: p<.01 (One-tailed tests) t-statistics appear in (parentheses); marginal effects in [brackets]
41

Table 5. Negative binomial regressions (Median split of RDISpain) (Dependent variable = Patent applications)
Relative Technological Leaders Relative Technological Laggards Variable 1 2 3 4 5 6 7 8
Export(t-1) 1.037*** (4.57) [0.10]
0.412* (1.46) [0.01]
Export(t-2) 0.896*** (4.09) [0.09]
0.465* (1.63) [0.01]
Export(t-3) 0.885*** (4.12) [0.09]
0.533** (1.87) [0.02]
Patent application(t-1) 0.476*** (7.18) [0.06]
0.468*** (7.29) [0.05]
0.457*** (7.10) [0.05]
0.454*** (7.11) [0.05]
0.791*** (3.15) [0.02]
0.791*** (3.22) [0.02]
0.798*** (3.24) [0.02]
0.798*** (3.26) [0.02]
Patent application(t-2) 0.199*** (3.34) [0.02]
0.209*** (3.47) [0.02]
0.207*** (3.46) [0.02]
0.210*** (3.59) [0.02]
0.451* (1.31) [0.01]
0.448* (1.30) [0.01]
0.445* (1.28) [0.01]
0.452* (1.30) [0.01]
Patent application(t-3) 0.179*** (2.95) [0.02]
0.145*** (2.48) [0.02]
0.152*** (2.57) [0.02]
0.147*** (2.51) [0.02]
-0.141 (-0.51) [0.00]
-0.165 (-0.59) [0.00]
-0.170 (-0.61) [0.00]
-0.177 (-0.63) [0.00]
R&D intensity(t) 0.022 (0.76) [0.00]
0.023 (0.85) [0.00]
0.022 (0.81) [0.00]
0.021 (0.77) [0.00]
0.691 (0.38) [0.02]
0.436 (0.24) [0.01]
0.418 (0.23) [0.01]
0.338 (0.18) [0.01]
Advertising intensity(t) 0.025 (1.15) [0.00]
0.013 (0.59) [0.00]
0.015 (0.73) [0.00]
0.016 (0.73) [0.00]
0.025 (0.40) [0.00]
0.014 (0.23) [0.00]
0.013 (0.22) [0.00]
0.016 (0.27) [0.00]
Size(t) 0.297*** (5.76) [0.04]
0.218*** (4.02) [0.02]
0.226*** (4.16) [0.03]
0.225*** (4.17) [0.03]
0.107 (1.07) [0.00]
0.058 (0.56) [0.00]
0.049 (0.46) [0.00]
0.040 (0.38) [0.00]
Constant -4.207*** (-12.96)
-4.617*** (-13.20)
-4.503*** (-13.24)
-4.462*** (-13.25)
-4.375*** (-8.97)
-4.400*** (-9.01)
-4.349*** (-8.92)
-4.346*** (-8.91)
Year Effects Included Included Included Included Included Included Included Included
N 2825 2825 2825 2825 3719 3719 3719 3719 Log likelihood -1276.845 -1266.148 -1268.318 -1268.253 -481.678 -480.612 -480.346 -479.909
-2∆L 21.394*** 17.055*** 17.186*** 2.133 2.663 3.539* *: p<.10; **: p<.05; ***: p<.01 (One-tailed tests) t-statistics appear in (parentheses); marginal effects in [brackets]
42