Embed Size (px)
Citation preview

Leakage Modeling and ReductionAmit Agarwal, Lei He et. al
Presenters: Qun Gu
Ho-Yan Wong
Courtesy of Lei He
Outline
Introduction Circuit level leakage reduction System level leakage reduction Coupled leakage and thermal simulation
and management
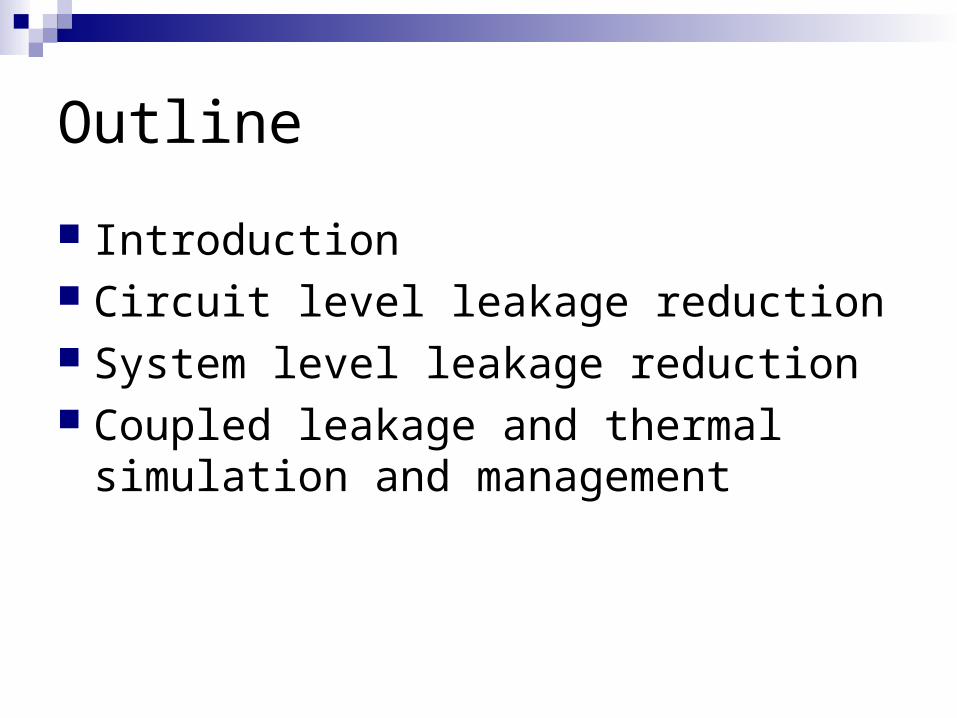
Power Trends

Circuit Power Dynamic Power: determined
by circuit performance requirement etc. The percentage is getting smaller.
Short_Circuit Power: Both PU and PD circuit partially conduct. Small percentage. (<10%)
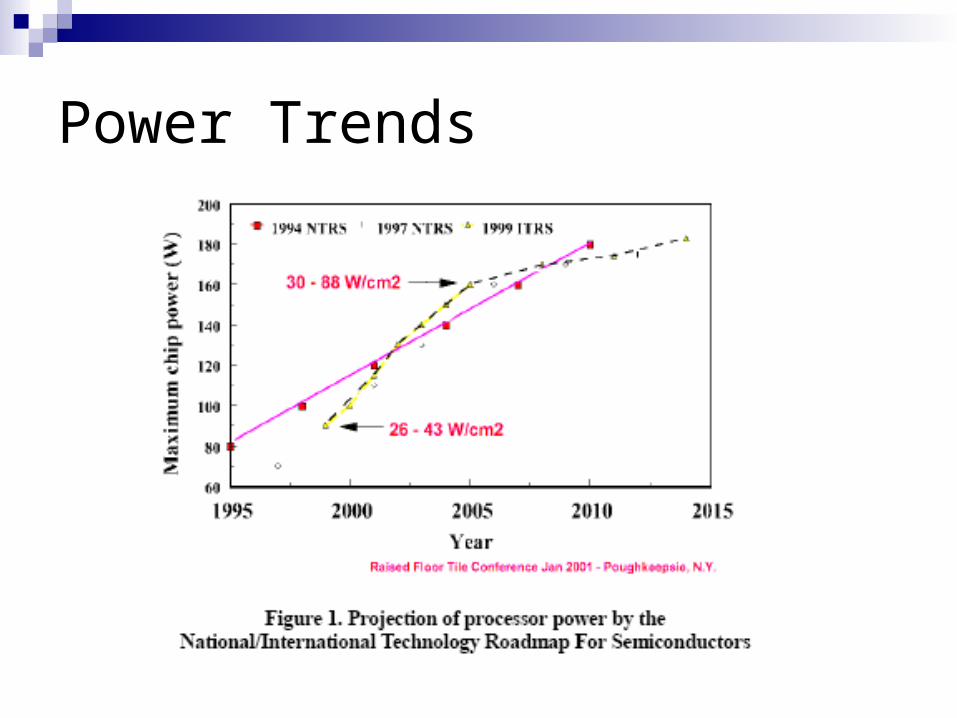
Leakage Power: Increasingly important, and many issues dependent, such as device geometry, temperature, doping, processing and data pattern dependent, etc. It is very complicated and worthy to study more to improve it.

Leakage Power Sources Subthreshold leakage
Reverse Biased Junction BTBT Leakage
Gate Leakage
Reverse Biased Junction BTBT
Gate Source
n+ n+
Bulk
Drain
Subthreshold Leakage
Gate Leakage
Leakage Dependences

Circuit Techniques to Reduce Leakage Design Time Techniques
Dual threshold CMOS
Run Time Techniques Standby Leakage Reduction Techniques
Natural Transistor Stacks Sleep Transistor (MTCMOS) Forward/Reverse Body Biasing (VTCMOS)
Active Leakage Reduction Techniques Dynamic Vth Scaling (DVTS)

Dual Threshold CMOS
• Low Vth for critical path
• High Vth for non-critical path
Concerns:• It is not so straigtht forward to do this. Sometime tradeoff exist between high Vth and low Vth applications.• Vth variation cannot be always success at low voltage supplies. • Increasing the number of critical paths will sometimes hurt circuit performance.
Adjust Vth approaches in fabrication:• Adjustment of tox (the higher tox, the higher Vth)
How?

Natural Transistor Stacks
• Reduce the leakage by stacking the devices.
• Trade off between speed and power• Data pattern determined• Trade off with other leakage power ( gate leakage)
How?
Concerns:
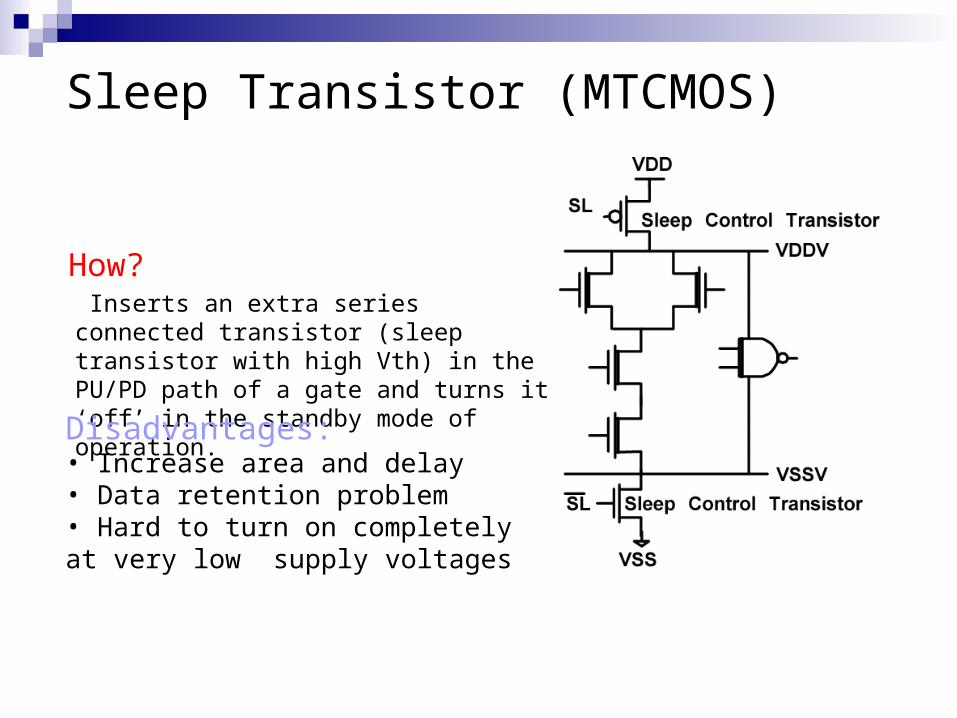
Sleep Transistor (MTCMOS)
How? Inserts an extra series connected transistor (sleep transistor with high Vth) in the PU/PD path of a gate and turns it ‘off’ in the standby mode of operation.
Disadvantages:• Increase area and delay• Data retention problem• Hard to turn on completely at very low supply voltages
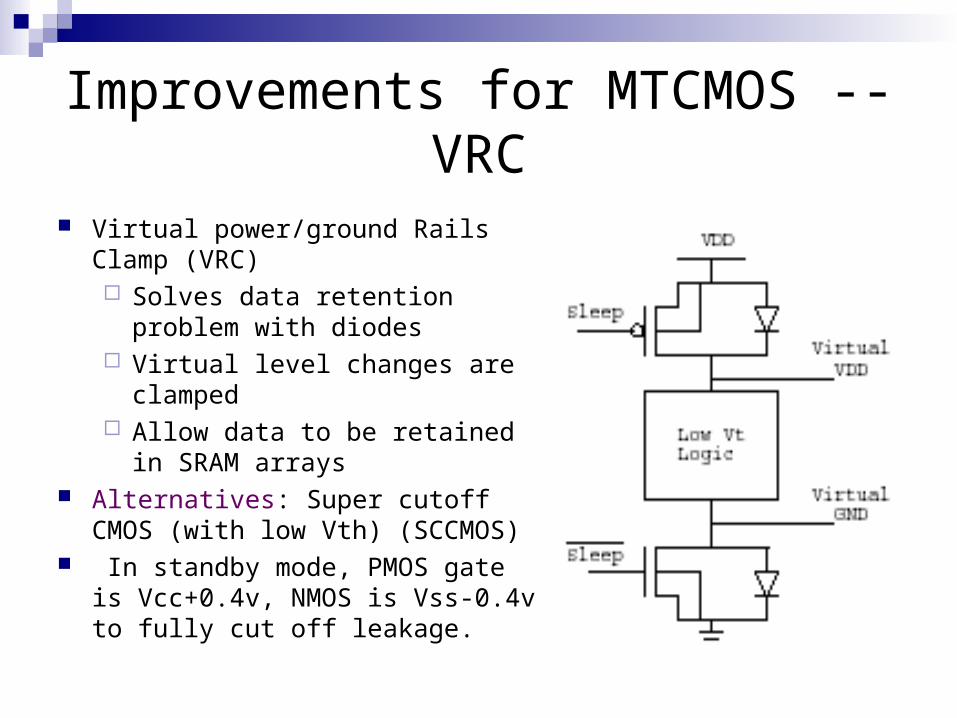
Improvements for MTCMOS -- VRC
Virtual power/ground Rails Clamp (VRC) Solves data retention problem
with diodes Virtual level changes are clamped Allow data to be retained in SRAM
arrays Alternatives: Super cutoff CMOS
(with low Vth) (SCCMOS) In standby mode, PMOS gate is
Vcc+0.4v, NMOS is Vss-0.4v to fully cut off leakage.

Forward/Reverse Body Biasing (VTCMOS)
RBB (Reverse Body Bias): zero body bias in active mode, a deep reverse bias in standby mode.
FBB (Forward Body Bias): high Vth in standby mode, forward body biasing to achieve better current drive in active mode.
Disadvantages:• Increase PN junction reverse leakage• Scaling down technology worsen short channel effects and weaken the Vth modulation capability
Disadvantages:• Larger junction capacitance• High body effect for stack devices
Technology improvement for high Vth:• Different doping profile• Higher work function materials

Dynamic Vth Scaling (DVTS)
• The lowest Vth is delivered (NBB-no body bias) if the highest performance is required. • When the performance demand is low, clock frequency is lowered and Vth is raised via RBB to reduce the run time leakage power dissipation.
How?• When critical path replica frequency is less then reference CLK, adjust bias to decrease Vth.• Otherwise adjust bias to increase Vth.
Results:

Process Variation and Leakage
IDSAT and IOFF variation measured (150nm process).
Variation Sources:• Channel length• Transistor width• Oxide thickness• Flat-band voltage• Random dopant effect
The effects of larger spread of leakage:• Robustness of logic circuits.• Circuit design margin.
Circuit Techniques for Compensation Process Variation:• Adaptive body biasing for process compensation• Process variation compensation in dynamic circuits

Adaptive Body Biasing for Process CompensationDue to the worsening parameter fluctuation:• Some dies may not meet the target frequency.• Others exceed the leakage power constraints.
How?• The slow dies which fail to meet the desired frequency can be forward body biased to improve performance which paying more leakage power. • On the other hand, excess leakage dies can be reverse body biased to meet the leakage power specifications.
Effects: So adaptive body bias reduces the spread of the die frequency distribution by 7X, compared to a conventional zero body bias.

Process Variation Compensation in Dynamic Circuits (I)
Programmable keeper size scheme:A desired effective keeper width can be chosen among {0, W, 2W, …7W} according to the control bit.
Dynamic Circuits need keepers to compensate leakage current to keep data.
The consideration for keepers size:• Unnecessary large keeper size will hurt circuit performance• Excess leakage dies can not meet the robustness requirements without enough keeper size.
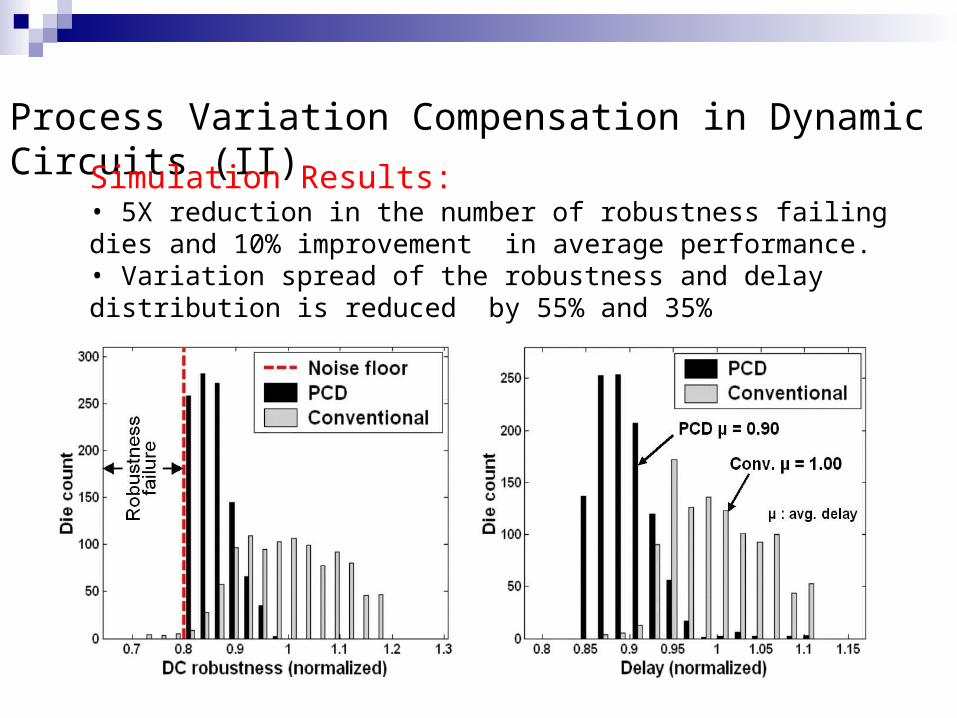
Process Variation Compensation in Dynamic Circuits (II)
Simulation Results:• 5X reduction in the number of robustness failing dies and 10% improvement in average performance.• Variation spread of the robustness and delay distribution is reduced by 55% and 35%
System Level Leakage Reduction Motivation Leakage characteristics and reduction Coupled leakage and thermal simulation
and managementPower and thermal simulationDynamic power and thermal managementVdd scaling with cooling selection

Motivation
Leakage current has increased due to scaling in Vt, L, and tox
Leakage power becomes more important due to high leakage devices and low activity rates
Leakage power depends greatly on temperature

Power States at System Level
3 Power states defined at system level:
1. Active Mode – circuit in operation; P= Pd + Ps
2. Standby Mode – circuit is idle but ready to execute; P= Ps
3. Inactive Mode – circuit is deactivated by leakage reduction techniques; P < Ps

System Level Leakage Power Modeling Early model:
Ps = Vdd * N FET * k design * Ileakage
Later model, with application of 2 leakage power reduction techniques (later):
Ps = Vdd * Ngate * Iavg
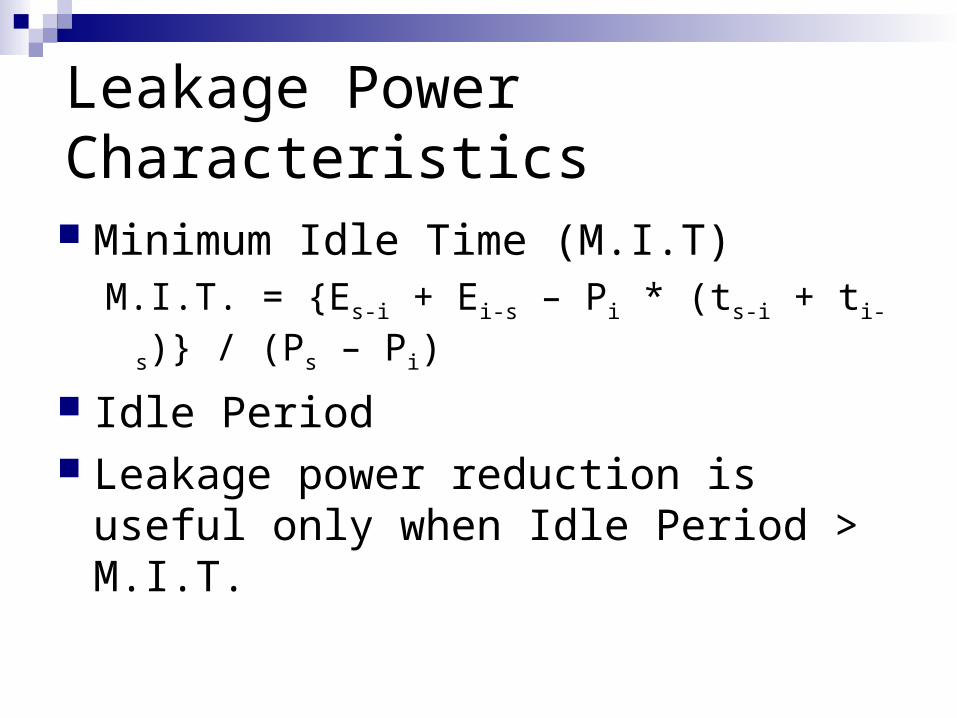
Leakage Power Characteristics
Minimum Idle Time (M.I.T)M.I.T. = {Es-i + Ei-s – Pi * (ts-i + ti-s)} / (Ps – Pi)
Idle Period Leakage power reduction is useful only
when Idle Period > M.I.T.

Runtime Leakage Reduction for Caches Caches dissipate large amount of leakage
power due to large SRAM array structures Different techniques are developed to
reduce L1 cache Ps, e.g. DRI, SWAY Basic principle is to dynamically turn off
partial cache array structure

Ps Reduction for L2 Caches
L2 cache has much larger miss penalty, so approach for L1 can not be directly applied
Use VRC to reduce Ps , and use time-out based control mechanisms to shutdown L2-cache data portion
Time out threshold could be fixed (FTO), dynamic, or by feedback control (FCTO)

Ps Reduction for L2 Caches cont’d
FTO Time out threshold is set as M.I.T.
FCTO Adjust the time-out threshold with the proportional-
integral (PI) feedback controller Update time-out threshold according to
N: L2 cache miss rate in previous time window Told: Time-out threshold in previous time window
New timeout threshold T = Told + (N – Setpoint) * Gain

Circuits for FCTO
Timeout controller
Threshold controller
Tag Index Block offset
Tagpotion
Check for tag match
Datapotion
Mux
hit/miss
Timeoutcontroller
Requestaddress:
Hit?hit/miss
Wakeupsignal
Yes
Thresholdcontroller
= Shutdownsignal
Counter
Thresholdregister
- X +Nmiss
setpoint gain
Thresholdoutput
Data word
Wakeup/shutdownsignals

Comparison of L2 Leakage Reduction
Power reduction (%) Performance penalty (%)
Benchmark FTO FCTO SWAY DRI FTO FCTO SWAY DRI
go 52.21 63.80 57.55 56.79 1.06 1.10 9.95 7.39
li 12.92 27.87 26.64 26.56 0.93 1.07 7.28 7.71
equake 35.75 48.61 46.40 45.71 0.84 1.01 9.73 10.58
art 0.07 2.20 2.17 2.18 0.37 0.92 3.18 3.14
Time-out (FTO and FCTO) achieve much smaller performance penalty
Targeting at 1% performance loss, FCTO obtains more power reduction than FTO does.
System Level Leakage Reduction Motivation Leakage characteristics and reduction Coupled leakage and thermal simulation
and managementPower and thermal simulationDynamic power and thermal managementVdd scaling with cooling selection

Temperature Aware Computing
Initialconditions(T, delay)
uArchFloorplanpackaging
Workload(e.g. Spec 2k)
Adjustedconditions(T, delay)
Performance simulator(e.g. SimpleScalar, IMPACT)
Dynamic power estimation(e.g. Wattch)
Leakage estimation
Coupled power and thermal simulator(e.g. PTscalar, PowerImpact)
Temperature-awarearchitecture techniques
(DVS, DTM, reconfigurability
power model, GALS, etc)

Leakage Model with Temperature Scaling Exponential scaling based on BSIM3v3
Logic circuits in ITRS 100nm technology:
Memory units in ITRS 100nm technology:
dddd
ddc
dddd
ddl
VT
VTwordsizewordsVTP
VT
VTwordsizewordsVTP
53.372592.711exp1029.5),(
09.439613.1986exp)1072.11030.5(),(
210
2910
T
VTVTIVNP dd
ddavgddgates
09.439613.1986exp),( 2
00

Based on SPICE level 1 model, transistor saturation current Isat is proportional to
We obtain
ITRS 100nm technology
2.1
19.1
)(
1),delay(
tdd
dd
satdd VV
TV
ITV
)( tdd VV
T
75%
80%
85%
90%
95%
100%
1 1.1 1.2 1.3
Vdd (V)
No
rmal
ized
gat
e d
elay
T=60oC
T=80oC
T=100oC
Delay with Vdd and Temperature Scaling

Thermal Modeling
For the lumped RC thermal circuit Thermal resistance Rth: the ability to remove heat to the ambient in
steady-state condition Thermal capacitance Cth: capture the delay between a change in
power and the corresponding change in the temperature Thermal time constant τ= Rth * Cth
Distributed model is needed for accurate solution

Coupled Power and Thermal Simulation
Simulate time step ts < 0.5% of time constant (~106 cycles) will give negligible temperature and power calculation errors
Clock gating reduces dynamic power and also leakage energy
Leakage energy changes with operation temperature
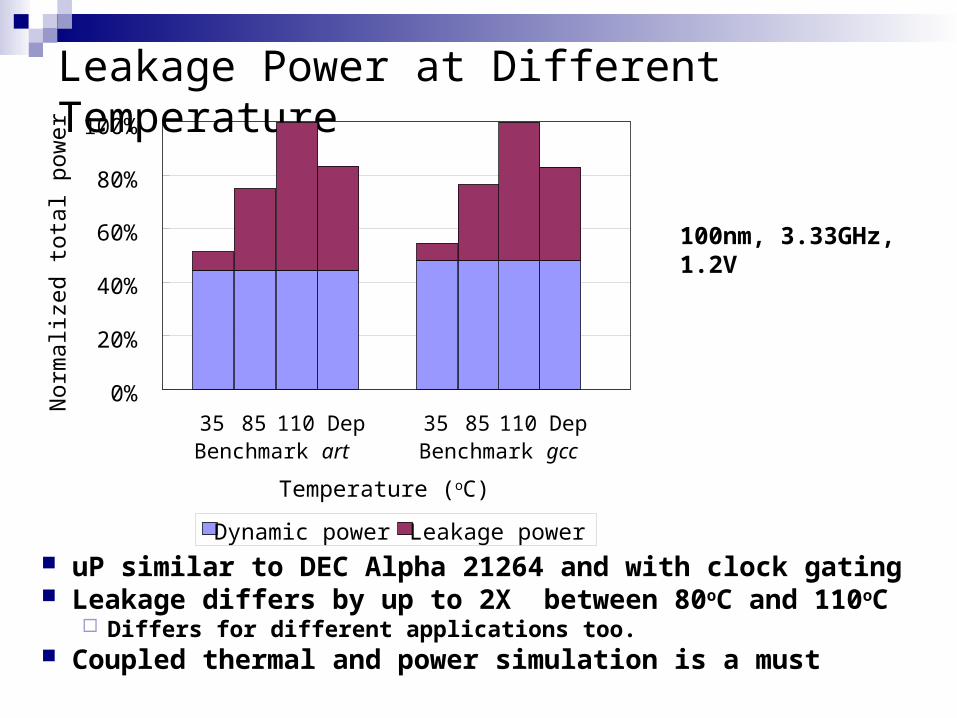
Leakage Power at Different Temperature
uP similar to DEC Alpha 21264 and with clock gating Leakage differs by up to 2X between 80oC and 110oC
Differs for different applications too. Coupled thermal and power simulation is a must
0%
20%
40%
60%
80%
100%
35 85 110 Dep 35 85 110 Dep
Temperature (oC)
Nor
mal
ized
tota
l pow
er
Dynamic power Leakage power
Benchmark art Benchmark gcc
100nm, 3.33GHz, 1.2V

Thermal Runaway
Thermal runaway is caused by the positive feedback loop between on-resistor, temperature, and power
Also a result of the interaction between leakage power and temperatureComponent temperature ↑leakage power ↑
exponentially temperature ↑ If cooling not adequate, both keep increasing
Thermal Runaway cont’d
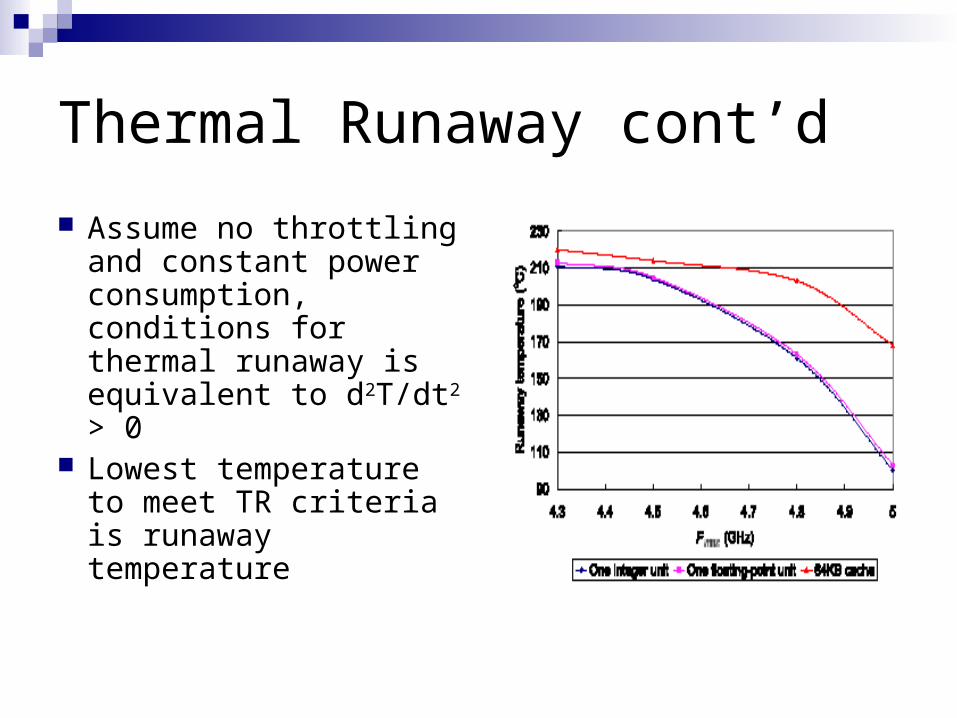
Assume no throttling and constant power consumption, conditions for thermal runaway is equivalent to d2T/dt2 > 0
Lowest temperature to meet TR criteria is runaway temperature

Dynamic Power and Thermal Management (DPTM) Goal: Maximize throughput subject to maximum
on-chip temperature constraint For each time window = X cycles, stop or
throttle instruction fetch in cycles 0<=δ <=1
Feedback controller (Proportional Integral) to adjust δ: For each time window, updateδ according to
Current maximum on-chip temperature δ in previous time window
X
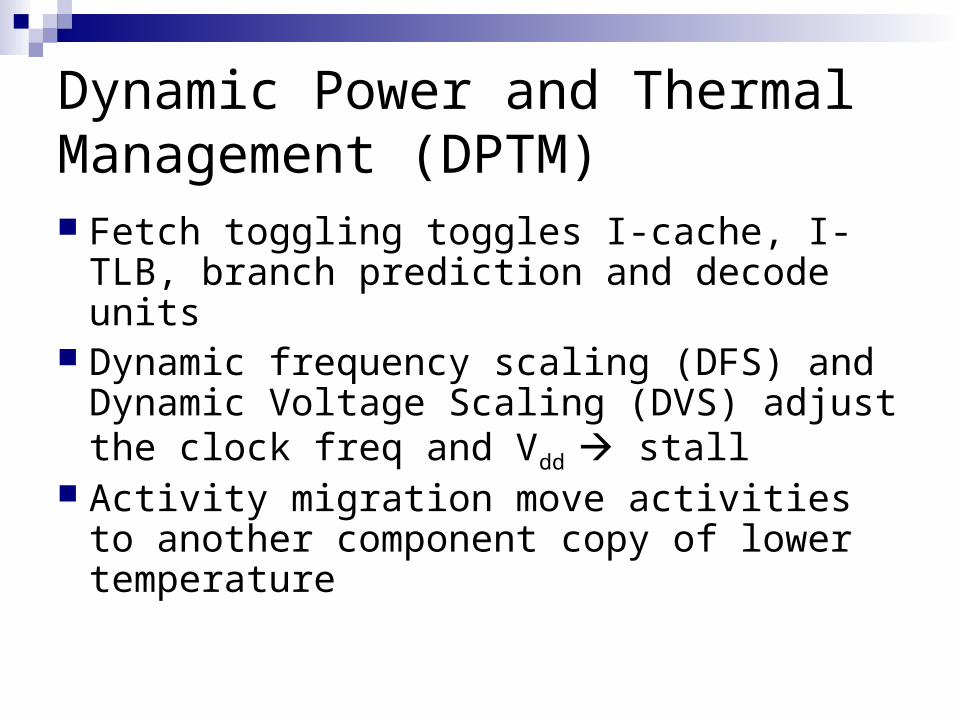
Dynamic Power and Thermal Management (DPTM) Fetch toggling toggles I-cache, I-TLB,
branch prediction and decode units Dynamic frequency scaling (DFS) and
Dynamic Voltage Scaling (DVS) adjust the clock freq and Vdd stall
Activity migration move activities to another component copy of lower temperature

Need for Temperature Dependent Leakage Model Dynamic thermal
management using fetch toggling with PI feedback controller
Implemented 2 models: simple (fixed Ps) and accurate (Ps is temp. dependent)

Validation of PI-based DPTM Compared with two practices:
No dynamic management Lower Vdd to avoid thermal violations
Cooling down If reaching the thermal threshold, stop the
whole processor until the maximum temperature is X oC lower than the threshold
X = 5 in our experiments

System Performance
DPTM by feedback control may improve throughput by up to 11% compared to no DPTM case
DPTM allows designing for common workload but not the worst case => thermal speculation
2.0
2.5
3.0
3.5
4.0
4.5
5.0
5.5
1 1.1 1.2 1.3
Vdd (V)
Thro
ughp
ut (B
IPS
)
Feedback control, Max T=80C Simple cooling down, Max T=80C
No management, Max T=110C
Max throughput
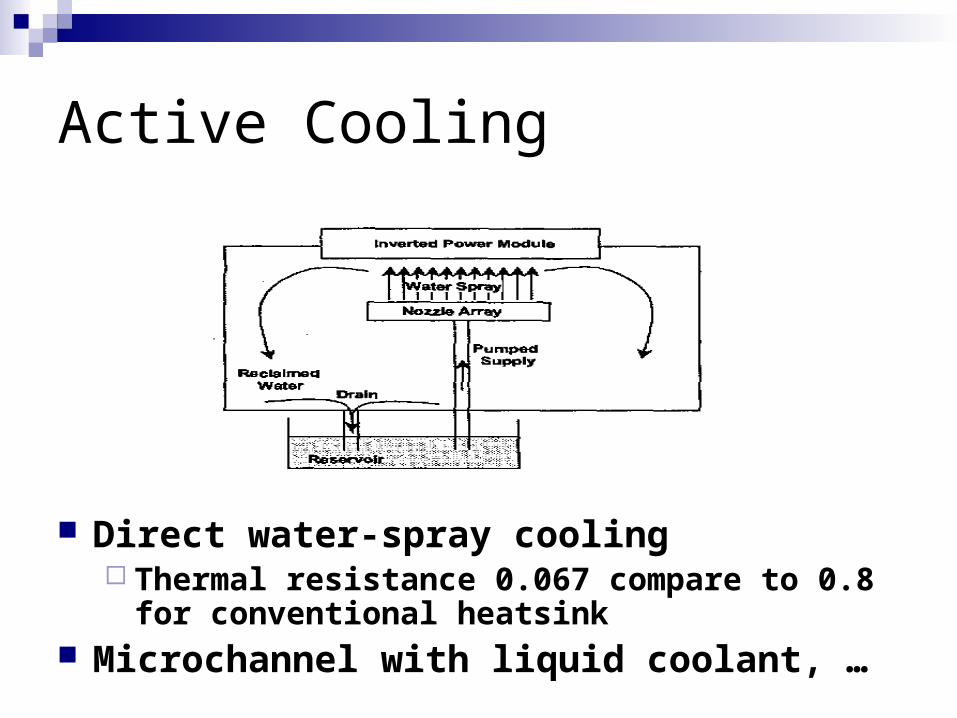
Active Cooling
Direct water-spray cooling Thermal resistance 0.067 compare to 0.8 for
conventional heatsink Microchannel with liquid coolant, …
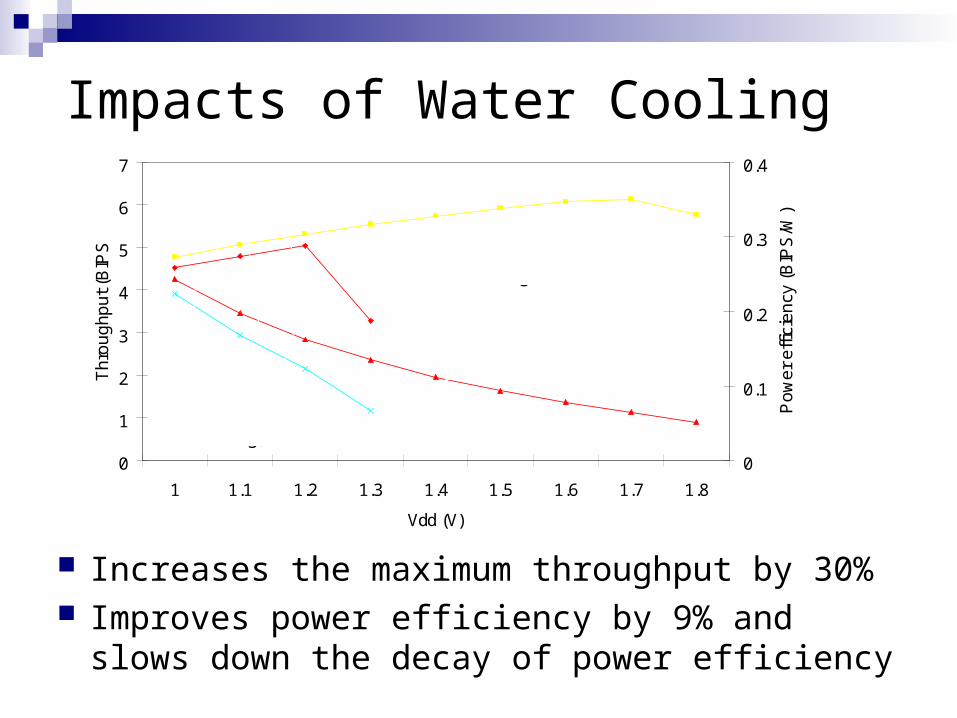
Impacts of Water Cooling
Increases the maximum throughput by 30% Improves power efficiency by 9% and slows
down the decay of power efficiency
0
1
2
3
4
5
6
7
1 1.1 1.2 1.3 1.4 1.5 1.6 1.7 1.8
Vdd (V)
Th
rou
gh
pu
t (B
IPS
)
0
0.1
0.2
0.3
0.4
Po
we
r e
ffic
ien
cy (
BIP
S/W
)
water cooling, Max T=60oC
Air cooling, Max T=80oC
References
Amit Agarwal et. al, “Leakage Mechanisms and Leakage Control for Nano-Scale CMOS Circuits”, Purdue University.
Lei He et. al, “System Level Leakage Reduction Considering the Interdependence of Temperature and Leakage”, UCLA.


![Lei Wu, Ph. D. - Clarkson Universitypeople.clarkson.edu/~lwu/Files/C.V.--Lei WU.pdf · Smart Grid, Vol. 8, No. 3, pp. 1330-1339, May 2017. [J62] Chuan He, Tianqi Liu, Lei Wu, and](https://img.dokumen.tips/doc/110x75/5c1d95d309d3f25e398bf2c0/lei-wu-ph-d-clarkson-lwufilescv-lei-wupdf-smart-grid-vol-8-no.jpg)