Embed Size (px)
Citation preview
Running head: TOWARDS A BETTER UNDERSTANDING OF EMOTION BLENDS 1
Towards a Better Understanding of Emotion Blends: The Case of Anger-Related Emotion
Blends Elicited Via Film Clips
Abstract
We sought to better understand the effect of film clips supposed to elicit different intensities
of anger on feelings and cardiac activity among our participants. In experiment 1, we tested in
21 volunteers the ability of three film clips to elicit three mood states (i.e., neutral, slight
anger and strong anger). In experiment 2, we used the same three film clips in order to
investigate, in 36 volunteers, how cardiovascular patterns may differ between the three
emotional states we elicited. Results suggest that the film clips produced a physiological
reappraisal pattern, with a lower heart rate and higher heart rate variability values (RMSSD
and SD1) during exposure to film clips that were selected to elicit anger. Results of both
experiments also suggest that film clips selected to elicit anger, not only triggered anger, but
also other negative emotions. Consequently, we propose a method of assessing emotions
which takes emotion blends into account.
Keywords: emotion; reappraisal; heart rate variability; film clips
1
1
2
3
4
5
6
7
8
9
10
11
12
13
14
15
16
17
18
19
20

TOWARDS A BETTER UNDERSTANDING OF EMOTION BLENDS 2
“There are more than a thousand definitions of what emotion is and the only point on
which everyone agrees, is that the concept is hard… to define“ (Belzung, 2007). According to
Kleinginna and Kleinginna, (1981) who analyzed and classified 92 definitions of emotion, it
can be argued that emotion consists of four main components: a) cognitive b) subjective
c) physiological d) behavioral. Although different ordering of these components could be
practically all the time defended, cognitive, subjective and physiological features appear to
play an upstream role in emotion emergence (Niedenthal, Krauth-Gruber, & Ric, 2006, p. 10-
11; Plutchik, 2001). The present research coupled subjective and cardiac measures in order to
investigate these early processes. The aim was to answer the question of what is happening
throughout the processing of emotional stimuli supposed to elicit anger with different
intensities. Does physiology solely vary according to the intensity of the emotion felt, or
physiological variations observed during emotion elicitation could reflect other processes
(e.g., emotion regulation)? In the purpose of addressing this issue, let us firstly discuss about
emotion, especially how it can be assessed.
Subjective Emotional Assessment
Earliest studies in psychology generally used subjective data to assess individual
emotional states. Different approaches to emotion have been conceptualized in order to
categorize feelings. Some are based on the view that there is a finite number of emotions
(Ekman, 1984, 1992; Izard, 1977). Others are based on multidimensional models in which
emotion can be defined as a function of broader features (e.g., Russell, 1980; Watson &
Tellegen, 1985, Fontaine, Scherer, Roesch, & Ellsworth, 2007). Both discrete and
dimensional approaches to emotion are widely used by psychologists in experimental contexts
(Scherer, 2005).
Alternatively, other models have emerged from cognitive appraisal approaches of
emotion (e.g., Frijda, 1986; Schachter & Singer, 1962), which assume that there are cognitive
2
21
22
23
24
25
26
27
28
29
30
31
32
33
34
35
36
37
38
39
40
41
42
43
44
45
TOWARDS A BETTER UNDERSTANDING OF EMOTION BLENDS 3
processes that evaluate the emotional event, understand what caused it and assess ways of
coping with it. In other words, “appraisals are transformations of raw sensory input into
psychological representations of emotional significance” (Clore & Ortony, 2000). Scherer
(2005) created a tool for subjective emotional assessment, placing appraisal as a key feature
of his model. This tool has a specific arrangement of 16 discrete emotions placed around a
circle divided along two axes: valence (positive versus negative) along the horizontal line, and
coping potential (control/power) along the vertical line. Thus, individuals can rate the
intensity of their feelings on the basis of the distance from the hub of the wheel and the size of
the circles. In this way, the intensity of emotion can be expressed as the degree to which
individuals are affected by emotion (Scherer, Shuman, Fontaine, & Soriano, 2013). The
present study is thus based on the appraisal approaches of emotion, especially Scherer's model
(2005). However, as we previously argued, emotion also affect physiology.
Emotional Assessment through Cardiac Measures
In accordance with the neurovisceral integration model (Thayer & Lane, 2000; Thayer
& Lane, 2009) there is some evidence supporting brain connections, implicated in affective
processes like emotion regulation, and cardiac activity controlled by both the sympathetic and
parasympathetic branches of the autonomic nervous system (ANS). According to Kreibig
(2010), cardiac measurements, particularly heart rate (HR), defined as the number of
contractions of the heart per minute, and heart rate variability (HRV) which refers to the
variations between consecutive heartbeats are widely used to investigate the impact of
emotion on ANS activity. While sympathetic activity tends to increase HR in a few seconds,
parasympathetic activity tends to decrease HR and its response is faster (0.2-0.6 s) (Berntson
et al., 1997).
3
46
47
48
49
50
51
52
53
54
55
56
57
58
59
60
61
62
63
64
65
66
67
68
TOWARDS A BETTER UNDERSTANDING OF EMOTION BLENDS 4
Cardiac Measures as an Indicator of Anger
According to many authors, the ANS produces specific activations in response to
specific emotions (Cacioppo, Klein, Berntson, & Hatfield, 1993; Levenson, Ekman, &
Friesen, 1990; Stemmler, Aue, & Wacker, 2007). According to Kreibig's review, anger is one
of the most widely investigated emotions. Several studies have revealed typical variations in
metrics related to cardiac activity while experiencing emotions with high arousal such as
anger. For instance, many authors have found a significant increase in HR due to anger
elicitation (Fairclough & Spiridon, 2012; Fernández et al., 2012; Lobbestael, Arntz, & Wiers,
2008; Marci, Glick, Loh, & Dougherty, 2007).
Some studies have assessed HRV to explore emotion using time-domain methods.
Among the most commonly used indexes suitable for short-term recordings, the root mean
square of successive NN interval1 differences (RMSSD) appears particularly relevant, notably
indicating short-term variability in cardiac rhythm (Task Force of The European Society of
Cardiology and The North American Society of Pacing and Electrophysiology, 1996). Indeed,
several studies have shown that the RMSSD value decreases when participants have to carry
out an anger-related imagery task (Kreibig, 2010; Pauls & Stemmler, 2003). Consequently,
lower RMSSD values are expected when anger is experienced in the current study.
Furthermore, the mediation of cardiac activity by complex control systems assumes
that non-linear mechanisms are involved in cardiac rhythm variations (Task Force of The
European Society of Cardiology and The North American Society of Pacing and
Electrophysiology, 1996). Among non-linear methods used to study HRV, the Poincaré plot
is a popular tool because of the relative ease of interpreting one of the parameters. More
specifically, the SD1 index, describes short-term variability in cardiac rhythm (Goshvarpour,
1 (i.e., the interval from one R peak to the subsequent R peak)
4
69
70
71
72
73
74
75
76
77
78
79
80
81
82
83
84
85
86
87
88
89
90
91
5
TOWARDS A BETTER UNDERSTANDING OF EMOTION BLENDS 5
Abbasi, & Goshvarpour, 2017; Tarvainen, 2014). Consequently, SD1 should vary similarly to
RMSSD leading to lower values when an individual experiences anger.
Another interesting non-linear measure is related to entropy, which is used to quantify
signal complexity and irregularity. Two entropy indexes can be calculated: Approximate
entropy (ApEn) and sample entropy (SampEn). Low values for both indexes indicate greater
signal regularity. However, SampEn index is more accurate than ApEn. Additionally it is
preferred for short-term recordings (See Riganello, Cortese, Arcuri, Quintieri, & Dolce, 2015;
Tarvainen, 2014; Valenza, Allegrini, Lanatà, & Scilingo, 2012 for further information about
ApEn and SampEn). According to Valenza et al. (2012), entropy tends to decrease
significantly during arousal. It is well known that anger is characterized by high arousal (see
Russell, 1980). Consequently, lower values of SampEn are expected when anger is
experienced.
Furthermore, cardiac measures do not only reflect a direct expression of anger.
According to several authors, cardiac activity vary is affected by emotion regulation (León,
Hernández, Rodríguez, & Vila, 2009; Porges, Doussard-Roosevelt, & Maiti, 1994).
Cardiac Measures as an Indicator of Cognitive Reappraisal
As briefly introduced previously, appraisal theories of emotion focus on immediate
cognitive processes of evaluation of meaning, causal attribution and coping capabilities
(Niedenthal et al., 2006, p. 13). Regarding the last point (i.e., coping capabilities), it suggests
that a stimulus can be reappraised in order to regulate emotions felt by individuals and thus
face a psychological stress. According to Gross (1998), emotion regulation depends on the
individuals’ ability to adjust physiological arousal on a momentary basis (see also Appelhans
& Luecken, 2006). As a consequence, cognitive reappraisal could be possibly identified
through cardiac measures.
6
92
93
94
95
96
97
98
99
100
101
102
103
104
105
106
107
108
109
110
111
112
113
114
115
TOWARDS A BETTER UNDERSTANDING OF EMOTION BLENDS 6
According to Wranik and Scherer (2010), anger often occurs when one’s goals are
obstructed. This highlights the importance of considering the cognitive appraisal step,
determining the impact of a specific event on an individual. For instance, Denson, Grisham,
and Moulds (2011) asked three groups of participants to watch an anger-inducing video. In
one group (control), participants just had to watch the video. In the second group
(suppression), they had to try to control their facial expression and to behave in such a way
that a person watching them would not know what they were feeling. In the last group
(reappraisal), participants had to manage their emotional reactions; they were asked to try to
maintain a neutral mood and not to be overwhelmed by the anger elicited by the video. The
authors observed a significant increase in HRV (RMSSD) and decreased HR among
participants in the reappraisal condition. Their results reflect a physiological correlate of
adaptive emotion regulation. This physiological pattern is consistent with the notion of
reappraisal as an active and adaptive means of cognitively changing our response to emotional
situations. This process allows greater autonomic flexibility, and improves the ability to view
anger-inducing events as non-threatening. The same kinds of pattern were observed when
using pictures to induce a negative emotional state (Kuoppa, Tarvainen, Karhunen, &
Narvainen, 2016; Sarlo, Palomba, Buodo, Minghetti, & Stegagno, 2005; Stemmler et al.,
2007).
Furthermore, as links have been found between Poincaré’s SD1 index and time-
domain measures (i.e., RMSSD), higher values for SD1 can be expected when emotion-
regulation strategies emerge. In addition, as parasympathetic activity is predominant when
individuals reappraise emotional events (Denson et al., 2011) and entropy is higher when that
branch of ANS is in control (Valenza et al., 2012), it can be assumed that SampEn values will
be higher when individuals regulate their emotion.
7
116
117
118
119
120
121
122
123
124
125
126
127
128
129
130
131
132
133
134
135
136
137
138
139
TOWARDS A BETTER UNDERSTANDING OF EMOTION BLENDS 7
Hence, a decrease in HR together with an increase in time and non-linear HRV
indexes (RMSSD, SD1 and SampEn) could be expected when emotion-regulation strategies
are implemented.
Existence of an Anger Intensity threshold?
As previously seen, cardiac patterns may vary according to the way that individuals
manage their emotions. Several studies investigating different intensities of the same negative
emotion have effectively shown that emotion-regulation strategies could depend on the
intensity of the elicited emotion (Luce, Payne, & Bettman, 1999; Yao & Lin, 2015). More
precisely, Luce et al. (1999) found that high levels of negative emotion induce regulation
strategies such as avoidance coping. This raises the question of whether the level of anger
intensity produces a specific cardiac pattern, in other words an anger threshold pattern.
Indeed, it could be expected that a cardiac pattern reflecting reappraisal strategies would only
occur when a high intensity of anger is elicited. By contrast, a cardiac pattern reflecting direct
processing of anger should emerge when a moderate intensity of anger is induced.
To our knowledge, no study has investigated different levels of anger using both HR
and time and non-linear aspects of HRV. In order to see how emotional processing differs as a
function of the intensity of the anger experienced, the present study combined subjective and
physiological measurements to examine the specific cardiac patterns associated with different
intensity levels of anger.
Emotion Elicitation
According to Baldaro et al. (2001), film clips are commonly used to induce emotions
because of their high ecological validity and their ease of presentation. Several researchers
have developed databases of film clips suitable for mood induction procedures (Gross &
Levenson, 1995; Schaefer, Nils, Sanchez, & Philippot, 2010). Prior research used the most
recent database to study emotion. For instance, Fernández et al. (2012) investigated the
8
140
141
142
143
144
145
146
147
148
149
150
151
152
153
154
155
156
157
158
159
160
161
162
163
164
TOWARDS A BETTER UNDERSTANDING OF EMOTION BLENDS 8
objective physiological responses (skin conductance level and heart rate) and subjective
emotional responses elicited through a set of emotional film clips capable to induce anger,
fear, sadness, disgust amusement tenderness and a neutral state. In the same vein, the
Schaefer’s database (2010) has been used to compare different types of real-life emotional
elicitations: film clips eliciting anger, fear or sadness and a hostile social interaction (Cabral,
Tavares, Weydmann, das Neves, & de Almeida, 2018). However; no study focused on the
ability for the film clips belonging to this database to elicit different intensities of a same
emotion. Moreover, no study investigated the propensity for these film clips to elicit emotion
blends. In the current study, the Schaefer’s database (2010) thus enabled us to select relevant
film clips for the study’s objective.
In line with all the studies above, we expected that the chosen film clips (see below)
would elicit three intensities of anger: a close to zero (i.e., neutral state) and two specific
intensities (slight and strong). In addition, we expected that the physiological patterns
observed would reflect either a classic anger pattern, or could reflect a cognitive reappraisal
pattern depending on the intensity of anger elicited. Finally, we expected that not only anger,
but also other emotions should emerge during the exposure to film clips.
Experiment 1
The goal of Experiment 1 was to study the capacity of specific film clips to elicit
different intensities of anger. In addition, we sought to explore the potential presence of other
emotions felt while exposed to the film clips. In this context, emotional state was assessed
through the ratings of the intensities felt by the participants for eight negative emotions while
exposed to specific film clips. Given the classification of Schaefer and colleagues (2010), we
assumed that intensity rating of anger would be lower with the slight anger film clip than with
one expected to elicit strong anger. This assumption was called the subjective feeling
hypothesis.
9
165
166
167
168
169
170
171
172
173
174
175
176
177
178
179
180
181
182
183
184
185
186
187
188
189
TOWARDS A BETTER UNDERSTANDING OF EMOTION BLENDS 9
Method
Participants and design. Twenty-one participants (volunteers) took part in the study,
12 males and 9 females, aged from 17 to 51 years (M = 29; SD = 11.5). All participants
reported normal or corrected-to-normal vision and audition. The experimental design
consisted of a counterbalanced within-subjects film-clip factor (neutral, slight anger, and
strong anger). The dependent variable was the subjective intensity of eight negative emotions
(i.e., anger, frustration, contempt, disgust, guilt, shame, fear and sadness). Intensity was rated
using a score varying from 0 to 100 for each emotion.
Material. We used the Schaefer’s validated emotional film clip database in which we
selected three film clips on the basis of their propensity to elicit two different levels of anger
and a neutral state. For the anger-inducing film clips, the selection was based first on a set of
10 film clips with high anger discreetness scores (i.e., mean score obtained on the anger item
of the Differential Emotional Scale (DES) (Izard, Dougherty, Bloxom, & Kotsch, 1974),
minus mean scores obtained on all remaining items of the DES). Note that DES scale allows,
through the rating of groups of emotional adjectives, to assess the ability of stimuli to trigger
differentiated emotional feeling states. Then, two of the film clips with the highest anger
discreetness scores (i.e., film clips with the highest propensity to elicit anger) were selected on
the basis of their mean anger scores on the DES. In this way, we chose two film clips that
potentially elicited anger at different levels: slight (no. 30 with a score of 3.16) and strong
(no. 2 with a score of 5.04). For neutral film clip, which was a control condition, we selected a
clip with a very low level on the anger item of DES (score of 1). Precautions were also taken
regarding this clip, for which no other item of DES exceeded a score of 1, thus ensuring that
the film clip could be considered as neutral (no. 49).
The neutral film clip showed a woman walking along the street, the one inducing
slight anger showed a man undergoing intense interrogation, and the one inducing strong
10
190
191
192
193
194
195
196
197
198
199
200
201
202
203
204
205
206
207
208
209
210
211
212
213
214
TOWARDS A BETTER UNDERSTANDING OF EMOTION BLENDS 10
anger showed a man randomly shooting people from his balcony. Unfortunately, the film clips
were of different length. Hence, it was necessary to make some changes to obtain three
comparable videos. First, we shortened the film clip inducing slight anger by cutting some
scenes that did not affect the narrative structure. Secondly, we extended the neutral film clip
using a video scene that matched the rest of the clip, including color and sound, as closely as
possible. In this way, we obtained three film clips of comparable length (mean length = 1 min
55 s; SD = 10 s).
To measure the dependent variable, we used the Emotional Wheel (EW) (Rogé, El
Zufari, Vienne, & Ndiaye, 2015) inspired by the Geneva Emotion Wheel (Scherer, 2005),
which was specifically designed to combine both discrete and dimensional approaches in self-
report assessments of emotion. The EW provides both valence and intensity information about
a set of 16 emotions: eight negative (i.e., anger, frustration, contempt, disgust, guilt, shame,
fear and sadness) and eight positive (i.e., pride, elation, happiness, satisfaction, relief, hope
interest and surprise). As two film clips were selected in order to mainly elicit anger (i.e.,
negative emotion), positive emotions were seen as epiphenomena. Therefore, only negative
emotions were analyzed in this article (also see Rogé et al., 2015 who did the same).
Procedure. Participants were seated comfortably in a quiet room, and completed the
experiment individually. They watched the three film clips, for which the presentation order
has been fully counterbalanced, on a computer screen (visual angle of 32°x21°) and were
asked to rate their emotional state after each clip. To this end, they had to draw a cross, on
each segment (item) of the EW indicating the highest emotional intensities they felt for each
emotion while watching the film clip. Data collected from this EW were the lengths (in mm),
expressed as a percentage, between the beginning of each segment and the mark drawn on it
by the participant. Each length corresponded to an intensity rating of the experienced emotion.
11
215
216
217
218
219
220
221
222
223
224
225
226
227
228
229
230
231
232
233
234
235
236
237
238
TOWARDS A BETTER UNDERSTANDING OF EMOTION BLENDS 11
Intensity was assessed for each emotion and each film clip on the same wheel. This
allowed participants to compare their own assessments while watching the clips and thus
offering them the opportunity to make an accurate emotional appraisal. The total experiment
lasted about 15 minutes.
Results of Experiment 1
The assumptions underlying the ANOVAs were checked using the Kolmogorov–
Smirnov test for normal distribution. Then, we conducted a repeated measure analysis of
variance on the intensity scores, with two within-subjects factors, film clip (neutral vs. slight
anger vs. strong anger) and Emotional Wheel item (anger vs. frustration vs. contempt vs.
disgust vs. guilt vs. shame vs. fear vs. sadness), to study how the participants felt after
viewing the film clips. Comparisons of means were performed using the post-hoc Newman-
Keuls test, and means were considered as significantly different when the probability of a
Type 1 error was less than or equal to 0.05. Pearson correlation coefficients between intensity
of anger and other negative emotions were also calculated. Correlation coefficients were
considered as significant when the probability of a Type 1 error was less than 0.05
Results of the ANOVAs showed significant differences between emotional
assessments of the three film clips (F(2, 40) = 62.8 , p = .001, ηp² = 0.76) as well as
significant differences between assessment the items of the Emotional Wheel (F(7,
140) = 21.16 , p = .001, ηp² = 0.51). The interaction between film clips and items of the
Emotional Wheel was also significant (F(14, 280) = 10.23 , p = .001, ηp² = 0.34).
Regarding anger, comparisons of means showed that the intensities of anger differed
significantly between the three film clips (p < .001). Participants rated a very low level of
anger (M = 1.96, SD = 1.37) for the neutral film clip, a moderate level
(M = 39.16, SD = 5.39) for the slight anger clip, and the highest level (M = 69.05, SD = 5.45)
for the strong anger clip as illustrated by the average emotional assessment for the three film
12
239
240
241
242
243
244
245
246
247
248
249
250
251
252
253
254
255
256
257
258
259
260
261
262
263
TOWARDS A BETTER UNDERSTANDING OF EMOTION BLENDS 12
clips presented in Figure 1. Therefore, it can be concluded that the anger clips elicited two
distinct levels of anger as compared to our control condition (i.e., neutral film clip) supporting
the subjective feelings hypothesis. This finding is also congruent with the study conducted by
Schaefer et al. (2010).
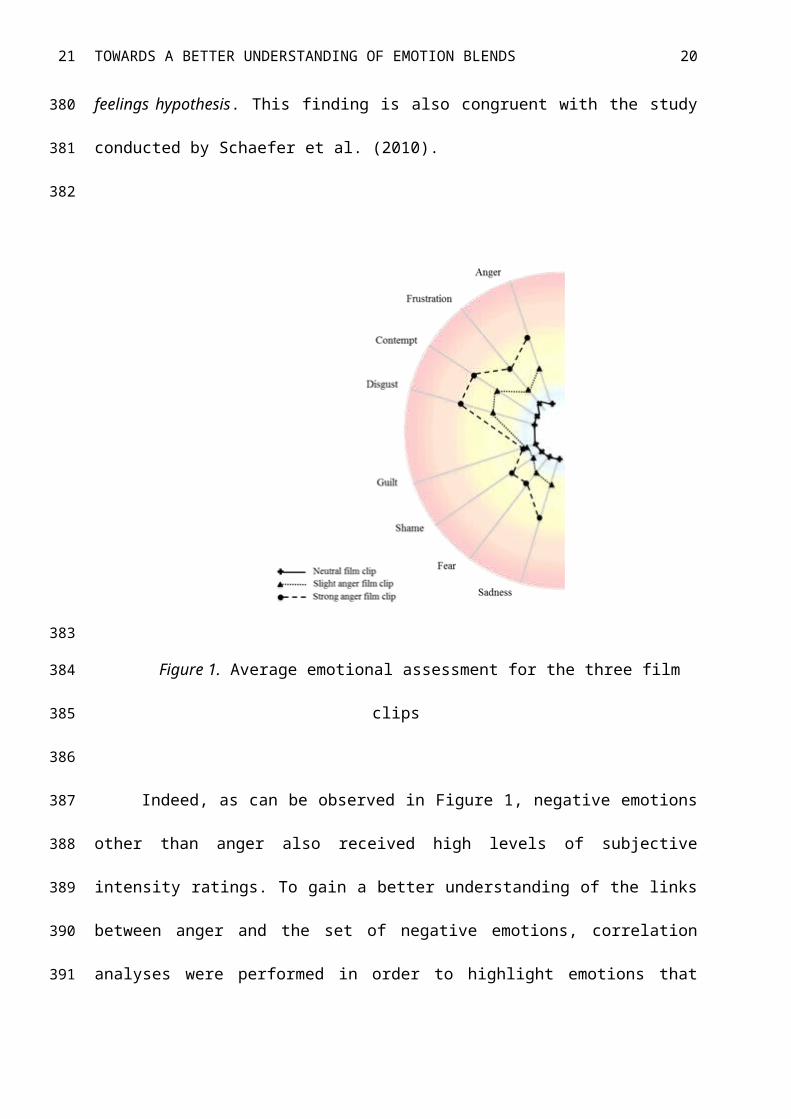
Figure 1. Average emotional assessment for the three film clips
Indeed, as can be observed in Figure 1, negative emotions other than anger also
received high levels of subjective intensity ratings. To gain a better understanding of the links
between anger and the set of negative emotions, correlation analyses were performed in order
to highlight emotions that could vary in the same way as anger. The results presented in Table
1 show that subjective intensity of anger correlated only with sadness for the neutral film clip,
with contempt, guilt and disgust for the slight anger film clip, and with frustration, contempt,
disgust, sadness, fear and shame for the strong film clip.
13
264
265
266
267
268
269
270
271
272
273
274
275
276
277
278
TOWARDS A BETTER UNDERSTANDING OF EMOTION BLENDS 13
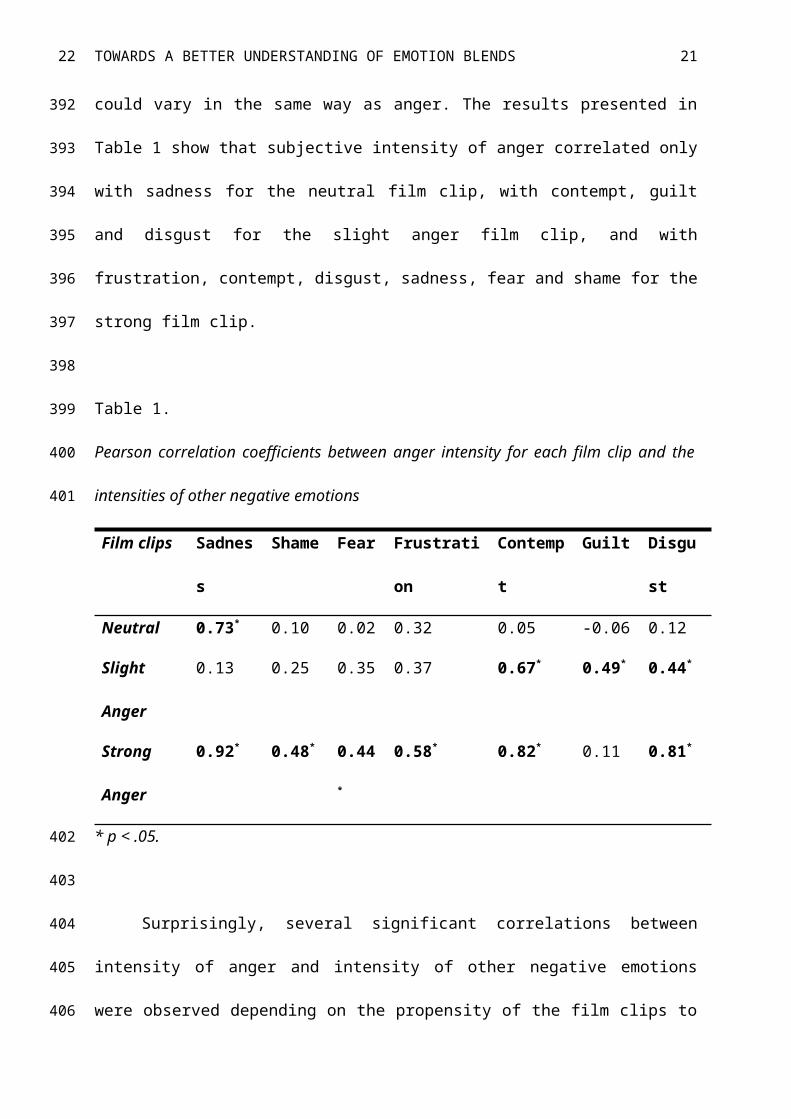
Table 1.
Pearson correlation coefficients between anger intensity for each film clip and the intensities
of other negative emotions
Film clips Sadness Shame Fear Frustration Contempt Guilt Disgust
Neutral 0.73* 0.10 0.02 0.32 0.05 -0.06 0.12
Slight
Anger
0.13 0.25 0.35 0.37 0.67* 0.49* 0.44*
Strong
Anger
0.92* 0.48* 0.44* 0.58* 0.82* 0.11 0.81*
* p < .05.
Surprisingly, several significant correlations between intensity of anger and intensity
of other negative emotions were observed depending on the propensity of the film clips to
elicit anger. It should be noted that anger is a particular emotion which is difficult to induce in
laboratories. Indeed, Harmon-Jones, Amodio and Zinner (2007) argued in a book chapter that
“whereas other emotions can be induced using film clips or photographs, anger is difficult to
induce using such stimuli”.
On the basis of the constructed approach of emotion (Lindquist, Siegel, Quigley, &
Barrett, 2013; Barrett, 2017) which suggests that mixes of emotions are possible, we proposed
a new method of calculation to assess emotion blends. To this end, we developed a global
emotional indicator we named global indicator (GI). It allows investigating the strength of the
relationship between a main emotion elicited and others related to it. In the current study, two
of the film clips used (i.e., slight and strong anger film clips) were previously validated as
mainly eliciting anger (see Schaefer et al., 2010). As a large number of correlations between
14
279
280
281
282
283
284
285
286
287
288
289
290
291
292
293
294
295
296
297
TOWARDS A BETTER UNDERSTANDING OF EMOTION BLENDS 14
anger and other negative emotions was also observed, we decided to build an indicator in
order to take into account the relationship between anger and other negative emotions. To this
end, the strength of the relationship between a given emotion and anger was weighted using
the value of the correlation coefficient between the intensity ratings for both emotions.
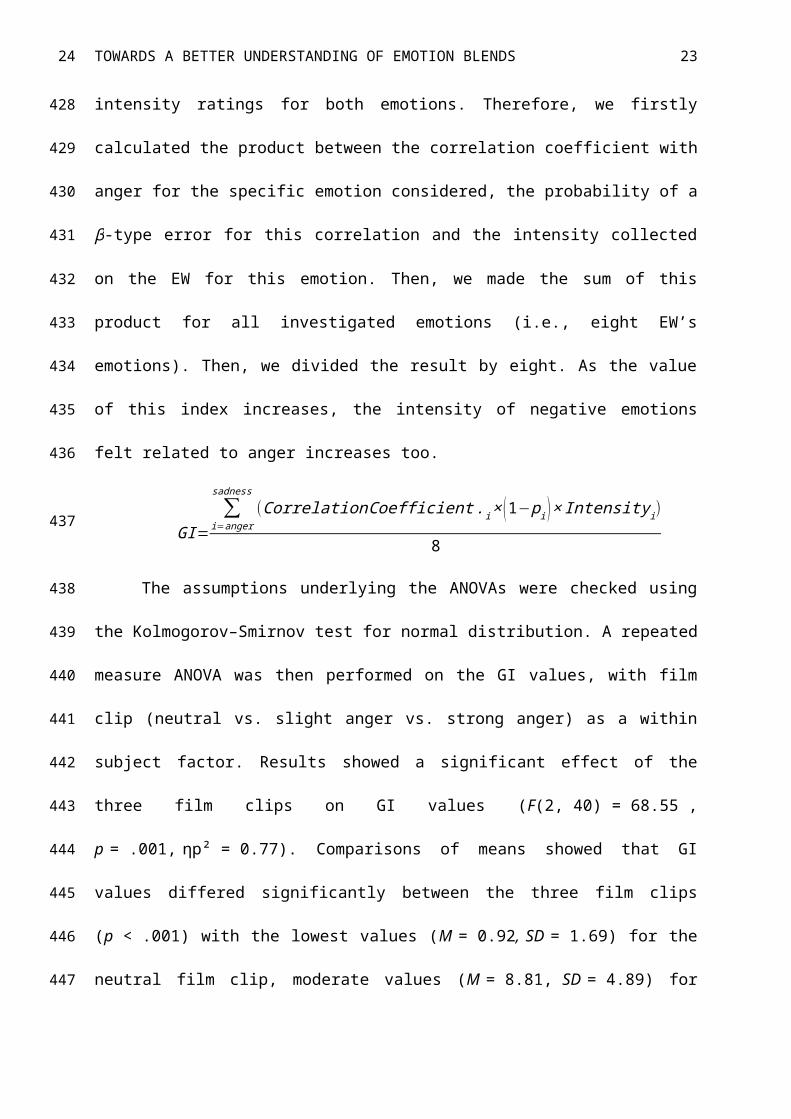
Therefore, we firstly calculated the product between the correlation coefficient with anger for
the specific emotion considered, the probability of a β-type error for this correlation and the
intensity collected on the EW for this emotion. Then, we made the sum of this product for all
investigated emotions (i.e., eight EW’s emotions). Then, we divided the result by eight. As
the value of this index increases, the intensity of negative emotions felt related to anger
increases too.
GI=∑
i=anger
sadness
(CorrelationCoefficient .i × (1−p i )× Intensityi)
8
The assumptions underlying the ANOVAs were checked using the Kolmogorov–
Smirnov test for normal distribution. A repeated measure ANOVA was then performed on the
GI values, with film clip (neutral vs. slight anger vs. strong anger) as a within subject factor.
Results showed a significant effect of the three film clips on GI values (F(2, 40) = 68.55 ,
p = .001, ηp² = 0.77). Comparisons of means showed that GI values differed significantly
between the three film clips (p < .001) with the lowest values (M = 0.92, SD = 1.69) for the
neutral film clip, moderate values (M = 8.81, SD = 4.89) for the slight anger clip, and the
highest values (M = 16.68, SD = 6.49) for the strong anger clip.
The analyses from Experiment 1 showed that the film clips were able to elicit three
different intensities of anger and different blends of other specific negative emotions. The GI
used varied together with the intensities of anger across the conditions, suggesting the
following new categorization: low level emotion blend (LLEB), moderate level emotion blend
(MLEB) and high level emotion blend (HLEB).
15
298
299
300
301
302
303
304
305
306
307
308
309
310
311
312
313
314
315
316
317
318
319
320
321
TOWARDS A BETTER UNDERSTANDING OF EMOTION BLENDS 15
Experiment 2
Assuming the film clips used in Experiment 1 elicited three specific intensities of
anger, and three different emotion blends (LLEB, MLEB and HLEB), the aim of this second
experiment was to examine how cardiovascular patterns might differ between these three
emotional states. In this context several hypotheses were examined.
In line with the results of Experiment 1, it was expected that subjective intensity of
anger would correlate with sadness for the neutral film clip, with contempt, guilt and disgust
for the slight anger clip, and with frustration, contempt, disgust, sadness, fear and shame for
the strong anger clip. We named this the comparable correlations hypothesis.
Based on studies previously mentioned in the introduction, the specific set of negative
emotions that could emerge when watching the film clips should provide an indication of the
effect on cardiac measures. One possibility is that cardiac data would directly reflect how
negative emotions, especially anger were processed. In this case, there would be an increase
in HR and a decrease in HRV (e.g., RMSSD, SD1 and SampEn). We named this the direct
anger pattern hypothesis.
Another possibility is that cardiac data variations reflect emotion regulation strategies.
In that case, there would be a decrease in HR and an increase in HRV (e.g., RMSSD, SD1 and
SampEn). We called this the reappraisal pattern hypothesis.
Furthermore, in view of the evidence for a link between strong negative feelings and
emotion regulation strategies notably raised by Luce et al. (1999), we expected that the
cardiac pattern described above, reflecting these emotion regulation strategies, would occur
when the intensity of anger experienced was the highest, whereas a direct anger pattern (i.e.,
HR increase and a decrease RMSSD, SD1 and SampEn values) should occur for our slight
anger elicitation. Consequently, it is assumed that an intensity threshold could exist between
the MLEB and HLEB. We called this the threshold hypothesis.
16
322
323
324
325
326
327
328
329
330
331
332
333
334
335
336
337
338
339
340
341
342
343
344
345
346
TOWARDS A BETTER UNDERSTANDING OF EMOTION BLENDS 16
Method
Participants and design. Thirty-six participants (18 males, 18 females) took part in
this second experiment, aged between 20 and 43 years (M = 28.5; SD = 6.6). All participants
reported normal or corrected-to-normal vision and audition. A between-subjects design was
used, with film clip as between-subjects factor (neutral, slight anger, and strong anger). The
dependent variables were intensity scores on each segment of the EW (i.e., eight emotions)
and cardiac indices (HR, RMSSD, SD1, and SampEn).
Material and procedure. We used the same three film clips as in Experiment 1,
together with the EW (see above). Three Ag-AgCl pre-gelled electrodes were attached to the
participants, following a modified lead II configuration, to record their cardiac activity.
Electrodes were connected to Bionomadix transmitter (BIOPAC Systems Inc.) allowing
wireless connections with MP150 data recording system (BIOPAC Systems Inc.). After a few
seconds of recording to ensure correct equipment functioning, participants seated comfortably
and were asked to relax during five minutes in order to record cardiac baseline. This five-
minute rest session was divided in two: a first rest session with eyes closed (2 min 30 s) and a
second with eyes open (2 min 30 s). Closed-eye period allowed individuals to calm down,
then opened-eye period was considered as cardiac baseline standard.
They then watched one of the three film clips on a large screen (visual angle of
31° x 17°). The sound track was played through speakers positioned behind the participant in
order to create an immersive watching situation. Participants were randomly assigned to one
of the three experimental conditions. Before and after viewing the film clip, participants were
asked to assess the highest emotional intensities they felt throughout the baseline and the film
clip watching stages respectively using the EW. As for Experiment 1, they had to draw a
cross, on each segment of the EW indicating the highest emotional intensities they felt for
each emotion while watching the film clip. Participants were alone in the room, except for a
17
347
348
349
350
351
352
353
354
355
356
357
358
359
360
361
362
363
364
365
366
367
368
369
370
371
TOWARDS A BETTER UNDERSTANDING OF EMOTION BLENDS 17
short interview at the end of the experiment. The total test lasted about 30 minutes.
Electrocardiogram (ECG) was continuously recorded and sampled at 1000 Hz from the
beginning of the first baseline until the end of the film clip. The ECG was analog low-pass
(0.05 Hz) and high-pass (35 Hz) filtered at acquisition, as approximately 5–30 Hz range
covers most of the frequency content of QRS complex (Pahlm & Sörnmo, 1984). Triggers
were manually positioned during the recording to define the beginning and the end of each
baseline and film clip session.
Measures and data processing. Subjective emotional state was assessed using the
EW as in Experiment 1. More precisely, data collected from this questionnaire were the
lengths (in mm), expressed as a percentage, between the beginning of each segment and the
mark drawn on it by the participant. Each length corresponded to an intensity rating of the
experienced emotion. As for Experiment 1, only negative emotions were analyzed. For the
physiological emotional state, the recorded cardiac signal was processed in order to calculate
different metrics. First, each participant’s filtered cardiac signal was visually checked to
correct any artifacts (see Berntson et al., 1997; Berntson & Stowell, 1998 for artifact
correction methods used). R peaks were detected on cardiac signal in order to calculate R-R
intervals corresponding to the time between two R peaks.
Several indexes were then calculated with RR interval series using Kubios HRV
software v.2.2. First, HR was computed in beats per minute (b.p.m.). HRV metrics were also
computed. For HRV time domains, the square root of the mean squared differences of
successive NN intervals (RMSSD) was calculated. Indeed, “In contrast to other time-domain
(i.e., pNN50) and time-frequency (i.e., HF-HRV) measures, changes in breathing rate have
been found to not significantly affect RMSSD” (Penttilä et al., 2001). Regarding HRV non-
linear domains, the Poincaré plot provided a graphic display of the correlations between
successive RR intervals (i.e., plot of RRj+1 as a function of RRj). Standard deviation of the
18
372
373
374
375
376
377
378
379
380
381
382
383
384
385
386
387
388
389
390
391
392
393
394
395
396
TOWARDS A BETTER UNDERSTANDING OF EMOTION BLENDS 18
points perpendicular to the line of identity denoted by SD1 was analyzed in order to
parameterize the shape’s ellipse formed by cloud points describing short-term variability in
cardiac rhythm. Finally, SampEn was computed by computing and comparing vectors derived
from RR intervals series (See Tarvainen (2014) for more information about how ApEn and
SampEn are calculated).
Results of Experiment 2
Subjective emotional assessment. The assumptions underlying the ANOVAs were
checked using the Kolmogorov–Smirnov test for normal distribution and Levene’s test for
variance homogeneity for all analyses. The similarity of the three film clip groups (neutral,
slight anger and strong anger) in terms of subjective emotional state at the beginning of the
experiment (i.e. before watching the film clip) was checked using the Kruskal-Wallis test due
to non-normal distribution of emotional intensity as illustrated by the average emotional
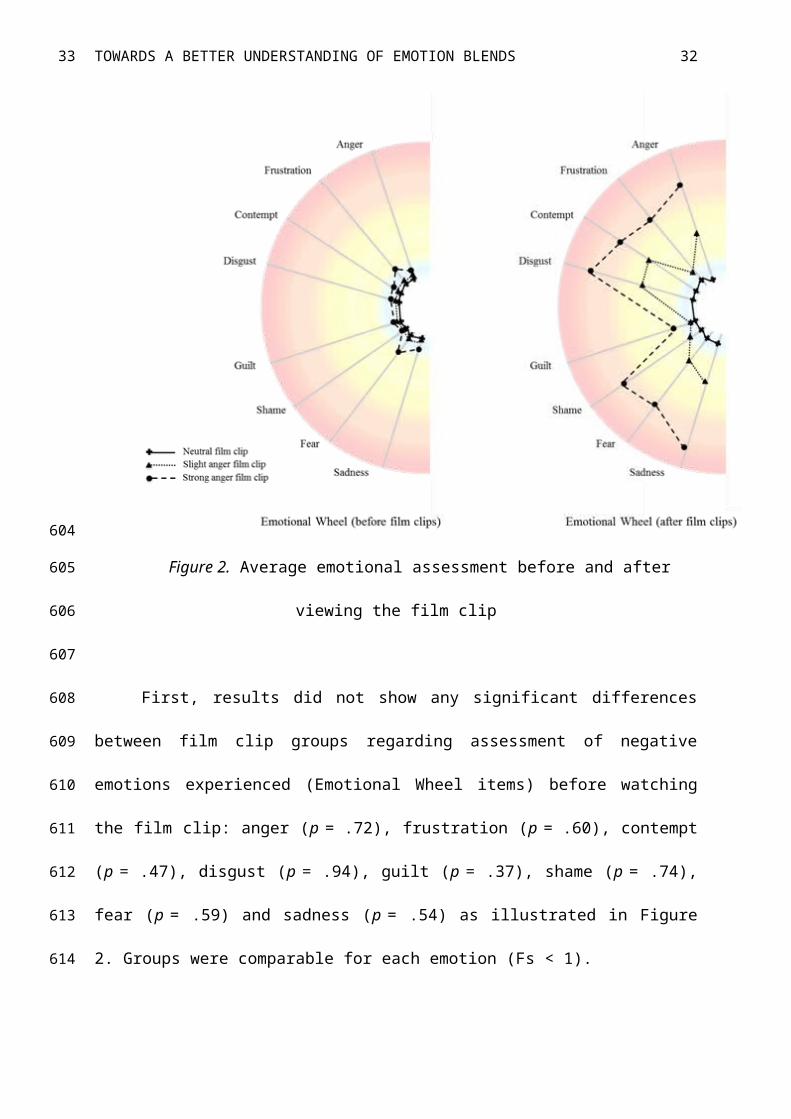
assessment before viewing the film clip presented in Figure 2.
To study whether the film clips elicited three subjectively felt intensities of anger, we
conducted an ANOVA with film clip (neutral vs. slight anger vs. strong anger) as between-
subjects factor and Emotional Wheel item (anger vs. frustration vs. contempt vs. disgust vs.
guilt vs. shame vs. fear vs. sadness) as within-subjects factor. Comparisons of means were
conducted using a post-hoc Newman-Keuls test, and means were considered as significantly
different when the probability of a Type 1 error was less than or equal to 0.05.
Pearson correlation coefficients were calculated between subjective intensity of anger
and other negative emotions as in Experiment 1 in order to investigate their potential
relationships (note that correlation coefficients were again considered as significant when the
probability of a Type 1 error was less than 0.05).
To study whether the film clips elicited three distinct emotion blends, we conducted an
ANOVA on global indicator values, with the film clips (neutral vs. slight anger vs. strong
19
397
398
399
400
401
402
403
404
405
406
407
408
409
410
411
412
413
414
415
416
417
418
419
420
421
TOWARDS A BETTER UNDERSTANDING OF EMOTION BLENDS 19
anger) as between-subjects factor. Comparisons of means were conducted using a post-hoc
Newman-Keuls test.
Figure 2. Average emotional assessment before and after viewing the film clip
First, results did not show any significant differences between film clip groups
regarding assessment of negative emotions experienced (Emotional Wheel items) before
watching the film clip: anger (p = .72), frustration (p = .60), contempt (p = .47), disgust
(p = .94), guilt (p = .37), shame (p = .74), fear (p = .59) and sadness (p = .54) as illustrated
in Figure 2. Groups were comparable for each emotion (Fs < 1).
Secondly, significant differences were found between emotional assessments of the
three film clips (F(2, 33) = 34.73, p = .001, ηp² = 0.678) and between assessment of negative
emotions (Emotional Wheel items) (F(7, 231) = 16.23, p = .001, ηp² = 0.33). The interaction
20
422
423
424
425
426
427
428
429
430
431
432
433
434
435
TOWARDS A BETTER UNDERSTANDING OF EMOTION BLENDS 20
between film clips and Emotional Wheel item was also significant (F(14, 231) = 5.52,
p = .001, ηp² = 0.25). In addition, Newman-Keuls post hoc tests revealed that intensities of
anger differed significantly between each film clip (p < .001). The neutral film clip triggered a
very low level of anger (M = 2.72, SD = 2.85), the slight anger clip a moderate level of anger
(M = 42.92, SD = 19.17), and the strong anger clip was rated with the highest intensity
(M = 70.45, SD = 14.22). This result is consistent with the anger intensity pattern observed in
Experiment 1.
As shown in Experiment 1, exposure to film clips elicited other negative emotions (see
Figure 2, after film clips). Correlation results, which are reported in Table 2 indicated that
intensity of anger correlated with sadness, shame and guilt for the neutral film clip; with
shame, contempt and disgust for the slight anger film clip; and with sadness, shame,
frustration, contempt, guilt and disgust for the strong anger clip.
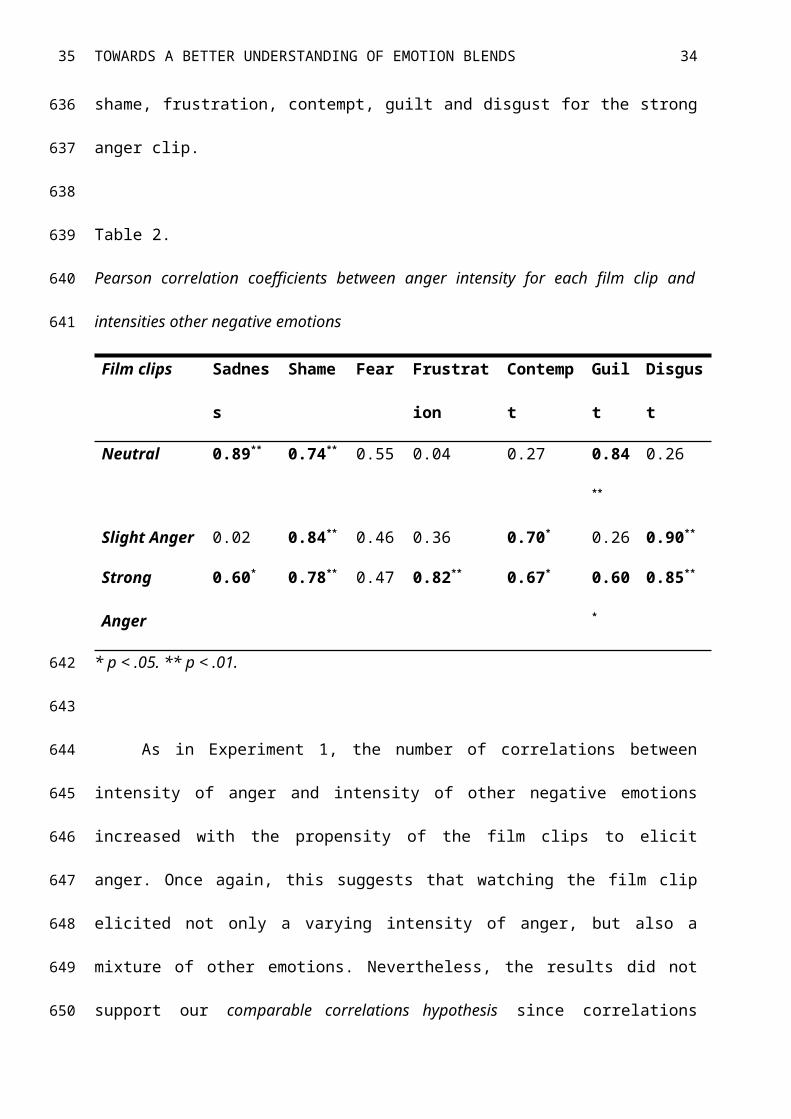
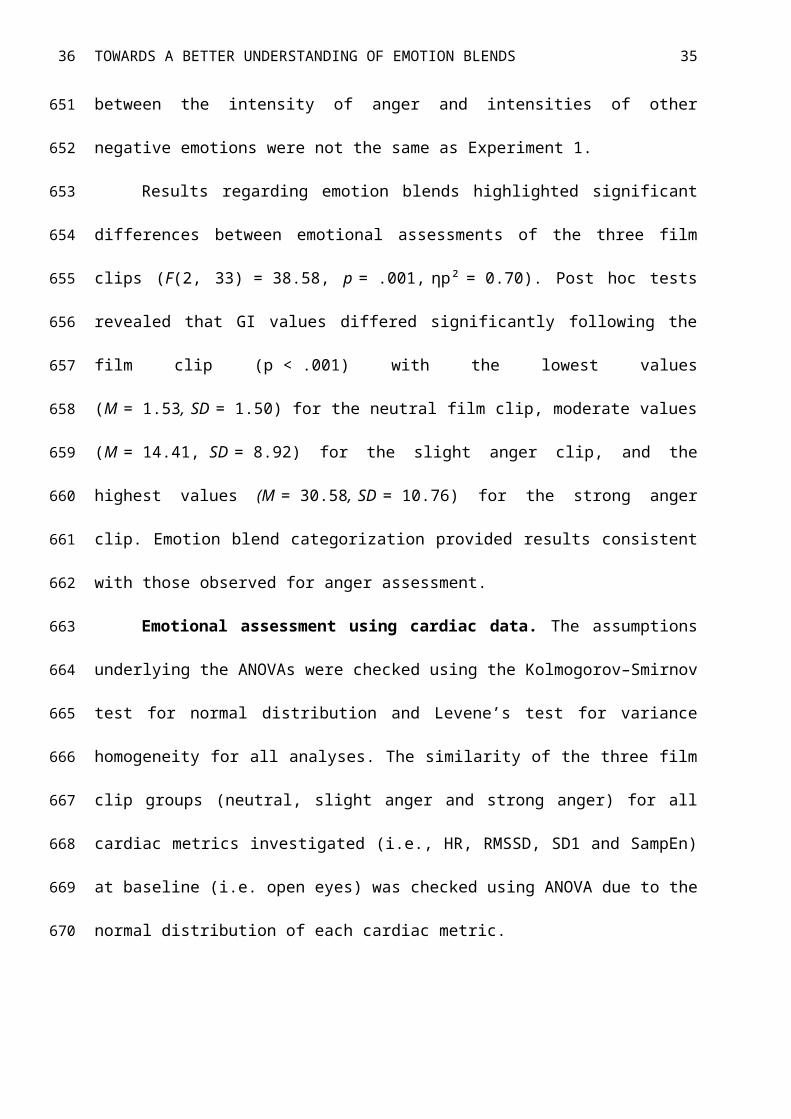
Table 2.
Pearson correlation coefficients between anger intensity for each film clip and intensities
other negative emotions
Film clips Sadness Shame Fear Frustration Contempt Guilt Disgust
Neutral 0.89** 0.74** 0.55 0.04 0.27 0.84** 0.26
Slight Anger 0.02 0.84** 0.46 0.36 0.70* 0.26 0.90**
Strong Anger 0.60* 0.78** 0.47 0.82** 0.67* 0.60* 0.85**
* p < .05. ** p < .01.
As in Experiment 1, the number of correlations between intensity of anger and
intensity of other negative emotions increased with the propensity of the film clips to elicit
anger. Once again, this suggests that watching the film clip elicited not only a varying
21
436
437
438
439
440
441
442
443
444
445
446
447
448
449
450
451
452
453
454
455
456
TOWARDS A BETTER UNDERSTANDING OF EMOTION BLENDS 21
intensity of anger, but also a mixture of other emotions. Nevertheless, the results did not
support our comparable correlations hypothesis since correlations between the intensity of
anger and intensities of other negative emotions were not the same as Experiment 1.
Results regarding emotion blends highlighted significant differences between
emotional assessments of the three film clips (F(2, 33) = 38.58, p = .001, ηp² = 0.70). Post
hoc tests revealed that GI values differed significantly following the film clip (p < .001) with
the lowest values (M = 1.53, SD = 1.50) for the neutral film clip, moderate values
(M = 14.41, SD = 8.92) for the slight anger clip, and the highest values
(M = 30.58, SD = 10.76) for the strong anger clip. Emotion blend categorization provided
results consistent with those observed for anger assessment.
Emotional assessment using cardiac data. The assumptions underlying the
ANOVAs were checked using the Kolmogorov–Smirnov test for normal distribution and
Levene’s test for variance homogeneity for all analyses. The similarity of the three film clip
groups (neutral, slight anger and strong anger) for all cardiac metrics investigated (i.e., HR,
RMSSD, SD1 and SampEn) at baseline (i.e. open eyes) was checked using ANOVA due to
the normal distribution of each cardiac metric.
In order to study whether film clips elicited different physiological emotional states,
statistical analyses were conducted on the cardiac data collected while watching the film clips.
For metric distributions, data normality and homogeneity were checked as previously and
suitable statistical tests were then applied. Once normality had been checked (i.e., HR and
SampEn), we conducted ANOVAs with film clip as between-subjects factor (neutral vs. slight
anger vs. strong anger). Comparisons of means were also conducted using a post-hoc
Newman-Keuls test, and means were considered as significantly different when the
probability of a Type 1 error was less than or equal to 0.05. By contrast, when cardiac metric
values did not follow a normal distribution (i.e., RMSSD, SD1), a Kruskal-Wallis test was
22
457
458
459
460
461
462
463
464
465
466
467
468
469
470
471
472
473
474
475
476
477
478
479
480
481
TOWARDS A BETTER UNDERSTANDING OF EMOTION BLENDS 22
performed using film clip as between-subjects factor (neutral vs. slight anger vs. strong
anger). Mann-Whitney tests were then conducted to compare groups.
Pearson correlation coefficients were also calculated between subjective intensity of
anger, GI values, and cardiac indexes in order to investigate the links between subjective
emotional assessment and cardiac data.
First, results at baseline did not show any significant differences between groups for
any cardiac metric values (p > .05). These results indicate that groups were comparable
regarding cardiac metrics at baseline as illustrated by the means and standard deviations for
each cardiac metric at baseline in Table 3.
Table 3.
Means and standard deviations for each cardiac metric at baseline according to the
experimental conditions
Film clips HR RMSSD SD1 SampEn
Neutral M = 74.24, SD = 12.
43
M = 39.51, SD = 19.
73
M = 28.05, SD = 14.
02
M = 1.48, SD = .37
Slight
Anger
M = 66.05, SD = 7.6
4
M = 80.24, SD = 48.
75
M = 56.99, SD = 34.
64
M = 1.46, SD = .24
Strong
Anger
M = 65.48, SD = 9.9
3
M = 62.62, SD = 45.
15
M = 44.46, SD = 32.
08
M = 1.77, SD = .46
Results showed a significant effect of film clip (F(2, 33) = 5.73, p = .007, ηp² = 0.26,
CI = [64.04, 71.75]) for HR, with significant differences between the neutral
(M = 75.59, SD = 12.95) and slight anger (M = 66.12, SD = 7.19) clips, and differences
between the neutral and the strong anger clips (M = 61.97, SD = 9.32), indicating that anger
elicited lower HR than a neutral situation.
23
482
483
484
485
486
487
488
489
490
491
492
493
494
495
496
497
498
499
500
TOWARDS A BETTER UNDERSTANDING OF EMOTION BLENDS 23
Film clip had a significant effect on RMSSD values (H(2, 36) = 7.59, p = .02,
CI = [41.68, 72.64]), with significant differences between the neutral (M = 36.72, SD =21.89)
and slight anger (M = 65.27, SD = 33.26) clips, and differences between neutral and strong
anger clips (M = 69.48, SD = 66.20).
For non-linear measures, a significant effect of film clip was found on SD1 values
(H(2, 36) = 7.47, p = .02, CI = [29.6, 51.61]), with significant differences between neutral
(M = 26.08, SD = 15.56) and slight anger (M = 46.36, SD = 23.64) groups. Trends (p = .051)
were also observed between neutral and strong anger groups (M = 49.38, SD = 47.08), and
between slight anger and strong anger groups (p = .055).
The final indicator was SampEn. Results showed a significant effect of film clip
(F(2, 32) = 6.67, p = .004, ηp² = .29, CI = [-1.22, 9.99]), with significant differences between
neutral (M = 1.41, SD = .31) and slight anger groups (M = 1.89, SD = .37), and between slight
anger and strong anger groups (M = 1.57, SD = .30).
Considering only cardiac data, results are consistent with the reappraisal pattern
hypothesis but not with the direct anger pattern hypothesis. This suggests that anger-eliciting
film clips likely lead individuals to establish emotion-regulation strategies. Unexpectedly, our
results did not show a cardiac reappraisal pattern only for the highest induced intensity of
anger. Hence, they are not consistent with the threshold hypothesis. This point will be
discussed in the general discussion.
General Discussion
The aim of the present research was to study the effects of specific intensities of anger
on subjective and cardiac features of an individual’s emotional state. The first experiment
showed the ability of a set of film clips to elicit three subjective intensities of anger: a very
low one (i.e., neutral state) and two levels of anger. Results suggested that film clips elicited,
not only anger, but also other negative emotions. A global indicator (GI) of emotions felt
24
501
502
503
504
505
506
507
508
509
510
511
512
513
514
515
516
517
518
519
520
521
522
523
524
525
TOWARDS A BETTER UNDERSTANDING OF EMOTION BLENDS 24
allows us to highlight that films clips elicited three specific negative emotion blends (i.e., low,
moderate and high). Experiment 2 provided comparable results for the subjective emotional
assessment since the anger intensity ratings and the GI values both showed similar ranges to
the first experiment (i.e., a low level, a moderate one and high one).
Interestingly, the results of both experiments showed that the number of correlations
between intensity of anger and intensity of other negative emotions increased with the
propensity of the film clips to elicit anger. This suggests that film clips used to elicit anger
have the ability to converge negative emotions toward overall negative states depending on
the level of anger intensity they elicit. As the intensity of anger and other negative emotions
(e.g., the emotion blends) increase, individuals may have a less accurate assessment of their
own emotions. Indeed, as intensity is a concept related to the way that individuals are affected
by stimuli (Scherer et al., 2013), it is possible that the overall negative states triggered by
anger-inducing film clips emotionally overwhelm individuals. Consequently, they likely fail
to assess their emotional state accurately.
Furthermore, cardiac data are consistent with a reappraisal pattern for both anger
conditions. Indeed, anger-eliciting film clips led to lower HR than the neutral clip. This result
is in line with other studies that found HR deceleration due to negative emotion elicitations
(Kuoppa et al., 2016; Sarlo et al., 2005; Stemmler et al., 2007) and emotion-regulation
strategies (Denson et al., 2011). In addition, higher values for RMSSD and SD1 were
observed when individuals watched the anger film clips. This increase in short-term
variability is associated with high frequency variations in cardiac rhythm. This testifies to the
dominance of the parasympathetic branch of the ANS. It also suggests the establishment of
emotion-regulation strategies (Berntson, Cacioppo, & Quigley, 1993; Butler, Wilhelm, &
Gross, 2006; Denson et al., 2011; León, Hernández, Rodríguez, & Vila, 2009). Furthermore,
according to Valenza et al. (2012), entropy is higher when the parasympathetic branch of
25
526
527
528
529
530
531
532
533
534
535
536
537
538
539
540
541
542
543
544
545
546
547
548
549
550
TOWARDS A BETTER UNDERSTANDING OF EMOTION BLENDS 25
ANS is in control. Consequently, the significantly higher value for SampEn when participants
were watching the slight anger film clip is congruent with an emotion-regulation strategy.
Nevertheless, significant differences only appeared between the neutral and slight anger
groups. An explanation could be that SampEn was influenced by specific emotions only
contained in the mixture of negative emotions elicited by film clip associated with slight
anger as illustrated in Table 2.
The next question is why participants seemed reappraise their feelings when watching
both anger-eliciting film clips. As described above, anger intensities correlated with other
negative emotions. Since the intensity of subjective anger and the number of converging
negative emotions was higher following the two anger-eliciting film clips than the neutral
clip, we can assume that highly negative states resulted from watching these clips. According
to Luce et al. (1999), emotion-regulation strategies are established when highly intense
negative emotions are experienced. Hence, it can be assumed that the highly negative states
elicited by the anger-eliciting film clips triggered a greater need to reappraise the situation.
However, why did the appraisal pattern not only appear for the film clip supposed to
elicit strong anger? According to Luce et al. (1999) and Yao and Lin (2015), high intensities
of negative emotions could be involved in the emergence of emotion-regulation strategies. In
the present study, the possible anger threshold predicting which cardiac pattern would be
expressed does not appear to be located between slight anger and strong anger intensity as
expected, but before our slight anger condition. Moreover, one of the key features of the
reappraisal approach is the immediate emergence of cognitive processes of coping strategies
when faced with an emotional event (Niedenthal, Krauth-Gruber, & Ric, 2006).
Consequently, it is possible that both anger film clips were emotionally appraised as eliciting
a sufficient intensity of anger for the establishment of emotion-regulation strategies. This
regulatory effort interpretation of the results is in line with the polyvagal theory (Porges,
26
551
552
553
554
555
556
557
558
559
560
561
562
563
564
565
566
567
568
569
570
571
572
573
574
575
TOWARDS A BETTER UNDERSTANDING OF EMOTION BLENDS 26
1995; Porges, Doussard-Roosevelt, & Maiti, 1994; Porges, Doussard-Roosevelt, Portales, &
Greenspan, 1996). This model postulates that the vagus nerve, which is involved in ANS
parasympathetic activity, reflects active engagement with the environment in line with
emotion-regulation strategies. Unfortunately, our protocol did not enable us to identify this
threshold. Future studies should investigate more intensities of negative emotion to address
this issue.
Our research also raises issues about how to precisely assess emotional state. As a
complement to basic approaches of emotions which distinguish emotions according to
specific labels and “ANS fingerprints”(e.g., Ekman, 1992; Saarimäki et al., 2016) or
dimensional approaches only accounting for some dimensions like valence and arousal (e.g.,
Russell, 1980), our results are particularly congruent with appraisal theories of emotion (e.g.,
Scherer, 2009). Indeed, as attested by the cognitive reappraisal pattern we found, emotions
seem to emerge after a cognitive appraisal where a stimulus is evaluated for its meaning.
Furthermore, according to Siegel et al. (2018), the classical view of emotion that
consider some emotion categories having a specific autonomic nervous system (ANS)
“fingerprint”, has some weaknesses and need to be questioned. Indeed, for a given emotion
category, ANS variations are the result of random error or epiphenomenon (e.g., the method
used to elicit emotion). The work carried out by Feldman Barrett describing a new approach
of emotion, called the theory of constructed emotion (Barrett, 2017), provides interesting
outputs for a better understanding of the nature of emotion. It hypothesizes that emotion is a
complex entity and that “an emotion category is a population of context-specific, highly
variable instances that need not share an ANS fingerprint” (Siegel et al., 2018). The same
authors also suggest that “ANS patterns are expected to be highly variable within an emotion
category and to overlap with other categories”. Therefore, we can talk about emotion as a
global phenomenon consisting of many instances. In accordance with Barrett (2017); Siegel et
27
576
577
578
579
580
581
582
583
584
585
586
587
588
589
590
591
592
593
594
595
596
597
598
599
600
TOWARDS A BETTER UNDERSTANDING OF EMOTION BLENDS 27
al., (2018) we consider emotions as a complex entities and we argue that emotion would be
formed by a mix of feelings related to a main emotion. The number of emerging emotions for
each film clip and the correlations observed between the intensity of anger felt and other
negative emotions in this study effectively shows the difficulty to elicit an emotion in
isolation. GI could offer a promising global emotional assessment of negative emotions taking
into account the relationships between a main emotion and others related.
28
601
602
603
604
605
606
607
608
TOWARDS A BETTER UNDERSTANDING OF EMOTION BLENDS 28
References
Appelhans, B. M., & Luecken, L. J. (2006). Heart rate variability as an index of regulated
emotional responding. Review of General Psychology, 10(3), 229–240.
https://doi.org/10.1037/1089-2680.10.3.229
Baldaro, B., Mazzetti, M., Codispoti, M., Tuozzi, G., Bolzani, R., & Trombini, G. (2001).
Autonomic Reactivity during Viewing of an Unpleasant Film. Perceptual and Motor
Skills, 93(3), 797–805. https://doi.org/10.2466/pms.2001.93.3.797
Barrett, L. F. (2017). The theory of constructed emotion: an active inference account of
interoception and categorization. Social Cognitive and Affective Neuroscience, 12(1),
1–23. https://doi.org/10.1093/scan/nsw154
Belzung, C. (2007). Biologie des émotions (de Boeck).
Berntson, G. G., Cacioppo, J. T., & Quigley, K. S. (1993). Respiratory sinus arrhythmia:
Autonomic origins, physiological mechanisms, and psychophysiological implications.
Psychophysiology, 30(2), 183–196.
Berntson, G. G., & Stowell, J. R. (1998). ECG artifacts and heart period variability: don’t
miss a beat! Psychophysiology, 35(1), 127–132.
Berntson, G. G., Thomas Bigger, J., Eckberg, D. L., Grossman, P., Kaufmann, P. G., Malik,
M., … Van Der Molen, M. W. (1997). Heart rate variability: Origins, methods, and
interpretive caveats. Psychophysiology, 34(6), 623–648.
Butler, E. A., Wilhelm, F. H., & Gross, J. J. (2006). Respiratory sinus arrhythmia, emotion,
and emotion regulation during social interaction. Psychophysiology, 43(6), 612–622.
Cabral, J. C. C., Tavares, P. de S., Weydmann, G. J., das Neves, V. T., & de Almeida, R. M.
M. (2018). Eliciting Negative Affects Using Film Clips and Real-Life Methods.
Psychological Reports, 121(3), 527–547. https://doi.org/10.1177/0033294117730844
29
609
610
611
612
613
614
615
616
617
618
619
620
621
622
623
624
625
626
627
628
629
630
631
632
TOWARDS A BETTER UNDERSTANDING OF EMOTION BLENDS 29
Cacioppo, J. T., Klein, D. J., Berntson, G. C., & Hatfield, E. (1993). The Psychophysiology of
Emotion. In The handbook of emotion (M. Lewis, J.M. Haviland (Eds.), pp. 119–142).
New York: Guilford Press.
Clore, G. L., & Ortony, A. (2000). Cognitive Neuroscience of Emotion. In R. D. R. Lane, L.
Nadel, G. L. Ahern, J. Allen, & A. W. Kaszniak (Eds.), Cognitive Neuroscience of
Emotion (pp. 24–61). Oxford University Press.
Denson, T. F., Grisham, J. R., & Moulds, M. L. (2011). Cognitive reappraisal increases heart
rate variability in response to an anger provocation. Motivation and Emotion, 35(1),
14–22.
Ekman, P. (1984). Expression and the nature of emotion. In Approaches to emotion (P.
Ekman, K. Scherer (Eds.), pp. 319–343). Hilsdale, NJ: Lawrence Erlbaum Associates,
Inc.
Ekman, P. (1992). An argument for basic emotions. Cognition and Emotion, 6(3–4), 169–200.
https://doi.org/10.1080/02699939208411068
Fairclough, S. H., & Spiridon, E. (2012). Cardiovascular and electrocortical markers of anger
and motivation during a simulated driving task. International Journal of
Psychophysiology, 84(2), 188–193. https://doi.org/10.1016/j.ijpsycho.2012.02.005
Fernández, C., Pascual, J. C., Soler, J., Elices, M., Portella, M. J., & Fernández-Abascal, E.
(2012). Physiological Responses Induced by Emotion-Eliciting Films. Applied
Psychophysiology and Biofeedback, 37(2), 73–79. https://doi.org/10.1007/s10484-
012-9180-7
Frijda, N. H. (1986). The Emotions. Cambridge University Press.
Fontaine, J. R. J., Scherer, K. R., Roesch, E. B., & Ellsworth, P. C. (2007). The world of
emotions is not two-dimensional. Psychological Science, 18(12), 1050–1057.
https://doi.org/10.1111/j.1467-9280.2007.02024.x
30
633
634
635
636
637
638
639
640
641
642
643
644
645
646
647
648
649
650
651
652
653
654
655
656
657
TOWARDS A BETTER UNDERSTANDING OF EMOTION BLENDS 30
Goshvarpour, A., Abbasi, A., & Goshvarpour, A. (2017). Indices from lagged poincare plots
of heart rate variability: an efficient nonlinear tool for emotion discrimination.
Australasian Physical & Engineering Sciences in Medicine, 40(2), 277–287.
https://doi.org/10.1007/s13246-017-0530-x
Gross, J. J. (1998). The emerging field of emotion regulation: An integrative review. Review
of General Psychology, 2(3), 271–299. https://doi.org/10.1037/1089-2680.2.3.271
Gross, J. J., & Levenson, R. W. (1995). Emotion elicitation using films. Cognition &
Emotion, 9(1), 87–108. https://doi.org/10.1080/02699939508408966
Harmon-Jones, E. (2007). Trait anger predicts relative left frontal cortical activation to anger-
inducing stimuli. International Journal of Psychophysiology, 66(2), 154–160.
https://doi.org/10.1016/j.ijpsycho.2007.03.020
Izard, C. E. (1977). Human Emotions. New York: Plenum Press. Retrieved from
http://www.springer.com/us/book/9780306309861
Izard, C. E., Dougherty, F. E., Bloxom, B. M., & Kotsch, N. E. (1974). The Differential
Emotions Scale: A method of measuring the subjective experience of discrete
emotions. Nashville: Vanderbilt University, Department of Psychology.
Kleinginna, P. R., & Kleinginna, A. M. (1981). A categorized list of emotion definitions, with
a suggestion for a consensual definition. Motivation and Emotion, 5(3), 263–291.
https://doi.org/10.1007/BF00993889
Kreibig, S. D. (2010). Autonomic nervous system activity in emotion: A review. Biological
Psychology, 84(3), 394–421. https://doi.org/10.1016/j.biopsycho.2010.03.010
Kuoppa, P., Tarvainen, M. P., Karhunen, L., & Narvainen, J. (2016). Heart rate reactivity
associated to positive and negative food and non-food visual stimuli (pp. 5279–5282).
IEEE. https://doi.org/10.1109/EMBC.2016.7591918
31
658
659
660
661
662
663
664
665
666
667
668
669
670
671
672
673
674
675
676
677
678
679
680
681
682
TOWARDS A BETTER UNDERSTANDING OF EMOTION BLENDS 31
León, I., Hernández, J. A., Rodríguez, S., & Vila, J. (2009). When head is tempered by heart:
Heart rate variability modulates perception of other-blame reducing anger. Motivation
and Emotion, 33(1), 1–9. https://doi.org/10.1007/s11031-008-9112-2
Levenson, R. W., Ekman, P., & Friesen, W. V. (1990). Voluntary facial action generates
emotion-specific autonomic nervous system activity. Psychophysiology, 27(4), 363–
384.
Lindquist, K. A., Barrett, L. F., Bliss-Moreau, E., & Russell, J. A. (2006). Language and the
perception of emotion. Emotion, 6(1), 125–138. https://doi.org/10.1037/1528-
3542.6.1.125
Lobbestael, J., Arntz, A., & Wiers, R. W. (2008). How to push someone’s buttons: A
comparison of four anger-induction methods. Cognition & Emotion, 22(2), 353–373.
https://doi.org/10.1080/02699930701438285
Luce, M. F., Payne, J. W., & Bettman, J. R. (1999). Emotional Trade-Off Difficulty and
Choice. Journal of Marketing Research, 36(2), 143. https://doi.org/10.2307/3152089
Macatee, R. J., Albanese, B. J., Schmidt, N. B., & Cougle, J. R. (2017). The moderating
influence of heart rate variability on stressor-elicited change in pupillary and
attentional indices of emotional processing: An eye-Tracking study. Biological
Psychology, 123, 83–93. https://doi.org/10.1016/j.biopsycho.2016.11.013
Marci, C. D., Glick, D. M., Loh, R., & Dougherty, D. D. (2007). Autonomic and prefrontal
cortex responses to autobiographical recall of emotions. Cognitive, Affective, &
Behavioral Neuroscience, 7(3), 243–250. https://doi.org/10.3758/CABN.7.3.243
Niedenthal, P. M., Krauth-Gruber, S., & Ric, F. (2006). Psychology of emotion: interpersonal,
experiential, and cognitive approaches. New York: Psychology Press.
32
683
684
685
686
687
688
689
690
691
692
693
694
695
696
697
698
699
700
701
702
703
704
705
TOWARDS A BETTER UNDERSTANDING OF EMOTION BLENDS 32
Pahlm, O., & Sörnmo, L. (1984). Software QRS detection in ambulatory monitoring — a
review. Medical & Biological Engineering & Computing, 22(4), 289–297.
https://doi.org/10.1007/BF02442095
Pauls, C. A., & Stemmler, G. (2003). Repressive and defensive coping during fear and anger.
Emotion, 3(3), 284–302. https://doi.org/10.1037/1528-3542.3.3.284
Penttilä, J., Helminen, A., Jartti, T., Kuusela, T., Huikuri, H. V., Tulppo, M. P., … Scheinin,
H. (2001). Time domain, geometrical and frequency domain analysis of cardiac vagal
outflow: effects of various respiratory patterns. Clinical Physiology (Oxford,
England), 21(3), 365–376.
Plutchik, R. (2001). The Nature of Emotions. American Scientist, 89(4), 344.
https://doi.org/10.1511/2001.4.344
Porges, S. W. (1995). Orienting in a defensive world: Mammalian modifications of our
evolutionary heritage. A Polyvagal Theory. Psychophysiology, 32(4), 301–318.
https://doi.org/10.1111/j.1469-8986.1995.tb01213.x
Porges, S. W., Doussard-Roosevelt, J. A., & Maiti, A. K. (1994). Vagal tone and the
physiological regulation of emotion. Monographs of the Society for Research in Child
Development, 59(2–3), 167–186. https://doi.org/10.1111/j.1540-5834.1994.tb01283.x
Porges, S. W., Doussard-Roosevelt, J. A., Portales, A. L., & Greenspan, S. I. (1996). Infant
regulation of the vagal ?brake? predicts child behavior problems: A psychobiological
model of social behavior. Developmental Psychobiology, 29(8), 697–712.
https://doi.org/10.1002/(SICI)1098-2302(199612)29:8<697::AID-DEV5>3.0.CO;2-O
Ravaja, N. (2004). Contributions of Psychophysiology to Media Research: Review and
Recommendations. Media Psychology, 6(2), 193–235.
https://doi.org/10.1207/s1532785xmep0602_4
33
706
707
708
709
710
711
712
713
714
715
716
717
718
719
720
721
722
723
724
725
726
727
728
729
TOWARDS A BETTER UNDERSTANDING OF EMOTION BLENDS 33
Riganello, F., Cortese, M. D., Arcuri, F., Quintieri, M., & Dolce, G. (2015). How Can Music
Influence the Autonomic Nervous System Response in Patients with Severe Disorder
of Consciousness? Frontiers in Neuroscience, 9.
https://doi.org/10.3389/fnins.2015.00461
Rogé, J., El Zufari, V., Vienne, F., & Ndiaye, D. (2015). Safety messages and visibility of
vulnerable road users for drivers. Safety Science, 79, 29–38.
https://doi.org/10.1016/j.ssci.2015.05.002
Russell, J. A. (1980). A circumplex model of affect. Journal of Personality and Social
Psychology, 39(6), 1161–1178. https://doi.org/10.1037/h0077714
Saarimäki, H., Gotsopoulos, A., Jääskeläinen, I. P., Lampinen, J., Vuilleumier, P., Hari, R., …
Nummenmaa, L. (2016). Discrete Neural Signatures of Basic Emotions. Cerebral
Cortex (New York, N.Y.: 1991), 26(6), 2563–2573.
https://doi.org/10.1093/cercor/bhv086
Sarlo, M., Palomba, D., Buodo, G., Minghetti, R., & Stegagno, L. (2005). Blood pressure
changes highlight gender differences in emotional reactivity to arousing pictures.
Biological Psychology, 70(3), 188–196.
https://doi.org/10.1016/j.biopsycho.2005.01.005
Schachter, S., & Singer, J. (1962). Cognitive, social, and physiological determinants of
emotional state. Psychological Review, 69(5), 379–399.
https://doi.org/10.1037/h0046234
Schaefer, A., Nils, F., Sanchez, X., & Philippot, P. (2010). Assessing the effectiveness of a
large database of emotion-eliciting films: A new tool for emotion researchers.
Cognition & Emotion, 24(7), 1153–1172.
https://doi.org/10.1080/02699930903274322
34
730
731
732
733
734
735
736
737
738
739
740
741
742
743
744
745
746
747
748
749
750
751
752
753
TOWARDS A BETTER UNDERSTANDING OF EMOTION BLENDS 34
Scherer, K. R. (2005). What are emotions? And how can they be measured? Social Science
Information, 44(4), 695–729. https://doi.org/10.1177/0539018405058216
Scherer, K. R., Shuman, V., Fontaine, J. R. J., & Soriano, C. (2013). The GRID meets the
Wheel: Assessing emotional feeling via self-report.
https://doi.org/10.13140/RG.2.1.2694.6406
Siegel, E. H., Sands, M. K., Van den Noortgate, W., Condon, P., Chang, Y., Dy, J., …
Barrett, L. F. (2018). Emotion fingerprints or emotion populations? A meta-analytic
investigation of autonomic features of emotion categories. Psychological Bulletin,
144(4), 343–393. https://doi.org/10.1037/bul0000128
Stemmler, G., Aue, T., & Wacker, J. (2007). Anger and fear: Separable effects of emotion and
motivational direction on somatovisceral responses. International Journal of
Psychophysiology, 66(2), 141–153. https://doi.org/10.1016/j.ijpsycho.2007.03.019
Tarvainen, M. (2014). Kubios HRV user’s guide version 2.2.
Task Force of The European Society of Cardiology and The North American Society of
Pacing and Electrophysiology. (1996). Heart rate variability: standards of
measurement, physiological interpretation and clinical use. Circulation, 93(5), 1043–
1065.
Thayer, J. F., & Lane, R. D. (2000). A model of neurovisceral integration in emotion
regulation and dysregulation. Journal of Affective Disorders, 61(3), 201–216.
Thayer, Julian F., & Lane, R. D. (2009). Claude Bernard and the heart–brain connection:
Further elaboration of a model of neurovisceral integration. Neuroscience &
Biobehavioral Reviews, 33(2), 81–88. https://doi.org/10.1016/j.neubiorev.2008.08.004
Valenza, G., Allegrini, P., Lanatà, A., & Scilingo, E. P. (2012). Dominant Lyapunov exponent
and approximate entropy in heart rate variability during emotional visual elicitation.
Frontiers in Neuroengineering, 5. https://doi.org/10.3389/fneng.2012.00003
35
754
755
756
757
758
759
760
761
762
763
764
765
766
767
768
769
770
771
772
773
774
775
776
777
778
TOWARDS A BETTER UNDERSTANDING OF EMOTION BLENDS 35
Watson, D., & Tellegen, A. (1985). Toward a consensual structure of mood. Psychological
Bulletin, 98(2), 219–235. https://doi.org/10.1037/0033-2909.98.2.219
Wranik, T., & Scherer, K. R. (2010). Why Do I Get Angry? A Componential Appraisal
Approach. In M. Potegal, G. Stemmler, & C. Spielberger (Eds.), International
Handbook of Anger: Constituent and concomitant biological, psychological, and
social processes (pp. 243–266). Springer New York. https://doi.org/10.1007/978-0-
387-89676-2_15
Yao, C. W., & Lin, T. Y. (2015). Consumer behaviour with negative emotion in e-tailing
service environment. International Journal of Information and Communication
Technology, 7(1), 73. https://doi.org/10.1504/IJICT.2015.065990
36
779
780
781
782
783
784
785
786
787
788
789
790