Embed Size (px)
Citation preview

LAND NEEDS ANALYSIS REPORT September 2009
The City of Windsor Land Needs Analysis Report Official Plan Review September 2009
Dillon Consulting Limited Page i
Executive Summary
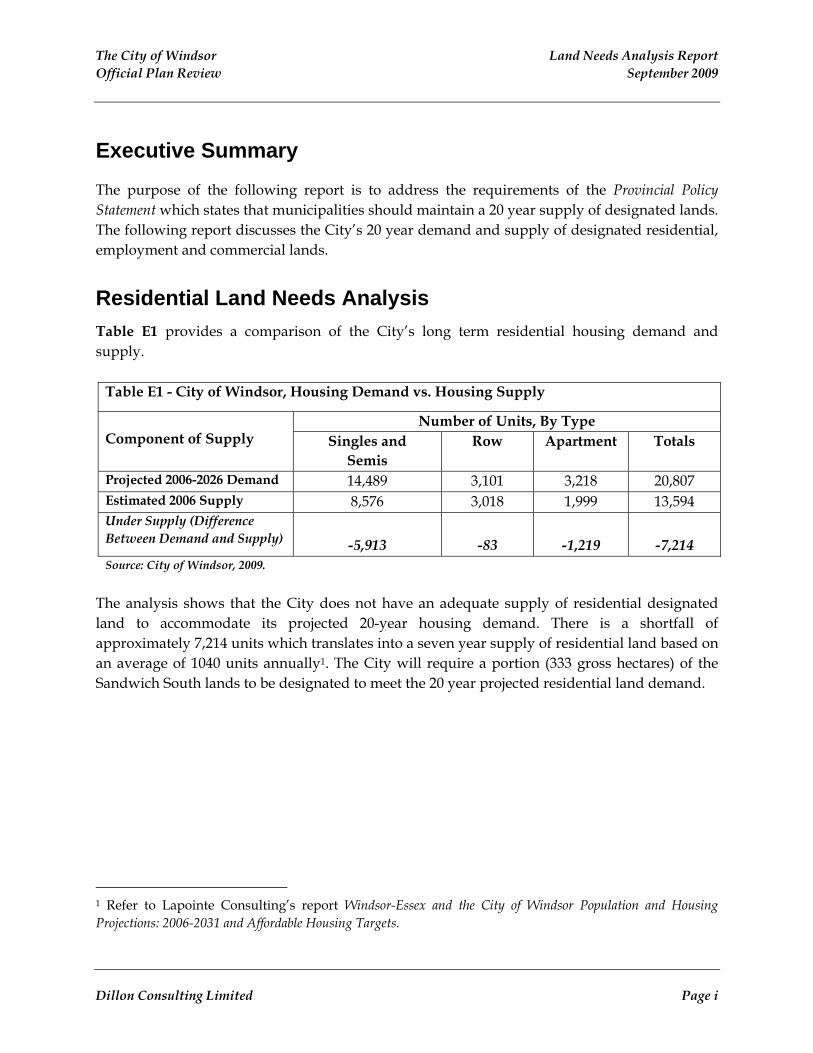
The purpose of the following report is to address the requirements of the Provincial Policy Statement which states that municipalities should maintain a 20 year supply of designated lands. The following report discusses the City’s 20 year demand and supply of designated residential, employment and commercial lands. Residential Land Needs Analysis Table E1 provides a comparison of the City’s long term residential housing demand and supply.
Table E1 - City of Windsor, Housing Demand vs. Housing Supply
Number of Units, By Type Component of Supply Singles and
Semis Row Apartment Totals
Projected 2006-2026 Demand 14,489 3,101 3,218 20,807 Estimated 2006 Supply 8,576 3,018 1,999 13,594 Under Supply (Difference Between Demand and Supply) -5,913 -83 -1,219 -7,214 Source: City of Windsor, 2009.
The analysis shows that the City does not have an adequate supply of residential designated land to accommodate its projected 20-year housing demand. There is a shortfall of approximately 7,214 units which translates into a seven year supply of residential land based on an average of 1040 units annually1. The City will require a portion (333 gross hectares) of the Sandwich South lands to be designated to meet the 20 year projected residential land demand.
1 Refer to Lapointe Consulting’s report Windsor-Essex and the City of Windsor Population and Housing Projections: 2006-2031 and Affordable Housing Targets.

The City of Windsor Land Needs Analysis Report Official Plan Review September 2009
Dillon Consulting Limited Page ii
Employment Land Needs Analysis The City is expected to add an additional 9,445 employment land jobs between 2006 and 2026, requiring approximately 400-500 net hectares (500-625 gross hectares) of employment land2. The City has a current supply of 100 net hectares of designated and serviced employment land, meaning that in the long term the City has a shortage of approximately 300-400 net hectares of employment land (375-500 gross hectares). It is expected that the 1,036 gross hectares of future employment land located in Sandwich South, once formally designated “employment” in the Official Plan and serviced, can accommodate the remaining 375-500 hectares required to meet the City’s twenty year employment land projections. Table E2 summarizes the City’s employment land employment needs.
Table E2– City of Windsor, Comparison of Supply and Demand for Employment Land
Total number of jobs to be accommodated on employment lands between 2006-2026
9,445 jobs
Estimated net area of land required to accommodate jobs on employment lands (2006)
400-500 net hectares
Estimated gross area of land required to accommodate jobs on employment lands (2006)
500-625 gross hectares
Estimated 2006 supply of designated employment land 100 net hectares Difference between supply and demand 300-400 net hectares (375-500 gross hectares) Estimated long term supply of employment lands 1,036 gross hectares Difference between the estimated long term supply and 2026 demand
536-661 gross hectares (surplus)
Source: EDP Consulting, 2008. It is concluded that the City does not have an adequate supply of employment land to meet its twenty year employment land employment projections. The City will require a portion (300 to 400 net hectare or 375-500 gross hectares) of the Sandwich South lands to be designated to meet the 20 year projected employment land demand.
2 Land need assumes a net density of between 23-28 jobs per hectare; a 5% suitability factor to take into account potentially unsuitable lands (i.e. lands with topographic and environmental constraints); a 15% vacancy factor; and, a net to gross conversion factor of 80% to allow for servicing, roads, parking and landscaping.

The City of Windsor Land Needs Analysis Report Official Plan Review September 2009
Dillon Consulting Limited Page iii
Commercial Land Needs Analysis Table E3 provides a comparison of the City’s long term demand and supply of commercial space. Table E4 provides a summary of the key recommendations of urbanMetric’s Commercial Demand and Supply Analysis report and the policy implications identified in the Commercial Land Use Policy Report.
Table E3 – City of Windsor, Estimated Supply Compared to Projected Demand to 2031
Space Estimated Demand 4,086,000 sf. Potential Supply (Approved and Proposed) 4,264,000 sf. Difference between Supply and Demand 178,000 sf. (Oversupply) Source: urbanMetrics Inc. (June 10, 2008). City of Windsor Commercial Demand and Supply Analysis and more recent information provided by the City in September 2009.
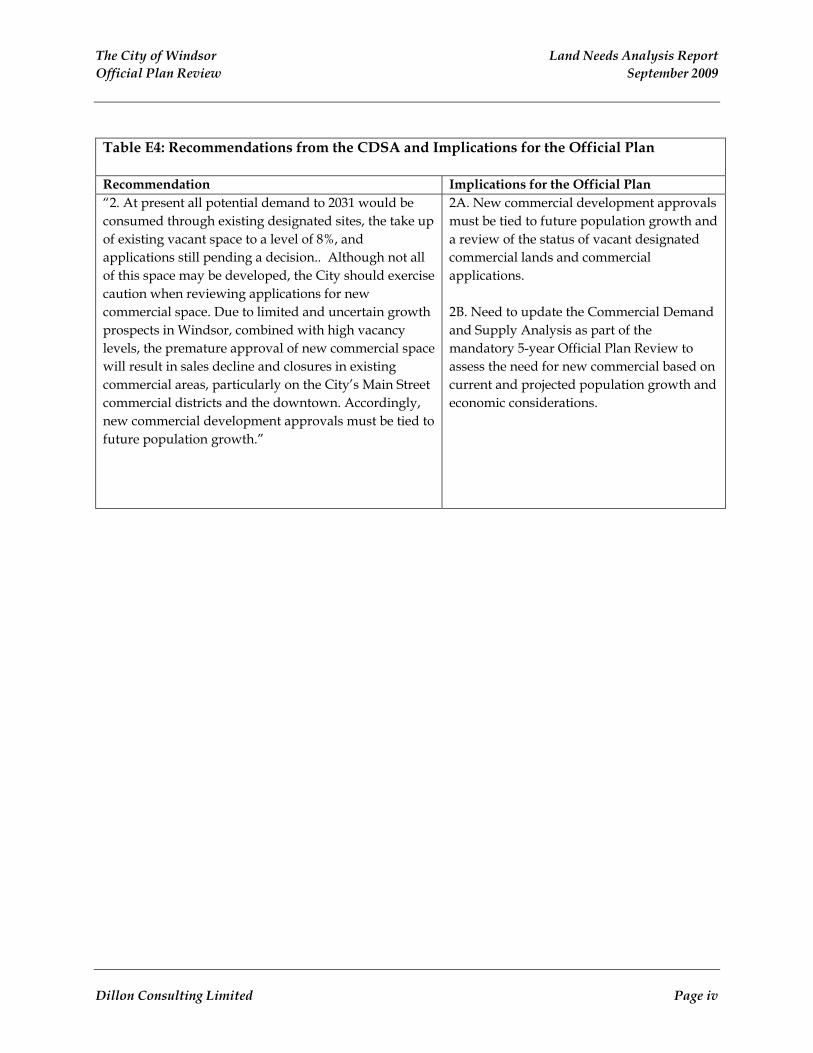
Table E4: Recommendations from the CDSA and Implications for the Official Plan
Recommendation Implications for the Official Plan “1. In that the City has already approved more commercial space than would be required to at least 2011, we would recommend that no approval for additional commercial space in the City be made that would result in new commercial development within the next five years. This should not apply to development in the downtown and main street areas which would serve to strengthen these important commercial districts.”
1A. Focus on the strategic approval of commercial development on lands/sites in the City that are currently designated for commercial. 1B. No redesignation of new lands for commercial in the City be made outside the downtown and main street areas until 2011 or until the need for such development has been assessed through a subsequent CDSA. 1C. New commercial development needs to be encouraged /facilitated in the downtown, main street and commercial corridors.
The City of Windsor Land Needs Analysis Report Official Plan Review September 2009
Dillon Consulting Limited Page iv
Table E4: Recommendations from the CDSA and Implications for the Official Plan
Recommendation Implications for the Official Plan “2. At present all potential demand to 2031 would be consumed through existing designated sites, the take up of existing vacant space to a level of 8%, and applications still pending a decision.. Although not all of this space may be developed, the City should exercise caution when reviewing applications for new commercial space. Due to limited and uncertain growth prospects in Windsor, combined with high vacancy levels, the premature approval of new commercial space will result in sales decline and closures in existing commercial areas, particularly on the City’s Main Street commercial districts and the downtown. Accordingly, new commercial development approvals must be tied to future population growth.”
2A. New commercial development approvals must be tied to future population growth and a review of the status of vacant designated commercial lands and commercial applications. 2B. Need to update the Commercial Demand and Supply Analysis as part of the mandatory 5-year Official Plan Review to assess the need for new commercial based on current and projected population growth and economic considerations.
The City of Windsor Land Needs Analysis Report Official Plan Review September 2009
Dillon Consulting Limited Page v
Next Steps The next steps stemming from this report are as follows:
The City requires approximately 250 net hectares (333 gross hectares) of new residential land to accommodate its projected long term demand. The re-designation of a portion of the Sandwich South lands will fill that need for residential land supply.
The City requires approximately 300-400 net hectares (375-500 gross hectares) of new employment land to accommodate its projected long term demand. The re-designation of a portion of the Sandwich South lands will fill that need for employment land supply.
The City needs to undertake an analysis of the lands in Sandwich South to assess the implications of the new airport master plan exercise, the approval of a new detention centre and retail commercial land uses in East Pelton, the extension of full municipal services into the area and the proposed multi-modal hub/port of entry initiative in this strategic gateway location.
The City needs to redesignate the lands in Sandwich South from “Future Urban Area” and “Future Employment Area” to an appropriate urban designation in the Windsor Official Plan to permit residential and employment development.
The City has recently already approved more commercial space than would be required to meet its short term demand (2011). There is no need to approve new major commercial designations in the City in the near-term unless appropriately justified through a market study prepared in accordance with the CDSA. The need for new commercial designations following 2011, will be dependent on population growth, the outcome of large development applications (including Twin Oaks and the Raceway development) and whether vacant lands currently designated for commercial development are ultimately developed with commercial uses. New commercial development approvals must be tied to future population growth and the state of the economy. While in the long term, if a shortfall in supply to serve future commercial demand becomes apparent, it should largely be allocated to augmenting the commercial structure within Sandwich South and the revitalization of the downtown and mainstreet areas.
If the Twin Oaks Proposal (1,000,000 square feet) and the Raceway development (420,000 square feet) are approved, there will not be a requirement for additional commercial designations to 2031. If Twin Oaks is not approved, there would be additional capacity for some 30 hectares of commercial land by 2031, a portion of which could be allocated to Sandwich South. If the Raceway development is turned down by the OMB, some 15 hectares could be approved to serve the west. A portion of excess demand should also be directed towards revitalizing the downtown and mainstreet areas.

The City of Windsor Land Needs Analysis Report Official Plan Review September 2009
Dillon Consulting Limited Page vi
Table of Contents
1.0 Introduction .................................................................................................................................. 1 1.1 About the Land Needs Report ................................................................................................ 1 1.2 Official Plan Process................................................................................................................. 2
2.0 Provincial Planning Context ...................................................................................................... 3 2.1 Provincial Policy Statement..................................................................................................... 3
3.0 Residential Demand and Supply.............................................................................................. 4 3.1 Guidelines for Undertaking Residential Land Needs Assessment ................................... 4 3.2 Residential Demand (20-Year Housing Projections) ........................................................... 4 3.3 Residential Supply.................................................................................................................... 5
3.3.1 Components of Residential Supply ................................................................................... 5 3.3.2 Un-built units on Registered Plans .................................................................................... 5 3.3.3 Draft Approved Units.......................................................................................................... 7 3.3.4 Units in the Approval Process............................................................................................ 7 3.3.5 Vacant Designated Land ..................................................................................................... 8 3.3.6 Intensification ..................................................................................................................... 11
3.4 Total Estimated Residential Land Supply........................................................................... 13 3.5 Comparison of Demand and Supply ................................................................................... 16 3.6 Conclusions and Recommendations.................................................................................... 16
4.0 Employment Land Supply and Demand............................................................................... 17 4.1 Employment Demand............................................................................................................ 17 4.2 Project Employment Land Requirements ........................................................................... 18 4.3 Employment Land Supply .................................................................................................... 19 4.4 Conclusions and Recommendations.................................................................................... 21
5.0 Commercial Land Supply and Demand ................................................................................ 22 5.1 Demand for Commercial Development .............................................................................. 22 5.2 Commentary on Commercial Supply.................................................................................. 23 5.3 Conclusions ............................................................................................................................. 24
6.0 Conclusions and Next Steps .................................................................................................... 26
List of References.................................................................................................................................... 28

The City of Windsor Land Needs Analysis Report Official Plan Review September 2009
Dillon Consulting Limited Page vii
List of Tables Table 3.1 - City of Windsor, 20 Year Housing Demand, 2006-2026 Table 3.2 - City of Windsor, Un-Built Units on Registered Plans, 2008 Table 3.3 - City of Windsor, Units with Draft Approval Status, 2008 Table 3.4 - City of Windsor, Density Factors, 2008 Table 3.5 - City of Windsor, Unit Estimate for Vacant Designated Residential Land, 2008 Table 3.6 - City of Windsor, Recommended Intensification Target (expressed in units), 2008 Table 3.7 – City of Windsor, Estimated Residential Land Supply Table 3.8 - City of Windsor, Housing Demand vs. Housing Supply Table 4.1 - City of Windsor, Employment at Fixed Places of Work, Projections, 2006-2026 Table 4.2 - City of Windsor, New Employment at Fixed Places of Work, Base Case Scenario Table 4.3 - City of Windsor, Employment Land Employment, Base Case Scenario Table 4.4 - City of Windsor, Comparison of Supply and Demand for Employment Land Table 5.1 - City of Windsor, Estimated Demand for Commercial Space, 2006-2026 Table 5.2 - City of Windsor, Estimated Supply of Commercial Space Table 5.3 - City of Windsor, Estimated Supply Compared to Projected Demand Table 5.4 – Recommendations from the CDSA and Implications for the Official Plan List of Figures Figure 3.1 – Development Constraints Figure 3.2 - Residential Land Supply Figure 4.1 - Employment Land Supply

The City of Windsor Land Needs Analysis Report Official Plan Review September 2009
Dillon Consulting Limited Page 1
1.0 Introduction
The City of Windsor is at an important crossroads in planning for its future. The economy is changing. The environment is changing. The shape of development is changing. With change comes a degree of uncertainty but also, and more importantly, opportunity. As the City changes, so must it’s Official Plan, which is the primary document for managing change and guiding growth. The policies of the Official Plan direct the use of land, establish a framework for orderly development, stimulate revitalization, promote economic development, encourage efficient transportation and ensure a healthy environment, all in order to provide a high quality of life for current and future members of the Windsor community. Since the approval of the current Official Plan, the Province of Ontario has issued a new Provincial Policy Statement for land use planning. The Province has also amended the Planning Act twice, through the Strong Communities (Planning Amendment) Act and the Planning and Conservation Land Statute Law Amendment Act. Collectively, these documents will be the key provincial drivers for change in the City’s Official Plan; however, major trends and current challenges of local significance will be considered in the update the Official Plan. The Official Plan must also have regard for and integrate the work of other major exercises, such as the Environmental Master Plan, Transit Master Plan, Long-Range Transportation Plan, and Sandwich South Master Plan. It must also be aligned with the City’s Community Strategic Plan (2007). 1.1 About the Land Needs Report
The purpose of the following report is to address the requirement of the Provincial Policy Statement which states that municipalities should maintain a 20 year supply of designated lands. The following report is divided into six main sections. The first section provides an introduction, outlining the City’s Official Plan process and the purpose of the report. The second section provides an overview of the policy drivers, discussing relevant Provincial policies. The third section describes the residential land needs analysis undertaken by Dillon. The fourth section summarizes the employment land needs analysis undertaken by EDP Consulting. The fifth section briefly summarizes urbanMetric’s commercial land needs analysis undertaken for the Commercial Demand and Supply Analysis Report. The sixth and final section outlines next steps.

The City of Windsor Land Needs Analysis Report Official Plan Review September 2009
Dillon Consulting Limited Page 2
1.2 Official Plan Process
Windsor’s Official Plan Update project is framed around the theme of, “Looking Back, Moving Forward, Advancing Windsor’s Vision.” The City of Windsor has completed “Looking Back”, the first of three phases of the Official Plan 5-Year Review. The Looking Back work program was comprised of research and analysis that identified, described and discussed the existing conditions, trends and known challenges that face Windsor. The analysis of existing studies and recent legislative changes along with stakeholder discussions, statistical analysis and field surveys were included in a series of Looking Back Summary Reports and a Looking Back Synthesis Report. The Looking Back Summary Reports focused on seven specific areas and included:
Legislation; Social Conditions; Economic Conditions; Natural Environment; Infrastructure; Transportation; and, Built Form.
The Looking Back Summary Report and the Synthesis Report are available on the City’s website at http://www.citywindsor.ca/002220.asp . The second phase of the City’s Official Plan Update, Moving Forward includes foundation study components. Each study provides valuable direction for updating the City’s Official Plan policies. The Moving Forward foundation studies include this ‘Land Needs Analysis’ report as well as the following:
20-Year Population and Housing Projections Report; 20-Year Employment Projection and Employment Land Needs Analysis; City of Windsor Commercial Demand and Supply Analysis; Housing Market Report ; Commercial Land Use Policy Review Report; Natural Areas Policy Review Report; Residential Intensification and Redevelopment Targets Report; and, Legislative and Regulatory Changes Related to Land Use Planning Matters
Introduced by Bill 51 to the Planning Act Report.
The City of Windsor Land Needs Analysis Report Official Plan Review September 2009
Dillon Consulting Limited Page 3
2.0 Provincial Planning Context
2.1 Provincial Policy Statement
The Provincial Government has a vision for Ontario communities to be strong, liveable and sustainable. The land use planning system plays an important role in helping achieve this vision. The policy framework encourages land use planning that looks beyond municipal boundaries and addresses the three interrelated components of economy, environment and community. The provincial planning context is evolving to be more strategic than it has been in the past as there is a greater recognition of the need to address good land use planning from a number of perspectives and through a number of instruments, the principal ones being enabling legislation – i.e. Planning Act – and broad policy direction – i.e. Provincial Policy Statement. The Provincial Policy Statement (PPS) establishes a broad vision for how communities should grow over time. In order to ensure that the policies in the PPS are applied in all communities as a key component of the planning process, the Planning Act requires that all decisions affecting land use planning matters “shall be consistent with” the PPS. Of particular relevance for this report is the PPS policy contained in Section 1.1.2 under the heading Managing and Directing Land Use to Achieve Efficient Development and Land Use Patterns. Section 1.1.2 states that:
“sufficient land shall be made available through intensification and redevelopment and, if necessary, designated growth areas, to accommodate an appropriate range and mix of employment opportunities, housing and other land uses to meet projected needs for a time horizon of up to 20 years”.
This means that municipalities need to undertake periodic land need needs assessments for housing, employment and commercial land uses to ensure that communities have the opportunity to grow and prosper over the long term. In accordance with Section 1.1.2 of the PPS the following report provides a detailed assessment of Windsor’s residential, employment and commercial land needs for the period 2006-2026.

The City of Windsor Land Needs Analysis Report Official Plan Review September 2009
Dillon Consulting Limited Page 4
3.0 Residential Demand and Supply
3.1 Guidelines for Undertaking Residential Land Needs Assessment
The Ministry of Municipal Affairs and Housing provides guidance for the preparation of residential lands needs assessments through its 1995 document entitled Projection Methodology Guideline. The Guideline identifies two inputs for calculating long term land requirements namely, supply and demand. The supply is comprised of several different categories which correspond to the different phases of land development process and produce an estimate of the total supply of residential units in a given municipality. The supply figures are compared against the forecasted residential demand. A comparison between supply and demand is intended to identify whether there is a shortage, over-supply, or optimal amount of residential land. Our method is consistent with the Province’s above noted approach for undertaking land needs assessments. 3.2 Residential Demand (20-Year Housing Projections)
Lapointe Consulting was retained to prepare population and housing projections for the City of Windsor. In January, 2008 Lapointe Consulting released the Windsor-Essex and City of Windsor Population and Housing Projections report which identifies 20 and 25 year population and housing demand projections for the City of Windsor. For the purposes of long range planning, the 20 year housing projections are being used. Table 3.1 below shows a breakdown of the City’s projected 20-year housing demand. The projections show that, over the context of the next 20 years, the City is expected to achieve an average annual growth rate 1,040 units (per year) and a total of 20,807 units by 2026.
The figures in Table 3.1 represent the demand side of the analysis.
Table 3.1 – City of Windsor, 20 Year Housing Demand, 2006-2026
Dwelling Type 2006-2026 (units) Average Annual Projections (units)
Percent of Total
Single Detached 12,702 635 61.1% Semi Detached 1,787 89 8.6% Row Housing 3,101 155 14.9% Apartment 3,218 161 15.5% Total 20,807 1,040 100% Source: Lapointe Consulting, 2008

The City of Windsor Land Needs Analysis Report Official Plan Review September 2009
Dillon Consulting Limited Page 5
3.3 Residential Supply
3.3.1 Components of Residential Supply
The City of Windsor’s residential land supply (Base Year 2008) is estimated by compiling dwelling unit counts for the following five categories:
1. Units available on registered plans for which a building permit has not been issued; 2. Units available on draft approved plans of sub-division and site plans for which a
building permit has not been issued; 3. Units in the approval process where an decision has not been rendered; 4. Potential units on vacant designated residential land; and, 5. Potential units created through intensification and redevelopment.
The following sub-sections identify each of the above noted categories. Unit estimates have been provided by the City of Windsor Planning Department. 3.3.2 Un-built units on Registered Plans
Table 3.2 identifies the estimated number of un-built units on registered plans (Base Year 2008).
Table 3.2 – City of Windsor, Un-Built Units on Registered Plans, 2008
Number of Un-Built Units, By Type Plan Number/Name Single Semi Row Apartment Total 12M491 0 0 60 0 60 12M497 24 0 0 0 24 12M498 30 0 0 0 30 12M499 8 0 0 0 8 12M500 30 0 0 0 30 12M503 10 26 0 0 36 12M506 70 0 0 0 70 12M513 0 110 0 0 110 12M514 20 0 78 0 98 12M515 15 0 0 0 15 12M518 0 140 0 0 140 12M519 8 0 0 0 8 12M520 14 0 0 0 14 12M521 0 26 26 0 52 12M523 12 0 0 0 12 12M524 110 0 0 0 110

The City of Windsor Land Needs Analysis Report Official Plan Review September 2009
Dillon Consulting Limited Page 6
Table 3.2 – City of Windsor, Un-Built Units on Registered Plans, 2008
Number of Un-Built Units, By Type Plan Number/Name Single Semi Row Apartment Total 12M530 10 0 0 0 10 12M533 72 0 0 0 72 12M544 34 0 0 0 34 12M546 0 104 0 0 104 12M551 30 0 0 0 30 12M555 28 0 0 0 28 Total 525 406 260 0 1,191
The City of Windsor has 1,191 un-built dwelling units on registered plans of subdivision (Base Year 2008).
The City of Windsor Land Needs Analysis Report Official Plan Review September 2009
Dillon Consulting Limited Page 7
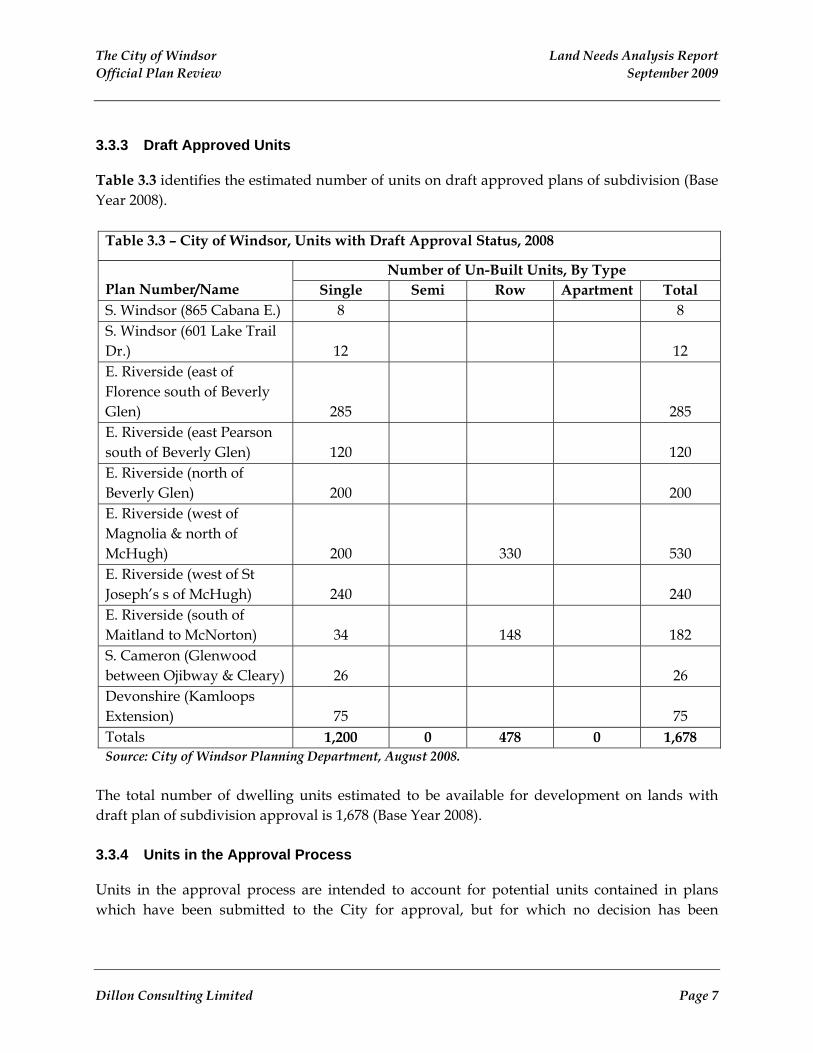
3.3.3 Draft Approved Units
Table 3.3 identifies the estimated number of units on draft approved plans of subdivision (Base Year 2008).
Table 3.3 – City of Windsor, Units with Draft Approval Status, 2008
Number of Un-Built Units, By Type Plan Number/Name Single Semi Row Apartment Total S. Windsor (865 Cabana E.) 8 8 S. Windsor (601 Lake Trail Dr.) 12 12 E. Riverside (east of Florence south of Beverly Glen) 285 285 E. Riverside (east Pearson south of Beverly Glen) 120 120 E. Riverside (north of Beverly Glen) 200 200 E. Riverside (west of Magnolia & north of McHugh) 200 330 530 E. Riverside (west of St Joseph’s s of McHugh) 240 240 E. Riverside (south of Maitland to McNorton) 34 148 182 S. Cameron (Glenwood between Ojibway & Cleary) 26 26 Devonshire (Kamloops Extension) 75 75 Totals 1,200 0 478 0 1,678 Source: City of Windsor Planning Department, August 2008.
The total number of dwelling units estimated to be available for development on lands with draft plan of subdivision approval is 1,678 (Base Year 2008). 3.3.4 Units in the Approval Process
Units in the approval process are intended to account for potential units contained in plans which have been submitted to the City for approval, but for which no decision has been

The City of Windsor Land Needs Analysis Report Official Plan Review September 2009
Dillon Consulting Limited Page 8
rendered at this time. At the time of writing this report, pre-consultation has taken place between Planning Staff and developers regarding future applications, however, there are no submitted applications in-process at this time. 3.3.5 Vacant Designated Land
The City of Windsor has 394 gross hectares of vacant designated residential land for which there are no plans approved or submitted at this time3. This gross estimate includes the netting out of significant, non-developable environmental features and does not include areas designated “future urban” in the City’s Official Plan (i.e. Sandwich South lands). The following features have been subtracted out from the estimate of gross vacant designated land:
Provincially significant wetlands; Significant woodlands; Valley lands; Areas of natural and scientific interest; Habitat of endangered species and threatened species, wildlife habitat, and fish
habitat; Any lands within the City’s Environmental Protection Areas; Areas identified as development constraints in the City’s Official Plan, including
Natural Heritage Areas, Rail Yards, Known or Suspected Former Waste Disposal Sites, Aggregate Resources Areas; and,
Lands required to accommodate the Detroit River International Crossing and Approach Roads and Facilities.
The above noted development constraints are shown on Figure 3.1.
3 This estimate accounts for all vacant designated residential land within the City of Windsor, Official Plan.

WALKER RD
HOWARD AVE
TECU
MSEH
RD
E
WYAN
DOTT
E ST
E
LAUZON PKY
BASE
LINE R
D
HURON CHURCH RD
COUN
TY R
D 42
OJIBWAY PKY
MALDEN RD
DOUGALL AVEOUELLETTE AVE
DIVISION RD
9TH CON RD
COUNTY RD 17
TECU
MSEH
RD
W
PROVINCIAL RD
CABA
NA R
D W
PILLETTE RD
SANDWICH ST
8TH CON RDCENTRAL AVE
UNIVE
RSITY
AVE W WY
ANDO
TTE
ST W
LAUZON RD
CABA
NA R
D E
MCHU
GH ST
7TH CON RD
AYLMER AVE
MCNO
RTON
ST
BANWELL RD
PATRICIA RD
JEFFERSON BLVD
LAUZON RD
E C R
OW EX
PY
DOUGAL
L PKY
City
of Wi
ndso
r Ne
w Of
ficial
Plan
Figur
e 3.1
Deve
lopme
nt Co
nstra
ints
Map B
y: PJ
KMa
p Che
cked B
y: RS
SDa
te Cr
eated
: Aug
ust 2
008
File:
0665
52/M
aps/F
igure
3.1...
01
23
0.5Kil
omete
rs
City B
ound
aryDR
IC Bo
unda
ryWe
tland
Aggre
gate
Reso
urce S
ites
Envir
onme
ntal P
olicy
Area
Know
n or S
uspe
cted F
ormer
Waste
Disp
osal
Site
Natur
al He
ritage
Rail Y
ard
Map N
otes
The City of Windsor Land Needs Analysis Report Official Plan Review September 2009
Dillon Consulting Limited Page 10
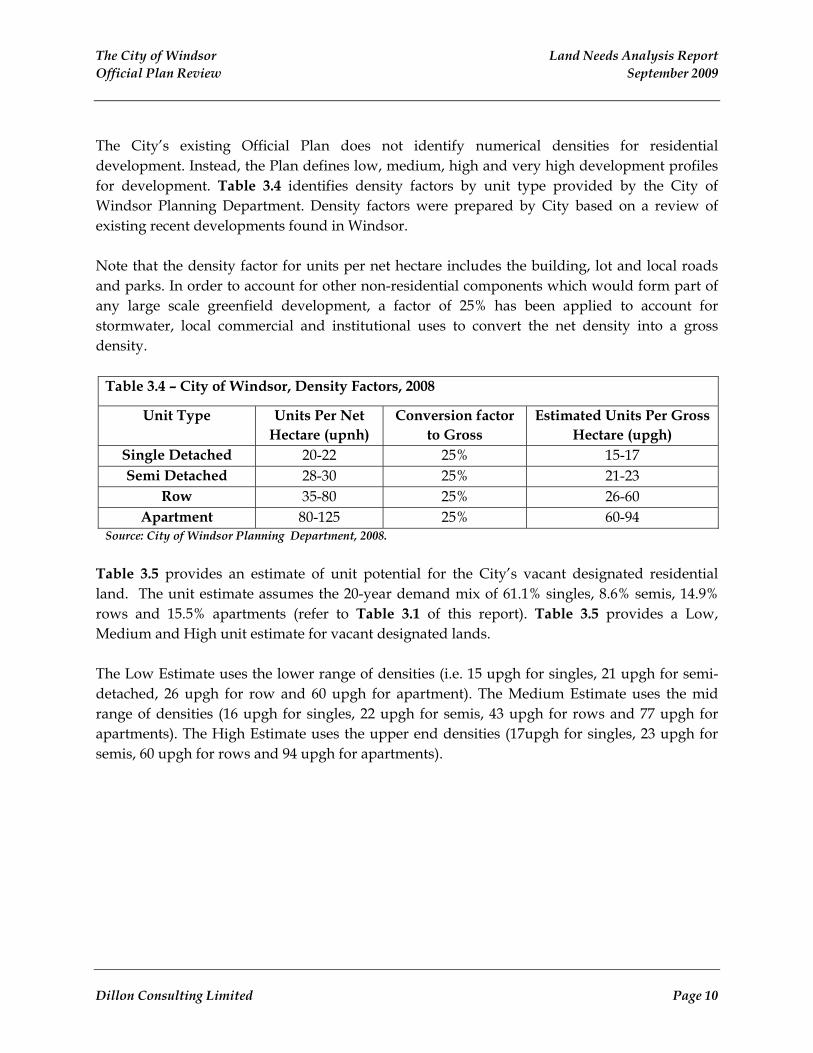
The City’s existing Official Plan does not identify numerical densities for residential development. Instead, the Plan defines low, medium, high and very high development profiles for development. Table 3.4 identifies density factors by unit type provided by the City of Windsor Planning Department. Density factors were prepared by City based on a review of existing recent developments found in Windsor. Note that the density factor for units per net hectare includes the building, lot and local roads and parks. In order to account for other non-residential components which would form part of any large scale greenfield development, a factor of 25% has been applied to account for stormwater, local commercial and institutional uses to convert the net density into a gross density.
Table 3.4 – City of Windsor, Density Factors, 2008
Unit Type Units Per Net Hectare (upnh)
Conversion factor to Gross
Estimated Units Per Gross Hectare (upgh)
Single Detached 20-22 25% 15-17 Semi Detached 28-30 25% 21-23
Row 35-80 25% 26-60 Apartment 80-125 25% 60-94
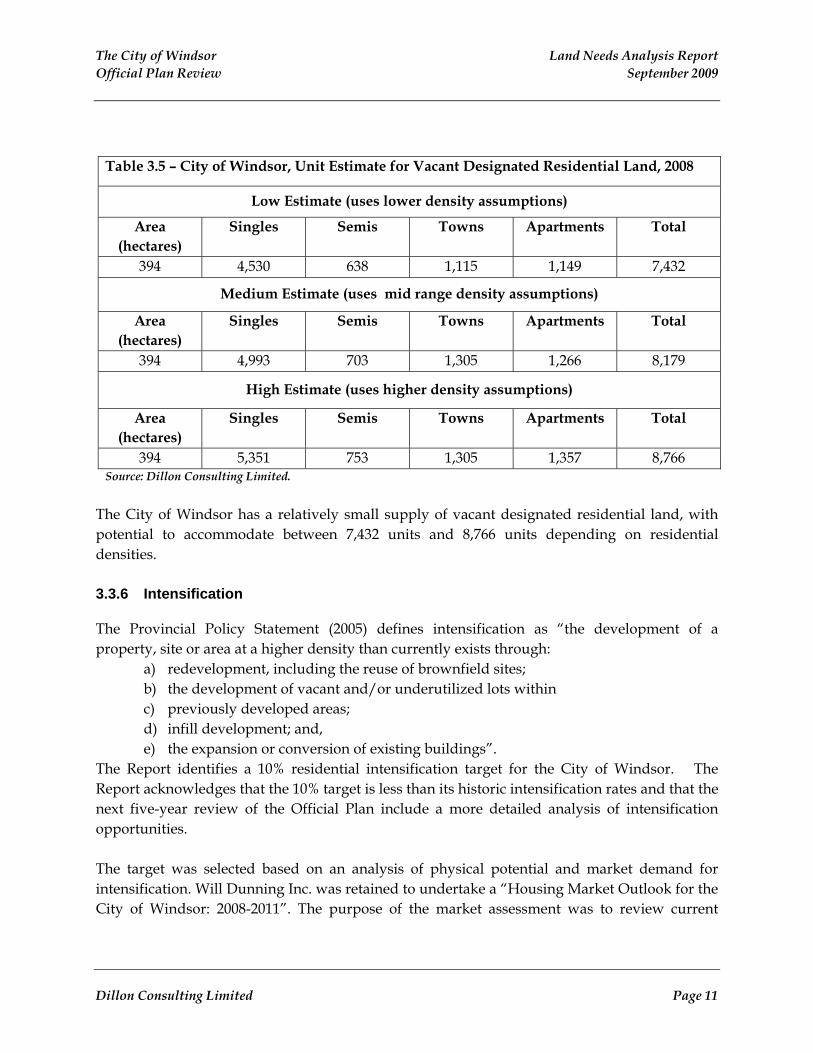
Source: City of Windsor Planning Department, 2008. Table 3.5 provides an estimate of unit potential for the City’s vacant designated residential land. The unit estimate assumes the 20-year demand mix of 61.1% singles, 8.6% semis, 14.9% rows and 15.5% apartments (refer to Table 3.1 of this report). Table 3.5 provides a Low, Medium and High unit estimate for vacant designated lands. The Low Estimate uses the lower range of densities (i.e. 15 upgh for singles, 21 upgh for semi-detached, 26 upgh for row and 60 upgh for apartment). The Medium Estimate uses the mid range of densities (16 upgh for singles, 22 upgh for semis, 43 upgh for rows and 77 upgh for apartments). The High Estimate uses the upper end densities (17upgh for singles, 23 upgh for semis, 60 upgh for rows and 94 upgh for apartments).
The City of Windsor Land Needs Analysis Report Official Plan Review September 2009
Dillon Consulting Limited Page 11
Table 3.5 – City of Windsor, Unit Estimate for Vacant Designated Residential Land, 2008
Low Estimate (uses lower density assumptions)
Area (hectares)
Singles Semis Towns Apartments Total
394 4,530 638 1,115 1,149 7,432
Medium Estimate (uses mid range density assumptions)
Area (hectares)
Singles Semis Towns Apartments Total
394 4,993 703 1,305 1,266 8,179
High Estimate (uses higher density assumptions)
Area (hectares)
Singles Semis Towns Apartments Total
394 5,351 753 1,305 1,357 8,766 Source: Dillon Consulting Limited.
The City of Windsor has a relatively small supply of vacant designated residential land, with potential to accommodate between 7,432 units and 8,766 units depending on residential densities. 3.3.6 Intensification
The Provincial Policy Statement (2005) defines intensification as “the development of a property, site or area at a higher density than currently exists through:
a) redevelopment, including the reuse of brownfield sites; b) the development of vacant and/or underutilized lots within c) previously developed areas; d) infill development; and, e) the expansion or conversion of existing buildings”.
The Report identifies a 10% residential intensification target for the City of Windsor. The Report acknowledges that the 10% target is less than its historic intensification rates and that the next five-year review of the Official Plan include a more detailed analysis of intensification opportunities. The target was selected based on an analysis of physical potential and market demand for intensification. Will Dunning Inc. was retained to undertake a “Housing Market Outlook for the City of Windsor: 2008-2011”. The purpose of the market assessment was to review current

The City of Windsor Land Needs Analysis Report Official Plan Review September 2009
Dillon Consulting Limited Page 12
trends in the Windsor economy and housing market and to forecast housing market activity for 2008 to 2011. Key findings of the Residential Intensification Analysis Report included:
The vast majority of short-term housing demand in Windsor can be satisfied within the existing housing inventory, and there is very little need for new residential construction;
The Windsor economy has weakened sharply since 2003 and the employment rate as fallen;
Changes in local employment situations have gradual impacts on housing markets, therefore, the weakened job market in Windsor has resulted in an evolving slowdown in the housing market;
Because of the lagged relationship between employment and housing, even if Windsor’s employment situation was to soon start to improve, it would take some time before housing construction starts to recover;
A rapid turnaround in the local economic situation appears to be quite unlikely, as it is clear that the Windsor economy is highly dependent on American economic trends and highly affected by a strong Canadian dollar. Therefore, Windsor faces a prolonged period of economic weakness;
There is a strong implication that housing construction in Windsor will remain weak for several more years. The forecast developed in the Dunning report indicates that there will be no substantive improvement in housing starts during the 2008 to 2011 period;
Recent infill development in Windsor has been predominately single detached dwellings;
Market conditions suggest that within the 2008-2011 period there will be limited potential for new semi-detached, medium-density and high density construction, except where amenities are available that are in demand by specific sub-groups of the population such as the aging;
The city has several potentially contaminated, vacant or underutilized sites that pose a unique set of challenges for development;
There are a limited number of large infill sites in Windsor, with the majority less than 1 hectare in size;
A sample of potential intensification sites indicates that there are at least 15 potential sites that could support up to 603 units; and,
While the market may dictate the shape and form of development that occurs on any given site, there are a wide range of attractive options and opportunities for intensification development.
Given the development context described above, the City concluded that a target of 10% would be suitable for the City of Windsor. Table 3.6 identifies the City’s intensification target, broken down by unit type.

The City of Windsor Land Needs Analysis Report Official Plan Review September 2009
Dillon Consulting Limited Page 13
Table 3.6 – City of Windsor, Recommended Intensification Target (expressed in units),2008
Low* Medium High Total Projected Housing Demand 14,489 3,101 3,218 20,807 Recommended Intensification Target 416 936 728 2,080 (10%) *Low combines the estimates of singles and semis. Source: City of Windsor Planning Department, Residential Intensification Analysis Report, June 2008. Target works out to 9.5%, which has been rounded to 10%.
The Intensification Report recommended an intensification target of 10% be incorporated into the City’s 20 year housing analysis. The Intensification Report provides more detail on the different forms of intensification used to prepare this target4. 3.4 Total Estimated Residential Land Supply
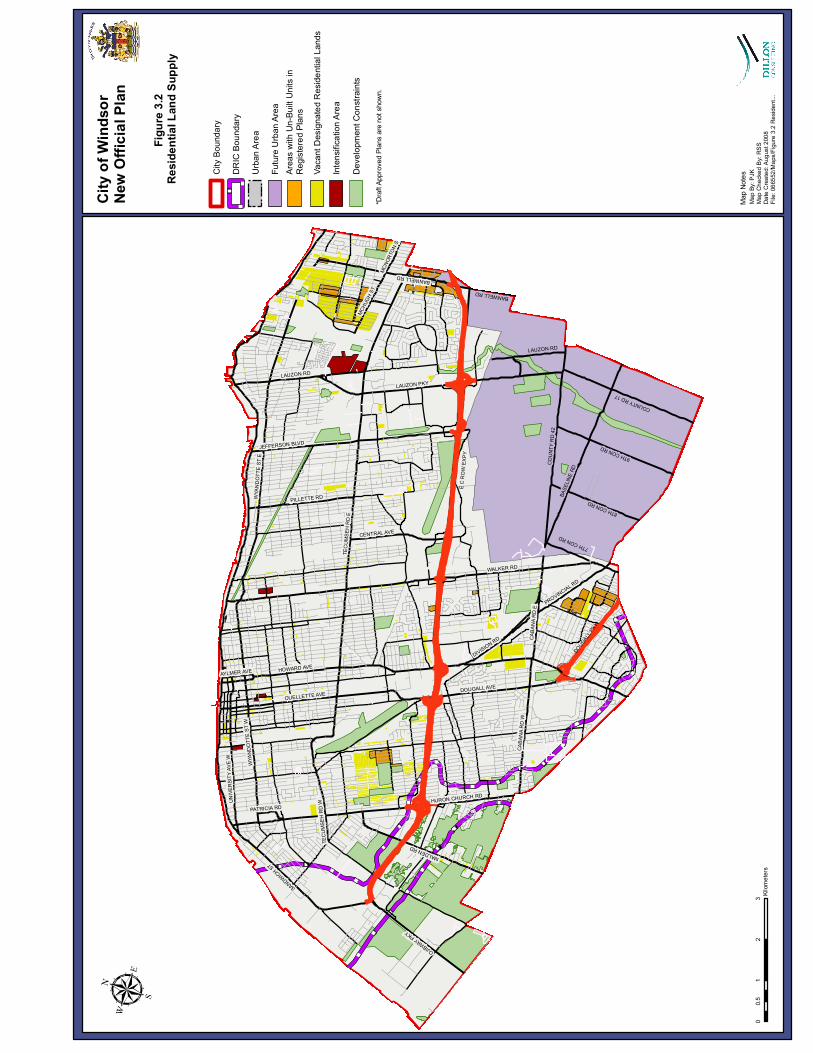
The forecasted demand period for this report is from 2006 to 2026. The estimated supply is effective July 1, 2008. In order to facilitate a proper comparison between forecasted demand and estimated supply an adjustment for absorption must to be made to create a 2006 land supply. Between January 1, 2006 and July 1, 2008, permits representing 466 dwelling units were issued. In order to create a 2006 estimate of residential supply 466 units are added onto the supply. Table 3.7 displays the total estimated 2008 residential land supply for the City of Windsor and accounts for an adjustment for absorption of units between 2006 and 2008. Figure 3.2 shows the City supply’s of designated residential land.
4 Note that the 10% target displayed in Table 3.6 provides a different unit breakdown that the target described in the Intensification Report. The figures in Intensification Report are based on a limited analysis of several potential sites located throughout the City and does not represent an exhaustive inventory. Accordingly, a modified 10% target has been used.

The City of Windsor Land Needs Analysis Report Official Plan Review September 2009
Dillon Consulting Limited Page 14
Table 3.7 – City of Windsor, Estimated Residential Land Supply
Number of Un-Built Units, By Type Component of Supply Singles Semis Row Apartment Totals Un-Built Units on Registered Plans (2008) 525 406 260 0 1,191 Units with Draft Approval Status (2008) 1,200 0 478 0 1,678 In Process Units (2008) 0 0 0 0 0 Potential Units on Vacant Designated Land (2008) 4,993 703 1,217 1,266 8,179 Residential Intensification Potential (2008) 416 936 728 2,081 Estimated 2008 Supply 8,636 1,995 2,384 13,128 2006-2008 Absorption 334 127 5 466 Estimated 2006 Supply 8,576 3,018 1,999 13,594 Source: Dillon Consulting Limited, 2008.
WALKER RD
HOWARD AVE
TECU
MSEH
RD
E
WYAN
DOTT
E ST
E
LAUZON PKY
BASE
LINE R
D
HURON CHURCH RD
COUN
TY R
D 42
OJIBWAY PKY
MALDEN RD
DOUGALL AVEOUELLETTE AVE
DIVISION RD
9TH CON RD
COUNTY RD 17
TECU
MSEH
RD
W
PROVINCIAL RD
CABA
NA R
D W
PILLETTE RD
SANDWICH ST
8TH CON RDCENTRAL AVE
UNIVE
RSITY
AVE W WY
ANDO
TTE
ST W
LAUZON RD
CABA
NA R
D E
MCHU
GH ST
7TH CON RD
BANWELL RD
AYLMER AVE
MCNO
RTON
ST
PATRICIA RD
JEFFERSON BLVD
LAUZON RD
BANWELL RD
E C R
OW EX
PY
DOUGAL
L PKY
City
of Wi
ndso
r Ne
w Of
ficial
Plan
Figur
e 3.2
Resid
entia
l Lan
d Sup
ply
Map B
y: PJ
KMa
p Che
cked B
y: RS
SDa
te Cr
eated
: Aug
ust 2
008
File:
0665
52/M
aps/F
igure
3.2 R
eside
nt...
01
23
0.5Kil
omete
rs
City B
ound
aryDR
IC Bo
unda
ryUr
ban A
rea
Futur
e Urba
n Area
Area
s with
Un-B
uilt U
nits i
n Re
gister
ed Pl
ans
Vaca
nt De
signa
ted R
eside
ntial
Land
s
Map N
otesInt
ensif
icatio
n Area
Deve
lopme
nt Co
nstra
ints
*Draf
t App
roved
Plan
s are
not s
hown
.

The City of Windsor Land Needs Analysis Report Official Plan Review September 2009
Dillon Consulting Limited Page 16
3.5 Comparison of Demand and Supply
Table 3.8 provides a comparison of the 2006 supply and 2006-2026 demand, showing that the City has an undersupply of residential units (7,214 units).
Table 3.8 – City of Windsor, Housing Demand vs. Housing Supply
Number of Un-Built Units, By Type Component of Supply Singles and
Semis Row Apartment Totals
Projected 2006-2026 Demand 14,489 3,101 3,218 20,807 Estimated 2006 Supply 8,576 3,018 1,999 13,594 Over Supply (Difference Between Demand and Supply) -5,913 -83 -1,219 -7,214 Source: Dillon Consulting, 2008.
3.6 Conclusions and Recommendations
The analysis shows that the City does not have an adequate supply of residential designated land to accommodate its projected 20-year housing demand. There is a shortfall of approximately 7,214 units which translates into a seven year supply of residential land (based on an average of 1,040 units annually)5. The City will require a portion (333 gross hectares) of the Sandwich South lands to be designated to meet the 20 year projected residential land demand.
5 Refer to Lapointe Consulting’s report Windsor-Essex and the City of Windsor Population and Housing Projections: 2006-2031 and Affordable Housing Targets.

The City of Windsor Land Needs Analysis Report Official Plan Review September 2009
Dillon Consulting Limited Page 17
4.0 Employment Land Supply and Demand
The City of Windsor engaged EDP Consulting to prepare employment projections and an assessment of land supply needed to accommodate the projected demand as part of the Moving Forward stage of the City’s Official Plan review process. The findings of EDP Consulting’s report entitled City of Windsor: Employment Projections and Employment Land Needs Analysis are briefly summarized below. 4.1 Employment Demand
EDP Consulting identified three employment growth scenarios for fixed places of work for the City of Windsor:
Base Case Scenario; Low Growth Scenario; and, High Growth Scenario.
The three scenarios are briefly summarized in Table 4.1 below.
Table 4.1– City of Windsor, Employment at Fixed Places of Work, Projections, 2006-2026
Scenario 2006 2011 2016 2021 2026 Base Case 120,700 120,970 126,200 133,290 141,840 Low Growth 120,700 117,650 119,120 122,130 125,220 High Growth 120,700 125,900 136,630 149,010 162,520 Source: EDP Consulting, 2008.
The Base Case was considered to be the most appropriate scenario for the twenty year planning period based on past and expected future employment trends. The Base Case represents growth of 21,140 jobs between 2006 and 2026. Based on analysis of sector trends a breakdown of sector employment growth was undertaken. A detailed description of sector trends is provided in Chapter 2 of EDP Consulting’s Report. Table 4.2 provides a section breakdown of the Base Case Scenario.

The City of Windsor Land Needs Analysis Report Official Plan Review September 2009
Dillon Consulting Limited Page 18
Table 4.2– City of Windsor, New Employment at Fixed Places of Work, Base Case Scenario
Sector New Employment, 2007-2026 Manufacturing 4,545 Other Industrially Related 2,705 Population Related and Business Services 9,410 Institutional 4,460 Primary 20 Total 21,140 Source: EDP Consulting, 2008.
It is estimated that 9,445 of the 21,140 jobs are expected to locate on employment lands within Windsor, representing approximately 45% of employment growth. The other 55% will be located on commercial, institutional and work at home locations. A breakdown of employment land employment growth is provided below in Table 4.3.
Table 4.3 – City of Windsor, Employment Land Employment, Base Case Scenario
Sector New Employment, 2007-2026 Manufacturing 4,545 Other Industrially Related 2,570 Population Related and Business Services 1,880 Institutional 450 Primary 0 Total 9,445 Source: EDP Consulting, 2008.
4.2 Project Employment Land Requirements
Based on the figures in Table 4.3, the City of Windsor will need between 500 and 600 gross hectares (400-500 net hectares) of employment land. This estimate assumes the following assumptions6:
A net density of between 23-28 jobs per hectare; A 5% suitability factor to take into account potentially unsuitable lands (i.e. lands with
topographic and environmental constraints); A 15% vacancy factor; and,
6 No intensification factor was assumed for manufacturing employment as a much of Windsor’s older vacant industrial buildings were purpose built and are difficult to adapt to new industrial uses. From a market perspective these areas are difficult to redevelop.
The City of Windsor Land Needs Analysis Report Official Plan Review September 2009
Dillon Consulting Limited Page 19
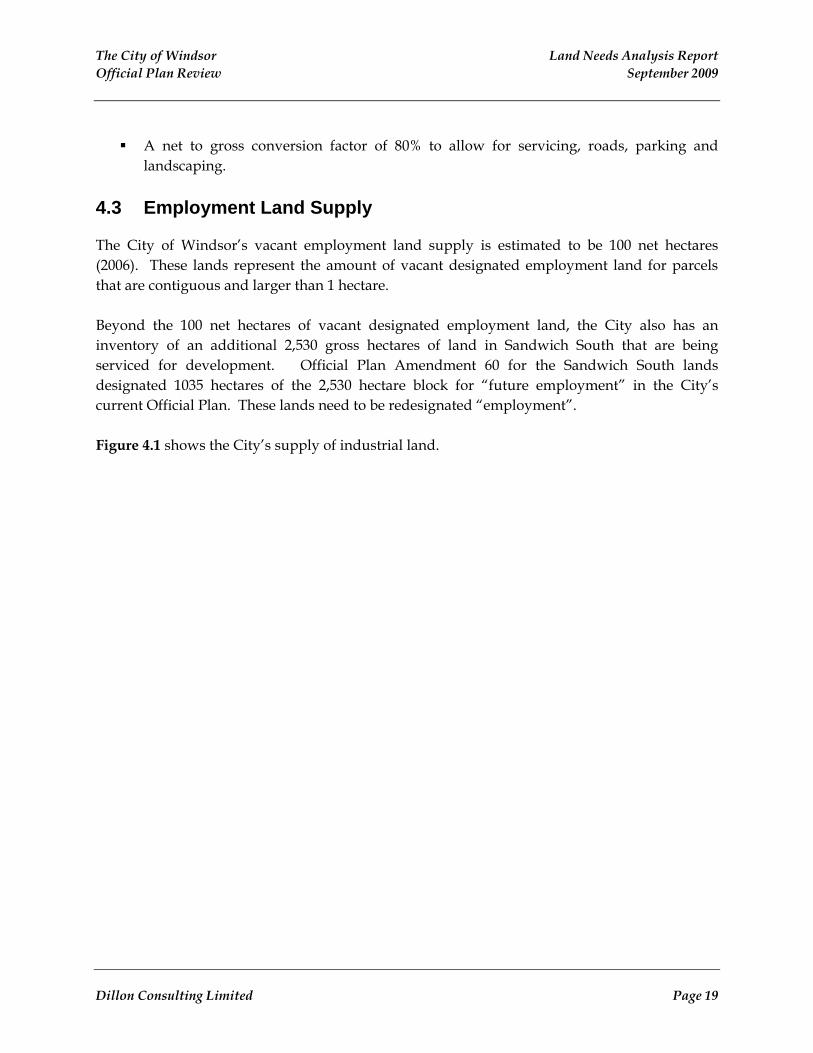
A net to gross conversion factor of 80% to allow for servicing, roads, parking and landscaping.
4.3 Employment Land Supply
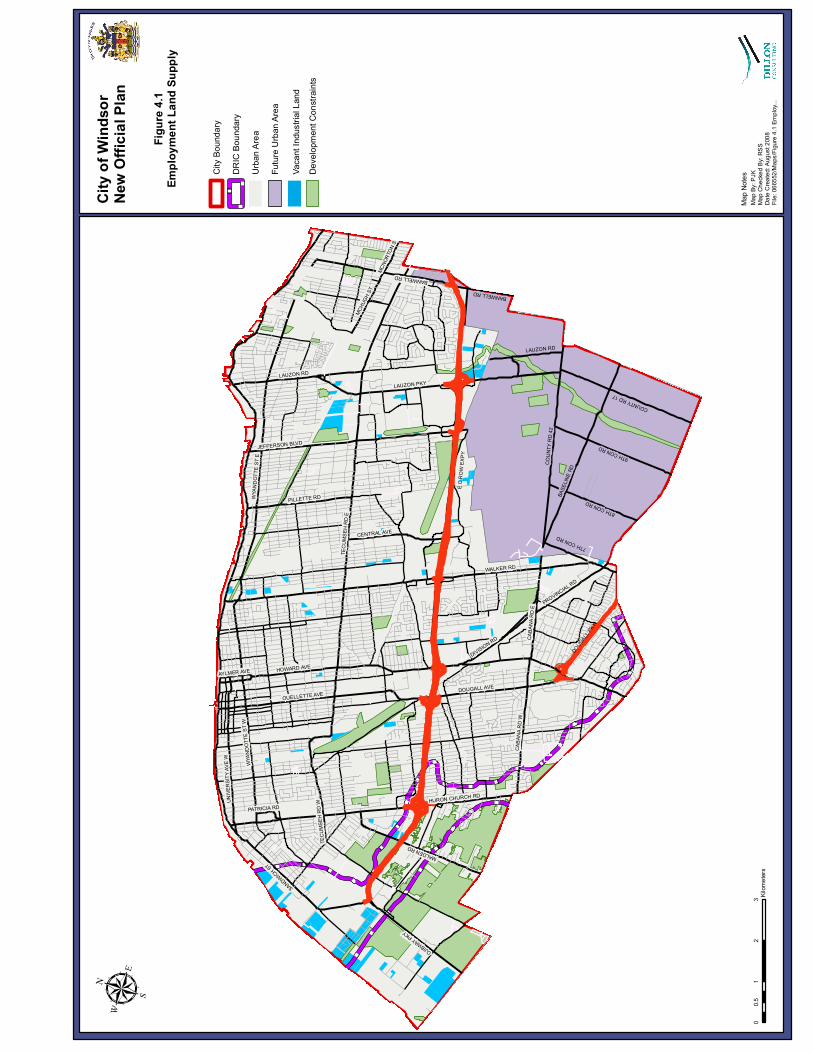
The City of Windsor’s vacant employment land supply is estimated to be 100 net hectares (2006). These lands represent the amount of vacant designated employment land for parcels that are contiguous and larger than 1 hectare. Beyond the 100 net hectares of vacant designated employment land, the City also has an inventory of an additional 2,530 gross hectares of land in Sandwich South that are being serviced for development. Official Plan Amendment 60 for the Sandwich South lands designated 1035 hectares of the 2,530 hectare block for “future employment” in the City’s current Official Plan. These lands need to be redesignated “employment”. Figure 4.1 shows the City’s supply of industrial land.
WALKER RD
HOWARD AVE
TECU
MSEH
RD
E
WYAN
DOTT
E ST
E
LAUZON PKY
BASE
LINE R
D
HURON CHURCH RD
COUN
TY R
D 42
OJIBWAY PKY
MALDEN RD
DOUGALL AVEOUELLETTE AVE
DIVISION RD
9TH CON RD
COUNTY RD 17
TECU
MSEH
RD
W
PROVINCIAL RD
CABA
NA R
D W
PILLETTE RD
SANDWICH ST
8TH CON RDCENTRAL AVE
UNIVE
RSITY
AVE W WY
ANDO
TTE
ST W
LAUZON RD
CABA
NA R
D E
MCHU
GH ST
7TH CON RD
BANWELL RD
AYLMER AVE
MCNO
RTON
ST
PATRICIA RD
JEFFERSON BLVD
LAUZON RD
BANWELL RD
E C R
OW EX
PY
DOUGAL
L PKY
City
of Wi
ndso
r Ne
w Of
ficial
Plan
Figur
e 4.1
Emplo
ymen
t Lan
d Sup
ply
Map B
y: PJ
KMa
p Che
cked B
y: RS
SDa
te Cr
eated
: Aug
ust 2
008
File:
0665
52/M
aps/F
igure
4.1 Em
ploy..
.
01
23
0.5Kil
omete
rs
City B
ound
aryDR
IC Bo
unda
ryUr
ban A
rea
Futur
e Urba
n Area
Vaca
nt Ind
ustria
l Lan
d
Map N
otesDe
velop
ment
Cons
traint
s

The City of Windsor Land Needs Analysis Report Official Plan Review September 2009
Dillon Consulting Limited Page 21
4.4 Conclusions and Recommendations
The City is expected to add an additional 9,445 employment land jobs between 2006 and 2026, requiring approximately 400-500 net hectares (500-625 gross hectares) of employment land. The City has a current supply of 100 net hectares of designated and serviced employment land, meaning that in the long term the City has a shortage of approximately 300-400 net hectares (375-500 gross hectares) of employment land. It is expected that the 1,036 gross hectares of future employment land located in Sandwich South, once serviced, will accommodate the 375-500 hectares required to meet the City’s twenty year employment land projections. Table 4.4 summarizes the City’s employment land employment needs.
Table 4.4 – City of Windsor, Comparison of Supply and Demand for Employment Land
Total number of jobs to be accommodated on employment lands between 2006-2026
9,445 jobs
Estimated net area of land required to accommodate jobs on employment lands (2006)
400-500 net hectares
Estimated gross area of land required to accommodate jobs on employment lands (2006)
500-625 gross hectares
Estimated 2006 supply of designated employment land 100 net hectares Difference between supply and demand 300-400 net hectares (375-500 gross hectares) Estimated long term supply of employment lands 1,036 gross hectares Difference between the estimated long term supply and 2026 demand
536-661 gross hectares (surplus)
Source: EDP Consulting, 2008. Based on the findings discussed above, it is concluded that the City has an adequate supply of employment land to meet its twenty year employment land employment projections. However, the City will require a portion (300 to 400 net hectare or 375-500 gross hectares) of the Sandwich South lands to be designated to meet its projected employment land needs.

The City of Windsor Land Needs Analysis Report Official Plan Review September 2009
Dillon Consulting Limited Page 22
5.0 Commercial Land Supply and Demand
urbanMetrics was retained by the City to undertake a City-wide Commercial Demand and Supply Analysis (CDSA). The goals of the study were to:
Identify the amount of commercial development that would be required to serve the future population of Windsor and its trade area to 2031;
Guide future commercial development in the City; Indentify the types and formats for new commercial development in the City; Provide Council and Staff with guidance for making decisions with regards to new
commercial development applications; and, Provide recommendations with regards to revitalizing under performing commercial
areas and solidifying market support for other key retail districts. The following section briefly summarizes the analysis of demand and supply undertaken in urbanMetrics’ CDSA Report, which has been augmented with more current information provided by City staff. 5.1 Demand for Commercial Development
The City’s 2006-2026 demand for commercial development is estimated to be 4,086,000 square feet. This estimate is based on the population and housing projections completed by Lapointe Consulting (as discussed in Section 3) and an analysis of income expenditures, including a consumer telephone and intercept (on-street) surveys. Table 5.1 below provides a detailed description of the City’s estimated 20 year demand for commercial space.
Table 5.1 – City of Windsor, Estimated Demand for Commercial Space, 2006-2026
Commercial Service Space Warrant (square feet) Food Store Retail 417,000 sf. Non Food Store Retail 2,263,000 sf. Other Retail/Services 1,406,000 sf. Total Demand 4,086,000 sf. Source: urbanMetrics, 2008.
The demand for commercial space is largely driven by population growth. Over the short term, the City of Windsor is expected to experience slower residential growth with growth rates increasing after 2011. While the demand for commercial space over the long term is estimated to be 4,086,000 square feet, it is acknowledged that the demand for new commercial space between now and 2011 is expected to be limited. It is also important to recognize that the vast majority of future space, beyond that already committed, will not be required until residential growth

The City of Windsor Land Needs Analysis Report Official Plan Review September 2009
Dillon Consulting Limited Page 23
occurs in Sandwich South. 5.2 Commentary on Commercial Supply
The City of Windsor has a potential supply of 3,464,000 square feet of commercial space. This inventory of space includes recently approved development applications, a factor for vacancy uptake, expansion to existing sites (intensification) and development on vacant designated lands. Table 5.2 provides a detailed description of the City of Windsor’s current supply of commercial space.
Table 5.2 – City of Windsor, Estimated Commercial Supply7
Component of Supply Space Committed Supply (approved developments) Windsor Raceway 420,000 sf. Department Store Expansion (Lauzon Pkwy) 50,000 sf. Supermarket 48,000 sf. Home Improvement Store (Division Road) 158,000 sf. Home Improvement Store (Provincial Road) 137,000 sf. East Pelton Commercial Centre/Corridor 800,000 sf. Sub-Total, Committed Supply 1,613,000 sf. Uncommitted Supply (applications without a decision) Twin Oaks (Banwell Road) 1,000,000 sf. Sub-Total, Uncommitted Supply 1,000,000 sf. Other Approved Components of Supply Vacancy Uptake (assume a vacancy rate of 8%) 500,000 sf. Vacant Designated Lands 750,000 sf. Expansion Potential on Existing Sites 401,000 sf. Sub-Total, Other Components of Supply 1,651,000 sf. Total Potential Supply 4,264,000 sf. Source: urbanMetrics, 2008.
Table 5.3 provides a comparison of supply and demand, showing that the City would have an oversupply of space by 2031 if both the Twin Oaks and Raceway developments are ultimately approved.
7 Note that since the completion of the RMDIA report a number of developments noted in Table 5.2 have proceeded. The department store expansion on Lauzon Pkwy along with the home improvement stores on Division Road and Provincial Road are under construction or have been completed. The Raceway development and the Twin Oaks development are currently under appeal at the Ontario Municipal Board (Is Twin Oaks also under appeal).

The City of Windsor Land Needs Analysis Report Official Plan Review September 2009
Dillon Consulting Limited Page 24
Table 5.3 – City of Windsor, Estimated Supply Compared to Projected Demand
Space Estimated Demand 4,086,000 sf. Potential Supply 4,264,000 sf. Potential Oversupply 178,000 sf. Source: urbanMetrics, 2008 and more current information on commercial applications provided by City staff in September, 2009.
5.3 Conclusions
Table 5.4 provides a summary of the key recommendations of urbanMetric’s Commercial Demand and Supply Analysis report and the policy implications identified in the Commercial Land Use Policy Report. Table 5.4: Recommendations from the CDSA and Implications for the Official Plan
Recommendation Implications for the Official Plan “1. In that the City has already approved more commercial space than would be required to at least 2011, we would recommend that no approval for additional commercial space in the City be made that would result in new commercial development within the next five years. This should not apply to development in the downtown and main street areas which would serve to strengthen these important commercial districts.”
1A. Focus on the strategic approval of commercial development on lands/sites in the City that are currently designated for commercial. 1B. No redesignation of new lands for commercial in the City be made outside the downtown and main street areas until 2011 or until the need for such development has been assessed through a subsequent CDSA. 1C. New commercial development needs to be encouraged /facilitated in the downtown, main street and commercial corridors.
The City of Windsor Land Needs Analysis Report Official Plan Review September 2009
Dillon Consulting Limited Page 25
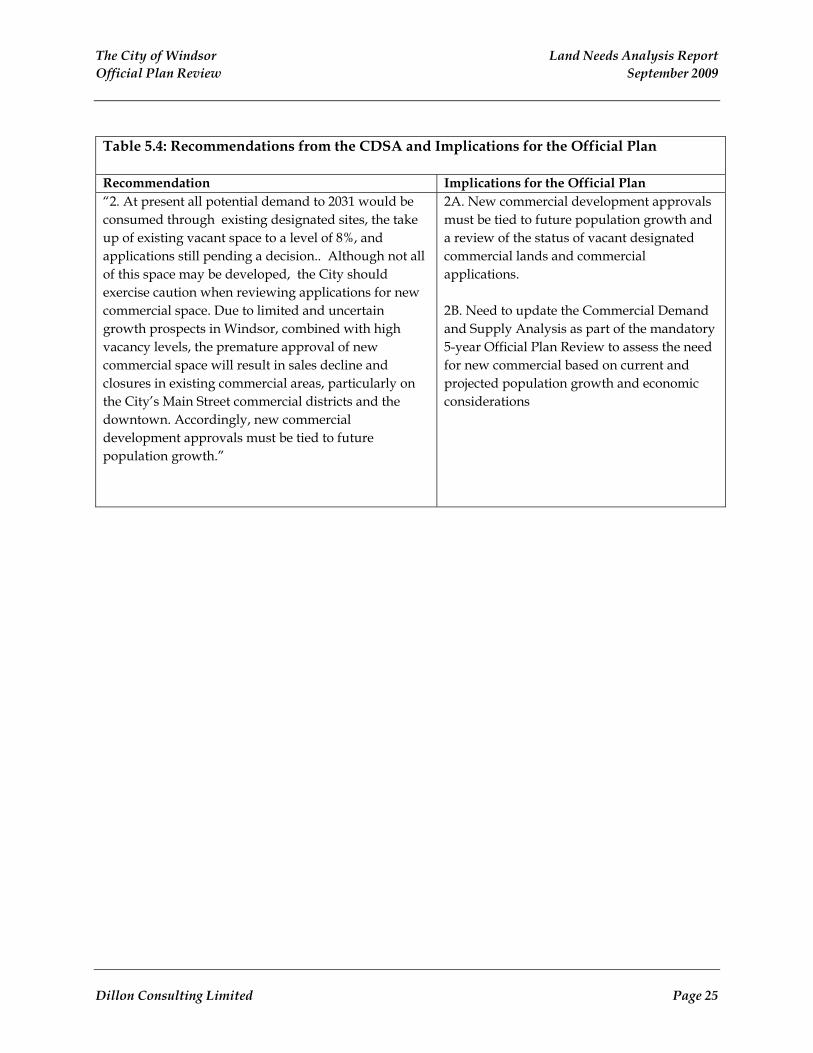
Table 5.4: Recommendations from the CDSA and Implications for the Official Plan
Recommendation Implications for the Official Plan “2. At present all potential demand to 2031 would be consumed through existing designated sites, the take up of existing vacant space to a level of 8%, and applications still pending a decision.. Although not all of this space may be developed, the City should exercise caution when reviewing applications for new commercial space. Due to limited and uncertain growth prospects in Windsor, combined with high vacancy levels, the premature approval of new commercial space will result in sales decline and closures in existing commercial areas, particularly on the City’s Main Street commercial districts and the downtown. Accordingly, new commercial development approvals must be tied to future population growth.”
2A. New commercial development approvals must be tied to future population growth and a review of the status of vacant designated commercial lands and commercial applications. 2B. Need to update the Commercial Demand and Supply Analysis as part of the mandatory 5-year Official Plan Review to assess the need for new commercial based on current and projected population growth and economic considerations
The City of Windsor Land Needs Analysis Report Official Plan Review September 2009
Dillon Consulting Limited Page 26
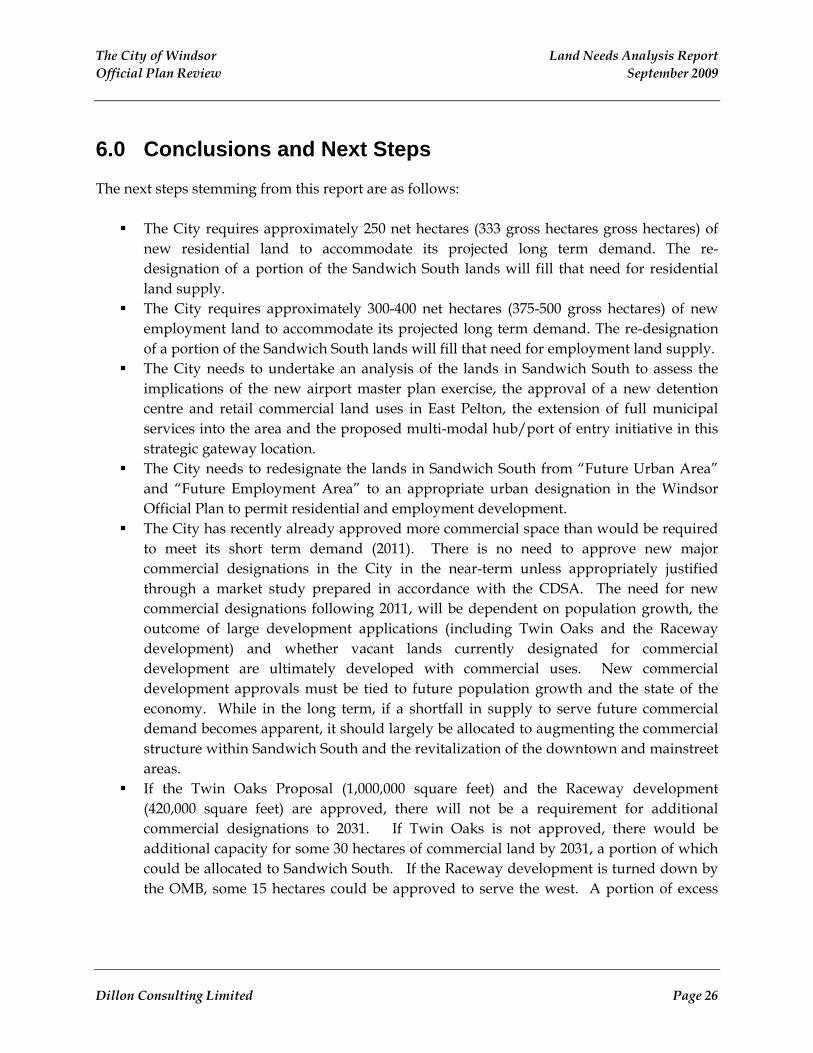
6.0 Conclusions and Next Steps
The next steps stemming from this report are as follows:
The City requires approximately 250 net hectares (333 gross hectares gross hectares) of new residential land to accommodate its projected long term demand. The re-designation of a portion of the Sandwich South lands will fill that need for residential land supply.
The City requires approximately 300-400 net hectares (375-500 gross hectares) of new employment land to accommodate its projected long term demand. The re-designation of a portion of the Sandwich South lands will fill that need for employment land supply.
The City needs to undertake an analysis of the lands in Sandwich South to assess the implications of the new airport master plan exercise, the approval of a new detention centre and retail commercial land uses in East Pelton, the extension of full municipal services into the area and the proposed multi-modal hub/port of entry initiative in this strategic gateway location.
The City needs to redesignate the lands in Sandwich South from “Future Urban Area” and “Future Employment Area” to an appropriate urban designation in the Windsor Official Plan to permit residential and employment development.
The City has recently already approved more commercial space than would be required to meet its short term demand (2011). There is no need to approve new major commercial designations in the City in the near-term unless appropriately justified through a market study prepared in accordance with the CDSA. The need for new commercial designations following 2011, will be dependent on population growth, the outcome of large development applications (including Twin Oaks and the Raceway development) and whether vacant lands currently designated for commercial development are ultimately developed with commercial uses. New commercial development approvals must be tied to future population growth and the state of the economy. While in the long term, if a shortfall in supply to serve future commercial demand becomes apparent, it should largely be allocated to augmenting the commercial structure within Sandwich South and the revitalization of the downtown and mainstreet areas.
If the Twin Oaks Proposal (1,000,000 square feet) and the Raceway development (420,000 square feet) are approved, there will not be a requirement for additional commercial designations to 2031. If Twin Oaks is not approved, there would be additional capacity for some 30 hectares of commercial land by 2031, a portion of which could be allocated to Sandwich South. If the Raceway development is turned down by the OMB, some 15 hectares could be approved to serve the west. A portion of excess
The City of Windsor Land Needs Analysis Report Official Plan Review September 2009
Dillon Consulting Limited Page 27
demand should also be directed towards revitalizing the downtown and mainstreet areas.

The City of Windsor Land Needs Analysis Report Official Plan Review September 2009
Dillon Consulting Limited Page 28
List of References
City of Windsor. Intensification Analysis Report. June 2008. Dillon Consulting. Commercial Land Use Policy Report. October 2008. EDP Consulting. City of Windsor Employment Projections and Employment Land Needs Analysis. January 15, 2008. Government of Ontario. Queen’s Printer for Ontario. Projection Methodology Guideline: A Guide to Projecting Population, Housing Need, Employment and Related Land Requirements. 1995. Government of Ontario. Queen’s Printer for Ontario. Provincial Policy Statement. 2005. Lapointe Consulting Inc. Windsor-Essex and the City of Windsor Population and Housing Projections: 2006-2031 and Affordable Housing Targets. January 16, 2008. urbanMetrics. City of Windsor Commercial Demand and Supply Analysis. June 10, 2008.