Embed Size (px)
Citation preview

Lehrstuhl für Physiologie
Fakultät Wissenschaftszentrum Weihenstephan für Ernährung, Landnutzung und Umwelt Technische Universität München
Lactulose in combination with Enterococcus faecium: Protective role in calves
Simone Fleige
Vollständiger Abdruck der von der Fakultät Wissenschaftszentrum Weihenstephan
für Ernährung, Landnutzung und Umwelt der Technischen Universität München
zur Erlangung des akademischen Grades eines
Doktors der Naturwissenschaften (Dr. rer. nat.)
genehmigten Dissertation.
Vorsitzender: Univ.-Prof. Dr. Thomas F. Knoke Prüfer der Dissertation: 1. Univ.-Prof. Dr. Dr. Heinrich H.D. Meyer 2. Priv.-Doz. Dr. Michael Pfaffl
3. Univ.-Prof. Dr. Wilhelm M. Windisch, Universität für Bodenkultur Wien / Österreich
Die Dissertation wurde am 21.06.2007 bei der Technischen Universität München eingereicht
und durch die Fakultät Wissenschaftszentrum Weihenstephan für Ernährung, Landnutzung und Umwelt am 23.08.2007 angenommen.

Content
II
CONTENT
ABBREVIATIONS IV
TABLES AND FIGURES V
ABSTRACT VI
ZUSAMMENFASSUNG VIII
INTRODUCTION 1
Bioanalytics: problems with a successful quantitative mRNA analysis 1
In vivo investigations: Lactulose as feed additive 2
Prebiotics and probiotics as feed additive 2
Intestinal immune system 5
Stimulation of the immunity by probiotics and prebiotics 6
AIM OF THE STUDY 7
MATERIAL AND METHODS 8
Bioanalytical investigations: RNA quality and the effect on qRT-PCR results 8
Sample preparation and artificial total RNA degradation 8
One step qRT-PCR and relative quantification 8
In vivo investigation: Physiological effect of lactulose in calves 9
Animals, husbandry, feeding and experimental procedures 9
Tissue collection and blood samples 10
Histology and histomorphometry of intestinal mucosa 10
Total RNA extraction and mRNA analysis 11
Data evaluation 12

Content
III
RESULTS AND DISCUSSION 14
Bioanalytical research: 14
Effect of RNA integrity on PCR performance 15
Impact of RIN on relative quantification 16
Interrelation between RIN and length of amplified product 17
Physiological effect of lactulose in calves 19
Feed intake and zootechnical performance 19
Effect on the intestinal morphology 22
Hematology 24
Immunological response in the intestine 25
Immune modulation in different compartments 26
CONCLUSION 30
REFERENCE LIST 31
ACKNOWLEDGEMENT 36
SCIENTIFIC COMMUNICATIONS 37
Original publications 37
Scientific presentations 37
Posters 38
CURRICULUM VITAE 39
APPENDIX 40

Abbreviations
IV
ABBREVIATIONS
ADG average daily weight gain ANOVA analysis of variance bp base pairs BW body weight CD cluster of differentiation antigen CFU colony forming units CP crossing point Ct cycle threshold E efficiency E. faecium Enterococcus faecium EDTA ethylendiamintetraaceticacid EGFR epidermal growth factor receptor EMBL European Molecular Biology Laboratory Fig. figure Fru fructose Gal galactose GAPDH glycerinaldehyd-3-phosphat- dehydrogenase GALT gut-associated lymphatic tissue GIT gastrointestinal tract Glu glucose IFN-γ interferon gamma IL interleukin IgA immunoglobulin A IgA FcR IgA Fc receptor
L0 control group L1 1% lactulose treated group L3 3% lactulose treated group mLN mesenterial lymph nodes mRNA messenger RNA MR milk replacer n number OS oligsaccharide RNA ribonucleic acid rRNA ribosomal RNA RT reverse trancription PCR polymerase chain reaction PP peyers patches qRT-PCR quantitative reverse transcription polymerase chain reaction RIN RNA integrity number SCFA short chain fatty acid SEM standard error of mean Tab. table TGF-ß1 transforming growth factor beta1 Th cells helper T cells TNF-α tumor necrosis factor alpha WBC white blood cells

Tables and Figures
V
TABLES AND FIGURES
Tables
Table 1: Major oligosaccharide candidates for prebiotics 3 Table 2: Primer used for qRT-PCR 13 Table 3: Average daily intake of milk replacer and nutrients 19
Table 4: Mortality and adjusted means ± SEM of body weight and feed efficiency 20 Table 5: Influence of probiotics on weight gain and feed input in different branches
of production 22 Table 6: Effect of lactulose on the mRNA expression of diverse cytokines,
CD markers and IgA FcR in various calf tissues 27
Figures
Figure 1: Electropherograms from a white blood cell with different RNA degradation levels 2 Figure 2: Chemical structure of Lactulose 4 Figure 3: Schematic functional organization of the GALT 6 Figure 4: Efficiency corrected quantification model 9 Figure 5: Morphological measurements in the intestine 11 Figure 6: Single-run-specific efficiency-corrected relative expression 12 Figure 7: Average RIN of various bovine tissues and cell lines 15 Figure 8: Distribution of the RT-PCR absolute expression
(A) Negative correlation between cycle threshold and RIN (B) Correlation between single-run PCR efficiency and RIN 16
Figure 9: Single-run efficiency-corrected relative expression ratio versus RIN 17 Figure 10: Relationship between RNA integrity and length of the amplified product 18 Figure 11: Progression of the daily weight gain of male and female calves 21 Figure 12: Villus height and depth of crypts in the intestine 23 Figure 13: Influence of lactulose feeding on lymphocytes and thrombocytes in
probiotic feed calves 25 Figure 14: IL-10 and TGF-ß1 mRNA expression changes due to lactulose 25

Abstract
VI
ABSTRACT
The prebiotic lactulose is a non-digestible carbohydrate, which is metabolized in the colon by the saccharolytic microflora. Lactulose can be used to improve the intestinal microflora by stimulating the growth of probiotic bacteria in the gut and to compass an intestinal eubiosis. Furthermore, prebiotics and probiotics may enhance feed conversion and daily weight gain. The mechanisms by which lactulose affects growth performance, intestinal morphology and the immune system in pre-ruminant calves are not yet investigated in detail. This study was conducted to elucidate the effects of orally administered lactulose on probiotic-fed pre-ruminant calves. Another study has been carried out, because low-quality RNA might strongly affect the experimental results of downstream applications. The particular problem of RNA degradation and its effect on relative quantification in qRT-PCR performance was tested in different bovine tissues and cell lines. Thus, gene expression changes by the use of degraded RNA in the physiological study were eliminated and future standards can be anticipated. Different artificial and standardized RNA degradation levels were used and the RNA quality was rated according to the RNA integrity number (RIN). A significant impact of RNA integrity on relative expression results, mainly on cycle threshold values and a minor effect on PCR efficiency was found. To minimize the interference of RNA integrity on relative quantification models a normalization of gene expression by an internal reference gene and an efficiency correction could recommend and were useful in the evaluation of the presented physiological study. Calves were randomized into three feeding groups (n=14 each group) which received milk replacer containing Enterococcus faecium (E. faecium) supplemented with 0% lactulose (L0; control group), 1% lactulose (group L1) and 3% lactulose (L3 group). The calves were weighted weekly. After 19 weeks the calves were slaughtered and tissues were collected for histological and mRNA expression analysis. The main research of this doctoral thesis is the effect of lactulose on zootechnical performance as well as immunemodulatory effects. A broad spectrum of pro- and anti-inflammatory cytokines, T cell population markers, diverse lymphocytes activation markers and immunoglobulin A Fc Receptor (IgA FcR) in different immune and intestinal compartments were assessed. In addition, interactions among lactulose and the morphological development of the gastrointestinal tract (GIT), villi, crypts and lymph follicle in Peyer´s patches (PP) were determined. Changes in the intestinal mRNA gene expression of apoptotic markers were analyzed to confirm the histomorphometrical investigations. The average daily live weight gain tended to be higher (P<0.1) for L3 (1350±59 g/d) than for L0 (1288±59 g/d), although a numerically larger difference was observed in male calves. Histomorphometric studies of the intestine showed various effects elicited by the lactulose rich feed in the ileum and caecum. Compared with L0, a reduction (P<0.001) of ileal villi height due to lactulose treatment and a decrease in the depth of the crypts in the caecum (P<0.001) was observed. In the caecum higher Caspase 3 (P<0.05) and TGF-ß1 mRNA expression were detected. The surface area of lymph follicles from PP was decreased by lactulose treatment of female calves. Anti-inflammatory cytokines like IL-10 and TGF-ß1 were up-regulated in several intestinal
Abstract
VII
compartments. The expression results indicated that the proportion of IgA FcR in the ileal mucosa
of the 3% lactulose treated male calves increased and the IFN-γ mRNA expression decreased. CD4+ presenting lymphocytes decreased in the ileum and mesenteric lymph node by 1% lactulose treatment of female calves, whereas CD8+ presenting lymphocytes were increased in blood. The gene expression analysis of the anti-inflammatory cytokines showed an up-regulation of IL-10 and TGF-ß1 in different compartments of the intestine. The study results support the assumption that lactulose has an effect on the morphology of the intestine. A significant effect on growth performance can not be asserted. However, results permit the conclusion that lactulose feeding has the tendency to increase growth performance. The intestinal immune function may only be affected by the high dose treatment with lactulose, whereas the population of lymphocytes was more effected by 1% lactulose treatment. The results indicate that lactulose has a minor immune modulatory effect in different immune compartments and in the intestine. The effects of lactulose are obviously gender-specific: male calves tended to gain higher body weight and female calves tended to exhibit more changes in intestinal morphology. Our data suggest that the use of lactulose could be meaningful when calves have intestinal irritation. By comparing expenses and gain of performance the economic profit in raising calves might be questionable.

Zusammenfassung
ZUSAMMENFASSUNG
Das Präbiotikum Laktulose gelangt unverändert in das Colon, wo es durch eine saccharolytische Mikroflora metabolisiert wird. Die Verabreichung von Laktulose dient der Wachstumsförderung probiotischer Bakterien und somit der Herstellung einer Eubiose im Darm. Prä- und Probiotika zeigen zudem die Fähigkeit, Leistungsparameter wie Futterverwertung und tägliche Gewichtzunahmen zu verbessern. Die Wirkung von Laktulose auf Wachstumsleistung, Darmmorphologie und Immunsystem preruminanter Kälber wurde noch nicht detailliert erforscht. Zur Aufklärung der Wirkung von oral verabreichter Laktulose in der kombinierten Anwendung mit dem Probiotikum E. faecium auf die Physiologie von preruminanten Kälbern wurde eine Studie durchgeführt. Während der Doktorarbeit hat sich eine weitere Studie ergeben, da die Qualität der RNA die Auswertung der Genexpressionsanalysen stark beeinflussen kann. In einer methodischen Studie wurde die Fragestellung des Einflusses der RNA Qualität auf die relative Quantifizierung in der qRT-PCR aufgegriffen und mit unterschiedlichen bovinen Geweben und Zelllinien untersucht. Somit konnten Änderungen der Genexpression durch die Verwendung von degradierten RNA Proben in der physiologischen Studie ausgeschlossen werden. Aus einer RNA Probe wurden künstlich unterschiedliche Degradierungsstufen hergestellt und anschließend nach ihrer RNA Integritätsnummer (RIN) klassifiziert. Der Zyklusschwellenwert (Ct) bei der relativen Expression wurde stark beeinflusst, wobei die Effizienz der qRT-PCR nur gering beeinflusst wurde. Um den Einfluss der RNA Qualität auf die relativen Quantifizierungsmodelle zu minimieren, wird eine Normalisierung der Genexpression durch ein internes Referenzgen und eine Effizienzkorrektur empfohlen. Zur Auswertung der hier präsentierten physiologischen Studie wurden die neuen Erkenntnisse der methodischen Untersuchung angewendet. Im Fütterungsversuch wurden 42 Kälber in drei homogenen Gruppen (n=14 pro Gruppe) eingeteilt. Die Kontrollgruppe (L0) wurde mit einem Milchaustauscher, der 109 Kolonie bildende Einheiten E. faecium enthielt, gefüttert. Zusätzlich zum Milchaustauscher wurde den Fütterungsgruppen L1 und L3 Laktulose in der Konzentration 1% (L1) bzw. 3% (L3) verabreicht. Die Kälber wurden wöchentlich gewogen und nach einer Versuchsdauer von 19 Wochen geschlachtet. Gewebe für die Histologie und Genexpressionsanalyse wurden bei der Schlachtung entnommen. Der Forschungsschwerpunkt dieser Doktorarbeit war die ertrags- und leistungsbezogene, sowie die immunmodulatorische Wirkung von Laktulose. Dazu wurden diverse pro- und antiinflammatorische Zytokine, T Zell Marker, Aktivierungsmarker der Lymphozyten und der Immunglobulin A Fc Rezeptor untersucht. Weiterhin wurde die Interaktion zwischen morphologischer Entwicklung des Gastrointestinaltraktes, sowie der Zotten, Krypten und Lymphfollikel in den Peyerschen Platten untersucht. Zur Klärung der Apoptoseregulation und zur Bestätigung der histomorphometrischen Untersuchungen wurden Vertreter der Bcl-2 Familie und weitere Apoptose- und Proliferationsfaktoren untersucht. Die durchschnittlichen Tageszunahmen waren tendenziell höher in der Behandlungsgruppe L3
(1350±59 g/d) als in der Behandlungsgruppe L1 (1288±59 g/d), wobei die Differenz zwischen
VIII

Zusammenfassung
beiden Behandlungsgruppen bei den männlichen Kälbern größerer war. In den darmmorphometrischen Studien via Histologie ergaben sich unterschiedliche Effekte der laktulosereichen Fütterung im Ileum und Caecum. Im Vergleich zur Kontrollgruppe L0 fanden sich bei den Laktulose gefütterten Kälbern reduzierte Zottenlängen im Ileum (P<0.001) und reduzierte Kryptentiefen im Caecum (P<0.001). Diese Ergebnisse konnten mittels Expressionsanalyse von diversen Apoptose- und Proliferationsfaktoren nur teilweise bestätigt werden. Im Caecum wiesen Caspase 3 und TGF-ß1 eine erhöhte mRNA Expression auf. Das Ausmessen der Lymphfollikel in den ilealen Peyerschen Platten ergab eine signifikante Abnahme der Follikelfläche (L1: P<0.05; L3: P<0.01) mit geschlechtsabhängiger Ausprägung. Antiinflammatorische Zytokine wie IL-10 und TGF-ß1 wurden in unterschiedlichen Darmabschnitten erhöht exprimiert. Weiterhin wurde durch
Expressionsanalysen ein Anstieg der IgA FcR Expression und Abnahme der IFN-γ Expression im Ileum männlicher Kälber der Behandlungsgruppe L3 festgestellt. Bei weiblichen Kälbern wurden die CD4+ Lymphozyten im Ileum und im mesenterialen Lymphknoten runterreguliert, währenddessen die CD8+ Lymphozyten im Blut hochreguliert wurden. Durch diese Ergebnisse wird deutlich, dass Laktulose eine Wirkung auf die Darmmorphologie hat. Einen signifikanten Effekt auf die Wachstumsleistung konnte nicht beobachtet werden, jedoch kann von einer tendenziell höheren Wachstumsleistung ausgegangen werden. Das Darmschleimhaut-immunsystem wird nur durch die hoch dosierte Laktulose Behandlung moduliert, wobei die Population der Lymphozyten nur durch eine niedrige Dosierung von 1% Laktulose verändert wird. Die Ergebnisse zeigen, dass Laktulose nur eine geringe immunmodulatorische Wirkung hat. Die Effekte sind geschlechtsspezifisch: männliche Kälber zeigen höhere Gewichtszunahmen und weibliche Kälber zeigen eher Änderungen der intestinalen Morphologie. Weitere Untersuchungen sind notwendig um auch die geschlechtsspezifischen Wirkungen eindeutiger zu beschreiben. Die Ergebnisse deuten darauf hin, dass die Fütterung von Laktulose bei einer Irritation der Darmschleimhaut sinnvoll sein kann. Fraglich ist jedoch bei einem Vergleich von Aufwand und Leistungssteigerung der ökonomische Vorteil in der Kälberaufzucht.
IX

Introduction
1
INTRODUCTION
The presented study is composed of a bioanalytical section and a physiological in vivo section. During the establishment of techniques a tissue dependent RNA integrity level was observed. It is well known, that an essential requirement for a successful quantitative mRNA analysis using qRT-PCR is the usage of intact RNA. Low-quality RNA may strongly affect the expression results. The knowledge about the influence of the RNA quality results in an intensive bioanalytical work, to eliminate errors in gene expression changes in the in vivo study.
Bioanalytics: problems with a successful quantitative mRNA analysis
The accuracy of gene expression evaluation is recognised to be influenced by the quantity and the quality of starting RNA. Investigations with low quality RNA as starting material supply wrong qRT-PCR results [1]. The most obvious problem concerns the degradation of the RNA and so the extraction and purification procedure of total RNA must fulfill several criteria such as: free of protein; free of genomic DNA; free of enzymatic inhibitors for Reverse Transcription (RT) and PCR reaction; free of nucleases for extended storage and the RNA should be undegraded [2,3]. There are a substantial quantity of problems that affect reproducibility and hence the relevance of results. The source of RNA, sampling technique, as well as RNA isolation techniques often vary significantly between processing laboratories [2,4]. The need to isolate high quality total RNA from wide variety of clinical and/or experimental tissue samples becomes more important for quantitative gene expression studies. Due to its inherent susceptibility to ubiquitous RNAses and its chemical instability, RNA is readily endangered by alkaline- or enzyme-catalyzed hydrolysis. After extraction the RNA is unstable and long mRNA, up to several kilo bases, is very sensitive to degradation [2]. Researchers must take into account a variety of factors, which influence their ability to obtain high-quality RNA that is free of contamination [5]. Verification of RNA integrity prior to usage in downstream qRT-PCR application permits experiments to be compared and provide more accurate and reliable results. The micro-fluidic capillary electrophoresis, such as the Agilent 2100 Bioanalyzer (Agilent Technologies, Palo Alto, CA) has developed into a common tool for assessing the RNA quality, particularly in the gene expression profiling platforms [6]. RNA degradation is a gradual process with a decrease in the 28S to 18S ribosomal band ratio (Fig. 1). The 28S/18S ratio is calculated automatically, but it may not be used as a gold standard for assessing RNA integrity because of its high variability (coefficient of variability 19-32%) [1,5]. A new tool for a better interpretation of the RNA quality is the RNA Integrity Number (RIN). The algorithm assigns a RIN number scored from 1 to 10, where level 10 represents a completely intact RNA, and 1 presents a highly degraded RNA [6]. An interpretation of RNA integrity is facilitated, comparison of samples is possible and repeatability of experiments is ensured.

Introduction
2
A
B
Figure 1: Electropherograms from a white blood cell (WBC) sample with different RNA degradation levels, but with the identical transcriptome. A) No degradation of the RNA with a RNA integrity number (RIN) 9.6 and well formed 18S and 28S peaks. B) Highly degraded RNA with completely reduced 18S and 28S peaks which results in the RIN 2.8.
While it is obvious that intact RNA constitutes the best representation of the natural state of the transcriptome, there are situations in which gene expression analysis even on partially degraded RNA may be desirable, e.g. in ancient, necrotic, clinical or biopsy samples. Nevertheless, little is known about the possibility of obtaining reasonable qRT-PCR data from RNA samples with impaired RNA quality. There are no statistical confirmed studies available at which threshold RNA integrity is useless for quantitative downstream applications.
In vivo investigations: Lactulose as feed additive
Prebiotics and probiotics as feed additive
Nutritional and disease problems in calves continue to be an important part of dairy practice and are an important and increasing source of revenue for beef practitioners. Calves diseases –particularly diarrhea and respiratory diseases – have significant effects on the profitability of every calf raising enterprise. Young dairy calves are subjected to several stressors such as nutritional, environmental, social and microbial imbalances, which are the cause for disease. As a result, animals consume less milk [7], are predisposed to impaired intestinal morphology and intestinal function [8,9], showed a high incidence of diarrhea and growth depression and may be afflicted with impaired immune function [10]. For several decades, prophylactic doses of antibiotics and chemotherapeutics have been used in animal feed to improve animal welfare and to obtain economic benefits in terms of improved animal performance and reduced medication costs. However, there are increasing concerns about the risk of developing multiple antibiotic resistances in pathogenic bacteria and cross-resistance in livestock. With the ban on dietary antibiotics as growth promoters within the European Union,

Introduction
3
animal nutritionists are seeking alternatives to these promoters, particularly for young animals [11]. Potential feed additives in the diet for young calves to date are prebiotics, probiotics, vitamins, minerals [12] and organic acids. In the first instance the maintenance of the gut health is an important objective. One of the approaches for enhancing the beneficial endogenous microflora in the gut is the use of prebiotics. The term prebiotic was introduced by Gibson and Roberfroid [13] who defined prebiotics as "a non-digestible food ingredient that beneficially affects the host by selectively stimulating the growth and/or activity of one or a limited number of bacteria in the colon." This definition more or less overlaps with the definition of dietary fiber, with the exception of its selectivity for certain species. This selectivity was shown for bifidobacteria, which may be promoted by the ingestion of substances, mostly oligosaccharides (OS), such as fructo-OS and inulin [13,14,15], transgalactosylated-OS [16], galacto-OS, soybean-OS [17], isomalto-OS and oligofructose (Tab. 1). Physiological effects of non absorbable carbohydrates include increased fecal bulk, increased short chain fatty acids (SCFA) production, and modification of bacterial populations [18,19]. They beneficially affect the host by selectively stimulating growth and /or the activity of one or a limited number of bacteria in the colon [13,20,21]. Prebiotics that stimulate the intestinal growth of probiotics lactobacilli include several well-characterized OS [22], inulin and lactulose [18,23,24]. It is expected that prebiotics will improve health in a way similar to probiotics, whilst at the same time being cheaper, carrying less risk and being easier to incorporate into the diet than probiotics [ ]25 .
Table 1: Major oligosaccharide candidates for prebiotics
Oligosaccharides (OS) Structure Linkages Process Origin
Xylo-OS (Glu)n ß-1,4 Hydrolysis Cereals
Lactulose Gal-Fru ß-1,4 Isomerisation Lactose
Isomalto-OS (Glu)n α-1,6 Hydrolysis Algae
Gluco-OS (Glu)n α-1,2 and α-1,6 Synthesis Sucrose
Galacto-OS (Gal)n-Glu ß-1,4 and ß -1,6 Synthesis Lactose
Fructo-OS (Fru)n-Glu (ß-2,1)- α-1,2 Synthesis Sucrose
Oligofructose ((Fru)n-(Fru)n-Glu (ß-2,1) Hydrolysis Inulin
Lactulose is a disaccharide analogue of lactose that cannot be digested by mammalian enzymes because of its specific structure (4-O-ß-D-galactopyranosyl-D-fructose) (Fig. 2). Thus, lactulose cannot be absorbed by the small intestine nor digested by pathogenic bacteria, but it is a suitable substrate for some probiotic bacteria in the gut [ ]26 . As such, lactulose is a tool for regulation of the bacterial ecology [27].

Introduction
4
Figure 2: Chemical structure of Lactulose
Numerous scientists investigated the health-promoting effect of prebiotics like indigestible sugars, e.g. fructo-OS, inulin and lactulose [15,28]. The positive effects of lactulose on colonic metabolism in human, rat, mouse, and pig are well known [29,30]. Several reports have shown that supplementing a diet with oligofructose or lactulose improved growth in pigs [31,32] or in calves [33]. Other reports did not find growth effects [34,35]. The reasons for the different results may be due to the different chemical structure and compositions of the prebiotics used. Other factors which may also explain variations in results include growth phase of the animal, the type of dosing used and the hygienic condition of the housing [36]. Furthermore, probiotics may be used as one of the potential alternatives for feed additives. The term is used to describe living microbial feed supplements which beneficially affect the host animal by improving its microbial balance [37,21]. They have been reported to increase feed intake, growth rate, weight gain, improve feed conversion, decrease fecal coliform count, reduce demand for antibiotic treatment [38] and enhance immune responses [39]. There are several proposed mechanisms by which probiotics may protect the host from the intestinal disorder [40]:
Probiotics produce several inhibitory substances such as organic acids, hydrogen peroxide and bacteriocins. These substances may limit the harmful bacteria in the gut.
Probiotic microorganisms may prevent the utilization of nutrients by pathogenic bacteria.
Competitive inhibition for pathogen bacteria adhesion on intestinal epithelial surfaces which will allow to rapidly colonization of the intestinal trac.
They can protect against intestinal disease by stimulating the specific and nonspecific immunity.
The aerobic, gram-positive lactic acid bacteria Enterococcus faecium (E. faecium) is a normal inhabitant of the gut flora of animals [41] with inhibitory effects against important enteropathogens [42]. It was recently shown, that E. faecium stimulates the mucosal and the systemic immune system in dogs [43]. Furthermore E. faecium stabilizes the intestinal microflora and increases the weight gain of calves and young pigs [44,45]. Another possibility of microflora management is the use of synbiotics, whereby probiotics and prebiotics are used in combination [13]. The synbiotics will have more beneficial effects on gut health and growth than using either pre- or probiotics separately, because the synergistic effects

Introduction
5
can be useful in stimulating beneficial bacteria and improving the health of the gut [40]. The effects of a synbiotic feeding on the immune response were analyzed in previous studies with rats [46], mice [47], dogs [48] or pigs. Furthermore, results of several studies have been inconsistent and thus they were not directly comparable. However, there is little information on synbiotics and its possible mechanisms in young calves.
Intestinal immune system
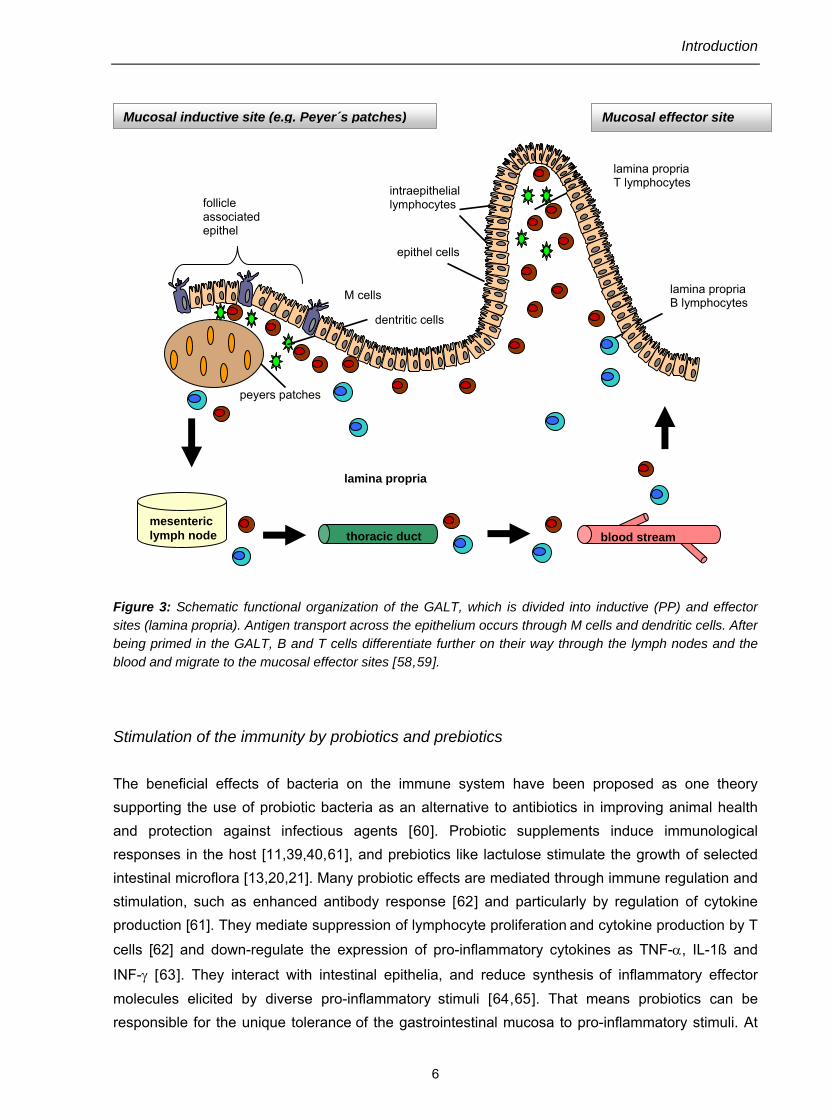
The gut and the immune system have evolved to provide effective digestion and simultaneously defense against ingested toxins and pathogenic bacteria. Most protection against potential pathogens occurs via a mucosal immune system involving mechanisms of innate immunity as well as a secondary lymphoid organ, the gut-associated lymphoid tissue (GALT) [11]. The unique characteristics of the intestinal immune responses are secretory immunoglobulin A (IgA) production and oral tolerance [47]. The ability of the mucosal immune system to distinguish between harmful and harmless antigens is essential to mount a protective immune response and to prevent the induction of mucosal pathology [49]. Oral tolerance presumably evolved to prevent hypersensitivity reactions to food proteins and bacterial antigens in the mucosal microbiota [50]. The regulatory events of the intestinal immune response occur in different physiologic compartments: aggregated in follicles and peyers patches (PP) and distributed within the mucosa, the intestinal epithelium, and secretory sites [51]. The inductive site of the immune reactions to oral antigens, mainly the PP consists of aggregations of lymphoid follicles. Their surface is covered by the follicle-associates epithelium which contains specialized epithelial cell types, known as M cells. The M cells transport antigens via transcytosis from the lumen to cells of the immune system, thereby initiating an immune response or tolerance [52]. In the PP, antigens are presented by antigen presenting cells (macrophages and dendritic cells) to both immature T and B cells [53]. Activated T cells preferentially differentiate into CD4+ (cluster of differentiation) T helper cells which, aided by dendritic cells and secretion of cytokines such as transforming growth factor beta 1 (TGF-β1) and interleukin 10 (IL-10), induce the differentiation of antigen-specific B cells to predominantly IgA-committed plasmablasts [54,55,56]. Early studies suggested that CD8+ "suppressor" T cells were important, but it is now accepted that it may involve either anergy/deletion of CD4+ T cells, or the induction of regulatory CD4+ T cells that produce IL-10 and/or TGF-ß1 [57]. The GALT derived B cell blasts proliferate and differentiate further on their way through the mesenteric lymph nodes (mLN) and the thoracic duct into the bloodstream. Then they migrate preferentially to the mucosal effectors site (i.e. lamina propria and intraepithelial regions, but not PP). Here they complete their terminal differentiation to IgA-producing plasma cells – a process called ‘homing’ [53]. A schematic depiction of the functional organization of the GALT with inductive and effector sites, is shown in figure 3.
Introduction
6
Mucosal inductive site (e.g. Peyer´s patches) Mucosal effector site
lamina propria
lamina propria T lymphocytes
lamina propria B lymphocytes
peyers patches
intraepithelial lymphocytes
epithel cells
dentritic cells
M cells
follicle associated epithel
thoracic duct mesenteric lymph node blood stream
Figure 3: Schematic functional organization of the GALT, which is divided into inductive (PP) and effector sites (lamina propria). Antigen transport across the epithelium occurs through M cells and dendritic cells. After being primed in the GALT, B and T cells differentiate further on their way through the lymph nodes and the blood and migrate to the mucosal effector sites [58,59].
Stimulation of the immunity by probiotics and prebiotics
The beneficial effects of bacteria on the immune system have been proposed as one theory supporting the use of probiotic bacteria as an alternative to antibiotics in improving animal health and protection against infectious agents [60]. Probiotic supplements induce immunological responses in the host [11,39,40,61], and prebiotics like lactulose stimulate the growth of selected intestinal microflora [13,20,21]. Many probiotic effects are mediated through immune regulation and stimulation, such as enhanced antibody response [62] and particularly by regulation of cytokine production [61]. They mediate suppression of lymphocyte proliferation and cytokine production by T
cells [62] and down-regulate the expression of pro-inflammatory cytokines as TNF-α, IL-1ß and
INF-γ [63]. They interact with intestinal epithelia, and reduce synthesis of inflammatory effector molecules elicited by diverse pro-inflammatory stimuli [64,65]. That means probiotics can be responsible for the unique tolerance of the gastrointestinal mucosa to pro-inflammatory stimuli. At
Introduction
7
present less prebiotic substances are known that beneficially affect the immune system [48]. It was reported that inulin and oligofructose can modulate functions of the immune system, primarily the activation of immune cells in PP [66]. The simultaneous application of lactulose and the probiotic bacteria E. faecium could amplify the beneficial effects on the immune system.
AIM OF THE STUDY
The intactness of RNA and its influence on the qRT-PCR results from different bovine tissues and cell lines were analyzed to count out gene expression changes in the presented in vivo study by the use of degraded RNA and to anticipate future standards for the threshold at which RNA integrity is useless for quantitative down-stream applications. Furthermore, the correlation between RNA quality, PCR performance, PCR efficiency and length of amplified product was analyzed. The major objective of the in vivo study was to investigate the mode of action of lactulose on the intestinal immune function, intestinal morphology, growth performance and health of E. faecium fed pre-ruminant calves.

Material and methods
8
MATERIAL AND METHODS
Bioanalytical investigations: RNA quality and the effect on qRT-PCR results
Sample preparation and artificial total RNA degradation
Two experiments have been carried out. The particular problem of RNA integrity and its effect on relative quantification in qRT-PCR performance (experiment 1) was tested in different bovine tissues and cell lines (n=11). The effect of different length of amplified products and RNA integrity on expression analyses was investigated in the second experiment with extracted RNA from four bovine tissues. RNA purification in both experiments was performed by an in-house standardized phenol-based extraction method using peqGOLD TriFast (PeqLab, Erlangen, Germany) [72]. In order to get RNA samples with different and standardized degradation levels, but with the identical transcriptome and tissue typical mRNA distribution, intact cellular RNA was artificially degraded either enzymatically via ubiquitary skin RNAses or by irradiation with ultraviolet-C radiation at 200-280 nm (Kendro Uv-C30, Langenselbold, Germany). For both experiments, intact RNA samples from the identical tissue extraction were mixed in various ratios with degraded RNA samples to generate a RIN gradient. Each sample consist of 10-12 denaturation grades and ranging from intact RNA (RIN>7.5) to highly degraded RNA (RIN<3). In total 135 samples were investigated. For the analysis different artificial and standardized RNA degradation levels were used and the RNA quality was rated according to the RIN [72]. For the rapid quantification of nucleic acids the Agilent 2100 Bioanalyzer (Agilent Technologies) was used.
One step qRT-PCR and relative quantification
In first experiment the expression levels of four representative genes (18S, 28S and ß-actin and IL-1ß) were measured. High abundant ribosomal 18S and 28S rRNA subunits, medium abundant ß-actin and low abundant IL-1ß genes were used to cover all possible abundance levels of a normal distributed transcriptome. Quantification was performed using the SuperScript III Platinum SYBR Green One-Step qRT-PCR Kit (Invitrogen Life Technologies, Carlsbad, CA) [72]. Ct values and qPCR efficiency were computed with the “comparative quantification” method in the Rotor-Gene 3000 software version 6.0 (Corbett Life Science, Sydney, Australia). In the first relative quantification approach no efficiency correction was performed according to the delta-delta Ct model [67]. In the second approach the efficiency correction was implemented additionally (Fig. 4) and the advances of an efficiency corrected quantification model were used [73]. The derived relative expression values describe the relative quantification change in expression of the target gene relative to the reference gene 28S expression.

Material and methods
9
Figure 4: Efficiency corrected quantification model For the second experiment seven PCR primer sets were designed using HUSAR software (DKFZ, Heidelberg, Germany) and synthesized by MWG Biotech (Ebersberg, Germany) to amplify different sequence fragments of ß-actin [72]. All statistical analyses were performed by using Sigma Stat 3.0 (SPSS Inc., Chicago, IL). The determined P-values were analyzed using linear regression and the coefficient of determination (R2). Significance of linear regression was tested by student t-test.
In vivo investigation: Physiological effect of lactulose in calves
Animals, husbandry, feeding and experimental procedures
42 Simmental calves were divided into three homogenous experimental groups (n=14) according to their weight, age and gender (7 male and 7 female calves) as previously described [68]. Animals were housed at the experimental station Karolinenfeld (Bayerische Landesanstalt für Landwirtschaft - LfL, Institute of animal nutrition and feed economy). During the feeding experiment, all calves were fed with milk replacer (MR) from Milkibeef Top (Milkivit, Trouw Nutrition, Burgheim, Germany) added with 109 CFU E.faecium per kg MR. Feeding group L0 served as control. The other two groups were fed with MR enriched by 1% (L1) and 3% (L3) dry matter lactulose (Lactusat, Milei GmbH, Germany). Therefore, the MR for group L1 and L3 was mixed with 2.5% and 7.5% Lactusat (Milei GmbH, Germany) which contains 42% lactulose. To guarantee a balanced feeding regime, in terms of energy and protein concentration, the Lactusat was added in exchange against whey powder. Calves of all feeding groups received MR in volumes up to 17.5 l/d in the experimental period of 19 weeks controlled by transponder automatic feeder (Förster Technik, Engen, Germany). The MR was reconstituted in hot water (65°C) and fed at a temperature of approximately 41°C. The starting MR concentration at the beginning of the study was 125 g/l, with a continuous increase up to 250 g/l at the end of the study. All calves had free access to fresh
water and 0.5 kg hay per day. After the dosing period of 133 ± 8.3 days, animals were slaughtered. The general health status of the calves was monitored by daily physical examination, checking general appearance, animal activity, feces composition, and time to time rectal temperature. Animals were further inspected by a veterinarian on a weekly basis to confirm identical health status of the feeding groups. The experimental procedures followed the current German law on animal production and veterinary inspection (LfL, Grub, Germany).

Material and methods
10
The statistical analysis of the zootechnical performance was done by Sigma Stat 3.0 (SPSS Inc.) using the two-way ANOVA.
Tissue collection and blood samples
Tissue sampling: The GIT was removed and a 1- to 2 cm long cross-section from the small intestine (mid jejunum, mid ileum), large intestine (caecum, colon), mLN and spleen were obtained at the time of slaughter. Immediately after collection the tissues were placed into individually labeled cryotubes and frozen in liquid nitrogen. The cryotubes were stored at -80°C until analysis [69]. For histological analysis the tissue pieces were washed twice in physiological 0.9% NaCl solution and the tissue sections were embedded and transferred in 10% buffered formalin (Carl Roth GmbH, Karlsruhe) for 24h as described previously [68,79]. Blood sampling: 2x 15 ml blood samples were collected from the jugular vein using an EDTA and serum vacutainer tube (Greiner bio-one GmbH, Frickenhausen, Germany) following euthanasia. For hematological analysis the blood samples were forwarded in EDTA vacutainer tubes to a veterinary laboratory (Vetmed Labor, Unterhaching, Germany). Hematocrit and hemoglobin concentration, erythrocyte, thrombocyte and white blood cell (WBC) numbers were determined with the CELL-DYN 3700SL System (Abbott Diagnostika GmbH, Wiesbaden, Germany). Furthermore a blood smear was sent to obtain a differential white cell count. Blood smears were stained with May-Grünwald’s eosin-methylene blue solution (Merck 1424) and Giemsa solution (Merck 9204) [70]. The percentage of the different WBC subtypes, like granulocytes, lymphocytes, monocytes and atypical cells were determined. For WBC mRNA expression analysis EDTA blood was diluted 1/1 (v/v) with lysis buffer (830 mg NH4Cl, 3.7 mg Na-EDTA, 100 mg KCl in 100 ml H2O pH 7.4) and centrifuged for 10 min at 220 g. The cell pellet was again suspended in lysis buffer and centrifugation was repeated. Supernatants of blood samples were discarded and leucocytes were transferred in 350 µl RNA extraction lysis buffer (Macherery-Nagel, Düren, Germany).
Histology and histomorphometry of intestinal mucosa
The collected specimen were trimmed and embedded in paraffin. Thin sections (7-8 µm) were cut using the Microtom LEICA RM2145 (Leica, Wetzlar, Germany), mounted on glass slides, and stained with haematoxylin and eosin according to Mayer (1969) and covered with Euktit (Merck, Darmstadt, Germany). Histological sections were examined with the light microscope Axioskop 2 plus (Zeiss, Oberkochen, Germany) with a 10x/0.30 Plan-Neofluar objective connected to the video-based, computer-linked AxioVision 3.1 system that was programmed to perform morphometrical analysis [71]. Only for the measurement of the lymph follicle in the PP the Stemi 2000-C (Zeiss) was used with the 2.5 x objective. Pictures were taken with the AxioCam MRc (Zeiss). The applied objective was changed depending on the examined tissue.

Material and methods
11
Villus height, crypts depth and the width were evaluated on three well-orientated villi- and crypt- preparations for each intestinal sampling site (Fig. 5). Triplicate measurements for every category (height, depth, width) and section (jejunum, ileum, caecum, colon) were evaluated. Furthermore, the area of at least six lymph follicles of PP in the ileum (n=84 per group) were evaluated. For confirming the uninjured mucosa integrity of the collected samples, the following qualitative criteria were controlled: villus fusion, villus atrophy, crypt architectural disruption, disruption or distortion of epithel cells and lymph follicles.
All measurement values are expressed as mean ± standard error of mean (SEM). For group differences, villus heights and width, villus height/width ratios, crypt depths and width and surface of the lymph follicle of PP were analyzed with the statistical program Sigma Stat 3.0 (SPSS Inc.) using two-way ANOVA. In order to find out whether lactulose has different sex-specific effects the pair wise multiple comparison procedures were processed with the Holm-Sidak method. The significance level was set at 0.05 for all tests.
Figure 5: Morphological measurements in the intestine: (1) lamina muscularis mucosae; (2) crypt of Lieberkuhn; (3) villus. Measurements in the small and large intestine were combined pictured in the diagram. Small intestine: (a) villus height (from the tip of the villus to the lamina muscularis mucusae; (b) villus width (distance from villi-junction to the next – perpendicular to the height). Large intestine: (c) depth of crypt (from the tip to the lamina muscularis mucusae – in the large intestine villi is inexistent; (d) width of crypt (perpendicularly to the depth).
Total RNA extraction and mRNA analysis
Total RNA from blood samples and each tissue sample (~50 mg) was extracted by using TriFast reagent (Peqlab) essential as recommended by the manufacturer. The quality and quantity of extracted total RNA were assessed using UV spectrophotometry. Integrity of the extracted total RNA was verified by optical density A nm/A260 280 nm absorption ratio. A second quality control was done by a micro-fluidic capillary electrophoresis [72]. 100 ng of each experimental RNA sample was loaded onto a RNA 6000 Nano Chip and examined using the Bioanalyzer 2100 (Agilent

Material and methods
12
Technologies). A commercially available and optimized RNA length standard ladder (Ambion, Austin, TX) during electrophoresis allows the evaluation of sizes of RNA bands. One step real-time qRT-PCR was performed by using the SuperScript III Platinum SYBR Green One-Step qRT-PCR Kit (Invitrogen Life Technologies) by a standard protocol in a Rotor-Gene 3000 (Corbett Life Science) as described previously [69]. Bovine sequence-specific primers were designed by using the HUSAR program (DKFZ) and were synthesized by a commercial facility (MWG Biotech). Sequences used for primer design were obtained from public databases (GenBank, National Center for Biotechnology Information) as coding DNA sequence. The primer sequences are listed in table 2.
Data evaluation
Cycle threshold (Ct) and single run efficiency (E) values were achieved for each analyzed sample and gene using the Rotor-Gene 3000 software version 6.0 (Corbett Life Science). Ct and E data for male and female calves (each n=7) were analyzed separately. The relative expression changes were evaluated by using the single-run-specific efficiency-corrected relative expression model [73]. But in contrast to the previous described model (Fig 4), the advanced relative quantification model was used. To assess the effect of the lactulose feeding on cytokine gene expression in the different tissues the relative expression ratio ( R ) was calculated, compared to the arithmetic mean expression of three reference genes (ß-actin, GAPDH, Ubiquitin). To factor the PCR efficiency into the analyses each analyzed sample was calculated apart with the sample specific efficiency, according to the calculation model shown in figure 6.
(ERG1)CPsample
(ETG)CPsample
÷R =+ (ERG2)
CPcontrol
CPcontrol
CPcontrol CPcontrol
(ETG)
+ (ERG2)CPsample (ERG1)+ (ERG3)
CPsample + (ERG3)
Figure 6: Single-run-specific efficiency-corrected relative expression. For normalization of each analyzed target gene in the presented study the mean expression of three reference genes (ß-Actin, GAPDH, Ubiquitin) was calculated. Further the PCR efficiency of mentioned genes was included in the calculation model.
Cytokine mRNA expression is presented as relative expression whereas the appropriate mean control group value was used as the calibrator. Values were expressed as means ± SEM. Analysis for cytokine expression was done by the two-way ANOVA. In order to find out whether lactulose has different sex-specific effects the pairwise multiple comparison procedures were processed with

Material and methods
13
Holm-Sidak method. The significant level was set at 0.05 for all tests and the statistical analysis was performed with Sigma Stat 3.0 (SPSS Inc.). Table 2: Primer used for qRT-PCR.
Identity Sequence [5' 3'] Size [bp] Accesion No
FOR AAC TCC ATC ATG AAG TGT GAC G ß-Actin
REV GAT CCA CAT CTG CTG GAA GG 202 AY141970
FOR GTC TTC ACT ACC ATG GAG AAG G GAPDH
REV TCA TGG ATG ACC TTG GCC AG 197 U85042
FOR AGATCCAGGATAAGGAAGGCAT Ubiquitin
REV GCTCCACCTCCAGGGTGAT 198 Z18245
FOR TTC TCT CCA GCC AAC CTT CAT T IL-1ß
REV ATC TGC AGC TGG ATG TTT CCA T 198 M37211
FOR CCA CGT TGT AGC CGA CAT C TNF-α
REV CCC TGA AGA GGA CCT GTG AG 197 NM173966
FOR ATG ACT TCC AAG CTG GCT GTT G IL-8
REV TTG ATA AAT TTG GGG TGG AAA G 149 AF232704
FOR ACG TCA CTG GAG TTG TGC GG TGF-ß1
REV TTC ATG CCG TGA ATG GTG GCG 267 XM592497
FOR CCT GGA AGA GGT GAT GCC AC IL-10
REV GTT TTC GCA GGG CAG AAA GCG 132 U00799
FOR CTT GAA TGG CAG CTC TGA GAA AC INF-γ
REV GGC CTC GAA AGA GAT TCT GAC 112 M29867
FOR GAC AAA CCC TTT CTC TCC ACC IgA FcR (CD89)
REV ACA GGA CCC AGA GTG AAG TC 180 AY247821
FOR ATG GAG CCA AGC TTG CTG ATG T CD25
REV TCT GCG GAA GCC TGT CTT GCA 171 Multi
FOR GTC ATT GAT TCT AAA GAG GAC ATG ACD69
REV AGG TTG AAC CAG TTG TTA AAT TCT 137 AF272828
FOR GAT CGA GGT CTT GCC TTC AG CD4+
REV GAT CTG AGA CAT CCG TTC TGC 237 Multi
FOR ACT GTG TAT GGC AAG GAG GTG CD8+
REV GGG TAT CCC AAT GAT CAT GCA G 127 XM585436
FOR AAC TGT GAG GTG GTC CTT GG EGFR
REV AAA GCA CAT TTC CTC GGA TG 173 AY486452
FOR AAG GGA GGC ATG ACT GTG TC PECAM-1
REV TAA TCA CCT CGA ACC TGG AG 187 NM_174571
FOR GGG ATT CAG CGA CCT GAC Bcl-xl
REV CCA TCC AAG TTG CGA TCC 203 AF245487
FOR TCT GAC GGC AAC TTC AAC TG BAX
REV AAG TAG GAG AGG AGG CCG TC 194 L22473
FOR GCA ACG TTT CTA AAG AAG ACC ATA GCaspase 3
REV CCA TGG CTT AGA AGC ACA CAA ATA A64 AY57500

Results and Discussion
14
RESULTS AND DISCUSSION
In the bioanalytical research the intactness of RNA and its influence on the qPCR results were analyzed. Future standard for the work with degraded RNA should elaborate and the correlation between RNA quality, PCR performance, PCR efficiency and length of amplified product was specified. The new acknowledgements were used for the evaluation of the in vivo study with calves. Consequently gene expression changes by different output RNA integrity in the in vivo study were count out.
Bioanalytical research
Many factors present in samples as well as exogenous contamination have been shown to inhibit RT as well as PCR. Further problem may arise in the case of research on human or animal tissue sampling techniques and the time dependency until the tissue is stored safely in RNase inhibitors or RNA-later. It is often very challenging to decrease this sampling time to a minimum within the framework of clinical routine procedures, or in animal experiments during a slaughtering process. The dependence of the RNA integrity on various calf tissue samples, WBC and different cell lines was determined in this presented work (Fig. 7). As shown for solid tissues the average RIN is between 6 and 8. Tissues or organs with high content of connecting tissue, e.g. in the gastrointestinal tract like rumen, omasum and jejunum, underlie high RNA degradation through the sampling and extraction procedure and show great RIN variations. The reason for this variability might be the solid and tough structure of the tissues, e.g. connecting or fatty tissue, the RNase enzymatic activity and problems during tissue sampling and storage. Furthermore tissues from the gastrointestinal tract have been washed in physical saline solution to get rid of any disturbing gut substances. Thus the physiological constitution of the tissue, the time and management of tissue sampling has a bearing on the degradation level of RNA. In contrary single cells like WBC or cell derived from cell-lines have higher RIN. Cell sampling and RNA extraction is much faster and easier, because cells are better accessible and were not kept in any sub-optimal conditions. Therefore RNA integrity based on the RIN classification is much better and lay around RIN 9. The importance of isolation technique for a good RNA quality is shown in detail in Fleige et al. [72].

Results and Discussion
15
liver
hear
tsp
leen
lung
ru
men
retic
ulum
omas
umab
omas
um
ileum
jeju
num
colo
nca
ecum
mes
. lym
ph n
ode
kidne
y cel
lco
rpus
lute
umgr
anul
osa
cell
ovid
uct
WBC
RIN
0
2
4
6
8
10
Figure 7: Average RIN of various bovine tissues and cell lines. The bovine tissues and the WBC derived from the presented in vivo study with calves. Solid tissues showed an average RIN between 6 and 8, whereas tissues from the gastrointestinal tract like rumen, omasum and jejunum show great RIN variations. High quality RNA was achieved from WBC or cells derived from cell-lines (modified by Fleige, 2006).
Effect of RNA integrity on PCR performance
Each amplified gene was tissue specifically influenced by the RNA integrity. This demonstrates an incomprehensible tissue-matrix-effect between RNA integrity and type of tissue and the analyzed transcript (Fig. 8A). A significant negative relationship between the RIN and Ct for all tested samples is proven (P<0.001). Other reports could confirm the direct influence of RNA integrity on the absolute expression results [1]. Degradation does not prelude micro array analysis if comparison is done using samples of comparable RNA integrity [74]. The effect of RIN on PCR efficiency was investigated similarly to the above mentioned tissues and various RNA qualities [5,72]. The efficiency of all investigated genes was not affected by the RNA quality, independent of gene or tissue (Fig. 8B). Some tissues reveal a positive coefficient of regression, but looking over all analyzed genes and tissues [72] the RIN effect on qPCR efficiency was minor, compared to the influence on Ct.

Results and Discussion
16
RNA integrity number [RIN]0 2 4 6 8
cycl
e th
resh
old
[Ct]
A
105
10
15
20
25
18 S28 Sß-actinIL-1ß
RNA integrity number [RIN]0 2 4 6 8
effic
ienc
y
101.0
1.2
1.4
1.6
1.8
2.0
18 S28 Sß-actinIL-1ß
Figure 8: Distribution of the qRT-PCR absolute expression measured on 12 RNA aliquots in triplicates (n=36) from lymph node (cited as an example for all tested tissues and cell cultures) using 18S, 28S, ß-actin and IL-1ß. (A) Negative correlation between cycle threshold and RIN. (B) No correlation between single-run PCR efficiency and RIN.
Impact of RIN on relative quantification
Normalization by an internal reference gene reduces or even diminishes tissue derived effects on qRT-PCR [75]. To test the effect of normalization, expression results of 18S, ß-actin and IL1ß were normalized to the reference gene 28S rRNA. The applied standard should be not regulated or be at least minor regulated, like in the applied study the 28S rRNA expression. An accurate and relevant
B
18S rRNA: R2 = 0.911 P<0.001 y = 0.633x + 17.38 28S rRNA: R2 = 0.911 P<0.001 y = 0.492x + 15.38
ß-actin: R2 = 0.812 P< 0.001 y = 0.794x + 15.06 Il-1ß: R2 = 0.902 P< 0.001 y = 0.674x + 24.68
18S rRNA: R2 = 0.009 P=0.58 y = -0.002x + 1.73 28S rRNA: R2 = 0.074 P=0.11 y = 0.001x + 1.75
ß-actin: R2 = 0.004 P=0.74 y = 0.0009x + 1.77 Il-1ß: R2 = 0.348 P< 0.01 y = 0.017x + 1.68

Results and Discussion
17
normalization to some internal standard is obligatory for biologically meaningful mRNA quantification [76]. The relative quantification alteration in expression of the target gene relative to the reference gene was performed in two ways: first according to the delta-delta Ct method, and second by the single-run-specific efficiency-corrected relative expression model. Normalization of expression data on the basis of varying RNA integrities with an internal reference gene resulted in both models a RIN dependent effect [5,72]. For nearly all genes and tissues we could show a significant effect on relative expression level dependent on the RNA quality (P<0.001). To visualize the results, as shown after normalization, fourfold more ß-actin molecules could be found comparing highly intact to degraded RNA (Fig. 9), meaning around 75% ß-actin mRNA was degraded. Statements about importance of normalization and efficiency correction could certify herewith. Results demonstrate that innovative new quantification methods and models can improve future mRNA quantification.
18S rRNA: R2 = 0.129 P<0.05 y = 0.042x + 0.45
ß-actin: R2 = 0.543 P< 0.001 y = 0.581x + 0.001
Figure 9: Single-run efficiency-corrected relative expression ratio E(RG)^Ct(RG) / E(TG)^Ct(TG) ratio versus RIN. Distribution measured on 12 RNA aliquots in triplicates (n=36) from lymph node (cited as an example for all tested tissues and cell cultures) using 28S as reference gene. All genes showed a significant effect on relative expression levels dependent on the RNA quality (P<0.001).
Interrelation between RIN and length of amplified product
The length of the amplified product influences the PCR efficiency such as primer length, annealing temperature, and secondary structure [2]. Quantitative RT-PCR involves analysis of smaller mRNA regions and is therefore more tolerant of partially degraded RNA. To test the effect of length of amplified PCR products on qRT-PCR, a gradient with several steps of intact RNA down to degraded RNA was examined with seven primer sets, amplifying qRT-PCR products of various lengths up to 976 bp. The results of correlation between RIN and Ct fulfilled the expectation for all
Il-1ß: R2 = 0.311 P< 0.001 y = 0.0008x + 0.01
ß

Results and Discussion
18
tested tissues that with increasing RIN the Ct is shifted to lower cycle number for all product lengths. Similarly, low quality RNA pointed a high variability in qRT-PCR results (Fig. 10). The graph is subdivided in four quadrants, which show the best repeatability in quadrant IV with high RNA integrity (RIN>5) and product length up to 200 bp. These results could be confirmed for all analyzed tissues. Quadrant I and III showed low RNA quality (RIN<5) and high variability in qRT-PCR results. Late and highly variable Ct values (quadrant II) are also due to amplified product length over 400 bp and good RNA quality. High Ct values for 800 and 950 bp may result form inefficient amplification as from to long qRT-PCR products and the applied stringent cycle conditions. Maximum amplicon size should not exceed 400 bp (ideally 80-150 bases). Smaller amplicons give more consistent results because PCR is more efficient and more tolerant in reaction conditions. The length of the amplified product is a very important part for primer design.
Figure 10: Relationship between RNA integrity and length of the amplified product. Integrity of 23 bovine corpus luteum RNA sample (cited as an example for all tested tissues) profiles was scored using the RIN software. Cycle threshold (Ct) values in dependence on amplicon length and RNA integrity. Comparative analysis was done using ß-actin with different length of the amplified product and the graph is divided in four quadrants (I–IV).
The new acknowledgements about the influence of different RNA quality on the PCR performance were used for the evaluation of the in vivo study. All gene expression analyses in the in vivo study were done by the single-run efficiency-corrected relative expression model. Consequently gene expression changes by different output RNA integrity in the in vivo study were minimized.

Results and Discussion
19
Physiological effect of lactulose in calves
The work on probiotics for cattle has increased in recent years and usually has shown a beneficial effect on the host. Thus we used a MR containing the probiotic bacteria E. faecium to achieve a possible improvement in health. In the last ten years, positive effects, but not always statistically significant, have been found for feed intake, weight gain, decreased scouring, decreased faecal coliform count and reduced demand for antibiotic treatment [38].
Feed intake and zootechnical performance
All calves stayed healthy and no animal losses were registered during the feeding experiment. No medication was applied to the animals during the 19 weeks. The present results in table 3 demonstrate the effects of lactulose on feed intake and growth performance [68]. The average daily MR intake was significantly higher in feeding group L3 (P<0.05). An increased intake of crude protein and energy for group L3 was achieved, due to the feeding of Lactusat (Milei). Male calves showed a similar average daily MR intake between treatment groups, though the female calves of group L1 showed a lower average daily MR intake (P<0.05).
Table 3: Average daily intake of milk replacer (MR) and nutrients. The MR intake show the mean values ± SEM. For the total intake, no SEM and P-values could be calculated because hay was offered to entire feeding groups. Means are different (P<0.05) between treatment groups. *** P<0.001, ** P<0.01; * P<0.05, # 0.05<P<0.1; NS = not significant. Control group (L0), 1% lactulose L1), 3% lactulose (L3).
Experimental group group differences (P-values)
Intake per day L0 L1 L3 Pooled SEM L0 vs. L1 L0 vs. L3 L1 vs. L3
MR intake:
MR [g DM] 2080 2019 2199 45 NS * ** male 1958 1934 2133 73 NS NS NS female 2201 2104 2264 26 * NS ** Energy [MJ ME] 35 34 37 1 NS * ** Crude protein [g] 455 452 514 10 NS *** *** Ether extract [g] 410 398 433 9 NS * **
Total intake: Hay [g DM] 205 207 211 Total food [kg DM] 2.3 2.2 2.4 Energy [MJ ME] 37 36 39 Crude protein [g] 477 475 545 Crude fiber [g] 68 69 70 Ether extract [g] 409 398 437
Results and Discussion
20
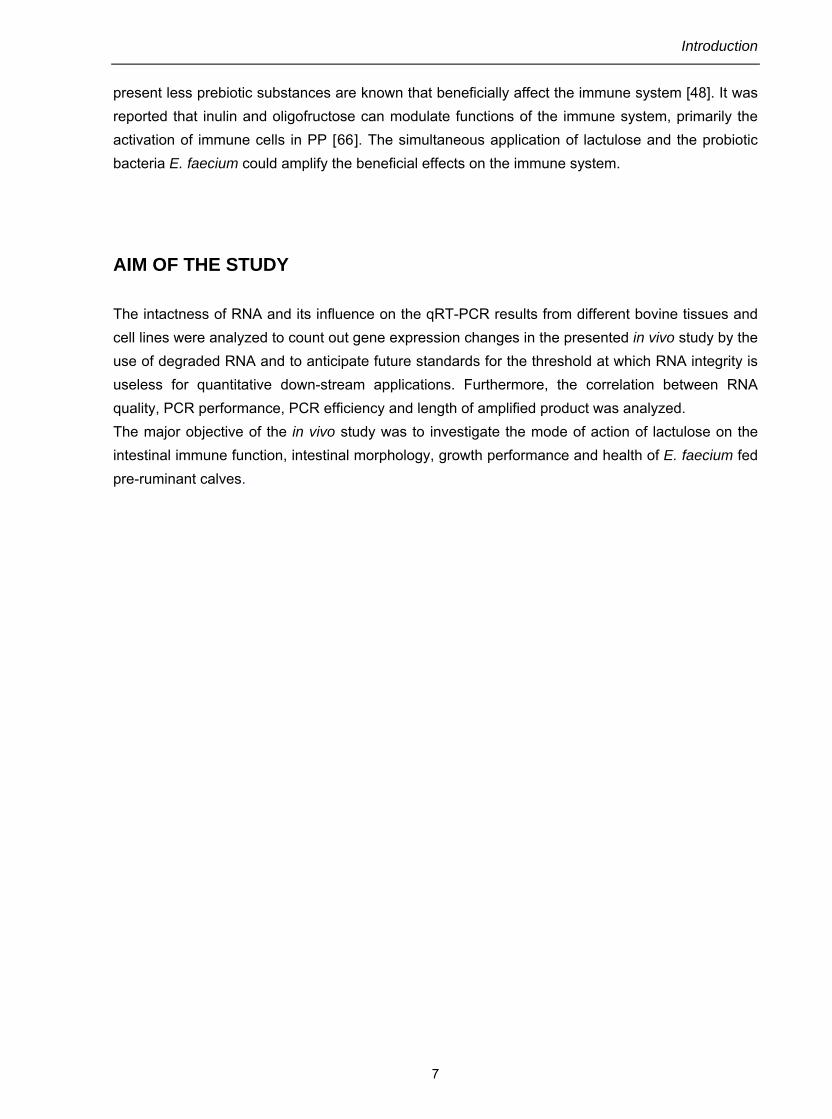
The higher daily MR intake of group L3 increased the average daily crude protein intake by about ~13 % compared to group L0. Higher average daily weight gain (ADG) was achieved by increasing the content of crude protein in MR [77]. The higher daily MR intake might be the result of the sweeter feed formulation by applying 3% lactulose regimen. In total the ADG tended to be higher for L3 than L1 and was numerically higher for L3 than L0 (Tab. 4). Mainly in group L3 a positive trend on growth performance was determined, especially for male calves (P<0.1). A higher body weight was achieved during the 19 week treatment time and it can be asserted to be the effect of lactulose feeding [68]. The trends of the daily weight gain of female and male calves are presented in detail in figure 11.
Table 4: Mortality and adjusted means ± SEM of body weight (BW) and feed efficiency of calves fed with MR containing E. faecium (L0) or added additional with lactulose (L1 and L3). Means are not different (P>0.05) between treatment groups. # P<0.1; NS = not significant. ADG = average daily gain; FE = feed efficiency, expressed as ADG [g/d] / MR intake [g/d].
Variable L0 L1 L3 Pooled SEM L0 vs. L1 L0 vs. L3 L1 vs. L3
Calves [n]
Mortality [n]
14
0
14
0
14
0
0
0
NS
NS
NS
NS
NS
NS
Initial BW [kg] 74 74 74 2 NS NS NS
Final BW [kg] 244 245 255 6 NS NS NS
ADG: week 1-19 [g/d] 1288 1276 1350 59 NS NS #
FE 0.59 0.61 0.59 0.07 NS NS NS
Additionally, male calves generally show a higher and continuous increase in sex-hormone concentration in the pre-pubertal development than female calves. Thereby, the anabolic effect plays a major role in the weight gain and feed utilization. Several reports have shown that supplementing lactulose enhanced growth in pigs or calves [31,32,33]. Other researches about the effect of lactulose in farm animals observed no additional benefits [34]. This is understandable since the initial status of the microbial colonization of the intestine can differ widely between studies. The extent to which the well-being and the performance are improved or maintained also depends on other factors, especially the composition of the diet, the sanitary conditions and the performance level [78].

Results and Discussion
21
Figure 11: Progression of the daily weight gain of male and female calves. The data were fit using the S-shaped function, which presents the trend of the daily weight gain.
Although a higher live weight by the use of the probiotic E. faecium in all groups could be the reason for the non meaningful results in the development of growth performance. Higher life weight gains and lower feed inputs are achieved by the use of probiotics (Tab. 5). The control group could

Results and Discussion
22
achieve higher weight gains than a control group without feeding the probiotic bacteria. Thus, in the presented study there is a little scope for improved zootechnical performance.
Table 5: Influence of probiotics on weight gain and feed conversion ratio in different branches of production (modified according to [45]).
Weight gain as % to the control group
Feed conversion ratio in % to the control group
Piglet breeding Mean of 8 Studies: + 4.8 Range: (- 8.1 to + 24.3)
Mean of 8 studies: - 1.5 Range: (+ 3.1 to - 9.3)
Calve breeding Mean of 7 studies: + 5.4 Range: (- 5.3 to + 21.7)
Mean of 7 studies: - 2.5 Range: (+ 3.6 to - 7.9)
Pig fattening Mean of 9 studies: + 3.7 Range: (- 0.3 to + 6.7)
Mean of 9 studies: - 5.1 Range: (- 1.4 to - 7.1)
Cattle fattening Mean of 5 studies: + 4.8 Range: (- 4.3 to + 7.2)
Mean of 5 studies: - 1.5 Range: (- 7.6 to - 4.7)
It has been suggested that probiotics are strain specific, species and dose specific. Also the synbiotic effects are different between used pre- and probiotic [46]. Consequently, the lactulose might not be the perfect substrate for E. faecium in the gut. An accurate and reliable prediction of the lactulose efficacy is therefore not possible.
Effect on the intestinal morphology
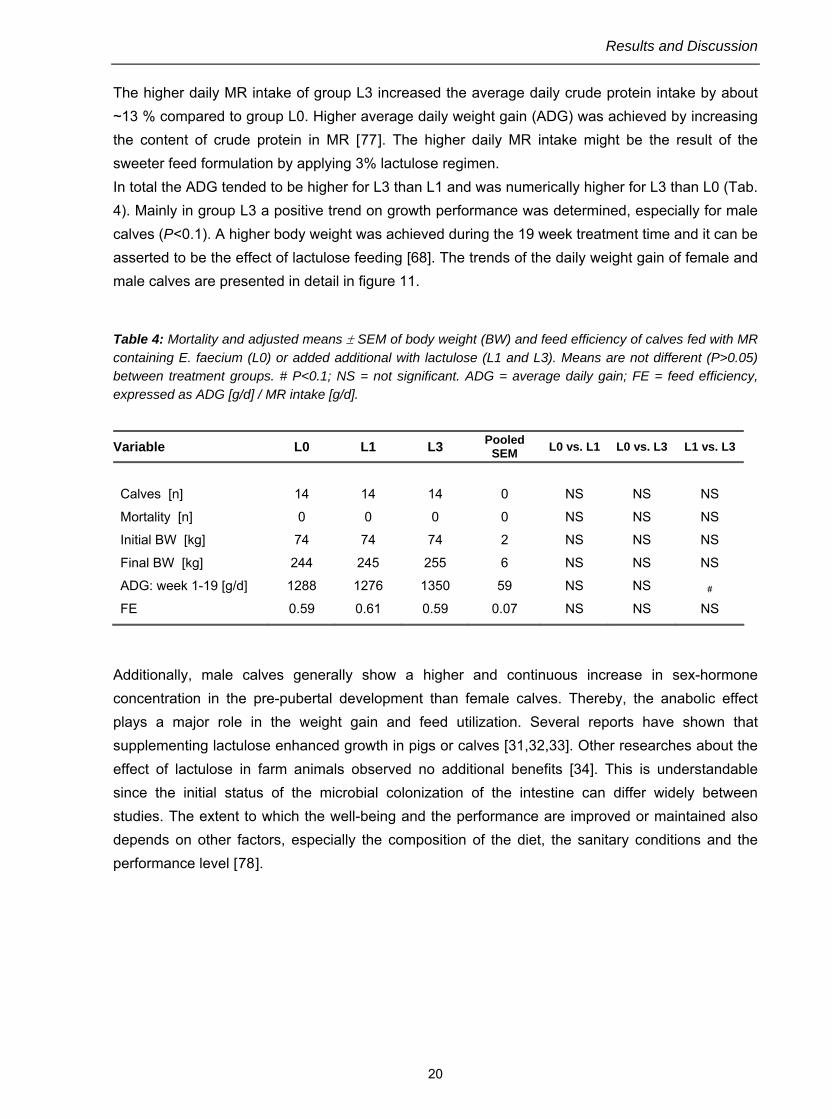
The influence of oral administered lactulose on the morphology of the intestine and on the expression of apoptosis and cell proliferation markers in the GIT was demonstrated in calves [68,79]. Based on histomorphological analyses, lactulose treatment was shown to decrease the villus height in ileum (P<0.001) of both treatment groups (Fig. 12). In contrast, Pelicano et al. (2005) [80] found no differences in the histomorphometrical parameters of the intestinal epithelium with the use of prebiotics in broiler chickens. Factors like species and growth phase of animals, type of dosing used, hygienic conditions of the housing and also the feeding matrix may explain variations in results of different studies. However, the decreased villus height in the ileum yields to a reduced resorption surface. In many cases the reduced surface correlates with an intestinal irritation. The positive effect of the smaller surface is the reduced aggregation of pathogens and toxins. The reason for the morphological differences could be a decreasing cell proliferation or/and an increasing apoptosis caused by the feeding of lactulose. Apoptosis is an important process responsible for maintenance of the cellular balance between proliferation and death and crucial for normal morphology and function in the GIT [81]. This form of cell death can be induced by a wide range of cellular signals, which leads to activation of cell death which is characterized by distinct
Results and Discussion
23
morphological changes [82]. Prebiotics are proven to increase apoptosis in the intestine [83] and especially lactulose reduced the cell proliferation [31]. Although a higher lactulose concentration in the ileum compared to the jejunum [84,85] might be a reason for the effect on villus heights only in the ileum.
Figure 12: Villus height and depth of crypts in the intestine. The villus heights are shown for jejunum and ileum. Crypts depth is shown for caecum and colon. Significant effects of lactulose are marked with an asterisk (*** P<0.001).
The decreasing crypts depth in the caecum due to lactulose-supplementation could also be explained by the already mentioned effect of prebiotics to decrease proliferative activity and to increase apoptotic rates. The production of SCFA, like butyrate along with acetate and propionate, in the lumen of the hindgut by bacterial fermentation of lactulose was assigned in previous studies as reason for this morphological effect [86]. A number of different studies reported about lower colonic cell proliferation by increased synthesis of butyric acid [31,87]. In the large intestine this could possibly lead to a shortening of the crypts as it was presented in our study. However, lactulose yielded high proportions of acetic acid and low proportions of butyric acid [88,89]. For further assertion analysis of the butyric acid concentration in the chyme should be conducted in calves. Changes in the intestinal mRNA gene expression of apoptotic markers were analyzed to confirm the histomorphometrical investigations. Our data demonstrate significant TGF-ß1 (P<0.05) and Caspase 3 (P<0.05) mRNA increases in the caecum of the 3% lactulose treated calves, while diverse cell proliferation markers were not affected by the treatment. TGF-ß1 is a multifunctional cytokine that regulates many diverse cellular processes including proliferation, apoptosis, differentiation [90] and immune regulation. It is the main cytokine in intestinal epithelial cells, which regulates epithelial differentiation and anticipate the damage of epithelia [91]. Caspase are the final

Results and Discussion
24
executioners of apoptosis, activated during a signaling cascade in almost all cell types [92]. Because apoptosis is important for the cellular balance in the intestinal morphology, an enhanced apoptotic rate seems to be associated with a decrease in crypt depth due to lactulose supplementation. Other morphological differences in the caecum could not be observed. Tumor
necrosis factor alpha (TNF-α), a possible mediator for the induction of caspase activity and epithelial cell apoptosis in the GIT was also not found to be regulated at the mRNA level in this tissue. These cytokines, which are released in large quantities upon activation of intra-epithelial lymphocytes, have been shown to play a dynamic role in the homeostasis of the villus epithelial barrier [30,40,14]. Further on, the dominant anti-apoptotic marker Bcl-xl was down regulated in the jejunum by the oral application of 3% lactulose. It is known as the survival protein because of its cell death repressor activity and its interaction with the epidermal growth factor receptor (EGFR). A decreased anti-apoptotic rate seems to be associated with the tendency increase in villus heights in the jejunum [79]. In the GALT the PP are the main component and especially present in the ileum [93]. They are counted among the primary lymphoid organ and play a major role in the development of B cells [93]. In both treatment groups a smaller size of the lymph follicles was observed with sex-specific differences (L1: P<0.05; L3: P<0.01) suggesting lower immunological activity throughout the lactulose rich feeding. The lymph follicles of male calves were only significantly affected in group L1. In contrast, only the female calves from group L3 with the highest lactulose feeding showed a significant dependence. In the assessment the lymph follicle decreased significantly in the supplemented group (P<0.01), which is explained with the stabilization of the intestinal environment, by the reduction of pathogen bacteria which leads to a reduced activation of the immune system. Therefore the necessity of the host’s immune system to react against harmful bacteria is decreased and this could lead to a reduced surface of lymphatic follicle in the intestine.
Hematology
Changes in the number of thrombocytes and lymphocytes due to lactulose treatment could be determined. A significant higher number of lymphocytes in the L3 group (P=0.02) versus the control group and a lower number of thrombocytes in the treatment group L1 was detected (Fig. 13). Other hematology values were in a normal physiological range, according to Monke et al. [94]. Finally, SCFA production, particularly butyrate, in the colon may reduce the requirement of epithelial cells for glutamine, thereby sparing it for other cells, such as those of the immune system [95]. This hypothesis is supported by the observation that lactulose administration can increase serum glutamine levels [96], and glutamine is an essential energy source for lymphocytes [97]. Also a high protein intake could increase the number of lymphocytes, whereas it is unsettled if the effect is relative or absolute [98].

Results and Discussion
25
*
*
Figure 13: Influence of lactulose feeding on lymphocytes and thrombocytes in probiotic feed calves.
Immunological response in the intestine
Stimulation of the GALT via probiotics and prebiotics might influence immune modulation because of their ability to enhance production of IL-10 and TGF-β1, both anti-inflammatory cytokines, which might have an essential role in subduing allergen-induced responses. Overall, the 3% lactulose feeding significantly stimulated IL-10 production in the jejunum and colon (Fig. 14).
A
IL-10
jejunum ileum caecum colon
rel.
expr
essi
on
0.25
0.50
0.75
1.50
2.50
5.00
1.00
control (L0)1% lactulose (L1)3% lactulose (L3)
*
*

Results and Discussion
26
B
T G F -ß 1
je ju n u m ile u m ca e cu m co lo n
rel.
expr
essi
on
0 .2 5
0 .5 0
0 .7 5
1 .5 0
2 .5 0
5 .0 0
1 .0 0
co n tro l (L 0 )1 % la c tu lo se (L 1 )3 % la c tu lo se (L 3 )
*
Figure 14: IL-10 (A) and TGF-ß1 (B) mRNA expression changes due to lactulose. Data are presented as relative expression in means ± SEM (n=14). Up-regulated genes are shown as values higher than 1 and down-regulated genes as values lower than 1. Significant effects of lactulose are marked with an asterisk (* P<0.05) and trends of regulation are shown with plus (# 0.05<P<0.1). The control groups have a constant level of 1 ± SEM.
IL-10 is primarily produced by T helper 2 (Th2) and T regulatory lymphocytes and dendritic cells. It binds to a specific receptor on intestinal epithelial cells and regulates the contribution of epithelial cells to the inflammatory and immune response in the digestive tract [99]. Recent studies with mice also reported that consuming diverse prebiotics (fructo-OS or inulin enriched with oligofructose) enhanced IL-10 production [46,47]. Furthermore, the high dose lactulose treatment significantly stimulated TGF-ß1 production in the caecum. TGF-ß1 plays a decisive role in the development of the mucosa, due to the effect on B cells, which dispose a class switching to IgA.
Immune modulation in different compartments
By the analysis of gene expression differences between the feeding groups (male and female were analyzed together in one feeding group), the gene expression of all studied anti- and pro-inflammatory cytokines and diverse CD markers were not significant affected by lactulose feeding. On closer examination, varieties between the genders in the gene expression could be determined. The supplementation of 1% lactulose induced more significantly immunomodulation in female calves, whereas the supplementation of 3% lactulose affects the male calves in different immune compartments (Tab. 6).

Results and Discussion
27
Table 6: Effect of lactulose on the mRNA expression of diverse cytokines, CD markers and IgA FcR in various calf tissues, compared to the untreated control group (L0). Significant down-regulations are marked with an arrow downwards (↓; P<0.05), (↓↓; P<0.01) and (↓↓↓; P<0.001). Up-regulations are marked with an arrow upwards (↑; P<0.05), (↑↑; P<0.01) and (↑↑↑; P<0.001) and trends of regulation are shown with #; 0.05<P<0.1. For no differences a blank was used.
tissue Treatment & sex
IL-10 TGF-ß1
IFN-γ TNF-α IL-1ß IL-8 IgA FcR
CD4+ CD8+ CD25 CD69
male ↑ L1
female ↓ male ↓ (#) ↓ ↑ (#)
PP ileum
L3 female male ↑ (#)
L1 female ↓↓ male ↓
mLN L3
female male
L1 female male ↓
spleen L3
female male
L1 female ↑ (#) ↑ ↑ (#) male ↓ (#)
WBC L3
female The results demonstrate that the ileum and mLN are the primary tissues that specifically affected by
lactulose feeding. Only the male calves of group L3 showed a down-regulation of IFN-γ about 67%. IFN-γ released by helper T1 (Th1) cells activate macrophages, induce B cells to switch immunoglobulin type [100] and it is important in regulating the humoral immunity (Th2 response).
The reduced IFN-γ production of male calves by 3% lactulose treatment let assume that lactulose
enhances the humoral immune response due to the fact that IFN-γ inhibited this response. Probiotic bacteria have been shown to enhance the humoral immune response and thereby promote the intestine immunologic barrier [61]. The synbiotic application of lactulose and E. faecium could amplify this effect. Substitutional for the Th2 response we used the IL-10 that is known to be
immunosuppressive, capable of inhibiting the antigen presentation and the production of TNF-α and IL-1ß in activated monocytes/macrophages [101]. Male calves of group L3 showed a trend of down-regulation of 65% for IL-10 in the ileum. Other studies, using Inulin as prebiotic in combination Lactobacillus rhamnosus and Bifidobacterium lactis found an up-regulation of IL-10 [46]. It is still unclear whether probiotic bacteria and prebiotics modulate the activity of Th1/Th2 cells. The combined application of probiotics and prebiotics has different effects from those of the individual supplements, but does not simply result in additive or synergistic effects [46]. Different
studies with mice or rats reported that consuming fructo-OS enhanced IFN-γ and IL-10 production by PP cells [46,47]. An synbiotic treatment abrogated the strong effects of prebiotics on PP cytokine

Results and Discussion
28
production [46,47]. Prebiotics and/or its metabolites may interfere specifically with the regulatory
processes of cytokine production. The synbiotic treatment did not affect spleen or mLN, which constitutively express lower levels of multiple cytokine transcripts than PP in the ileum [102]. The
low correlation between the level of production of IL-10 and IFN-γ (r=0.38) suggest that the lactulose treatment did not simultaneously activate different T-lymphocyte subpopulations and/or dendritic cells. A study with rats found that a probiotic feeding modestly affected immune functions, whereas systemic immunomodulatory effects were observed in rats fed synbiotics [46]. Subpopulations of T cells include the helper T cells, which are identified by the presence of the membrane glycoprotein CD4+, and cytotoxic/suppressor T cells that express the CD8+ glycoprotein [103]. CD4+ cells secrete a number of cytokines that are important in the activation of B cells and other T cells, as well as cells of the innate immune system, whereas CD8+ cells play a role in immunological tolerance, such as the tolerance to foreign antigens encountered in the gut [104]. Overall, the treatments did not affect the subpopulations of lymphocytes in male calves, whereas the CD4+ T-lymphocytes of the 1% lactulose treated female calves decreased about 51% in the PP and about 60% in the mLN. In the same treatment group a 2.1-fold increase of the CD8+ T-lymphocyte expression could be observed in WBC. Other studies conducted with acknowledged prebiotic fibers have shown an alteration in the proportion of T cells (CD4+ and CD8+) and increased lymphocyte and leukocyte numbers in the GALT of canine [105] and in the peripheral blood of calves [106]. Our results are conforming to these studies though lactulose increased the number of lymphocytes in blood (Fig. 13). A limited number of studies assessing the effect of lactulose or synbiotica on immune function have been published. Furthermore, results of several studies have been inconsistent and thus they were not directly comparable. Our results suggest that lactulose have only minor effects on the composition of T cell subsets in different immune compartments in calves. The activation, differentiation, trafficking, and migration of T cells through sites of inflammation or
infection are essential for an effective immune response. The α chain of the IL-2 receptor, CD25, is expressed on activated T cells, B cells and monocytes. Formation of the high-affinity IL-2 receptor allows T cell proliferation and differentiation to be driven by IL-2. The supplementation of 3% lactulose reduced the expression of CD25 mRNA in mLN (57%) and CD69 in spleen (65%) of male calves indicating that lactulose is able to modulate the activation status of in vivo differentiated T cells. Low expression of CD69, a marker of leukocyte activation, on CD8+ cells could be attributed with a specific activation of CD3/CD8+ T cells [107]. Only natural killer cells, which were activated by different nonpathogenic bacterial strains, are able to up-regulate activation markers [107]. Immunologic responses to pathogens are mediated by the IgA FcR. The IgA FcR is a trans-membrane glycoprotein present on the surface of myeloid lineage cells such as neutrophils, monocytes, macrophages and eosinophils [108]. Ligation of FcR by Ig-coated targets can trigger numerous cellular effector functions including phagocytosis, antibody-dependent cell-mediated cytotoxicity, respiratory burst, synthesis and release of cytokines and other inflammatory mediators [109]. In our study the treatment with lactulose increased the expression of the IgA FcR in male calves [69]. The availability of lactulose in the ileum may support growth of the supplemented probiotics and consequently stimulated IgA FcR synthesis. Additionally, studies have documented
Results and Discussion
29
that feeding lactulose is associated with increases in IgA secretion or IgA cells in GALT [110]. Thus, FcR provide a crucial link between the humoral and cellular arms of the immune system [111]. Upon activation, B cells undergo class-switching to produce IgA antibodies, a process that is
facilitated by both activated CD4+ and CD8+ cells [112]. Furthermore, IFN-γ stimulates expression
of the secretory component for IgA by epithelial cells [46]. Also, the high-affinity FcγRI is not
constitutively expressed, a high level on neutrophils and cytokines such as INF-γ need to be administered to up-regulate receptor expression. However, no correlation between changes in IFN-
γ production and IgA FcR expression in the ileum by lactulose treatment was found. It is a matter of common knowledge that prebiotics as well as probiotics increased the secretoric IgA in the GALT. In which way lactulose (or prebiotics in general) influenced the IgA FcR in still unclear.The results obtained are sometimes variable, but bearing in mind the different ways and conditions under which pre- and probiotics may be operating, it is not surprising that they are sometimes not active. Different strains of the same species may have different metabolic activities which affect the result when they are used as probiotics. Other factors which may also explain variation in results include the growth phase of the animal, the type of dosing used and the hygienic condition of the housing [36].

Conclusion
30
CONCLUSION
Our data suggest that RNA quality control prior to qRT-PCR assays is indispensable. Tissue sampling, RNA extraction and storage are very sensitive to RNA integrity and should be designed to keep RNA pure and intact. Total RNA samples of high quality (RIN>8) can serve as an optimal template whereas for partly degraded RNA (8>RIN>5) result in sub-optimal qRT-PCR expression results. Degraded RNA interferes with PCR performance as such, expressed as Ct value, whereas PCR efficiency is minor effected by RNA integrity. PCR efficiency seems to be major affected by the tissue type and extraction procedure. The delta-delta Ct and the efficiency corrected model are sensitive to RNA integrity. Statements about importance of normalization could be confirmed by our investigations, consequently we recommend an efficiency-corrected relative quantification strategy and normalization with an internally reference gene for every quantitative mRNA expression analysis. In view of the observed difference in gene expression stability between intact and degraded RNA sample, we and other authors propose performing RNA quality control prior to downstream quantification assays. We can recommend a RIN value higher than five and a PCR product length up to 200 bp as a minimal requirement for a successful and reliable real-time RT-PCR quantification. A relatively small number of research trials were reported concerning supplementation of lactulose and other oligosaccharides in the diets of companion animals and livestock. Feeding MR containing E. faecium with 3% lactulose tends to result in increased feed intake and body weight gain. A 1% lactulose feeding shows no effect on growth performance. The effects of lactulose are obviously gender-specific: male calves tended to have an increasing body weight gain and female calves tended to have more changes in intestinal morphology in response to lactulose. This study indicates that lactulose feeding in combination with E. faecium affects the morphology of the small and large intestine in pre-ruminant calves. The reduced surface in intestine could lead to a decreasing aggregation of pathogens in the intestine. This assumption was confirmed by the reduced GALT activation via the PP in the ileum. Our data suggest that the use of lactulose could be meaningful when calves have intestinal irritation. By comparing expenses and gain of performance the economic profit in raising calves might be questionable. However, more research remains to be done to determine the appropriate role of lactulose in the nutrition of calves and to test the interaction between lactulose and probiotics such as E. faecium.

Reference list
REFERENCE LIST
1 Imbeaud S, Graudens E, Boulanger V, Barlet X, Zaborski P, Eveno E, Mueller O, Schroeder A, Auffray C
(2005): Toward standardization of RNA quality assessment using user-independent classifiers of microcapillary Electrophoresis traces. Nucleic Acids Research 33(6): e56.
2 Bustin SA, Nolan T (2004): Template Handling, Preparation, and Quantification. In: The real-time PCR Encyclopaedia A-Z of quantitative PCR. Published by International University Line (Editor: Stephen A Bustin), La Jolla, CA, 87-120.
3 Pfaffl MW (2005): Nucleic acids: mRNA identification and quantification. Encyclopedia of Analytical Science, 2nd Edition. 417-426.
4 Pfaffl MW (2004): Quantification Strategies in real-time PCR. In: The real-time PCR Encyclopaedia A-Z of quantitative PCR. Published by International University Line (Editor: Stephen A Bustin), La Jolla, CA, 87-120.
5 Fleige S and Pfaffl MW (2006): RNA integrity and the effect on the real-time qRT-PCR performance, Molecular Aspects of Medicine 27: 126-139.
6 Mueller O, Hahnenberger K, Dittmann M, Yee H, Dubrow R, Nagle R, Ilsley D (2000): A microfluidic system for high-speed reproducible DNA sizing and quantitation. Electrophoresis 21: 128–134.
7 Loerch SC and Fluharty FL (1999): Physiological changes and digestive capabilities of newly received feedlot cattle. Journal of Animal Science 77: 1113–1119.
8 Nabuurs MJ, van Essen GJ, Nabuurs P, Niewold TA and van der Meulen J (2001): Thirty minutes transport causes small intestinal acidosis in pigs. Research in Veterinary Science 70: 123–127.
9 Soderholm JD and Perdue MH (2001): Stress and the gastrointestinal tract II. Stress and intestinal barrier function. American Journal of Physiology. Gastrointestinal and Liver Physiology 280: G7–G13.
10 Sheridan JF, Dobbs C, Brown D, Zwilling B (1994): Psychoneuroimmunology: Stress effects on pathogenesis and immunity during infection. Clinical Microbiology Reviews 7: 200–212.
11 Bauer E, Williams BA, Smidt H, Verstegen MWA, Mosenthin R (2006): Influence of the Gastrointestinal Microbiota on Development of the Immue System in Young Animals. Curr. Issues Intestinal Microbiology 7: 35-52.
12 Hutjens MF (1992): Feed additives. The Veterinary clinic of North America. Food animal practice 7(2): 525-40.
13 Gibson GR and Roberfroid MB (1995): Dietary modulation of the human colonic microbiota: Indroducing the concept of prebiotics. Journal of Nutrition 125: 1401-1412.
14 Hidaka H, Eida T, Takizawa Teta I (1986): Effects of fructooligosaccharides on intestinal flora and human health. Bifidobacteria Microflora 5: 37–50.
15 Gibson GR, Beatty ER, Wang X, Cummings JH (1995): Selective stimulation of bifidobacteria in the human colon by oligofructose and inulin. Gastroenterology 108: 975–82.
16 Ito M, Kimura M, Deguchi Y, Miyamori-Watabe A, Yajima T, Kan T (1993): Effect of trans-galactosylated disaccharides on the human intestinal microflora and their metabolism. Journal of Nutrition Science and Vitaminology (Tokyo) 39: 279–88.
17 Saito Y, Tanaka T, Rowland IR (1992): Effects of soybean oligosaccharides on the human gut microflora in in vitro culture. Microbial ecology in health and disease 5:105–10.
18 Gibson GR, McCartney AL, Rastall RA (2005): Prebiotics and resistance to gastrointestinal infections. British Journal of Nutrition 93(1): 31–34.
19 Tuohy KM, Rouzaud GC, Bruck WM, Gibson GR (2005): Modulation of the human gut microflora towards improved health using prebiotics – assessment of efficacy. 11: 75-90. Current Pharmaceutical Design
20 Hillman K (2001): Bacteriological aspects of the use of antibiotics and their alternatives in the feed of non-ruminant animals. In: Recent Advances in Animal Nutrition (eds. Garnsworthy PC and Wiseman J). Nottingham University Press, Nottingham: 107-134.
21 Bezkorovainy A (2001): Probiotics: determinants of survival and growth in the gut. American Journal of clinical Nutrition 73: 399-405.
22 Gibson GR and Rastall RA (2004): When we eat, which bacteria should we be feeding? ASM News 70: 224-231.
31
Reference list
23 Kolida S, Tuohy K, Gibson GR (2002): Prebiotic effects of inulin and oligofructose. British Journal of Nutrition
87(2): 193-197.
24 Tuohy KM, Rouzaud GC, Bruck WM, Gibson GR (2005): Modulation of the human gut microflora towards improved health using prebiotics – assessment of efficacy. Current pharmaceutical design 11: 75-90.
25 Macfarlane S, Macfarlane GT, Cummings JH (2006): Review article: prebiotics in the gastrointestinal tract. Alimentary Pharmacology and Therapeutics 24(5): 701-714.
26 Schumann C (2002): Medical, nutritional and technological properties of lactulose. An update. European Journal of Nutrition 41(1): 117-125.
27 Johnson S (2001): Clostridia constipation’s broad pathology. Medical Hypotheses 56(4): 532-536.
28 Kleesen B, Hartmann C, Blaut M (2001): Oligofructose and long-chain inulin: influence on the gut microbial ecology of rats associated with human faecal flora. British Journal of Nutrition 80: 1-11.
29 Bianchi G, Ronchi M, Marchedini G (1997): Effects of lactulose on carbohydrate metabolism and diabetes mellitus. Scandinavian Journal of Gastroenterology 32 (222): 62-64.
30 Ballongue J, Schumann C, Quignon P (1997): Effects of lactulose and lactitol on colonic microflora and enzymatic activity. Scandinavian Journal of Gastroenterology 32 (222): 41-44.
31 Kien CL, Murray RD, Qualman SJ, Marcon M (1999): Lactulose feeding in piglets: a model for persistent diarrhea and colitis induced by severe sugar malabsorption. Digestive Disease and Science 44(7): 1476-1484.
32 Krueger M, Schroedl W, Isik K, Lange W, Hagemann L (2002): Effects of lactulose on the intestinal microflora of periparturient sows and their piglets. European Journal of Nutrition 41(1): 26–31.
33 Schroedl W, Jaekel L, Krueger M (2003): C-Reactive Protein and Antibacterial Activity in Blood Plasma of Colostrom-Fed Calves and the Effect of Lactulose. Journal of Dairy Science 86: 3313-3320.
34 Olsen LE and Maribo H (1999): Company products and feed for piglets. In: Danish Slaughterhouse Report 443, (ed. Igalac FUT and Bakashi F). Denmark: National Committee for Pig Breeding, Health and Production.
35 Farnworth ER, Modler HW, Jones JD, Cave N, Yamazaki H, Rao AV (1992): Feeding Jerusalem artichoke flour rich in fructooligosaccharides to weanling pigs. Canadian Journal of Animal Science 72: 977-980.
36 Fuller R and Perdigón G (2003) The Health Benefits of Probiotics and Prebiotics. In: Fuller R and Perdigón G (ed.) Gut Flora, Nutrition, Immunity and Health. Oxford: Blackwell Publishing 52-59.
37 Fuller R (1989): Probiotics in man and animals – A review. The Journal of applied bacteriology 66: 365-378.
38 Fuller R (1992): History and development of probiotics. In: Fuller R (ed.) Probiotics, the scientific basis. London: Chapman & Hall 1–8.
39 Erickson KL and Hubbard NE (2000): Probiotic immunomodulation in health and disease. Journal of Nutrition 130: 403-409.
40 Rolfe RD (2000): The role of probiotic cultures in the control of gastrointestinal health. The Journal of Nutrition 130: 396-402.
41 Willard MD, Simpson RB, Cohen ND, Clancy JS (2000): Effects of dietary fructooligo-saccharide on selected bacterial populations in feces of dogs. American journal of veterinary research 61: 820-825.
42 Benyacoub J, Perez PF, Rochat F, Saudan KY, Reuteler G, Antille N, Humen M, De Antoni GL, Cavadini C, Blum S, Schiffrin EJ (2005): Enterococcus faecium SF68 enhances the immune response to Giardia intestinalis in mice. The Journal of Nutrition 135: 1171-1176.
43 Benyacoub J, Czarnecki-Maulden GL, Cavadini C, Sauthier T, Anderson RE, Schiffrin EJ, von der WT (2003): Supplementation of food with Enterococcus faecium (SF68) stimulates immune functions in young dogs. The Journal of Nutrition 133: 1158-1162.
44 Ozawa A, Ohnishi N, Tazume S, Aiba Y, Watanabe K (1986): Intestinal bacterial flora and host defense mechanisms. The Tokai journal of experimental and clinical medicine 11: 65-79.
45 Arbeitsgemeinschaft für Wirkstoffe in der Tierernährung e. V. (AWT) (1999): Probiotika in der Tierernährung. Buchedition Agrimedia GmbH, Bergen.
46 Roller M, Rechkemmer G, Watzl B (2004): Prebiotic inulin enriched with oligofructose in combination with the probiotics Lactobacillus rhamnosus and Bifidobacterium lactis modulates intestinal immune functions in rats. The Journal of Nutrition 134: 153-156.
32

Reference list
47 Hosono A, Ozawa A, Kato R, Ohnishi Y, Nakanishi Y, Kimura T, Nakamura R (2003): Dietary
fructooligosaccharides induce immunoregulation of intestinal IgA secretion by murine Peyer´s patch cells. Bioscience Biotechnology and Biochemistry 67: 758-764.
48 Schley PD and Field CJ (2002): The immune-enhancing effects of dietary fibres and prebiotics. British Journal of Nutrition 87(2): 221-230.
49 Garside, P and Mowat AM (2001): Oral tolerance. Seminars in Immunology 13: 171-185.
50 Weiner HL (2001): Induction and mechanism of action of transforming growth factor-β-secreting Th3 regulatory cells. Immunological Reviews 182: 207-214.
51 Brandtzaeg P (1995): Molecular and cellular aspects of the secretory immunoglobulin system. Acta pathologica, microbiologica, et immunologica Scandinavica 103(1): 1-19.
52 Gebert A, Rothkotter HJ, Pabst R (1996): M cells in Peyer's patches of the intestine. International review of cytology 167: 91-159.
53 Kraehenbuhl JP and Neutra MR (1992): Molecular and cellular basis of immune protection at mucosal surfaces. Physiological Reviews 72: 853-879.
54 Brandtzaeg P, Farstad IN, Johansen FE, Morton HC, Norderhaug IN,Yamanaka T (1999): The B-cell system of human mucosae and exocrine glands. Immunological Reviews 171: 45-87.
55 Strober W, Kelsall B, Marth T (1998): Oral tolerance. Journal of Clinical Immunology 18: 1-30.
56 Mc Guirk P and Mills KH (2002): Pathogen-specific regulatory T cells provoke a shift in the Th1/Th2 paradigm in immunity to infectious diseases. Trends in Immunology 23: 450-455.
57 Mowat, AM, Parker, LA, Beacock-Sharp H, Millington OR, Chirdo F (2004): Oral Tolerance: Overview and Historical Perspectives. Annals of the New York Academy of Sciences 1029: 1-8.
58 Nagler-Anderson C (2001): Man the barrier! Strategic defences in the intestinal mucosa. Nature Reviews. Immunology 1: 59-67.
59 Brandtzaeg P (2003): Role of secretory antibodies in the defence against infections. International journal of medical microbiology 293: 3-15.
60 Simon O, Vahjen W, Scharek L (2003): Microorganisms as feed additives – probiotics. In: Proceedings of the 9th International Symposium on Digestive Physiology in Pigs (ed. Ball RO), Canada, Banff: University of Alberta, Department of Agricultural, Food and Nutritional Science: Vol. 1, 295–318.
61 Isolauri, E, Sütas Y, Kankaanpäa P, Arvilommi H, Salminen S (2001): Probiotics: effects on immunity. American Journal of Clinical Nutrition 73: 444-450.
62 Forchielli ML and Walker WA (2005): The role of gut associated lymphoid tissues and mucosal defence. British Journal of Nutrition 93: 41-48.
63 Stewart RJ, Kashour TS, Marsden PA (1996): Vascular endothelial platelet endothelial adhesion molecule-1 (PECAM-1) expression is decreased by TNF-alpha and IFN-gamma. Evidence for cytokine-induced destabilization of messenger ribonucleic acid transcripts in bovine endothelial cells. Journal of Immunology 156: 1221-1228.
64 Otte JM and Podolsky DK (2004): Functional modulation of enterocytes by gram-positive and gram-negative microorganisms. American Journal of Physiology. Gastrointestinal and Liver Physiology 286: 613-626.
65 Bai AP, Ouyang Q, Zhang W, Wang CH, Li SF (2004): Probiotics inhibit TNF-alpha-induced interleukin-8 secretion of HT29 cells. World of Journal Gastroenterology 10: 455-457.
66 Watzl B, Girrbach S, Roller M (2005): Inulin, oligofructose and immunomodulation. British Journal of Nutrition 93(1): 49-55.
67 Livak KJ, Schmittgen TD (2001) Analysis of relative gene expression data using real-time quantitative PCR and the 2(-Delta Delta C(t)) Method. Methods 25: 402-408.
68 Fleige S, Preißinger W, Meyer HHD, Pfaffl MW (2007): Effect of lactulose on growth performance and intestinal morphology of pre-ruminant calves using a milk replacer containing Enterococcus faecium. Animals 1: 367-373.
69 Fleige S, Preißinger W., Meyer HHD, Pfaffl MW (2007): The immune – modulating effect of lactulose in combination with Enterococcus faecium in pre-ruminant calves. Journal of nutrition. Submitted.
th70 Lewis M, Bain BJ, Bates I (2006): Dacie and Lewis Practical Haematology. 10 Edition. Churchill Livingstone, London, UK.
33
Reference list
71 Blättler U, Hammon JM, Morel C, Philipona C, Rauprich A, Romé V, Le Huërou-Luron I, Guilloteau P, Blum
JW (2001): Feeding Colostrum, Its Composition and Feeding Duration Variably Modify Proliferation and Morphology of the Intestine and Digestive Enzyme Activities of Neonatal Calves. Journal of Nutrition 131: 1256-1263.
72 Fleige S, Walf V, Huch S, Prgomet C, Sehm J, Pfaffl MW (2006): Comparison of relative mRNA quantification models and the impact of RNA integrity in quantitative real-time RT-PCR. Biotechnology letters 28(19): 1601-13.
73 Pfaffl MW (2001): A new mathematical model for relative quantification in real-time RT-PCR. Nucleic Acids Res 29(9): 45.earch
74 Auer H, Lyianarachchi S, Newsom D, Klisovic MI, Marcucci G, Kornacker K, Marcucci U (2003): Chipping away at the chip bias: RNA degradation in microarray analysis. Nature Genetics 35: 292-293.
75 Wittwer Ct, Herrmann MG, Moss AA, Rasmussen RP (1997): Continuous fluorescence monitoring of rapid cycle DNA amplification. Biotechniques 22: 130-131.
76 Bustin SA, Benes V, Nolan T, Pfaffl MW (2005): Quantitative real-time RT-PCR – a perspective. Journal of Molecular Endocrinology. 34: 597-601.
77 Quigley JD, Wolfe TA, Elsasser TH (2006): Effects of additional milk replacer feeding on calf health, growth, and selected blood metabolites in calves. Journal of Dairy Science 89: 207-216.
78 North Carolina Cooperative Extension (2005): Searching for Alternatives to Antibiotic Growth Promoters. North Carolina State University and A&T State University, USA.
79 Fleige S, Preißinger W, Meyer HHD, Pfaffl MW (2007): Lactulose: Health benefits in the gastrointestinal tract of pre-ruminant calves. Veterinary Medicine - Czech (submitted).
80 Pelicano ERL, Souza PA, Souza HBA, Figueiredo DF, Boiago MM, Carvalho SR, Bordan VF (2005): Intestinal Mucosa Development in Broiler Chickens Fed Natural Growth Promoters. Brazilian Journal of Poultry Science 7(4): 221-229.
81 Hall PA, Coates PJ, Ansari B, Hopwood D (1994): Regulation of cell number in the mammalian gastrointestinal tract: the importance of apoptosis. Journal of cell science 107: 3569-3577.
82 Aschoff AP, Ott U, Fünfstück R, Stein G, Jirikowski GF (2004): Colocalization of BAX and BCL-2 in small intestine and kidney biopsies with different degrees of DNA fragmentation. 296(2)Cell and Tissue Research : 351-357.
83 Hughes R and Rowland IR (2001): Stimulation of apoptosis by two prebiotic chicory fructans in the rat colon. Carcinogenesis 22(1): 43-47.
84 Kamphues J, Tabeling R, Stuke O (2003): [Possible interesting dietetic effects of lactulose as a feed additive in pig feed]. 110(9): 365-8. Deutsche Tierärztliche Wochenschrift
85 Branner GR, Böhmer BM, Erhardt W, Henke J, Roth-Maier DA (2004): Investigation on the precaecal and faecal digestibility of lactulose and inulin and their influence on nutrient digestibility and microbial characteristics. Archives of Animal Nutrition 58(5): 353-66.
86 Mandal M, Olson DJ, Sharma T, Vadlamudi RK, Kumar R (2001) Butyric acid induces apoptosis by up-regulating Bax expression via stimulation of the c-Jun N-terminal kinase/activation protein-1 pathway in human colon cancer cells. Gastroenterology 120: 71-78.
87 Klien CL, Schmitz-Brown M, Solley T, Sun D, Frankel WL (2006): Increased Colonic Luminal Synthesis of Butyric Acid Is Associated with Lowered Colonic Cell Proliferation in Piglets. American Society for Nutrition. The Journal of Nutrition 136: 64-69.
88 Fernandes J, Venketeshwer RA, Wolever TMS (2000): Different Substrates and Methane Producing Status Affect Short-Chain Fatty Acid Profiles Produced by In Vitro Fermentation of Human Feces. Human Nutrition and Metabolism: 1932-1936.
89 Nilsson U, Nyman M (2005): Short-chain fatty acid formation in the hindgut of rats fed oligosaccharides varying in monomeric composition, degree of polymerisation and solubility. British Journal of Nutrition 94(5): 705-713.
90 Tanigawa T, Pai R, Arakawa T, Higuchi K, Tarnawski AS (2005): TGF-ß signaling pathway: its role in gastrointestinal pathophysiology and modulation of ulcer healing. Journal of physiology and pharmacology 56: 1-3.
91 Bland PW (1999): Role of epithelial cells in mucosal immunology. In: M. Zierhut u. JVJ.V Forester (Hrsg.): Mucosal immunology and ocular disease. Aeolus Press, Lisse 37-52.
34

Reference list
92 Kidd VJ (1998): Proteolytic activities that mediate apoptosis. Annual Review of Physiology 60: 533-573.
93 Norrman J, David CW, Sauter SN, Hammon HM, Blum JW (2003): Effects of dexamethasone on lymphoid tissue in the gut and thymus of neonatal calves fed with colostrum or milk replacer. Journal of Animal Science 81: 2322-2332.
94 Monke DR, Kociba GJ, DeJarnette M, Anderson DE, Ayars WH (jr.) (1998): Reference values for selected hematologic and biochemical variables in Holstein bulls of various ages. American Journal of Veterinary Research 59: 1386-1391.
95 Jenkins DJ, Kendall CW, Vuksan V (1999): Inulin, oligofructose and intestinal functions. Journal of Nutrition 129: 1431-1433.
96 Jenkins DJA, Kendall CWC, Ransom TPP, Popovich DG, Tariq N, Wolever TMS, Rao AV, Thompson LU, Cunnane SC (1997): Dietary fiber and cholesterol lowering: future directions. In: Dietary Fiber in Health and Disease (eds. Kritchevsky D and Bonfield C). New York: Plenum Publishing.
97 Wu G, Field CJ, Marliss EB (1991): Glutamine and glucose metabolism in rat splenocytes and mesenteric lymph node lymphocytes. American Journal of Physiology 260: E141-E147.
98 Eder H (1987): Blut und Lymphe. In: Lehrbuch der Veterinär Physiologie (ed. Scheunert A, Trautmann A) Auflage 7. Verlag Paul Parey, Berlin: 160-192.
99 Denning TL, Campbell NA, Song F, Garofalo RP, Klimpel GR, Reyes VE, Ernst PB (2000): Expression of IL-10 receptors on epithelial cells from the murine small and large intestine. International Immunology 12(2): 133-9.
100 Le Page C, Genin P, Baines MG, Hiscott J (2000): Interferon activation and innate immunity. Reviews in Immunogenetic 2, 374-386.
101 Davidson NJ, Fort MM, Muller W, Leach MW, Rennick DM (2000): Chronic colitis in IL-10-/- mice: insufficient counter regulation of a Th1 response. International Reviews of Immunology 19: 91-121.
102 Lagoo AS, Eldridge JH, Lagoo-Deenadaylan S, Black CA, Ridwan BU, Hardy KJ, McGhee JR, Beagley KW (1994): Peyer's patch CD8+ memory T cells secrete T helper type 1 and type 2 cytokines and provide help for immunoglobulin secretion. European Journal of Immunology 24: 3087-3092.
103 Delves PJ and Roitt IM (2000): The immune system – First of two parts. New England Journal of Medicine 343: 37-49.
104 Bloom BR, Salgame P, Diamond B (1992): Revisiting and Revising Suppressor T-Cells. Immunology Today 13: 131-136.
105 Field CJ, McBurney MI, Massimino S, Hayek MG, Sunvold GD (1999): The fermentable fiber content of the diet alters the function and composition of canine gut associated lymphoid tissue. Veterinary Immunology and Immunopathology 72: 325-341.
106 Kaufhold J, Hammon HM, Blum JW (2000): Fructo-oligosaccharide supplementation: Effects on metabolic, endocrine and hematological traits in veal calves. Journal of Veterinary Medicine. Series A: Physiology Pathology Clinical Medicine 47: 17-29.
107 Haller D, Blum S, Bode C, Hammes WP, Schiffrin EJ (2000): Activation of human peripheral blood mononuclear cells by nonpathogenic bacteria in vitro: evidence of NK cells as primary targets. Infection and Immunology 68: 752-759.
108 Fagarasan S and Honjo T (2003): Intestinal IgA synthesis: regulation of front-line body defences. Nature Reviews. Immunology 3: 63-72.
109 Morton HC, Pleass RJ, Woof JM, Brandtzaeg P (2004): Characterization of the ligand binding site of the bovine IgA Fc receptor (bFc alpha R). Journal of Biologica Chemistry 279: 54018-54022.
110 Kudoh K, Shimizu J, Ishiyama A, Wada M, Takita T, Kanke Y, Innami S (1999): Secretion and excretion of immunoglobulin A to cecum and feces differ with type of indigestible saccharides. Journal of Nutritional Science and Vitaminolology 45: 173-181.
111 Morton HC (2005): IgA Fc receptors in cattle and horses. Veterinary Immunology and Immunopathology 108: 139-143.
112 Kagnoff MF (1993): Immunology of the intestinal tract. Gastroenterology 105: 1275-1280.
35

Acknowledgements
36
ACKNOWLEDGEMENTS
First and foremost I would like to thank Prof. Dr. Dr. Heinrich HD Meyer, who enabled me to work at the institute of physiology.
I would especially like to thank my advisor, Dr. Michael W. Pfaffl, for his generous time and commitment. Throughout my doctoral work he encouraged me to develop independent thinking and research skills. He continually stimulated my analytical thinking and greatly assisted me with scientific writing.
Many thanks to Dr. Wolfgang Preißinger from the Institut für Tierernährung und Futterwirtschaft, Bayerische Landesanstalt für Landwirtschaft (LfL), for the design and realization of the animal study and the monitoring during the experimental time.
Special thanks go to Prof. Dr. Wilhelm M. Windisch, who was willing to participate in my rigorosum committee.
Special thanks are due to the `Landesuntersuchungsamt für das Gesundheitswesen Südbayern´ (LUA, Oberschleißheim) in Germany for their excellent paraffin embedding and many thanks for Milei GmbH providing the Lactusat, and Milkivit, Trouw Nutrition, located in Burgheim, Germany, for preparing the milk replacer.
I extend many thanks to my colleagues, Ph.D. students and employees at the institute for the nice working atmosphere and for helping in the lab.
Finally, I'd like to thank my family and my longtime companion Ralf for their support and patience.
I am deeply grateful for financial support of this project by the "H. Wilhelm Schaumann Stiftung", Hamburg, Germany.

Scientific communications
37
SCIENTIFIC COMMUNICATIONS
Original publications
Fleige S and Pfaffl MW (2006): RNA integrity and the effect on the real-time qRT-PCR performance. Molecular Aspects of Medicine 27: 126-139. Fleige S, Walf V, Huch S, Prgomet C, Sehm J, Pfaffl MW (2006): Comparison of relative mRNA quantification models and the impact of RNA integrity in quantitative real-time RT-PCR. Biotechnology letters 28:1601-1613. Fleige S, Preißinger W., Meyer HHD, Pfaffl MW (2007): Effect of lactulose on growth performance and intestinal morphology of pre-ruminant calves using a milk replacer containing Enterococcus faecium. Animal 1: 367-373. Fleige S, Preißinger W., Meyer HHD, Pfaffl MW (2007): Lactulose: Effect on apoptotic- and immunological markers in the gastrointestinal tract of pre-ruminant calves. Veterinarni Medicina 52(10): 437-444. Fleige S, Preißinger W., Meyer HHD, Pfaffl MW (2007): The immune-modulating effect of lactulose in combination with Enterococcus faecium in pre-ruminant calves. Journal of nutrition. Submitted.
Scientific presentations
Fleige S and Pfaffl MW: Effect of RNA integrity on PCR results. EMBO Practical Course on Quantification of gene expression by real-time qRT-PCR. 28.05-02.06.2005, EMBL, Heidelberg. Fleige S, Preißinger W, Meyer, HHD, Pfaffl MW: Einfluss einer synbiotischen Fütterung mit Lactulose und Enterococcus faecium auf die Darmgesundheit bei Milchkälbern. Milchkonferenz 2005 der Deutschen Gesellschaft für Milchwissenschaft, 29-30.09.2005, Kiel.

Scientific communications
38
Fleige S, Meyer HHD, Pfaffl MW: Lactulose: Health benefits in pre-ruminant calves. IDF Symposium "Lactose and its Derivatives", 14-16.05.2007, Moscow, Russia. Fleige S, Meyer HHD: Symbiotische Wirkung von Lactulose plus Enterococcus faecium auf die Darmfunktionen präruminanter Kälber. Weihenstephaner Milchwirtschaftliche Herbsttagung, 04-05.10.2007, Freising.
Posters
Meyer HHD, Fleige S, Prgomet C, Pfaffl MW: Lactulose, Lactoferrin and Lactoferricin: Health benefits in the gastrointestinal tract. 27th IDF World Dairy Congress, 20-23.10.2006, Shanghai. Fleige S and Pfaffl MW: Relative mRNA quantification models and the impact of RNA integrity. 3rd International qPCR Event, Technical University of Munich, 26-30.03.2007, Freising-Weihenstephan. Fleige S, Meyer HHD, Pfaffl MW: Lactulose: Health benefit in the gastrointentinal tract of probiotic fed calves. Milchkonferenz 2007 der Deutschen Gesellschaft für Milchwissenschaft, 17-18.09.2007, Wien.

Curriculum vitae
39
CURRICULUM VITAE
Surname Fleige
First name Simone
Date of birth 21.06.1977
Place of birth Neuenkirchen (Kr. Steinfurt)
School 1983 – 1987 Ludgeri primary school, Neuenkirchen
1987 – 1993 Snedwinkela Realschule, Neuenkirchen
1993 – 1996 Hildegarisschule, Höhere Berufsfachschule mit gymnasialer
Oberstufe, Münster
06/1996 Graduation „Allgemeine Hochschulreife“
University education 1996 – 2003 Study of oecotrophology
Rheinische Friedrich-Wilhelms Universität Bonn
11/2003 Graduation with diploma (Dipl. oec. troph.)
06/2004 – dato Preparation of thesis (Dr. rer. nat)
Technische Universität München, Freising-Weihenstephan

Appendix
40
APPENDIX
International reviewed publications of the author
Appendix I: Fleige S and Pfaffl MW (2006): RNA integrity and the effect on the real-time qRT-PCR performance. Molecular Aspects of Medicine 27: 126-139. Appendix II: Fleige S, Walf V, Huch S, Prgomet C, Sehm J, Pfaffl MW (2006):
Comparison of relative mRNA quantification models and the impact of RNA integrity in quantitative real-time RT-PCR. Biotechnology letters 28:1601-1613.
Appendix III: Fleige S, Preißinger W., Meyer HHD, Pfaffl MW (2007): Effect of lactulose on growth performance and intestinal morphology of pre-ruminant calves using a milk replacer containing Enterococcus faecium. Animal 1: 367-373.
Appendix IV: Fleige S, Preißinger W., Meyer HHD, Pfaffl MW (2007): Lactulose: Effect on apoptotic- and immunological markers in the gastrointestinal tract of pre-ruminant calves. Veterinarni Medicina 52(10): 437-444.
Papers in preparation of the author
Appendix V: Fleige S, Preißinger W., Meyer HHD, Pfaffl MW (2007):
The immune – modulating effect of lactulose in combination with Enterococcus faecium in pre-ruminant calves.
Journal of nutrition. Submitted.

Appendix
Appendix I:
Fleige S and Pfaffl MW (2006):
RNA integrity and the effect on the real-time qRT-PCR performance.
Molecular Aspects of Medicine 27: 126-139.

Molecular Aspects of Medicine 27 (2006) 126–139
www.elsevier.com/locate/mam
Review
RNA integrity and the effect on the real-timeqRT-PCR performance
Simone Fleige a, Michael W. Pfaffl a,b,*
a Physiology Weihenstephan, Center of Life and Food Sciences (ZIEL),
Technical University of Munich, 85350 Freising, Germanyb TATAA Biocenter Germany, Freising-Weihenstephan, Germany
Abstract
The assessment of RNA integrity is a critical first step in obtaining meaningful gene expres-sion data. Working with low-quality RNA may strongly compromise the experimental resultsof downstream applications which are often labour-intensive, time-consuming, and highlyexpensive. Using intact RNA is a key element for the successful application of modern mole-cular biological methods, like qRT-PCR or micro-array analysis. To verify RNA quality now-adays commercially available automated capillary-electrophoresis systems are available whichare on the way to become the standard in RNA quality assessment. Profiles generated yieldinformation on RNA concentration, allow a visual inspection of RNA integrity, and generateapproximated ratios between the mass of ribosomal sub-units. In this review, the importanceof RNA quality for the qRT-PCR was analyzed by determining the RNA quality of differentbovine tissues and cell culture. Independent analysis systems are described and compared (ODmeasurement, NanoDrop, Bioanalyzer 2100 and Experion). Advantage and disadvantages ofRNA quantity and quality assessment are shown in performed applications of various tissuesand cell cultures. Further the comparison and correlation between the total RNA integrity onPCR performance as well as on PCR efficiency is described. On the basis of the derived resultswe can argue that qRT-PCR performance is affected by the RNA integrity and PCR efficiencyin general is not affected by the RNA integrity. We can recommend a RIN higher than five as
0098-2997/$ - see front matter � 2005 Elsevier Ltd. All rights reserved.doi:10.1016/j.mam.2005.12.003
* Corresponding author. Present address: Physiology Weihenstephan, Center of Life and Food Sciences(ZIEL), Technical University of Munich, 85350 Freising, Germany. Tel.: +49 8161 71 3511; fax: +49 816171 4204.
E-mail address: [email protected] (M.W. Pfaffl).
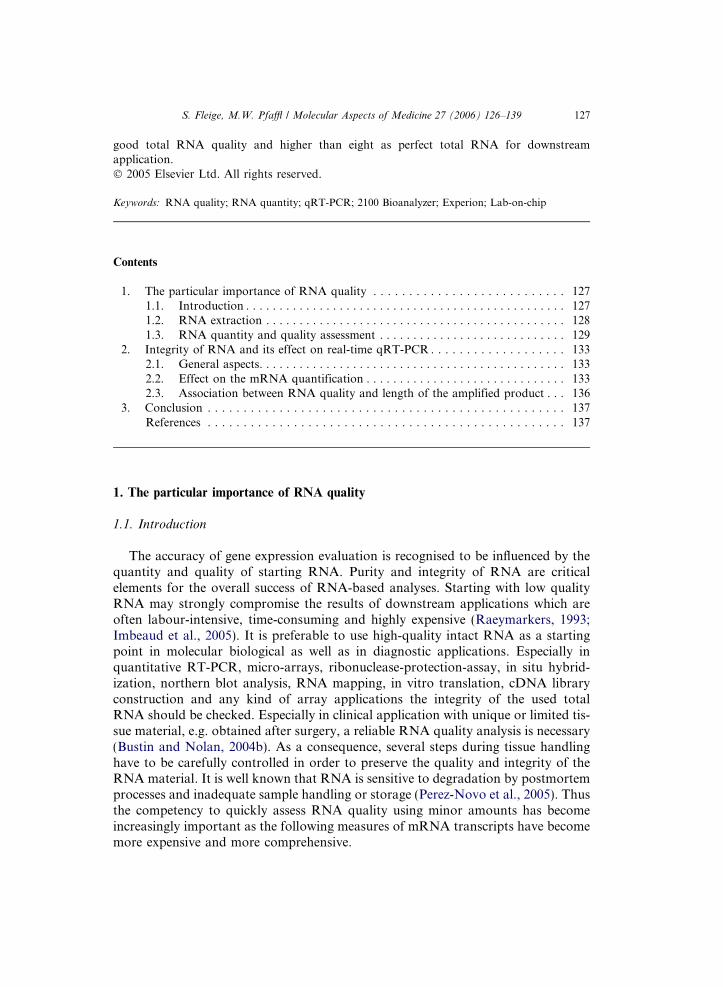
S. Fleige, M.W. Pfaffl / Molecular Aspects of Medicine 27 (2006) 126–139 127
good total RNA quality and higher than eight as perfect total RNA for downstreamapplication.� 2005 Elsevier Ltd. All rights reserved.
Keywords: RNA quality; RNA quantity; qRT-PCR; 2100 Bioanalyzer; Experion; Lab-on-chip
Contents
1. The particular importance of RNA quality . . . . . . . . . . . . . . . . . . . . . . . . . . . 127
1.1. Introduction . . . . . . . . . . . . . . . . . . . . . . . . . . . . . . . . . . . . . . . . . . . . . . . . 1271.2. RNA extraction . . . . . . . . . . . . . . . . . . . . . . . . . . . . . . . . . . . . . . . . . . . . . 1281.3. RNA quantity and quality assessment . . . . . . . . . . . . . . . . . . . . . . . . . . . . 1292. Integrity of RNA and its effect on real-time qRT-PCR . . . . . . . . . . . . . . . . . . . 133
2.1. General aspects. . . . . . . . . . . . . . . . . . . . . . . . . . . . . . . . . . . . . . . . . . . . . . 1332.2. Effect on the mRNA quantification . . . . . . . . . . . . . . . . . . . . . . . . . . . . . . 1332.3. Association between RNA quality and length of the amplified product . . . 1363. Conclusion . . . . . . . . . . . . . . . . . . . . . . . . . . . . . . . . . . . . . . . . . . . . . . . . . . 137References . . . . . . . . . . . . . . . . . . . . . . . . . . . . . . . . . . . . . . . . . . . . . . . . . . 137
1. The particular importance of RNA quality
1.1. Introduction
The accuracy of gene expression evaluation is recognised to be influenced by thequantity and quality of starting RNA. Purity and integrity of RNA are criticalelements for the overall success of RNA-based analyses. Starting with low qualityRNA may strongly compromise the results of downstream applications which areoften labour-intensive, time-consuming and highly expensive (Raeymarkers, 1993;Imbeaud et al., 2005). It is preferable to use high-quality intact RNA as a startingpoint in molecular biological as well as in diagnostic applications. Especially inquantitative RT-PCR, micro-arrays, ribonuclease-protection-assay, in situ hybrid-ization, northern blot analysis, RNA mapping, in vitro translation, cDNA libraryconstruction and any kind of array applications the integrity of the used totalRNA should be checked. Especially in clinical application with unique or limited tis-sue material, e.g. obtained after surgery, a reliable RNA quality analysis is necessary(Bustin and Nolan, 2004b). As a consequence, several steps during tissue handlinghave to be carefully controlled in order to preserve the quality and integrity of theRNA material. It is well known that RNA is sensitive to degradation by postmortemprocesses and inadequate sample handling or storage (Perez-Novo et al., 2005). Thusthe competency to quickly assess RNA quality using minor amounts has becomeincreasingly important as the following measures of mRNA transcripts have becomemore expensive and more comprehensive.

128 S. Fleige, M.W. Pfaffl / Molecular Aspects of Medicine 27 (2006) 126–139
1.2. RNA extraction
The quality and quality of purified RNA is variable and after the extraction dur-ing long storage rather unstable (Bustin et al., 2005). Especially long mRNA frag-ments up to 10 kb are very sensitive to degradation. This can happen throughcleavage of RNAses introduced by handling with RNA samples. The most obviousproblem concerns the degradation of the RNA and this is best addressed by insistingthat every RNA preparation is rigorously assessed for quality and quantity. Theextraction and purification procedure of total RNA must fulfill the following criteria(Bustin and Nolan, 2004b; Pfaffl, 2005a):
• free of protein (absorbance 260 nm/280 nm);• free of genomic DNA;• should be undegraded (28S:18S ratio should be roughly between 1.8 and 2.0, with
low amount of short fragments);• free of enzymatic inhibitors for RT and PCR reaction, which is strongly depen-
dent on the purification and clean-up methods;• free of any substances which complex essential reaction co-factors, like Mg2+ or
Mn2+;• free of nucleases for extended storage;
There are a substantial quantity of problems that affect reproducibility, and hencethe relevance of results. The source of RNA, sampling techniques (biopsy material,single cell sampling, laser micro-dissection) as well as RNA isolation techniques(either total RNA or poly-adenylated RNA isolation techniques) often vary signifi-cantly between processing laboratories (Bustin and Nolan, 2004b; Pfaffl, 2004). TheRNA quality can be different between two extraction methods, e.g. performed byhand or by an automatic extraction system. The isolated total cellular RNA withthe liquid extraction, e.g. Trizol (Roche Diagnostics, Germany) or TriFast (peqlab,Germany), has different RNA quality, whereas only the type of homogenization ischanged (Fleige and Pfaffl, 2006). Due to its inherent susceptibility to ubiquitousRNases and its chemical instability, RNA is readily endangered by base- orenzyme-catalyzed hydrolysis. Researchers must take into account a variety offactors, which influence their ability to obtain high-quality RNA that is free of con-tamination such as RNases, proteins and genomic DNA. These factors include yieldvariations, processing requirements, and sample availability of different cells ortissues. The best RNA yield is obtained from tissue that has been diced into smallfragments with a scalpel prior to being frozen by submerging in liquid nitrogen.The samples must be homogenized using a bead mill or a mechanical homogenizer(Bustin and Nolan, 2004b).
Further problem may arise in the case of research on human or animal tissue sam-pling techniques and the time dependency until the tissue is stored safely in RNaseinhibitors or RNA-later (Ambion, USA). It is often very challenging to decrease thissampling time to a minimum within the framework of clinical routine procedures, orin animal experiments during a slaughtering process. The RNA quality may also be

S. Fleige, M.W. Pfaffl / Molecular Aspects of Medicine 27 (2006) 126–139 129
impaired in samples stored for a long time or under sub-optimal conditions (Schooret al., 2003).
1.3. RNA quantity and quality assessment
Conventional methods are often not sensitive enough, not specific for single-stranded RNA, and disposed to interferences from contaminants present in thesample (Imbeaud et al., 2005). The assessment of RNA integrity can do by variousmethods: the classical gel OD measurement, modern OD measurement via Nano-Drop, old fashioned denaturating agarose gel-electrophoresis or with high innova-tive lab-on-chip technologies like Bioanalyzer 2100 (Agilent Technologies, USA)and Experion (Bio-Rad Laboratories, USA). Quantity and quality assessment usinga UV/VIS spectrophotometer should be performed at multiple wave lengths at240 nm (background absorption and possible contaminations), 260 nm (specific fornucleic acids), 280 nm (specific for proteins), and 320 nm (background absorptionand possible contaminations). On basis of the OD 260 the quantity, and by the ratioof the optical density (OD) of OD 260/280 the quality, OD 260/240 or OD 260/320the purity and the extraction performance can be verified. An OD 260/280 ratiogreater than 1.8 is usually considered an acceptable indicator of good RNA quality(Sambrook et al., 1989; Manchester, 1996). By the presence of genomic DNA theOD 260 measurement can compromised and leading to over-estimation of the actualand real RNA concentration. Further the used buffer and high salt concentrationswill interfere with the result of the optical measurement and therefore the calculatedRNA concentrations might be over- or under-estimated (own unpublished results).The accuracy of the OD 260/A280 method has been questioned, with a value of1.8 corresponding to only 40% RNA, with the remainder accounted for by protein(Bustin and Nolan, 2004b).
More modern spectrometric methods, like the NanoDrop (ND-3300, NanoDropTechnologies, USA) in combination with RNA RiboGreen dye (Molecular Probes,Invitrogen, USA) can be used as an UV/VIS spectrophotometer for ultra sensitivequantification of RNA. A major advantage of the system is the very low sample con-sumption of 1–2 ll, which is especially important when using precious materials likehuman biopsy or laser dissected samples. Since the sample is not contained in a sec-ondary vessel, the sample directly wets the system optics, reducing the variations andcontaminations resulting from changing or repositioning the cuvettes. Further theND-3300 measure a spectra of your sample covering 400–750 nm, giving you moreinformation about the RNA integrity and other chemical contamination or theextracted RNA (ND-3300 user manual V2.5, NanoDrop Technologies, USA).
An additional check involves gel electrophoresis with RNA either stained withSYBR Green dye (Molecular Probes) or the less sensitive ethidium bromide (Bustinand Nolan, 2004b). But the assessment of RNA integrity by inspection of the 18Sand 28S ribosomal RNA bands using denaturating gel electrophoresis is a cumber-some, low-throughput method and requires significant amounts of precious RNA(Bustin and Nolan, 2004a). Using the RiboGreen (Molecular Probes) reagent, thedetection as little as 1 ng RNA/ml is possible, and can be measured reproducible.

130 S. Fleige, M.W. Pfaffl / Molecular Aspects of Medicine 27 (2006) 126–139
In contrast to UV absorbance measurements at 260 nm, where proteins and freeribonucleotides in the mixture interfere with accurate quantitation, the RiboGreenreagent only measures polymeric nucleic acids (Jones et al., 1998; LePecq and Pao-letti, 1966; Karsten and Wollenberger, 1977).
Today high innovative lab-on-chip technologies like micro-fluidic capillary elec-trophoresis were used to do RNA quality and quantity assessments. Certainly, interms of routinely analyzing large numbers of RNA preparations, it is by far themost convenient and objective way of assessing the quality of RNA. This methodhas become widely used, particularly in the gene expression profiling platforms (Bus-tin, 2002; Lightfood, 2002; Mueller et al., 2000).
The Agilent 2100 Bioanalyzer (Agilent Technologies, USA) and the Expe-rion (Bio-Rad Laboratories, USA) provide a framework for the standardizationof RNA quality control. Therefore RNA samples are electrophoretical separatedon a micro-fabricated chip and subsequently detected via laser induced fluorescencedetection. It requires only a very small amount of RNA sample down to 200 pg totalRNA. The use of a RNA ladder as a mass and size standard during electrophoresisallows the estimation of the RNA band sizes. Integrity of the RNA may be assessedby visualization of the 18S and 28S ribosomal RNA bands. An elevated thresholdbaseline and a decreased 28S:18S ratio, both are indicative of degradation (Muelleret al., 2004). The intact RNA preparation (Fig. 1) shows high 18S and 28S rRNApeaks as well as a small amount of 5S RNA. Degradation of the RNA sample
Fig. 1. Chromatograms of micro-capillary electrophoresis from RNA samples showing different degreesof degradation. A typical electropherogram of high-quality RNA (solid black line, RIN = 7.5) include aclearly visible 28/18S rRNA peak ratio and a small 5S RNA. Partially degraded sample (thin grey line;RIN = 4.5) was indicated by a shift in the electropherogram to shorter fragment sizes and produce adecrease in fluorescence signal as dye intercalation sites are destroyed.

S. Fleige, M.W. Pfaffl / Molecular Aspects of Medicine 27 (2006) 126–139 131
produces a shift in the RNA size distribution toward smaller fragments and adecrease in fluorescence signal as dye intercalation sites are destroyed. The 28S/18S ratios are automatically generated by the both software applications in Experionand Bioanalyzer 2100. The RNA measurement using the lab-on-chip technologyappears stable and relatively uninfluenced by contamination. RNA from tissue sam-ples are typically classified according to the observation that the 28S rRNA peakarea should be approximately twice the quantity of that of the 18S in total RNAsamples for the mRNA quality to be acceptable (Sambrook and Russel, 2001). Ingeneral a 2.0 ribosomal ratio is regarded as perfect (Sambrook and Russel, 2001;Mueller et al., 2004). But in practice this value hardly is obtained. The 28S/18S ratiomay reflect unspecific damage to the RNA, including sample mishandling, postmor-tem degradation, massive apoptosis or necrosis, but it can reflect specific regulatoryprocesses or external factors within the living cells. As it is apparent from a review ofthe literature, the standard 28S/18S rRNA ratio of a 2.0 is difficult to meet, especiallyfor RNA derived from clinical samples, and it now appears that the relationshipbetween the rRNA electropherogram profile and mRNA integrity is up to nowunclear (Monstein et al., 1995).
Furthermore, the generated ribosomal ratios are dependent on the usedcapillary-electrophoresis. In an intern study comparing Bioanalyzer 2100 (AgilentTechnologies) with Experion (Bio-Rad) both capillary-electrophoreses systemsshowed differences in the generated ratio value, sensitivity, variation, and reproduc-ibility (data not shown). Nevertheless, both platform showed more or less the sameresults.
However, it is unable to locate the original data for this commonly acceptedpremise. Based on structural differences alone, it might be expected that the in situstability of mRNA differs from rRNA. Certainly, RNases will eventually result inthe loss of both components, although there are other factors under which in siturRNA will be completely degraded but mRNA remains intact (Mayne et al.,1999). Santiago et al. (1986) described that the mRNA integrity correspond moreclosely to the 28S than to the 18S integrity. This would mean that with increasedlength, there is a greater statistical chance of cleavage. Contrary to this assumption,Miller et al. (2004) expected that the 18S integrity correlated better than 28S with themRNA, as the length of 18S is more closely aligned with that of the average mRNA.From our findings we can confirm the mRNA quality is more related to the 28SrRNA, which is often much faster degraded than the 18S. In a time dependent totalRNA degradation via UV light the 28S rRNA disappeared very quickly (data notshown). Therefore the 28S/18S ratio has to be assessed for every single experimentand this is regarded as inadequate for the assessment of the quality (Marx, 2004).Altogether, it appears that the total RNA with lower rRNA ratios is not necessarilyof poor quality especially if no degradation products can observe in the electropho-retic trace (Imbeaud et al., 2005).
A new tool for RNA quality assessment is the RNA Integrity Number (RIN,developed by Agilent Technologies) for the lab-on-chip capillary gel-electrophoresisused in the Bioanalyzer 2100 (Mueller et al., 2004). This tool is based on a neuronalnetwork which determines the RIN number from the shape of the curve in the

132 S. Fleige, M.W. Pfaffl / Molecular Aspects of Medicine 27 (2006) 126–139
electropherogram (Fig. 1). The software and the algorithm allows the classificationof total RNA on a numbering system from 1 to 10, with 1 being the most degradedprofile and 10 being the most intact. In this way, interpretation of an electrophero-gram is facilitated, comparison of samples is enabled and repeatability of experi-ments. The verification of the RNA integrity before use in different applicationspermits to compare experiments and classify the significance of results (Muelleret al., 2004; Imbeaud et al., 2005).
The dependence of the RNA integrity on various calf tissue samples, white bloodcells and four cell lines was determined (Fleige and Pfaffl, 2006). As shown (Table 1)for solid tissues the average RIN is between 6 and 8. Tissues or organs with high con-tent of connecting tissue, e.g. in the gastrointestinal tract like rumen, omasum andjejunum, underlie high RNA degradation through the sampling and extraction pro-cedure and show great RIN variations. The reason for this variability might be thesolid and tough structure of the tissues, e.g. connecting or fatty tissue, the RNaseenzymatic activity and problems during tissue sampling and storage. Furthermoretissues from the gastrointestinal tract have been washed in physical saline solutionto get rid of any disturbing gut substances. Thus the physiological constitution ofthe tissue, the time and management of tissue sampling has a bearing on the degra-dation level of RNA. In contrary single cells like white blood cells (WBC) or cellderived from cell lines have higher RIN. Cell sampling and RNA extraction is muchfaster and easier, because cells are better accessible and were not kept in any sub-optimal conditions. Therefore RNA integrity based on the RIN classification is
Table 1Average RNA integrity numbers (RIN) of various bovine tissues and cell lines analyzes with thebioanalyzer 2100 (Agilent Technologies)
Tissue Quality metrics
Mean Std. dev. n
Liver 6.49 ±0.86 28Heart 6.03 ±1.19 23Spleen 7.28 ±0.60 17Lung 6.55 ±0.67 22Rumen 4.70 ±2.81 23Reticulum 5.47 ±1.29 21Omasum 6.64 ±1.87 18Abomasum 7.30 ±0.86 17Ileum 7.35 ±1.53 17Jejunum 4.56 ±2.13 20Colon 7.52 ±0.62 19Caecum 7.28 ±0.86 16Lymph node 6.93 ±0.65 26Kidney cell 8.87 ±0.32 3Corpus luteum 9.62 ±0.32 5Granulosa cell 8.38 ±0.41 5Oviduct 9.40 ±0.29 5WBC 9.36 ±0.13 5

S. Fleige, M.W. Pfaffl / Molecular Aspects of Medicine 27 (2006) 126–139 133
much better and lay around RIN 9. The importance of isolation technique for agood RNA quality is shown in detail in Fleige and Pfaffl (2006).
2. Integrity of RNA and its effect on real-time qRT-PCR
2.1. General aspects
For a sensitive and reliable quantitative measurement of low abundant mRNAgene expression real-time quantitative reverse-transcription polymerase-chain-reac-tion (qRT-PCR) reaction is the method of choice. qRT-PCR shows high sensitivity,good reproducibility and a wide quantification range (Bar et al., 2003; Wang andBrown, 1999). For successful qRT-PCR and micro-array experiments it is importantto use intact RNA. It is not known how this image is influenced by sample prepara-tion factors which such as RNA quality, cDNA synthesis and labeling efficiency.Therefore the determination of RNA quality is a critical first step in obtaining mean-ingful data of gene expression.
Many factors present in samples as well as exogenous contaminants have beenshown to inhibit the RT as well as the PCR. Some of them derive from the extractedtissue, others stem from inefficient or messy lab management. For example, the pres-ence of haemoglobin, fat, glycogen, cell constituents, Ca2+, high genomic DNA con-centration, and DNA binding proteins are important factors (Wilson, 1997; Rossenet al., 1992). Exogenous contaminants such as glove powder and phenolic com-pounds from the extraction process or the plastic ware can have an inhibitory effect.Also unknown tissue-specific factors can influence amplification kinetics but thisaffect can be ameliorated, in part, by appropriate primer selection (Wilson, 1997;Rossen et al., 1992; Tichopad et al., 2004). There nevertheless, little is known aboutthe possibility of obtaining reasonable qRT-PCR data from RNA samples withimpaired quality. Expression differences for some genes can independently confirmedby real-time qRT-PCR. Gene Expression profiles obtained from partially degradedRNA samples with still visible ribosomal bands exhibit a high degree of similaritycompared to intact samples and that RNA samples of sub-optimal quality. Thismight therefore still lead to meaningful results if used carefully (Schoor et al., 2003).
2.2. Effect on the mRNA quantification
In view of the observed difference in gene expression stability between intact anddegraded RNA samples from the same tissue and the higher gene-specific variationin degraded samples, we propose performing RNA quality control prior to down-stream quantification assays (Bustin and Nolan, 2004a). Especially if one aims toaccurately quantify small expression differences (Perez-Novo et al., 2005). With thatprospect in mind, and with the aim of anticipating future standards by pre-normativeresearch, it is connotatively too identified and analyzed the influence of degradedRNA on the performance on qRT-PCR. In a study from Fleige and Pfaffl (2006)the purity and integrity of RNA samples was assessed, derived from different bovine

134 S. Fleige, M.W. Pfaffl / Molecular Aspects of Medicine 27 (2006) 126–139
tissues and cell lines, using the Bioanalyzer 2100 (Agilent Technologies). To test theinfluence of the RNA integrity (numbered according to the RIN classification), theintact transcriptome of one distinct bovine tissue was degraded factitiously by enzy-matic digest or with ultraviolet light. This leads to enzymatic cutoffs or breaks in thenative RNA strand resulting in fragments of different lengths. A gradient with sev-eral steps of intact RNA (RIN 8–10) down to degraded RNA (RIN = 1–3) wasinvestigated. The effect of RIN on qRT-PCR performance was investigated by cor-relating the RIN values with the crossing points (CP) of the PCR runs. The expres-sion levels of four genes were assessed, all of different abundance levels ranging fromhigh abundant 18S and 28S rRNA, intermediate abundant b-actin, down to very lowexpressed IL-1b mRNA samples. The importance of using high-quality RNA is dem-onstrated by the results shown in Fig. 2. A high-quality RNA (high RIN) determineda lower CP than by a less-quality (lower RIN). High significant relation betweenRIN and CP (p < 0.01 for the trend) could be shown for all examined genes(n = 4) and tissues (n = 14). With increasing RNA quality the variability of theqRT-PCR result was decreased (Huch et al., 2005).
It is well known, that normalization by an internal reference gene reduce or evendiminish tissue derived effects on qRT-PCR (Wittwer et al., 1997). Reliability of anyrelative RT-PCR experiment can be improved by including an invariant endogenouscontrol in the assay to correct for sample-to-sample variations in RT-PCR efficiencyand errors in sample quantification. So called relative quantification determines thechanges in steady-state mRNA levels of a gene across multiple samples and gives aresult relative to the levels of an internal control RNA (Pfaffl, 2001). For many
Fig. 2. Influence of RNA integrity (RIN) on the Crossing Point (CP): Amplification curves from threeHKG (18S, 28S, b-Actin) and IL-1b with different quality of employed RNA from corpus luteum. Anincrease of RNA degradation correlates significantly to the amplified product, such that the CP is decreasewith increasing RNA integrity number (RIN). Quantitative analyses use the threshold cycle number (Ct),at which the signal is detected above the background and is in the exponential phase.

S. Fleige, M.W. Pfaffl / Molecular Aspects of Medicine 27 (2006) 126–139 135
experiments this method is most adequate for investigating physiological changes ingene expression levels. It is based on the expression levels of a target gene versus aninternal reference gene, often non-regulated housekeeping gene are prominent candi-dates. To get rid of the RIN dependency the CP data were normalized by an inter-nally expressed reference gene (Fleige and Pfaffl, 2006), according to the DCPmethod described earlier (Livak and Schmittgen, 2001). The normalized results(Fig. 3), expressed as RIN compared to DCP values showed minor influence ofRNA quality on the expression results, and the significant effects could be reducedto a minimum.
Sometimes, even intact RNA does not guarantee good results because RNA sam-ple may contain inhibitors that can reduce reaction efficiency (Bustin and Nolan,2004a; Wong and Medrano, 2005). These factors include length of the amplicon,secondary structure and primer quality. The shapes of amplification curves differin the steepness of any fluorescence increase and in the absolute fluorescence levelsat plateau depending on background fluorescence levels. Therefore PCR efficiencyhas a major impact on the fluorescence history and the accuracy of the calculatedexpression result and in critically influenced by PCR reaction components. Efficiencyevaluation is an essential marker in real-time gene quantification procedure (Ticho-pad et al., 2003, 2004). The effect of RIN on PCR efficiency was investigated simi-larly to the above mentioned tissues and various RNA qualities. The efficiency ofall investigated genes was not affected by the RNA quality, independent of geneor tissue. A causally determined correlation between the RIN and the CP is shownin Fig. 4 (Fleige and Pfaffl, 2006).
Fig. 3. Influence of RNA integrity (RIN) on the delta CP. The results (CP) from Fig. 2 are normalizedwith b-Actin. The significant effect of RNA integrity could reduce to a minimum.
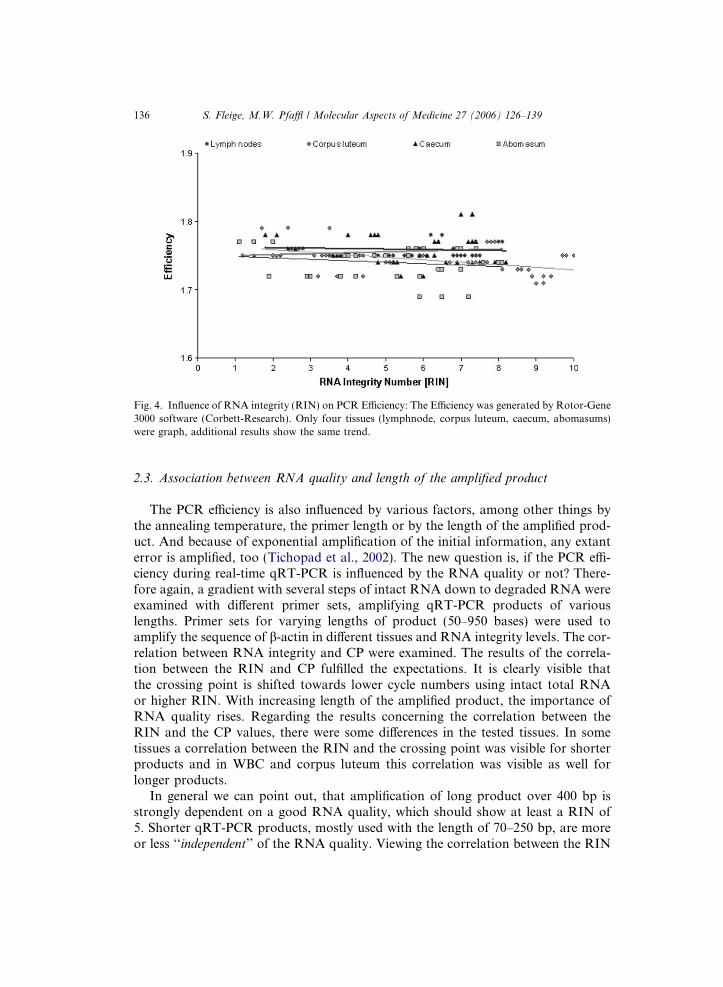
Fig. 4. Influence of RNA integrity (RIN) on PCR Efficiency: The Efficiency was generated by Rotor-Gene3000 software (Corbett-Research). Only four tissues (lymphnode, corpus luteum, caecum, abomasums)were graph, additional results show the same trend.
136 S. Fleige, M.W. Pfaffl / Molecular Aspects of Medicine 27 (2006) 126–139
2.3. Association between RNA quality and length of the amplified product
The PCR efficiency is also influenced by various factors, among other things bythe annealing temperature, the primer length or by the length of the amplified prod-uct. And because of exponential amplification of the initial information, any extanterror is amplified, too (Tichopad et al., 2002). The new question is, if the PCR effi-ciency during real-time qRT-PCR is influenced by the RNA quality or not? There-fore again, a gradient with several steps of intact RNA down to degraded RNA wereexamined with different primer sets, amplifying qRT-PCR products of variouslengths. Primer sets for varying lengths of product (50–950 bases) were used toamplify the sequence of b-actin in different tissues and RNA integrity levels. The cor-relation between RNA integrity and CP were examined. The results of the correla-tion between the RIN and CP fulfilled the expectations. It is clearly visible thatthe crossing point is shifted towards lower cycle numbers using intact total RNAor higher RIN. With increasing length of the amplified product, the importance ofRNA quality rises. Regarding the results concerning the correlation between theRIN and the CP values, there were some differences in the tested tissues. In sometissues a correlation between the RIN and the crossing point was visible for shorterproducts and in WBC and corpus luteum this correlation was visible as well forlonger products.
In general we can point out, that amplification of long product over 400 bp isstrongly dependent on a good RNA quality, which should show at least a RIN of5. Shorter qRT-PCR products, mostly used with the length of 70–250 bp, are moreor less ‘‘independent’’ of the RNA quality. Viewing the correlation between the RIN
S. Fleige, M.W. Pfaffl / Molecular Aspects of Medicine 27 (2006) 126–139 137
and the efficiency of PCR, it is noticeable that the efficiency does not vary withinone amplicon length, despite some exceptions. No correlation between the RINand PCR efficiency (ranging between 1.6 and 1.7) was given (Pfaffl, 2005b).
Other studies showed as well an inhibitory effect of poor RNA quality on real-time PCR results. Degraded or impure RNA can limit the efficiency of the RTreaction and reduce yield. RNA should either be prepared from fresh tissue, or fromtissue treated with an RNA stabilization solution such as RNA later (Labourier,2003, 2004). The importance of using full length RNA for reverse transcriptiondepends on the application. As a result, some degradation of the RNA can be toler-ated. If it is not possible to use completely intact RNA, a design of primers to annealan internal region of the gene of interest is useful. Note that for truly quantitativeRT-PCR, partially degraded RNA may not give an accurate representation of geneexpression (Wang, 2005).
3. Conclusion
In conclusion, while all efforts should be made to obtain high-quality RNA sam-ples that reflect the natural state most reliably, moderately degraded samples with adegradation signature may still lead to a reasonable qRT-PCR expression profile.The normalized expression differences measured with the real-time RT-qPCR aresimilar to those obtained from high-quality samples. Only the non-normalized valuesshow a correlation between RNA integrity and CP. This findings show the impor-tance of the normalization. The reliability of any relative RT-PCR experiment canbe improved by including an invariant endogenous control in the assay to correctfor sample-to-sample variations in RT-PCR efficiency and errors in sample quanti-fication. Furthermore, RNA samples of optimal quality can serve as a template forall product lengths whereas for degraded RNA primer pairs for shorter amplicon aremore suitable. To be on the safe side with primer pairs it would be helpful to provethe RNA quality before starting the run.
Up to now it is still questionable if we can use the 28S/18S ratio or the RIN, bothbased on the quantity and quality check of the ribosomal sub-units, to make a def-inite statement on the mRNA quality which is our target in qRT-PCR. We are look-ing forward for sensitive methods, comparable to an intelligent algorithm, whichprove the real mRNA integrity to have a reliable answer on mRNA quantity andquality.
References
Agilent Technologies, 2004. DNA, RNA, protein and cell analysis. Agilent Application Note, PublicationNumber 5989-1197EN.
Bar, T., Stahlberg, A., Muszta, A., Kubista, M., 2003. Kinetic outlier detection (KOD) in real-time PCR.Nucleic Acids Research 31 (17), e105.
Bustin, S.A., 2002. Quantification of mRNA using real-time reverse transcription PCR (RT-PCR): trendsand problems. Journal of Molecular Endocrinology 29, 23–39.

138 S. Fleige, M.W. Pfaffl / Molecular Aspects of Medicine 27 (2006) 126–139
Bustin, S.A., Nolan, T., 2004a. Pitfalls of quantitative real-time reverse-transcription polymerase chainreaction. Journal of Biomolecular Techniques 15, 155–166.
Bustin, S.A., Nolan, T., 2004b. Template handling, preparation, and quantification. In: Bustin, S.A. (Ed.),The Real-Time PCR Encyclopaedia A–Z of Quantitative PCR. Published by International UniversityLine, La Jolla, CA, pp. 87–120.
Bustin, S.A., Benes, V., Nolan, T., Pfaffl, M.W., 2005. Quantitative real-time RT-PCR—a perspective.Journal of Molecular Endocrinology 34, 597–601.
Fleige, S., Pfaffl, M.W., 2006. Impact of RNA integrity on the quantitative real-time RT-PCRperformance and relative mRNA quantification models. Submitted to RNA (January 2006).
Huch, S., Fleige, S., Pfaffl, M.W., 2005. Determination of RNA quality and its influence on thequantitative real-time RT-PCR. Diploma thesis, Department of Physiology, TUM-Weihenstephan.
Imbeaud, S., Graudens, E., Boulanger, V., Barlet, X., Zaborski, P., Eveno, E., Mueller, O., Schroeder, A.,Auffray, C., 2005. Toward standardization of RNA quality assessment using user-independentclassifiers of microcapillary electrophoresis traces. Nucleic Acids Research 33 (6), e56.
Jones, L.J., Yue, S.T., Cheung, C.Y., Singer, V.L., 1998. RNA quantification by fluorescence-basedsolution assay: RiboGreen reagent characterization. Analytical Biochemistry 265, 368–374.
Karsten, U., Wollenberger, A., 1977. Improvements in the ethidium bromide method for directfluorometric estimation of DNA and RNA in cell and tissue homogenates. Analytical Biochemistry 77,464–470.
Labourier, E., 2003. A better way to isolate RNA and protein from the same sample. Ambion TechNotes10 (3), 16–17.
Labourier, E., 2004. RNAlater� for RNA and Protein Stabilization. Ambion TechNotes 11 (3), 7.LePecq, J.B., Paoletti, C., 1966. A new fluorometric method for RNA and DNA determination. Analytical
Biochemistry 17, 100–107.Lightfood, S., 2002. Quantitation comparison of total RNA using the Agilent 2100 bioanalyzer, ribogreen
analysis, and UV spectrometry. Agilent Application Note, Publication number 5988-7650EN.Livak, K.J., Schmittgen, T.D., 2001. Analysis of relative gene expression data using real-time quantitative
PCR and the 2(-Delta Delta C(T)) Method. Methods 25, 402–408.Manchester, K.L., 1996. Use of UV methods for measurement of protein and nucleic acid concentrations.
Biotechniques 20, 968–970.Marx, V., 2004. RNA Quality: Defining the Good, the Bad, the Ugly. Cover Story, Genomics and
Proteomics.Mayne, M., Shepel, P.N., Geiger, J.D., 1999. Recovery of height integrity mRNA from brains of rats
killed by high-energy focused microwave irradiation. Brain Research Protocols 4, 295–302.Miller, C., Diglisic, S., Leister, F., Webster, M., Yolken, R.H., 2004. Evaluating RNA status for RT-PCR
in extracts of postmortem human brain tissue. Biotechniques 36, 6238–6633.Monstein, H.J., Nylander, A.G., Chen, D., 1995. RNA extraction from gastrointestinal tract and pancreas
by a modified Chomczynski and Sacci method. Biotechniques 19, 340–344.Mueller, O., Hahnenberger, K., Dittmann, M., Yee, H., Dubrow, R., Nagle, R., Ilsley, D., 2000. A
microfluidic system for high-speed reproducible DNA sizing and quantitation. Electrophoresis 21,128–134.
Mueller, O., Lightfoot, S., Schroeder, A., 2004. RNA integrity number (RIN)—standardization of RNAquality control. Agilent Application Note, Publication 5989-1165EN, pp. 1–8.
Perez-Novo, C.A., Claeys, C., Speleman, F., Cauwenberge, P.V., Bachert, C., Vandesompele, J., 2005.Impact of RNA quality on reference gene expression stability. Biotechniques 39, 52–56.
Pfaffl, M.W., 2001. A new mathematical model for relative quantification in real-time RT-PCR. NucleicAcids Research 29 (9), e45.
Pfaffl, M.W., 2004. Quantification Strategies in real-time PCR. In: Bustin, S.A. (Ed.), The Real-Time PCREncyclopedia A–Z of Quantitative PCR. Published by International University Line, La Jolla, CA, pp.87–120.
Pfaffl, M.W., 2005a. Nucleic acids: mRNA identification and quantification. In: Worsfold, P.J., Gallagher,P.K. (Eds.), Nucleic Acids, Encyclopedia of Analytical Science, second ed. Academic Press, ISBN 0-12-764100-9, pp. 417–426.

S. Fleige, M.W. Pfaffl / Molecular Aspects of Medicine 27 (2006) 126–139 139
Pfaffl, M.W., 2005b. qPCR 2005: 2nd International qPCR Symposium. The Whole Story of QuantitativePCR—from Tissue Preparation to Bioinformatics. Proceedings, ISBN 3000166874, p. 11.
Raeymarkers, L., 1993. Quantitative PCR: theoretical consideration with practical implication. AnalyticalBiochemistry 214, 582–585.
Rossen, L., Norskov, P.l., Holmstrom, K., Rasmussen, F.O., 1992. Inhibition of PCR by components offood sample, microbial diagnostic assay and DNA-extraction solutions. International Journal of FoodMicrobiology 17, 37–45.
Sambrook, J., Fritsch, E.F., Maniatis, T., 1989. Molecular Cloning: A Laboratory Manual, second ed.Cold Spring Harbor Laboratory Press, NY.
Sambrook, J., Russel, D.W., 2001. Molecular Cloning: A Laboratory Manual. CSH Laboratory Press,Cold Spring Harbor, NY.
Santiago, T.C., Purvis, I.J., Bettany, A.J., Brown, A.J.P., 1986. The relationship between mRNA stabilityand length in Saccharomyces cerevisiae. Nucleic Acids Research 12, 8347–8360.
Schoor, O., Weinschenk, T., Hennenlotter, J., Corvin, S., Stenzl, A., Rammensee, H.-G., Stevanovic, S.,2003. Moderate degradation does not preclude microarray analysis of small amounts of RNA.BioTechniques 35, 1192–1201.
Tichopad, A., Dzidic, A., Pfaffl, M.W., 2002. Improving quantitative real-time RT-PCR reproducibilityby boosting primer-linked amplification efficiency. Biotechnology Letters 24, 2053–2056.
Tichopad, A., Dilger, M., Schwarz, G., Pfaffl, M.W., 2003. Standardized determination of real-time PCRefficiency from a single reaction setup. Nucleic Acids Research 31 (20), e122.
Tichopad, A., Didier, A., Pfaffl, M.W., 2004. Inhibition of real-time RT-PCR quantification due to tissue-specific contaminants. Molecular and Cellular Probes 18, 45–50.
Wang, T., Brown, M.J, 1999. mRNA quantification by real time TaqMan polymerase chain reaction:validation and comparison with RNase protection [In Process Citation]. Analytical Biochemistry 269,198–201.
Wang, E., 2005. RNA amplification for successful gene profiling analysis. Journal of TranslationalMedicine 3, 28.
Wilson, I.G., 1997. Inhibition and facilitation of nucleic acid amplification. Applied and EnvironmentalMicrobiology 63, 3741–3751.
Wittwer, C.T., Herrmann, M.G., Moss, A.A., Rasmussen, R.P., 1997. Continuous fluorescencemonitoring of rapid cycle DNA amplification. Biotechniques 22 (130-131), 134–138.
Wong, M.L., Medrano, J.F., 2005. Real-time PCR for mRNA quantitation. BioTechniques 39, 75–85.

Appendix
Appendix II:
Fleige S, Walf V, Huch S, Prgomet C, Sehm J, Pfaffl MW (2006):
Comparison of relative mRNA quantification models and the impact of RNA integrity in
quantitative real-time RT-PCR.
Biotechnology letters 28:1601-1613.

Abstract Relative quantification in quantitative
real-time RT-PCR is increasingly used to
quantify gene expression changes. In general,
two different relative mRNA quantification
models exist: the delta-delta Ct and the effi-
ciency-corrected Ct model. Both models have
their advantages and disadvantages in terms of
simplification on the one hand and efficiency
correction on the other. The particular problem
of RNA integrity and its effect on relative
quantification in qRT-PCR performance was
tested in different bovine tissues and cell lines
(n = 11). Therefore different artificial and stan-
dardized RNA degradation levels were used.
Currently fully automated capillary electropho-
resis systems have become the new standard in
RNA quality assessment. RNA quality was
rated according the RNA integrity number
(RIN). Furthermore, the effect of different
length of amplified products and RNA integrity
on expression analyses was investigated. We
found significant impact of RNA integrity on
relative expression results, mainly on cycle
threshold (Ct) values and a minor effect on
PCR efficiency. To minimize the interference of
RNA integrity on relative quantification models,
we can recommend to normalize gene expres-
sion by an internal reference gene and to per-
form an efficiency correction. Results
demonstrate that innovative new quantification
methods and normalization models can improve
future mRNA quantification.
Keywords Gene expression study Æ Ct Æ mRNA ÆqRT-PCR Æ real-time RT-PCR Æ RNA integrity ÆRNA integrity number (RIN)
Introduction
PCR for gene expression profiling has become
the standard technology for the quantification of
nucleic acids. For an exact quantitative mea-
surement of low abundant mRNA gene expres-
sion real-time quantitative reverse-transcription
PCR (qRT-PCR) is the method of choice. Rel-
ative quantification determines the changes in
steady-state mRNA levels of a gene across
multiple samples and expresses it relative to the
levels of an internal control RNA. This control
RNA is often a classical reference gene, like
GAPDH, ribosomal RNA subunits (18S and 28S
rRNA), or b-actin, which are co-amplified in the
same tube in a multiplex-assay or amplified in a
S. Fleige Æ V. Walf Æ S. Huch Æ C. Prgomet ÆJ. Sehm Æ M. W. Pfaffl (&)Physiology Weihenstephan, Center of Life and FoodSciences (ZIEL), Technical University Munich; &TATAA Biocenter Germany, Weihenstephaner Berg3, 85354 Freising-Weihenstephan, Germanye-mail: [email protected]
Biotechnol Lett (2006) 28:1601–1613
DOI 10.1007/s10529-006-9127-2
123
ORIGINAL PAPER
Comparison of relative mRNA quantification modelsand the impact of RNA integrity in quantitative real-timeRT-PCR
Simone Fleige Æ Vanessa Walf Æ Silvia Huch ÆChristian Prgomet Æ Julia Sehm ÆMichael W. Pfaffl
Received: 12 April 2006 / Accepted: 6 June 2006 / Published online: 10 August 2006� Springer Science+Business Media B.V. 2006

separate tube as an external standard (Bustin
and Nolan 2004). The relative quantification
strategy is adequate for most purposes to inves-
tigate physiological changes in gene expression
levels.
An essential requirement for a successful
quantitative mRNA analysis using qRT-PCR is
the usage of intact RNA. Low-quality RNA may
compromise the derived expression results.
Investigations with low quality RNA as starting
material supply results of qRT-PCR (Imbeaud
et al. 2005; Raeymarkers 1993). The need to iso-
late high quality total RNA from wide variety of
clinical and/or experimental tissue samples be-
comes more important for quantitative gene
expression studies. After extraction the RNA is
unstable. Long mRNA, up to several kilo bases, is
very sensitive to degradation (Bustin 2002). This
can occur through cleavage by RNAses during
handling of RNA samples, otherwise it may also
be impaired in samples stored for a long time or
under sub-optimal conditions (Schoor et al. 2003).
Consequently, the determination and confirma-
tion of RNA quantity and quality is the first
critical step in obtaining meaningful gene
expression data.
Verification of RNA integrity prior to usage in
downstream qRT-PCR application permits
experiments to be compared and provide more
accurate and reliable results. While methods for
the physical isolation of total RNA have evolved
significantly over the last two decades, there has
been limited advancement in methods used
for assessing RNA quality. Today it is well
acknowledged that the accuracy of gene expres-
sion is influenced by starting RNA quality. RNA
purity is normally assessed by its A260/A280 ratio
(Baelde et al. 2001). The spectrometric methods
often fail in sensitivity, are highly variable and
give no results in terms of RNA integrity. In the
past, RNA quality could often not be assessed
exactly. The further development of the capillary
gel electrophoresis methods and spectrophotom-
eter technologies have addressed this issue (Auer
et al. 2003).
The micro-fluidic capillary electrophoresis has
developed into commonly tool, particularly in the
gene expression profiling platforms (Mueller et al.
2000; Livak and Schmittgen 2001). Instruments,
such as the Agilent 2100 Bioanalyzer (Agilent
Technologies, Palo Alto, CA) and the Experion
(Bio-Rad Laboratories, Hercules, CA), are
becoming more and more standard since their use
dramatically decreased the amount of RNA
needed to evaluate integrity down to the sub-
microgram scale. On condition that the 18S and
28S ribosomal RNA (rRNA) fragments produce
well-defined peaks without any smearing towards
a smaller size, the sample can be considered for
further analysis. The 28S/18S ratio is automati-
cally generated and is the first criterion for a total
RNA quality check. A new and more advanced
tool for RNA quality assessment is the RNA
Integrity Number (RIN, Agilent Technologies).
The algorithm assigns a RIN number score from 1
to 10, where level 10 represents a completely in-
tact RNA, and 1 presents a highly degraded RNA
(Mueller et al. 2000). An interpretation of an
RNA integrity is facilitated, comparison of sam-
ples is possible and repeatability of experiments is
ensured.
While it is obvious that intact RNA consti-
tutes the best representation of the natural state
of the transcriptome, there are situations in
which gene expression analysis even on partially
degraded RNA may be desirable, e.g. in ancient,
necrotic, clinical or biopsy samples. Yet, little is
known about the possibility of obtaining rea-
sonable qRT-PCR data from RNA samples with
impaired RNA quality. Until today there are no
statistically confirmed studies at which threshold
RNA integrity is useless for quantitative down-
stream applications. With that in mind, and with
the aim of anticipating future standards, we
identified and analyzed the effect of various
artificial and standardized degraded RNA sam-
ples on the two most abundant relative quanti-
fication models: the delta-delta Ct (Livak and
Schnittgen 2001) and the efficiency corrected Ct
model (Pfaffl 2001). The procedure of normal-
izations with an internal reference mRNA stan-
dard can reveal the importance of a relative
expression approach to exclude compounded
errors by variation in RNA quality and quantity.
A further aim of the study was to investigate
whether a correlation exists between PCR per-
formance, PCR efficiency, length of amplified
product and quality of RNA.
1602 Biotechnol Lett (2006) 28:1601–1613
123
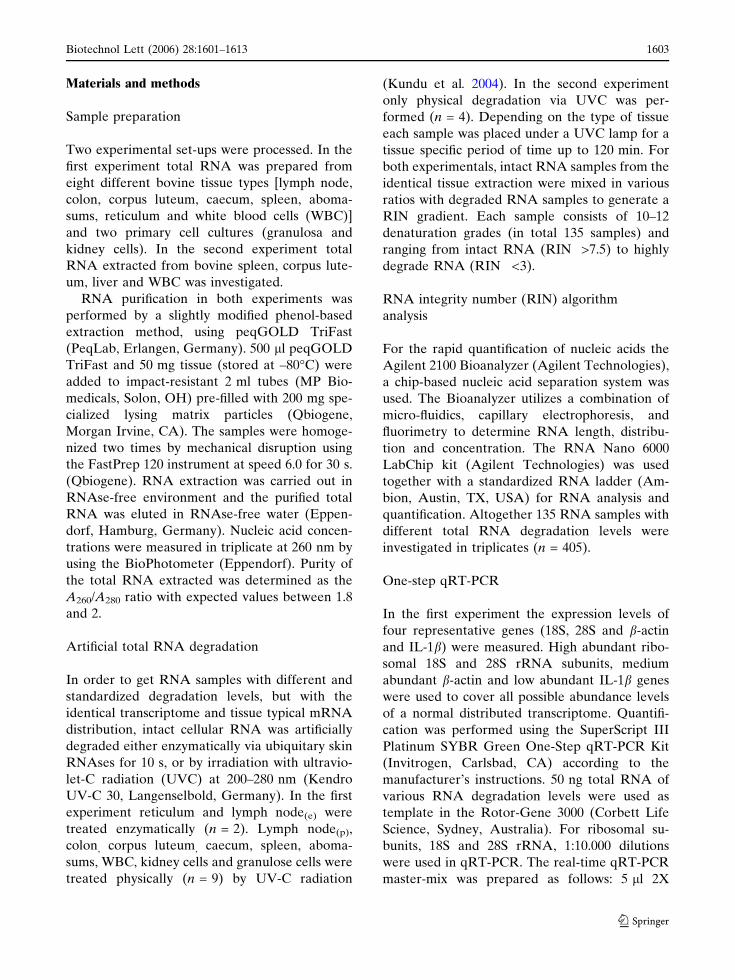
Materials and methods
Sample preparation
Two experimental set-ups were processed. In the
first experiment total RNA was prepared from
eight different bovine tissue types [lymph node,
colon, corpus luteum, caecum, spleen, aboma-
sums, reticulum and white blood cells (WBC)]
and two primary cell cultures (granulosa and
kidney cells). In the second experiment total
RNA extracted from bovine spleen, corpus lute-
um, liver and WBC was investigated.
RNA purification in both experiments was
performed by a slightly modified phenol-based
extraction method, using peqGOLD TriFast
(PeqLab, Erlangen, Germany). 500 ll peqGOLD
TriFast and 50 mg tissue (stored at –80�C) were
added to impact-resistant 2 ml tubes (MP Bio-
medicals, Solon, OH) pre-filled with 200 mg spe-
cialized lysing matrix particles (Qbiogene,
Morgan Irvine, CA). The samples were homoge-
nized two times by mechanical disruption using
the FastPrep 120 instrument at speed 6.0 for 30 s.
(Qbiogene). RNA extraction was carried out in
RNAse-free environment and the purified total
RNA was eluted in RNAse-free water (Eppen-
dorf, Hamburg, Germany). Nucleic acid concen-
trations were measured in triplicate at 260 nm by
using the BioPhotometer (Eppendorf). Purity of
the total RNA extracted was determined as the
A260/A280 ratio with expected values between 1.8
and 2.
Artificial total RNA degradation
In order to get RNA samples with different and
standardized degradation levels, but with the
identical transcriptome and tissue typical mRNA
distribution, intact cellular RNA was artificially
degraded either enzymatically via ubiquitary skin
RNAses for 10 s, or by irradiation with ultravio-
let-C radiation (UVC) at 200–280 nm (Kendro
UV-C 30, Langenselbold, Germany). In the first
experiment reticulum and lymph node(e) were
treated enzymatically (n = 2). Lymph node(p),
colon, corpus luteum, caecum, spleen, aboma-
sums, WBC, kidney cells and granulose cells were
treated physically (n = 9) by UV-C radiation
(Kundu et al. 2004). In the second experiment
only physical degradation via UVC was per-
formed (n = 4). Depending on the type of tissue
each sample was placed under a UVC lamp for a
tissue specific period of time up to 120 min. For
both experimentals, intact RNA samples from the
identical tissue extraction were mixed in various
ratios with degraded RNA samples to generate a
RIN gradient. Each sample consists of 10–12
denaturation grades (in total 135 samples) and
ranging from intact RNA (RIN >7.5) to highly
degrade RNA (RIN <3).
RNA integrity number (RIN) algorithm
analysis
For the rapid quantification of nucleic acids the
Agilent 2100 Bioanalyzer (Agilent Technologies),
a chip-based nucleic acid separation system was
used. The Bioanalyzer utilizes a combination of
micro-fluidics, capillary electrophoresis, and
fluorimetry to determine RNA length, distribu-
tion and concentration. The RNA Nano 6000
LabChip kit (Agilent Technologies) was used
together with a standardized RNA ladder (Am-
bion, Austin, TX, USA) for RNA analysis and
quantification. Altogether 135 RNA samples with
different total RNA degradation levels were
investigated in triplicates (n = 405).
One-step qRT-PCR
In the first experiment the expression levels of
four representative genes (18S, 28S and b-actin
and IL-1b) were measured. High abundant ribo-
somal 18S and 28S rRNA subunits, medium
abundant b-actin and low abundant IL-1b genes
were used to cover all possible abundance levels
of a normal distributed transcriptome. Quantifi-
cation was performed using the SuperScript III
Platinum SYBR Green One-Step qRT-PCR Kit
(Invitrogen, Carlsbad, CA) according to the
manufacturer’s instructions. 50 ng total RNA of
various RNA degradation levels were used as
template in the Rotor-Gene 3000 (Corbett Life
Science, Sydney, Australia). For ribosomal su-
bunits, 18S and 28S rRNA, 1:10.000 dilutions
were used in qRT-PCR. The real-time qRT-PCR
master-mix was prepared as follows: 5 ll 2X
Biotechnol Lett (2006) 28:1601–1613 1603
123

SYBR Green Reaction Mix, 0.5 ll forward pri-
mer (10 pmol), 0.5 ll reverse primer (10 pmol)
and 0.2 ll SYBR Green One-Step Enzyme Mix
(Invitrogen).About 6.2 ll of master mix was filled
into a tube and a 3.8 ll volume of total RNA was
added as PCR template. Bovine sequence-specific
primers were synthesized commercially (MWG
Biotech, Ebersberg, Germany) as shown in
Table 1. A four-step experimental run protocol
was used: (1) reverse transcription (10 min at
50�C); (2) denaturation program (5 min at 95�C);
amplification and quantification program
repeated 40 times (15 s at 95�C; 30 s at 60�C with
a single fluorescence measurement; 20 s at 68�C);
(3) melting curve program (60–99�C with a heat-
ing rate of 0.5�C/s and a continuous measure-
ment); (4) cooling program down to 40�C.
Cycle threshold (Ct) and amplification
efficiency
Ct values and qPCR efficiency were computed
with the ‘‘comparative quantitation’’ method in
the real-time qPCR Analysis Software, version
6.0 (Corbett Life Science). The Ct value is defined
as the point at which the fluorescence rises above
the background fluorescence (Pfaffl et al. 2002).
Relative quantification
The Ct of three target genes (18S, b-actin and
IL-1b) was normalized to the chosen reference
gene Ct of 28S rRNA. In the first relative
quantification approach no efficiency correction
was performed according to the delta-delta
Ct model (Livak and Schnittgen 2001) shown in
Eqs. 1 and 2.
R ¼ 2�½DCt sample�DCt control�; ð1Þ
R ¼ 2�DDCt: ð2Þ
In the second approach the efficiency correction
was implemented additionally (Eqs. 3, 4) and the
advantages of an efficiency corrected quantifica-
tion model were applied (Pfaffl 2001). The de-
rived ratio values describe the relative expression
change of the target gene relative to the 28S ref-
erence gene expression:
Table 1 Description ofused primers
Gene Primers Length[bp]
Annealingtemperature [�C]
Study 118S rRNA for: GAG AAA CGG CtA CCA CAT CCA 338 60
rev: GAC ACt CAG CtA AGA GCA TCG A28S rRNA for: TAA CAA GCC GGT AGC CCA CG 238 60
rev: GCA AGG GCt CtT GAT GGC AGAb-actin for: AAC TCC ATC ATG AAG TGT GAC G 202 60
rev: GAT CCA CAT CtG CtG GAA GGIL-1b for: TTC TCt CCA GCC AAC CtT CAT T 198 60
rev: ATC TGC AGC TGG ATG TTT CCA TStudy 2b-actin 50 for: ATC CtG CGT CtG GAC CtG 66 60
rev: ACG CtC CGT GAG GAT CtT Cb-actin 100 for: GAG CGA GGC TAC AGC TTC A 99 60
rev: CAT CtC CtG CtC GAA GTC CAb-actin 200 for: GGC ATC GTG ATG GAC TCC 201 60
rev: GAG CtT CtC CtT GAT GTC ACGb-actin 400 for: TCt ACA ACG AGC TCC GTG TG 380 60
rev: GAG CtT CtC CtT GAT GTC ACGb-actin 600 for: GGC ATC GTG ATG GAC TCC 616 60
rev: TCt GCt GGA AGG TGG ACA Gb-actin 800 for: TCt ACA ACG AGC TCC GTG TG 795 60
rev: TCt GCt GGA AGG TGG ACA Gb-actin 950 for: GTC TTC CCG TCC ATC GTG 976 60
rev: TCt GCt GGA AGG TGG ACA G
1604 Biotechnol Lett (2006) 28:1601–1613
123

R ¼ ðEtargetÞDCt target ðcontrol�sampleÞ
ðErefÞDCt ref ðcontrol�sampleÞ ; ð3Þ
R ¼ ðErefÞCt sample
ðEtargetÞCt sample� ðErefÞCt control
ðEtargetÞCt control: ð4Þ
PCR product length
In the second experiment sample RNA was di-
luted to a final concentration of 20 ng/ll. Seven
PCR primer sets were designed using HUSAR
software and synthesized by MWG Biotech
(Ebersberg) to amplify different sequence frag-
ments of b-actin (Table 1). Primer characteristics
like primer dimer, self binding or false binding
ability were minimized. GC content and PCR
annealing temperature of all primer sets were
adjusted and optimized to constant values. The
one-step qRT-PCR was performed and expres-
sion levels of b-actin were measured with the
standardized protocol as described above. Some
minor changes were introduced in the time of
denaturation depending on product length. For
the product length of 800 and 950 bp attuned to
20 s. Elongation time at 68�C was slightly chan-
ged and adapted to different product lengths: 10 s
for 50 bp, 20 s for 100 and 200 bp, 30 s for 400 bp,
60 s for 800 and 950 bp. In order to prevent inter-
assay variation, samples with the same primer set
were always amplified within one run. To ensure
that PCR products from qRT-PCR had the ex-
pected size, an agarose gel electrophoresis was
performed (gel not shown).
Statistical interference
All statistical analyses were performed by using
Sigma Stat 3.0 (SPSS Inc., Chicago, IL). The
determined P-values of the statistical significance
were analyzed using linear regression and coeffi-
cient of determination (R2). Significance of linear
regression was tested by Student’s t-test, by test-
ing the slope to be different from zero. Coeffi-
cients were recorded when significant at
P < 0.05. Higher significance levels were con-
sidered when available. All data were plotted in
Sigma-Plot 8.0 (SPSS) and Microsoft Excel
(Microsoft, Redmond, WA).
Results
RNA quality assessment and RNA
degradation levels
Isolated total RNA quality was verified by an
average A260/A280 ratio of 1.88 (range 1.75–2.01).
An A260/A280 ratio greater than 1.8 is usually
considered an acceptable indicator of good RNA
(Sambrook et al. 1989). No phenolic contamina-
tion or background absorption was reported via
the A260/A230 ratio. All 135 artificial total RNA
degradation gradient samples, were measured in
triplicates in the Bioanalyzer 2100, and ranged
from integer to degraded quality levels: RIN 7.3–
9.5 for integer down to RIN 1.1–3.0 for degraded
RNA (total measurements n = 405). Further-
more, the dependency of the RNA quality on
tissue type, WBC and cell-lines was determined.
The average RIN for solid tissues ranged between
5.4 and 9.6, whereas tissues or organs with high
content of connecting tissue, for example in the
gastrointestinal tract, showed higher variations in
RIN values. In cell culture and WBC the RIN
ranged between 8.4 and 9.6 with low experimental
variance (Fleige and Pfaffl 2006).
Confirmation of primer specificity
The expression levels of four genes (18S, 28S, b-
actin and IL-1b) were measured in all RNA quality
aliquots. For each analyzed gene a melting curve
analysis was performed. All investigated qRT-
PCR products showed only single peaks and no
primer-dimer peaks or artifacts. The specificity of
qRT-PCR products was documented with high
resolution gel electrophoresis and resulted in a
single product with the desired length (not shown).
Gene expression profiling versus RNA
integrity
To determine how qRT-PCR is affected by the
integrity of the starting RNA, we compared Ct
Biotechnol Lett (2006) 28:1601–1613 1605
123

levels or single-run PCR efficiency with the RNA
integrity (Tables 2 and 3). Therefore, RIN num-
bers were linearly regressed with Ct or efficiency
values. Each amplified gene was tissue specifically
influenced by the RNA integrity, reflected by the
level of significance (P-value) and the Pearson
correlation coefficient (R2) in the applied linear
regressions. This demonstrates an incomprehen-
sible tissue-matrix-effect between RNA integrity
and type of tissue and the analyzed transcript
(cited the lymph-node as an example in Fig. 1).
The expression data demonstrates that a high-
quality, intact RNA will result in a high expres-
sion level (low Ct) and a less-quality RNA results
in low expression level (high Ct). The mean
coefficient of determination in all regressed genes
and tissues (R2 > 0.812) shows that there is a
causally determined high correlation
between RIN and the Ct (n = 53). The deter-
mined P-values provide a statistical significance,
in almost all datasets of P < 0.001.
28S/18S rRNA ratio
In a further sub-study all 28S/18S ratios were
compared with the RIN. No clear trend of RNA
quality compared to 28S/18S ratios could be found,
therefore the 28S/18S ratio data are not presented.
Real-time PCR amplification efficiencies
Our research into RNA integrity effect on the
single-run qRT-PCR efficiency has been carried
out similarly to the above mentioned tissues and
artificial RNA qualities. The efficiency variations
for the lymph node were diagrammed in Fig. 2.
Each analyzed tissue turned out to have significant
tissue specific qPCR amplification efficiencies.
Table 2 Correlation between RNA integrity and gene expression
18S rRNA 28S rRNA b-actin IL-1b
R2 P R2 P R2 P R2 P
UV degradationLymph node(p) 0.911 < 0.001 0.946 < 0.001 0.812 < 0.001 0.903 < 0.001
y = –0.633x + 17.38 y = –0.492x + 15.38 y = –0.794x + 15.06 y = –0.674x + 24.68Colon 0.541 < 0.001 0.911 < 0.001 0.72 < 0.001 0.725 < 0.001
y = –0.873x + 26.16 y = –0.337x + 14.21 y = –0.604x + 15.57 y = –0.847x + 24.65Corpus luteum 0.832 < 0.001 0.948 < 0.001 0.912 < 0.001 0.885 < 0.001
y = –1.568x + 26.83 y = –0.489x + 16.45 y = –0.801x + 15.47 y = –0.907x + 27.95Caecum 0.743 < 0.001 0.842 < 0.001 0.965 < 0.001 0.947 < 0.001
y = –0.614x + 18.91 y = –0.589x + 16.45 y = –0.901x + 16.99 y = –0.608x + 23.07Spleen 0.606 < 0.001 0.686 < 0.001 0.673 < 0.001 0.894 < 0.001
y = –1.544x + 25.39 y = –0.413x + 14.74 y = –0.704x + 15.79 y = –0.591x + 21.48Abomasum 0.752 < 0.001 0.876 < 0.001 0.776 < 0.001 0.868 < 0.001
y = –1.251x + 22.18 y = –0.745x + 16.35 y = –1.199x + 20.69 y = –0.740x + 29.78WBC n.a. n.a. 0.534 < 0.05 0.746 < 0.001 0.799 < 0.001
n.a. y = –0.243x + 27.49 y = –0.923x + 21.61 y = –0.751x + 27.25Kidney cells 0.907 < 0.001 0.581 0.002 0.833 < 0.001 0.901 < 0.001
y = –0.346x + 26.88 y = –0.191x + 13.624 y = –1.617x + 22.04 y = –0.959x + 29.42Granulosa cells 0.182 < 0.001 0.248 < 0.001 0.776 < 0.001 0.868 < 0.001
y = –0.114x + 13.22 y = –0.104x + 25.67 y = –1.199x + 20.69 y = –0.740x + 29.78Enzymatic degradationReticulum 0.28 < 0.001 0.352 < 0.001 0.803 < 0.001 0.717 < 0.001
y = –0.518x + 22.53 y = –0.284x + 13.44 y = –0.582x + 13.26 y = –0.133x + 21.97Lymph node(e) 0.579 < 0.001 0.265 < 0.01 0.594 < 0.001 0.842 < 0.001
y = –0.231x + 14.37 y = –0.038x + 12.05 y = –0.092x + 8.96 y = –0.088x + 19.59
Impact of RNA integrity (shown as RIN = x) on cycle threshold (Ct shown as Ct = y). Data are representing as linearregression, coefficient of determination (R2) and the P-values of regression. Four different genes (18S, 28S, b-actin and IL–1b), were analyzed in 11 tissues, sorted by various type of degradation, either UV degradation (n = 9) or enzymaticdegradation (n = 2)
1606 Biotechnol Lett (2006) 28:1601–1613
123
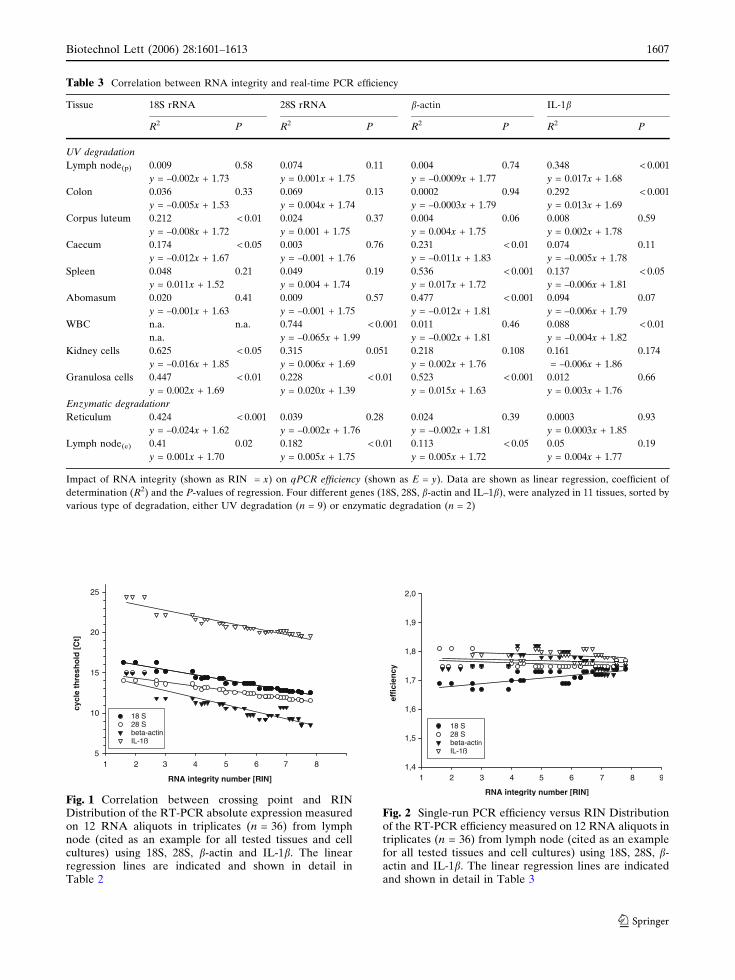
Table 3 Correlation between RNA integrity and real-time PCR efficiency
Tissue 18S rRNA 28S rRNA b-actin IL-1b
R2 P R2 P R2 P R2 P
UV degradation
Lymph node(p) 0.009 0.58 0.074 0.11 0.004 0.74 0.348 < 0.001
y = –0.002x + 1.73 y = 0.001x + 1.75 y = –0.0009x + 1.77 y = 0.017x + 1.68
Colon 0.036 0.33 0.069 0.13 0.0002 0.94 0.292 < 0.001
y = –0.005x + 1.53 y = 0.004x + 1.74 y = –0.0003x + 1.79 y = 0.013x + 1.69
Corpus luteum 0.212 < 0.01 0.024 0.37 0.004 0.06 0.008 0.59
y = –0.008x + 1.72 y = 0.001 + 1.75 y = 0.004x + 1.75 y = 0.002x + 1.78
Caecum 0.174 < 0.05 0.003 0.76 0.231 < 0.01 0.074 0.11
y = –0.012x + 1.67 y = –0.001 + 1.76 y = –0.011x + 1.83 y = –0.005x + 1.78
Spleen 0.048 0.21 0.049 0.19 0.536 < 0.001 0.137 < 0.05
y = 0.011x + 1.52 y = 0.004 + 1.74 y = 0.017x + 1.72 y = –0.006x + 1.81
Abomasum 0.020 0.41 0.009 0.57 0.477 < 0.001 0.094 0.07
y = –0.001x + 1.63 y = –0.001 + 1.75 y = –0.012x + 1.81 y = –0.006x + 1.79
WBC n.a. n.a. 0.744 < 0.001 0.011 0.46 0.088 < 0.01
n.a. y = –0.065x + 1.99 y = –0.002x + 1.81 y = –0.004x + 1.82
Kidney cells 0.625 < 0.05 0.315 0.051 0.218 0.108 0.161 0.174
y = –0.016x + 1.85 y = 0.006x + 1.69 y = 0.002x + 1.76 = –0.006x + 1.86
Granulosa cells 0.447 < 0.01 0.228 < 0.01 0.523 < 0.001 0.012 0.66
y = 0.002x + 1.69 y = 0.020x + 1.39 y = 0.015x + 1.63 y = 0.003x + 1.76
Enzymatic degradationr
Reticulum 0.424 < 0.001 0.039 0.28 0.024 0.39 0.0003 0.93
y = –0.024x + 1.62 y = –0.002x + 1.76 y = –0.002x + 1.81 y = 0.0003x + 1.85
Lymph node(e) 0.41 0.02 0.182 < 0.01 0.113 < 0.05 0.05 0.19
y = 0.001x + 1.70 y = 0.005x + 1.75 y = 0.005x + 1.72 y = 0.004x + 1.77
Impact of RNA integrity (shown as RIN = x) on qPCR efficiency (shown as E = y). Data are shown as linear regression, coefficient of
determination (R2) and the P-values of regression. Four different genes (18S, 28S, b-actin and IL–1b), were analyzed in 11 tissues, sorted by
various type of degradation, either UV degradation (n = 9) or enzymatic degradation (n = 2)
RNA integrity number [RIN]
1 2 3 4 5 6 7 8
cycl
e th
resh
old
[C
t]
5
10
15
20
25
18 S28 Sbeta-actinIL-1ß
Fig. 1 Correlation between crossing point and RINDistribution of the RT-PCR absolute expression measuredon 12 RNA aliquots in triplicates (n = 36) from lymphnode (cited as an example for all tested tissues and cellcultures) using 18S, 28S, b-actin and IL-1b. The linearregression lines are indicated and shown in detail inTable 2
RNA integrity number [RIN]
1 2 3 4 5 6 7 8 9
effi
cien
cy
1,4
1,5
1,6
1,7
1,8
1,9
2,0
18 S28 Sbeta-actinIL-1ß
Fig. 2 Single-run PCR efficiency versus RIN Distributionof the RT-PCR efficiency measured on 12 RNA aliquots intriplicates (n = 36) from lymph node (cited as an examplefor all tested tissues and cell cultures) using 18S, 28S, b-actin and IL-1b. The linear regression lines are indicatedand shown in detail in Table 3
Biotechnol Lett (2006) 28:1601–1613 1607
123

Some tissues had higher amplification efficiencies
with increasing RNA integrity, shown as positive
coefficient of regression. Looking over all ana-
lyzed genes and tissues (Table 3) the RIN effect
on qPCR efficiency was minor, compared to the
influence on Ct (Table 2). The data demonstrates
that amplification efficiency is highly dependent
on the incomprehensible tissue-matrix-effect
(represented by the intercept of the regression
equation) and only minor affected by the RNA
integrity itself (represented by the slope of linear
regression). However, the coefficient of regression
of the amplification efficiency data showed sig-
nificance for some tissues and genes.
Effect of normalization
To test the effect of normalization by an internal
reference gene, expression results of 18S, b-actin
and IL-1b were normalized to the reference gene
28S rRNA. 28S rRNA was chosen as an optimal
reference gene, because it showed the lowest
variations during the performed RNA degrada-
tion study. 28S rRNA expression too, showed the
lowest slope in the Ct and efficiency analysis
(Tables 2 and 3). The relative quantification
alteration in expression of the target gene relative
to the reference gene was performed in two ways:
first according to the delta-delta Ct method (Li-
vak and Schmittgen 2001), and second by the
single-run-specific efficiency-corrected relative
expression model (Pfaffl 2001, LightCycler Rela-
tive Quantification Software, Version 1.0). For
both models the RIN values were regressed ver-
sus the relative expression ratios. In the first
model an optimal amplification efficiency of two
(E = 2) was assumed. For nearly all genes and
tissues we could show a significant effect on rel-
ative expression level depending on the RNA
quality (Table 4). In the advanced calculation
Table 4 Correlation between RNA integrity and delta-delta Ct model
Tissue 18S rRNA b-actin IL–1ß
R2 P R2 P R2 P
UV degradationLymph node(p) 0.764 < 0.001 0.465 < 0.001 0.666 < 0.001
y = 0.071x + 0.03 y = 0.803x + 0.20 y = 0.001x + 0.01Colon 0.226 < 0.001 0.412 < 0.001 0.841 < 0.001
y = 0.002x – 0.01 y = 0.161x + 0.28 y = 0.001x – 0.01Corpus luteum 0.766 < 0.001 0.770 < 0.001 0.768 < 0.001
y = 0.064x – 0.16 y = 1.128x + 2.38 y = 0.001x + 0.01Caecum 0.263 < 0.001 0.698 < 0.001 0.214 < 0.001
y = 0.024x + 0.05 y = 0.541x – 1.130 y = 0.003x + 0.01Spleen 0.307 < 0.001 0.564 < 0.001 0.706 < 0.001
y = 0.068x – 0.20 y = 0.241x + 0.34 y = 0.003x + 0.01Abomasum 0.388 < 0.001 0.624 < 0.001 0.0005 < 0.001
y = 0.029x – 0.01 y = 0.048x + 0.057 y = –0.0002x + 0.000WBC n.a. n.a. 0.759 < 0.001 0.777 < 0.001
n.a. y = 560.16x – 1580 y = 3.795x – 9.47Kidney cells 0.741 < 0.001 0.640 < 0.001 0.718 < 0.001
y = 0.0002x + 0.000 y = 1.205x – 0.84 y = 0.0002x – 0.000Granulosa cells 0.707 < 0.001 0.383 < 0.001 0.399 < 0.001
y = 0.035x – 0.13 y = 1.212x – 0.09 y = 0.001x – 0.000Enzymatic degradationReticulum 0.026 0.25 0.703 < 0.001 0.198 < 0.001
y = – 0.005x + 0.09 y = 0.566x + 0.71 y = –0.001x + 0.01Lymph node(e) 0.398 < 0.001 0.327 < 0.001 0.399 < 0.001
y = 0.056x + 0.13 y = 0.394x + 0.35 y = 0.001x + 0.01
Impact of RNA integrity (shown as RIN = x) on relative expression ratio, calculated according the equation delta-delta Ctmodel 2^Ct(RG)-Ct(TG) (shown as y value). Data are shown as linear regression (n = 36), coefficient of determination (R2)and the P-values of regression. Three efficiency-corrected relative expression ratios are shown (18S, b-actin and IL-1b) and28S rRNA was used as reference gene. Expression ratios were analyzed in 11 tissues, sorted by various type of degradation,either UV degradation (n = 9) or enzymatic degradation (n = 2)
1608 Biotechnol Lett (2006) 28:1601–1613
123

model, according to the efficiency corrected
model regressed data are shown in Table 5. Sig-
nificant, positive correlations (mostly P < 0.001)
and regression coefficients between the RNA
integrity and the relative expression of the
quantified target genes were determined in the
sample-specific efficiency-corrected relative
quantification (shown as E(RG)^Ct(RG)/
E(TG)^Ct(TG) values). To proof the feasibility of
this model a intact RNA at RIN value 8
(E(RG)^Ct(RG)/E(TG)^Ct(TG) = 4.65, defined as
sample) and a degraded RNA at RIN value 2
(E(RG)^Ct(RG)/E(TG)^Ct(TG) = 1.16, defined as
control) were compared for the b-actin mRNA
expression (Fig. 3). The defined sample contained
fourfold more b-actin molecules than the control,
meaning around 75% b-actin mRNA was de-
graded.
Effect of length of the amplified product
To test the influence of PCR product length, a
gradient with several steps of intact RNA down to
degraded RNA was examined with seven primer
sets, amplifying qRT-PCR products of various
lengths up to 976 bp. To amplify the sequence of
b-actin in different tissues and varying RNA
integrity levels, seven primer sets were used. In
Fig. 4 it is clearly visible for all product length
that the crossing point is shifted towards lower
cycle numbers using intact total RNA. The best
repeatability could be attained in quadrant IV
with a RIN value higher than five (even better
over eight), and a qRT-PCR product length lower
than 200 bp. These results could be confirmed for
all analyzed tissues and genes. Quadrant I and III
showed low RNA quality having RIN lower than
Table 5 Correlation between RNA integrity and efficiency-corrected relative expression ratio
Tissue 18S rRNA b-actin IL-1b
R2 P R2 P R2 P
UV degradationLymph node(p) 0.129 < 0.05 0.543 < 0.001 0.311 < 0.001
y = 0.042x + 0.45 y = 0.581x + 0.001 y = 0.0008x + 0.01Colon 0.209 < 0.01 0.193 < 0.01 0.157 < 0.05
y = 0.053x + 0.000 y = 0.153x + 0.18 y = 0.002x + 0.004Corpus luteum 0.659 < 0.001 0.476 < 0.001 0.027 0.34
y = 0.105x + 0.04 y = 0.397x + 2.30 y = 0.0003x + 0.004Caecum 0.289 < 0.001 0.606 < 0.001 0.215 < 0.05
y = 0.164x + 0.17 y = 0.345x + 0.000 y = 0.003x + 0.008Spleen 0.603 < 0.001 0.110 < 0.05 0.538 < 0.001
y = 0.155x + 0.000 y = 0.104x + 0.59 y = 0.009x + 0.01Abomasum 0.333 < 0.001 0.677 < 0.001 0.137 < 0.05
y = 0.082x + 0.19 y = 0.073x + 0.02 y = 0.0001x + 0.00WBC n.a. n.a. 0.006 0.76 0.031 0.47
n.a. y = 0.946x + 45.71 y = 0.445x + 1.06Kidney cells 0.642 < 0.001 0.565 < 0.001 0.567 < 0.001
y = 0.0003x + 0.01 y = 0.664x + 0.001 y = 0.0001x + 0.001Granulosa cells 0.078 0.22 0.432 = 0.001 0.323 < 0.01
y = 0.082x + 0.38 y = 0.566x + 0.35 y = 0.002x + 0.003Enzymatic degradationReticulum 0.208 < 0.01 0.613 < 0.001 0.153 < 0.05
y = 0.047x + 0.15 y = 0.288x + 0.62 y = –0.0004x + 0.01Lymph node(e) 0.299 < 0.001 0.195 < 0.01 0.032 0.29
y = 0.089x + 0.33 y = 0.324x + 6.25 y = 0.0004x + 0.01
Impact of RNA integrity (shown as RIN = x) on efficiency-corrected relative expression ratio, calculated according theequation E(RG)^Ct(RG)/E(TG)^Ct(TG) (shown as y value). Data are shown as linear regression (n = 36), coefficient ofdetermination (R2) and the P-values of regression. Three efficiency-corrected relative expression ratios are shown (18S,b-actin and IL-1b) and 28S rRNA was used as reference gene. Expression ratios were analyzed in 11 tissues, sorted byvarious type of degradation, either UV degradation (n = 9) or enzymatic degradation (n = 2)
Biotechnol Lett (2006) 28:1601–1613 1609
123

five and high variability in qRT-PCR results. In
quadrant II high quality RNA was used, but high
amplicon size resulted in late and highly variable
Ct, and consequently in inefficient reaction with
low PCR efficiency (no figure shown). High Ct
values for 800 and 950 bp may result from inef-
ficient amplification as from too long qRT-PCR
products and the applied stringent cycle condi-
tions.
Discussion
Intact RNA is essential for many molecular
biotechnology techniques used in gene expres-
sion studies. It is universally accepted that RNA
purity and integrity are of foremost importance
to ensure reliability and reproducibility of qRT-
PCR. Despite this valid assumption, there has
been minor experimental and statistical proven
data to verify this assertion. Spectrophotometer
analysis of RNA in particular has been widely
accepted as an important quality assurance
measures for RT-PCR and microarray experi-
ments (Baelde et al. 2001). The spectrophotom-
eter abnortancy measurement has long been
used as a criterion for assessing contamination of
RNA samples throughout the development of
molecular biology. The A260/A280 and A260/A230
ratios reflect RNA purity but are not informative
regarding the integrity of the RNA (Mueller
et al. 2000). A260/A280 ratios higher than 1.8 are
indicative of limited protein contaminations,
whereas low A260/A230 ratios are indicative of
residual contamination by organic compounds
such as phenol, sugars or alcohol, which could be
highly detrimental to downstream applications
(Sambrook et al. 1989). Today micro-fluidic
capillary electrophoresis are more and more
used for RNA quality and quantity assessments,
particularly in the gene expression profiling
platforms (Mueller et al. 2000; Lightfood 2002).
From the shape of the electropherogram and the
dominant ribosomal RNA subunits peaks, the
software automatically generates the 28S/18S
rRNA ratio and in newer software versions as
well the RIN value (Mueller 2004; Schroeder
et al. 2006). The RNA degradation is a gradual
process and this is shown in a decrease of the
ribosomal 28S/18S rRNA ratio and an increasing
base-line signal between the two ribosomal
peaks and the 5S rRNA peak. The 28S/18S ratio
is calculated automatically, but it may not be
used as a gold standard for assessing RNA
integrity because of its high variability (CV 19–
24%) (Imbeaud et al. 2005; Fleige and Pfaffl
2006; Schroeder et al. 2006). Our dataset could
confirm this finding in 11 analyzed tissues
showing a high 28S/18S ratio variations (CV
32 ± 18%; n = 405). No significant correlation
RNA integrity number [RIN]
1 2 3 4 5 6 7 8 9
EC
t (R
G) /
EC
t (T
G)
0,001
0,01
0,1
1
10
IL-1ß beta-actin18 S
Fig. 3 Single-run efficiency-corrected relative expressionratio E(RG)^
Ct(RG)/E(TG)^Ct(TG) ratio versus RIN Distri-
bution measured on 12 RNA aliquots in triplicates(n = 36) from lymph node (cited as an example for alltested tissues and cell cultures) using 28S as referencegene. The linear regression lines are indicated and shownin detail in Table 4
10
15
20
25
30
1 2 3 4 5 76 8 9RNA integrity number [RIN]
cycl
e th
resh
old
[C
t] 50 bp100 bp200 bp400 bp800 bp950 bp
IV
I
III
II
Fig. 4 Relationship between RNA integrity and length ofthe amplified product Integrity of 23 bovine corpus luteumRNA sample (cited as an example for all tested tissues)profiles was scored using the RIN software. Cyclethreshold (Ct) values in dependence on amplicon lengthand RNA integrity (RIN). Comparative analysis was doneusing b-actin with different length of the amplifiedproduct. Graph is divided in four quadrants (I–IV)
1610 Biotechnol Lett (2006) 28:1601–1613
123
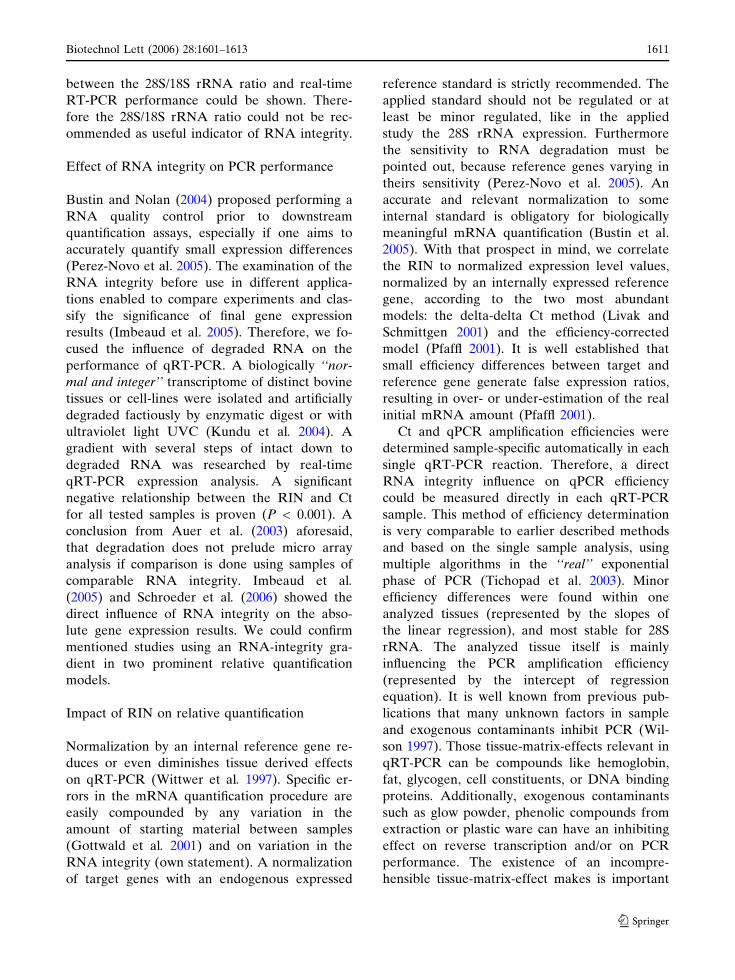
between the 28S/18S rRNA ratio and real-time
RT-PCR performance could be shown. There-
fore the 28S/18S rRNA ratio could not be rec-
ommended as useful indicator of RNA integrity.
Effect of RNA integrity on PCR performance
Bustin and Nolan (2004) proposed performing a
RNA quality control prior to downstream
quantification assays, especially if one aims to
accurately quantify small expression differences
(Perez-Novo et al. 2005). The examination of the
RNA integrity before use in different applica-
tions enabled to compare experiments and clas-
sify the significance of final gene expression
results (Imbeaud et al. 2005). Therefore, we fo-
cused the influence of degraded RNA on the
performance of qRT-PCR. A biologically ‘‘nor-
mal and integer’’ transcriptome of distinct bovine
tissues or cell-lines were isolated and artificially
degraded factiously by enzymatic digest or with
ultraviolet light UVC (Kundu et al. 2004). A
gradient with several steps of intact down to
degraded RNA was researched by real-time
qRT-PCR expression analysis. A significant
negative relationship between the RIN and Ct
for all tested samples is proven (P < 0.001). A
conclusion from Auer et al. (2003) aforesaid,
that degradation does not prelude micro array
analysis if comparison is done using samples of
comparable RNA integrity. Imbeaud et al.
(2005) and Schroeder et al. (2006) showed the
direct influence of RNA integrity on the abso-
lute gene expression results. We could confirm
mentioned studies using an RNA-integrity gra-
dient in two prominent relative quantification
models.
Impact of RIN on relative quantification
Normalization by an internal reference gene re-
duces or even diminishes tissue derived effects
on qRT-PCR (Wittwer et al. 1997). Specific er-
rors in the mRNA quantification procedure are
easily compounded by any variation in the
amount of starting material between samples
(Gottwald et al. 2001) and on variation in the
RNA integrity (own statement). A normalization
of target genes with an endogenous expressed
reference standard is strictly recommended. The
applied standard should not be regulated or at
least be minor regulated, like in the applied
study the 28S rRNA expression. Furthermore
the sensitivity to RNA degradation must be
pointed out, because reference genes varying in
theirs sensitivity (Perez-Novo et al. 2005). An
accurate and relevant normalization to some
internal standard is obligatory for biologically
meaningful mRNA quantification (Bustin et al.
2005). With that prospect in mind, we correlate
the RIN to normalized expression level values,
normalized by an internally expressed reference
gene, according to the two most abundant
models: the delta-delta Ct method (Livak and
Schmittgen 2001) and the efficiency-corrected
model (Pfaffl 2001). It is well established that
small efficiency differences between target and
reference gene generate false expression ratios,
resulting in over- or under-estimation of the real
initial mRNA amount (Pfaffl 2001).
Ct and qPCR amplification efficiencies were
determined sample-specific automatically in each
single qRT-PCR reaction. Therefore, a direct
RNA integrity influence on qPCR efficiency
could be measured directly in each qRT-PCR
sample. This method of efficiency determination
is very comparable to earlier described methods
and based on the single sample analysis, using
multiple algorithms in the ‘‘real’’ exponential
phase of PCR (Tichopad et al. 2003). Minor
efficiency differences were found within one
analyzed tissues (represented by the slopes of
the linear regression), and most stable for 28S
rRNA. The analyzed tissue itself is mainly
influencing the PCR amplification efficiency
(represented by the intercept of regression
equation). It is well known from previous pub-
lications that many unknown factors in sample
and exogenous contaminants inhibit PCR (Wil-
son 1997). Those tissue-matrix-effects relevant in
qRT-PCR can be compounds like hemoglobin,
fat, glycogen, cell constituents, or DNA binding
proteins. Additionally, exogenous contaminants
such as glow powder, phenolic compounds from
extraction or plastic ware can have an inhibiting
effect on reverse transcription and/or on PCR
performance. The existence of an incompre-
hensible tissue-matrix-effect makes is important
Biotechnol Lett (2006) 28:1601–1613 1611
123

to determine the qPCR efficiency tissue-by-tis-
sue and run-by-run, and correct for it according
to established models (Pfaffl et al. 2002, Light-
Cycler Relative Quantification Software,
Version 1.0).
Normalization of expression data by an inter-
nal reference gene on the basis of varying RNA
integrities, showed to be strong RIN dependent.
Herein the single-run specific efficiency was
added to the model, as shown in Eqs. 3 and 4, to
result in an efficiency-corrected relative quantifi-
cation model. To visualize the results, as shown
after normalization, fourfold more b-actin mRNA
could be found comparing highly intact to de-
graded RNA. Statements about importance of
normalization and efficiency correction as speci-
fied above could certify herewith. Results dem-
onstrate that innovative new quantification
methods and normalization models can improve
mRNA quantification.
Interrelation between RIN and length
of amplified product
Furthermore, the length of the amplified prod-
uct influences PCR efficiency such as primer
length, annealing temperature, and secondary
structure (Bustin and Nolan 2004; Perez-Novo
et al. 2005). Quantitative RT-PCR involves
analysis of smaller mRNA regions and is
therefore more tolerant of partially degraded
RNA. However, RNA integrity control is often
not systematically performed prior to qRT-PCR
analyses (Perez-Novo et al. 2005). An interest-
ing question is, if there is an increasing influ-
ence on the PCR performance with both
variables (RNA quality and length of amplified
product). Fragmentation of long mRNA will
result in a loss of the molecule for qPCR
detection only if the RNA break occurs within
the product sequence. This might be a rare
event in only moderately degraded RNA
(Schoor et al. 2003). Therefore, the sequence of
b-actin was assessed in different tissues and by
varying RNA integrity. The results of correla-
tion between RIN and Ct fulfilled the expecta-
tion for all tested tissues, where Ct value is
shifted to lower cycle number with increasing
RIN for all product lengths. Similarly low
quality RNA pointed a high variability in qRT-
PCR expression results. We subdivided the
graph in four quadrants, which show the best
repeatability in quadrant IV with high RNA
integrity (RIN > 5) and product length up to
200 bp. The length of the amplified product is a
very important part for primer design. Late and
highly variable Ct (quadrant II) is also be due
to amplified product length over 400 bp and
good RNA quality. Maximum amplicon size
should not exceed 400 bp (ideally 80–150
bases). Smaller amplicon give more consistent
results because PCR is more efficient and more
tolerant of reaction conditions. The research
into the relationship between RNA integrity
and length of the amplified product onto PCR
efficiency show no correlation. With regard to
the efficiency of the PCR, those can affect by a
number of variables like length of the amplicon,
RNA secondary structure and primer quality
(Bustin and Nolan 2004; Wong and Medrano
2005).
Conclusion
Our data suggest that RNA quality control prior
to qRT-PCR assays is indispensable. Tissue
sampling, RNA extraction and storage are very
sensitive to RNA integrity and should be
designed to keep RNA pure and intact. Total
RNA samples of high quality (RIN > 8) can
serve as an optimal template whereas for partly
degraded RNA (8 > RIN > 5) result in sub-
optimal qRT-PCR expression results. Degraded
RNA interferes with PCR performance as such,
expressed as Ct value, whereas PCR efficiency is
minor effected by RNA integrity. PCR efficiency
seems to be major affected by the tissue type and
extraction procedure.
The delta-delta Ct and the efficiency corrected
model are both sensitive to RNA integrity.
Statements about importance of normalization
could be confirmed by our investigations, con-
sequently we commended an efficiency-corrected
relative quantification strategy and normalization
with an internally reference gene for every
quantitative mRNA expression analyses. In view
of the observed difference in gene expression
1612 Biotechnol Lett (2006) 28:1601–1613
123

stability between intact and degraded RNA
sample, we and other authors (Bustin and Nolan
2004; Auer et al. 2003) propose performing
RNA quality control prior to downstream
quantification assays. We can recommend a RIN
value higher than five and a PCR product length
up to 200 bp as a minimal requirement for a
successful and reliable real-time RT-PCR quan-
tification.
References
Auer H, Lyianarachchi S, Newsom D, Klisovic MI, Mar-cucci G, Kornacker K, Marcucci U (2003) Chippingaway at the chip bias: RNA degradation in microarrayanalysis. Nature Genet 35:292–293
Baelde HJ, Cleton-Jansen AM, van Beerendock H,Namba (2001) High quality RNA isolation from tu-mors with low cellularity and high extracellular matrixcomponent for cDNA microarrays. Application tochondrosarcoma. J Clin Pathol 54:778–782
Bustin SA, Nolan T (2004) Pitfalls of Quantitative Real-Time Reverse-Transcription Polymerase ChainReaction. J Biomol Tech 15:155–166
Bustin SA, Benes V, Nolan T, Pfaffl MW (2005) Quanti-tative real-time RT-PCR—a perspective. J MolEndocrinol 34:597–601
Fleige S, Pfaffl MW (2006) RNA integrity and the effecton the real-time qRT-CR performance. Mol Asp Med27(2–3):126–139
Gottwald E, Muller O, Polten A (2001) Semiquantitativereverse transcription-polymerase chain reaction withthe Agilent 2100 Bioanalyzer. Electrophoresis22:4016–4022
Imbeaud S, Graudens E, Boulanger V, Barlet X, ZaborskiP, Eveno E, Mueller O, Schroeder A, Auffray C(2005) Toward standardization of RNA qualityassessment using user-independent classifiers of mi-crocapillary. Electrophoresis traces. Nucleic AcidsRes 33(6):e56
Kundu LM, Linne U, Marahiel M, Carell T (2004) RNA ismore UV resistant than DNA: the formation of UV-induced DNA lesions is strongly sequence and con-formation dependent. Chemistry 10(22):5697–5705
Lightfood S (2002) Quantitation comparison of total RNAusing the Agilent 2100 bioanalyzer, ribogreen analysisand UV spectrometry. Agilent Technologies, Tech-nical Rep 5988-7650EN
Livak KJ, Schmittgen TD (2001) Analysis of relative geneexpression data using real-time quantitative PCR andthe 2[-Delta Delta C(t)] method. Methods 25:402–408
Mueller O, Hahnenberger K, Dittmann M, Yee H, Du-brow R, Nagle R, Ilsley D (2000) A microfluidic sys-tem for high-speed reproducible DNA sizing andquantitation. Electrophoresis 21:128–134
Mueller O, Lightfoot S, Schroeder A (2004) RNA Integ-rity Number (RIN)—Standardization of RNA QualityControl. Agilent Technologies, Technical Report5989-1165EN
Perez-Novo CA, Claeys C, Speleman F, Cauwenberge PV,Bachert C, Vandesompele J (2005) Impact of RNAquality on reference gene expression stability. Bio-techniques 39:52–56
Pfaffl MW (2001) A new mathematical model for relativequantification in real-time RT-PCR. Nucleic AcidsRes 29(9):e45
Pfaffl MW, Horgan GW, Dempfle L (2002) Relativeexpression software tool (REST�) for group-wisecomparison and statistical analysis of relative expres-sion results in real-time PCR. Nucleic Acids Res30(9):e36
Raeymarkers L (1993) Quantitative PCR: theoreticalconsideration with practical implication. Anal Bio-chem 214:582–585
Sambrook J, Fritsch EF, Maniatis T (1989) Molecularcloning. A laboratory manual, (2nd edn.), Cold SpringHarbor Laboratory Press, NY
Schoor O, Weinschenk T, Hennenlotter J, Corvin S,Stenzl A, Rammensee HG, Stevanovic S (2003)Moderate degradation does not preclude microarrayanalysis of small amounts of RNA. Biotechniques35:1192–1201
Schroeder A, Mueller O, Stocker S, Salowsky R, Leiber M,Gassman M, Lightfoot S, Menzel W, Granzow M,Ragg T (2006) The RIN: an RNA integrity numberfor assigning integrity values to RNA measurements.BMC Mol Biol 7:3
Tichopad A, Dilger M, Schwarz G, Pfaffl MW (2003)Standardized determination of real-time PCR effi-ciency from a single reaction setup. Nucleic Acids Res31(20):e122
Wilson IG (1997) Inhibition and facilitation of nucleicacid amplification. Appl Environ Microbiol 63:3741–3751
Wittwer Ct, Herrmann MG, Moss AA, Rasmussen RP(1997) Continuous fluorescence monitoring of rapidcycle DNA amplification. Biotechniques 22:130–131
Wong ML, Medrano JF (2005) Real-time PCR for mRNAquantitation. Biotechniques 39:75–85
Biotechnol Lett (2006) 28:1601–1613 1613
123

Appendix
Appendix III:
Fleige S, Preißinger W., Meyer HHD, Pfaffl MW (2007):
Effect of lactulose on growth performance and intestinal morphology of pre-ruminant
calves using a milk replacer containing Enterococcus faecium.
Animal 1: 367-373.

Effect of lactulose on growth performance and intestinalmorphology of pre-ruminant calves using a milk replacercontaining Enterococcus faecium
S. Fleige1, W. Preißinger2, H. H. D. Meyer1 and M. W. Pfaffl1
1Institute of Physiology, Centre of Life and Food Sciences (ZIEL), Technical University of Munich, 85354 Freising, Germany; 2Institut fur Tierernahrung undFutterwirtschaft, Bayerische Landesanstalt fur Landwirtschaft (LfL), 85586 Poing-Grub, Germany
†Present address: Weihenstephaner Berg 3, 85354 Freising Germany. E-mail: [email protected]
(Received 16 May 2006; Accepted 13 November 2006)
The synthetic disaccharide lactulose is known to improve the intestinal microflora by stimulating the growth of selected probioticbacteria in the gut. In our experiment the effects of lactulose in combination with the probiotic bacteria Enterococcus faecium ongrowth performance and morphology of the bovine intestine were examined. Calves aged 39 ^ 2 days were randomised to threefeeding groups (no. ¼ 14 each group): control (L0), fed milk replacer (MR) containing E. faecium; a lactulose group (L1) containadditional 1% lactulose and a second lactulose group (L3) containing 3% lactulose dry matter. The calves were weighed weekly.After 19 weeks the calves were slaughtered and tissues were ollected for histological studies. The average daily live weight gaintended to be higher (P , 0.1) for L3 (1350 g/day) than L0 (1288 g/day). Compared with L0, a reduction (P , 0.001) of ileal villusheight due to lactulose treatment of approximately 14% in group L1 and 20% in L3 was determined. A significant decrease in thedepth of the crypts about 12% in L1 and 8% in L3 was detected in the caecum. The surface area of lymph follicles from Peyer’spatches was decreased by lactulose treatment. Results show that lactulose has an effect on the morphology of intestine.A significant effect on growth performance can not be confirmed. However, results permit the conclusion that lactulose feedinghas the tendency to increase growth performance.
Keywords: calves, growth, lactulose, probiotics, villi.
Introduction
A growing area of research is the functional effect ofprobiotics and prebiotics (Hughes and Rowland, 2001).Probiotics are well defined strains of micro-organismswhich beneficially affect the host by improving its intestinalmicrobial balance (Bezkorovainy, 2001). Increased levels ofprobiotics in the intestine may be achieved by consumptionof dietary substrates (i.e. prebiotics) that are known tostimulate probiotic growth (Mosenthin and Zimmermann,2000). It has been suggested that a combination of pro-and prebiotics, the so-called synbiotics, might be moreactive than the individual components (Roberfroid, 1998).The knowledge that the normal intestinal flora has aprotective function against infection provides the basis forthe use of probiotics and prebiotics (Gorbach, 2000;McNaught and MacFie, 2001). The application of this knowhow in veterinary medicine and its versatile use plays anincreasingly important role (Vanbelle et al., 1990), in
particular when the protective potential of the microbialgut flora is reduced, for example during stress. The vitalityand the well being of the animals can be improved anddigestive problems and losses caused by nutrition reduced.Prebiotics and probiotics can improve feed conversion anddaily weight gain (Krueger et al., 2002; Busch et al., 2004).Various factors like the early separation from their mother,dietary changes or transportation and the contact with amultiplicity of infectious agents could cause the highincidence of intestinal disease in calves. Hence, animalsconsume less milk (Loerch and Fluharty, 1999), are predis-posed to loss of barrier function of the gut (Nabuurs et al.,2001; Soderholm and Perdue, 2001), and may be afflictedwith impaired immune function (Sheridan et al., 1994).
Numerous scientists investigated the health-promotingeffect of prebiotics like indigestible sugars, e.g. fructo-oligosaccharides (FOS), inulin and lactulose (Gibson et al.,1995; Kleesen et al., 2001). The positive effects of lactulose
Animal, Page 1 of 7 Q The Animal Consortium 2007doi: 10.1017/S1751731107661850
animal
1
ANM 6-0089—17:15, 15/12/2006——266185

on colonic metabolism in human, rat, mouse, and pig arewell known (Bianchi et al., 1997; Ballongue et al., 1997). Incalves, the effect of lactulose on the intestinal morphologyis not investigated in detail. The semisynthetic disaccharidelactulose is chemically well characterised and does notoccur naturally. Lactulose cannot be digested by mamma-lian enzymes because of its specific structure (4-ß-D-galac-topyranosyl-D-fructose). It is poorly absorbed from the smallintestine and is a suitable substrate for some bacteria inthe gut, especially in the colon (Schumann, 2002). In vitroinvestigations demonstrated that lactulose is readily fer-mented by Bifidobacteria and Lactobacilli, but also by Clos-tridium perfringens, Escherichia coli and Bacteroides sp.(Smart et al., 1993). These bacteria counteract detrimentalspecies such as Clostridia or Salmonellae (Schumann, 2002)which are, like other pathogenic bacteria, not able todigested lactulose (Johnson, 2001).
The objective of this investigation is to determinethe influence and effect of a long-term daily lactuloseapplication on the growth performance and the intestinalmorphology in growing calves. In addition the influence oftwo different lactulose concentrations has been investi-gated. Thus, we have performed histomorphometricalmeasurements from the small and large intestine to moni-tor effects on the morphology of the gastro-intestinal tract(GIT) in pre-ruminant calves.
Material and methods
Animals, husbandry, feeding and experimental proceduresSimmental calves were bred at various farms and directlybought from the Simmental breeding organisation(Zuchtverband fur oberbayerisches Alpenfleckvieh e.V.) inMiesbach, Germany. The calves were single-born andimmediately separated from their mothers after birth.Calves received post-partum colostrum for 1 week directlyfrom their mother cows, as recommended by the breedingorganisation. Afterwards until start of the experimentalfeeding trial, the calves were fed with milk replacer (MR).The 42 calves were divided in three homogenous exper-imental groups (no. ¼ 14 per group, each 50% male and50% female) with balanced weight (74.4 (s.e. 2.1) kg) andage (39.0 ^ 2.5 days), whereas the females were slightlyheavier than males. Animals were housed at the exper-imental station Karolinenfeld (Bayerische Landesanstalt furLandwirtschaft - LfL, Institut fur Tierernahrung und Futter-wirtschaft) in two segmented pens, half on straw and halfon solid floor.
During the feeding experiment, all calves were fedwith MR from Milkibeef Top (Milkivit, Trouw Nutrition,Burgheim, Germany) with following composition: 50.2%skimmed milk, 22.5% crude protein (CP), 19.5% crude fatand 109 colony forming units (c.f.u.) Enterococcus faeciumper kg. All calves had free group access to fresh water and0.5 kg hay per day. Feeding group L0 served as control. Theother two groups were fed with MR enriched by 1% (L1)
and 3% (L3) dry matter (DM) lactulose (Lactusat, MileiGmbH, Germany). Contents of Lactusat are shown inTable 1, as stated by the manufacturer (Milei). In order toassure the accuracy of the lactulose concentration in thefeeding groups L1 and L3 the MR was mixed with 2.5% Lac-tusat for group L1 and 7.5% Lactusat for group L3 wasexchanged against whey powder to guarantee a balancedfeeding regimens (Table 2). DM, crude ash, crude fat, starch,CP and calculated metabolisable energy were formulated tobe similar across treatments. Calves of all feeding groupsreceived MR in volumes up to 17.5 l/day in the experimentalperiod of 19 weeks (with corresponding amount of lactulosefor L1 and L3), controlled by transponder automatic feeder(Forster Technik, Engen, Germany). The MR was reconsti-tuted in hot water (658C) and fed at a temperature ofapproximately 418C. The starting MR concentration at thebeginning of the study was 125 g/l (week 1), with a continu-ous and linear increase up to 250 g/l at the end of the study(week 19). Calves were weighed every week after feeding,before killing and also the empty body weight wasmeasured. After the dosing period of 133.6 ^ 8.3 days, ani-mals were slaughtered. The last feeding before slaughteringand tissue sampling was 4 ^ 1 h.
Health statusThe general health status of the calves was monitored bydaily physical examination, checking general appearance,animal activity, faeces composition, and time to time rectaltemperature. Animals were further inspected by a veteri-narian on a weekly basis to confirm identical healthy statusof the feeding groups. The experimental proceduresfollowed the current German law on animal productionand veterinary inspection (LfL, Grub, Germany).
Histology and histomorphometry of intestinal mucosaAfter slaughtering the GIT was removed and tissue slicesof 5 to 7 mm from the small intestine (middle parts ofjejunum and ileum) and large intestine (mid caecum, midcolon) were collected. Immediately after collection, thetissue-samples were washed in physiological 0.9% NaClsolution and placed in neutral buffered 10% formalin (CarlRoth GmbH, Karlsruhe, Germany) for 24 h. The specimen
Table 1 Ingredients of Lactusat (Milei GmbH, Germany)
Ingredients % Ingredients mg per 100 g
Water 4 Calcium 200Protein 30 Potassium 250Ash 1.0 Sodium 150Fat ,5 Magnesium 30Lactulose 42 Phosphorus 130Galactose 3 Chloride 50Lactose 7 pH 6.4Epilactose 2Fructose ,1Tagatose ,1
Fleige, Preißinger, Meyer and Pfaffl
2
ANM 6-0089—17:15, 15/12/2006——266185

were later trimmed and embedded in paraffin. Thinsections (7 to 8mm) were cut using the Microtom LEICARM2145 (Leica, Wetzlar, Germany), mounted on glassslides, and stained with haematoxylin and eosin (HE)according to Mayer (1969) and covered with Euktit (Merck,Q1
Darmstadt, Germany).Histological sections were examined with the light
microscope Axioskop 2 plus (Zeiss, Oberkochen, Germany)with 10 £ /0.30 Plan-Neofluar objective connected to thevideo-based, computer-linked AxioVision 3.1 system thatwas programmed to perform morphometrical analysis(Blattler et al., 2001). Only for the measurement of thelymph follicle the Stemi 2000-C (Zeiss) was used with the£ 2.5 objective. Pictures were taken with the AxioCamMRc (Zeiss). The applied objective was changed depend onthe examined tissue.
Villus height, crypts depth and for both the width wereevaluated on three well orientated villi- and crypt-preparations for each intestinal sampling site. Triplicatemeasurements for every category (height, depth, width) andsection (jejunum, ileum, caecum, colon) were evaluated.Figure 1 illustrates the measurements that were made.Furthermore, the area of at least six lymph follicle in Peyer’spatches in the ileum (no. ¼ 84 per group) were evaluated.For confirming the uninjured mucosa integrity of the collectedsamples, the following qualitative criteria were controlled:villus fusion, villus atrophy, crypt architectural disruption,disruption or distortion of epithel cells and lymph follicles.
Statistical analysisAll measurement values are expressed as mean ^ s.e. Forgroup differences, villus heights and width, villus height/width ratios, crypt depths and width and surface of thelymph follicle of Peyer’s patches were analysed with theprogram of Statistical Packages for the Social Sciences(2003) using two-way ANOVA. In order to find out whetherlactulose has different sex-specific effects the pairwisemultiple comparison procedures were processed with theHolm-Sidak method. The significance level was set at 0.05for all tests.
Results
All calves stayed healthy and no animal losses were regis-tered during the feeding experiment. No medication wasapplied to the animals during the 19 weeks.
Feed intake and body weightThe average daily MR intake (Table 3) was significanthigher in feeding group L3 (P , 0.05). An increased intakeof CP and energy for group L3 was achieved, due to thefeeding of lactulose. Male calves showed a similar averagedaily MR intake between treatment groups, though thefemale calves of group L1 (P , 0.05) showed a lower aver-age daily MR intake (P , 0.05). Growth performance ispresented in detail in Table 4. A positive trend on growth
Table 2 Raw nutrient and energy content of diets (the energy content of the milk replacer was estimated by the feeding programme Zifo(LfL, 2005))
L0 n ¼ 3 L1 n ¼ 3 L3 n ¼ 3 Pooled s.e. Hay
Dry matter (DM, g/kg) 964 ^ 5 963 ^ 6 963 ^ 6 6 854Raw ash (g/kg DM) 70 ^ 2 70 ^ 3 68 ^ 2 2 52Crude protein (g/kg DM) 219 ^ 4 224 ^ 1 234 ^ 5 5 124Crude fat (g/kg DM) 197 ^ 2 197 ^ 2 196 ^ 1 1 16Crude fibre (g/kg DM) 0 ^ 0 0 ^ 0 0 ^ 0 0 311Metabolisable energy (MJ/kg DM) 16.8 ^ 0 16.8 ^ 0 16.9 ^ 0 0 9.5
2
3
1
b
a
3
cd
2
1
Figure 1 Morphological measurements in the intestine: (1) lamina muscularis mucosae; (2) crypt of Lieberkuhn; (3) villus. Measurements in the small andlarge intestine were combined pictured in the diagram. Small intestine: (a) villus height (from the tip of the villus to the lamina muscularis mucusae; (b)villus width (distance from villi-junction to the next – perpendicular to the height). Large intestine: (c) depth of crypt (from the tip to the lamina muscu-laris mucusae – in the large intestine villi is inexistent; (d) width of crypt (perpendicularly to the depth).
Lactulose for pre-ruminant calves
3
ANM 6-0089—17:15, 15/12/2006——266185

performance could be determined in group L3. Increasingdose of lactulose tended (P , 0.1) to increase averagedaily gain (ADG), especially for male calves. Feed efficiencywas highly variable between the animals and not affectedby the lactulose treatment.
Villus height and weight in the small intestine and cryptsdepths and widths in the large intestineVillus height and width in the jejunum were unchanged infeeding groups (Table 5). However, in the ileum a reductionof villus height with increasing lactulose treatment(P , 0.001) was detected, with no change in villus width.In the control group, villus height and width between jeju-num and ileum were not significantly different, but in bothlactulose groups the villus height was significant lower inileum than in jejunum (L1: P , 0.01; L3: P , 0.001). Thevillus width in the jejunum was decreased because of the1% lactulose treatment (P , 0.05).
In both treatment groups L1 and L3 the caecal cryptdepth was lower (P , 0.001) than in the control group.The lactulose treatment effect in L1 group was greaterthan in L3 (P , 0.05). In all groups the crypt depth wassignificant lower in the colon than in the caecum. Therewere no treatment effects on crypt width in the caecum,crypt depth and width in the colon and number of lym-phatic follicle in the ileum (not shown).
Sex differences in intestinal morphologyIn the ileum, the female calves in all feeding groups exhib-ited higher villus lengths than male calves, but only ingroup L3 was this difference significant (P , 0.05). Amongall animals the caecum crypt depth was different betweensexes (P , 0.01). In all groups the female calves showedlower crypt depths than the male calves. In the treatmentgroups (L1 and L3) the crypt depths of female calves werelower (P , 0.001). Among male animals only male calves
of group L1 showed significantly lower crypt depth. Thecrypt width was lower in female calves of group L3(P , 0.05). Results of the pairwise multiple comparisonprocedures are not shown.
Histomorphometry of follicles of Peyer’s patches in ileumThe surface area of lymph follicles from Peyer’s patcheswas decreased by lactulose treatment (Table 5). In thelactulose groups the ileum lymph follicles were smallerthan in the control group (L1: P , 0.05; L3: P , 0.01).On closer examination, a significant difference betweensexes was apparent (P , 0.001). The surface area offemale calves in group L0 (P , 0.05) and L1 (P , 0.001)was larger than in male calves and lower in group L3(P , 0.01). Within the female group the surface areas oflymph follicle in Peyer’s patches were smaller in feedinggroup L3 than in group L0 and L1 whereas the surfacearea of male calves in feeding group L1 were smaller thanin group L0 and L3 (P , 0.01).
Table 3 Average daily food and nutritient intake
Experimental group Significance of group differences
Intake† L0 L1 L3 Pooled s.e. L0 v. L1 L0 v. L3 L1 v. L3
MR intakeMR (g DM) 2080 2019 2199 45 * **
male 1958 1934 2133 73female 2201 2104 2264 26 * **
Energy (MJ ME) 35 34 37 1 * **Crude protein (g) 455 452 514 10 *** ***Ether extract (g) 410 398 433 9 * **
Total intakeHay (g DM) 205 207 211Total food (kg DM) 2.3 2.2 2.4Energy (MJ ME) 37 36 39Crude protein (g) 477 475 545Crude fibre (g) 68 69 70Ether extract (g) 409 398 437
† The milk replacer (MR) intake data show the mean values ^ s.e. For the total intake, no s.e or significance values could be calculated because hay was offered toentire feeding groups (means are different between treatment groups as shown).
Table 4 Mortality and adjusted means ^ s.e. of body-weight (BW)gain and feed efficiency of calves fed with milk replacer containingE. faecium (L0) or added with lactulose (L1 and L3)(means are not different (P . 0.05) between treatment groups)
Treatment groups‡
Variable† L0 L1 L3 Pooled s.e.
No of calves 14 14 14 0Mortality 0 0 0 0Initial BW (kg) 74 74 74 2Final BW (kg) 244 245 255 6ADG: weeks 1–19 (g/day) 1288 1276 1350 59FE 0.59 0.61 0.59 0.07
† ADG ¼ average daily gain; FE ¼ feed efficiency, expressed as ADG (g/day)/milk replacer intake (g/day).‡ Only group difference L1 v. L3 approached significance for ADG (P , 0.1).
Fleige, Preißinger, Meyer and Pfaffl
4
ANM 6-0089—17:15, 15/12/2006——266185

Discussion
Growth performanceResearch on probiotics for cattle has increased in recentyears and usually has shown a beneficial effect on thehost. In the last 10 years, diverse effects, but not alwaysstatistically significant, have been found for feed intake,weight gain, decreased scouring, decreased faecal coliformcount and reduced demand for antibiotic treatment (Fuller,2005). Thus, in all experimental groups, we used a MRcontaining the probiotic bacteria E. faecium to achieve apossible improvement of health. The effect of lactulose asa prebiotic in animal nutrition was reported in studies withpigs (Kien et al., 1999; Krueger et al., 2002) and calves(Schroedl et al., 2003; Landwirtschaftskammer WestfalenLippe and Universitat Leipzig, 2003). However, the effectof lactulose on pre-ruminant calves has not been investi-gated in detail.
In this study, ADG tended to be higher for L3 than L1and was numerically higher for L3 than L0. Intake of MRwas increased in group L3, so that average daily CP intakewas about 13% higher for L3 than L0. This could representa direct effect of lactulose on gut morphology or an indir-ect effect of 3% lactulose inclusion on sweetness. Quigleyet al. (2006) reported that increasing the content of CP inMR increases ADG and efficiency of gain. Other trials in
pigs observed no additional benefits from the use of lactu-lose (Krueger et al., 2002). This is understandable since theinitial status of the microbial colonisation of the intestinecan differ widely between studies. Furthermore, the extentto which the well being and the performance are improvedor maintained also depends on other factors, especially thecomposition of the diet, the sanitary conditions and theperformance level (North Carolina Cooperative Extension,2005). An accurate and reliable prediction of the lactuloseefficacy in calves is not possible at this time.
GIT histologyAs seen in previous studies, within the small intestine villusheights were the greatest in the jejunum (Blattler et al.,2001), possibly due to enhanced differentiation from cryptcells to villus epithelial cells. This gut segment is thoughtto play a major role in absorption of the digestionproducts, because the intestinal surface is expected to bepositively associated with absorptive capacity (Ganapathyet al., 1994). Based on histomorphological analyses, ourstudy indicates that the feeding of lactulose decreasedthe villus sizes only in ileum. These results disagree withthose obtained by Pelicano et al. (2005), who found nodifferences in the ileal villus height with the use of prebio-tics in broiler chickens. The continual reduction of the villusheight in the ileum could be explained by a decreasing cell
Table 5 Mean values for villus areas and heights and crypts depths in jejunum and ileum, size of lymph follicle area in Peyer’s patches (ileum)and crypt depths in colon and caecum in calves fed milk replacer (MR) (L0), MR þ 1% lactulose per MR (L1) and MR þ 3% lactulose per MR(means are different between treatment groups as shown)
Experimental group Significance of group differences
Trait L0 L1 L3 Pooled s.e. L0 v. L1 L0 v. L3 L1 v. L3
JejunumNo. 42 36 41Villus width (mm) 148 142 148 5Villus height (mm) 920 884 979 26 ‡ ‡ ‡
Villus height/width ratio† 6.3 6.2 6.9 0.3Ileum
No. 38 42 42Villus width (mm) 157 160 156 5Villus height (mm) 896 770 727 24 *** ***Villus height/width ratio† 5.7 4.9 4.7 0.3 *
Peyer’s patches (lymph follicle)No. 83 84 84 **Area (mm2) 363 318 303 14 * ** ***Male 334 251 330 11 **Female 391 385 277 11 ***
CaecumNo. 42 42 42 *Crypts depth (mm) 586 515 542 10 *** ***Crypts width (mm) 30 30 29 1.5
ColonNo. 42 42 41Crypts depth (mm) 507 478 496 12Crypts width (mm) 29 28 27 1.5
† Values are means n ¼ 14 per group.‡ Approaching significance (P , 0.1).
Lactulose for pre-ruminant calves
5
ANM 6-0089—17:15, 15/12/2006——266185

proliferation or/and an increasing apoptosis caused by thefeeding of lactulose. Apoptosis is especially relevant in theGIT because it is an important process responsible formaintenance of the cellular balance between proliferationand death and crucial for normal morphology and function(Hall et al., 1994). Prebiotics are proven to increaseapoptosis in the intestine in order to exert a protectiveeffect in carcinogenesis (Hughes and Rowland, 2001).Especially lactulose is said to reduce cell proliferation aftersupplementation for some days (Kien et al., 1999). Thesynbiotic application of pro- and prebiotica could amplifythis effect by reducing the number of aberrant crypts (Kienet al., 2004). Although a higher lactulose concentration inthe ileum than in the jejunum might be a reason for theeffect on villus heights only in the ileum. In a study withpigs from Kamphues et al. (2003) and Branner et al. (2004)Q2
higher lactulose concentrations were measured at theend of the small intestine than in the jejunum. Lactuloseconcentration in chyme of calves deserves further study.
The decreasing crypt depth in the caecum due to lactu-lose-supplementation could also be explained by thealready mentioned effect of prebiotics to decrease prolif-erative activity and to increase apoptotic rates. The pro-duction of short-chain fatty acids, like butyrate alongwith acetate and propionate, in the lumen of the hindgutby bacterial fermentation of lactulose was identified inprevious work as a reason for this morphological effect(Mandal et al., 2001). A number of different studies (andexperimental paradigms) reported lower colonic cell pro-liferation by increased synthesis of butyric acid (Kien et al.,1999; Klien et al., 2006). In the large intestine this couldpossibly lead to a shortening of the crypts as was found inour study. In contrast to previous finding, Nilsson andNyman (2005) and Fernandes et al. (2000) reported thatlactulose yielded high proportions of acetic acid and lowproportions of butyric acid. In further work analyses of thebutyric acid concentration in the chyme should be con-ducted in calves.
Effect of lactulose on lymph follicles in Peyer’s patchesA significant influence of lactulose-supplementation wasshown on the gut-associated lymphoid tissue (GALT). In theGALT the Peyer’s patches are the main component andespecially present in the ileum part of the GIT (Norrmanet al., 2003). Ileal Peyer’s patches are a primary lymphoidorgan and play a major role in the development of B-cells(Norrman et al., 2003). In both treatment groups a smallersize of the lymph follicles was observed with sex-specificdifferences (L1: P , 0.05; L3: P , 0.01) suggesting lowerimmunological activity throughout the lactulose richfeeding. The lymph follicles of male calves were onlysignificantly affected in group L1. In contrast, only thefemale calves from group L3 with the highest lactulosefeeding showed a significant dependence. The lymphfollicle decreased significantly in the supplemented group(P , 0.01), which is explained by the stabilisation of theintestinal environment by the reduction of pathogen
bacteria which leads to a reduced activation of the immunesystem. In this way the necessity of the host’s immunesystem to react against harmful bacteria is decreasedand this could lead to a reduced surface of lymphaticfollicle in the intestine. Further analyses are necessary toconfirm this assertion about the effect of lactulose on thePeyer’s patches.
ConclusionThis study indicates that lactulose feeding in combinationwith E. faecium affects the morphology of the small andlarge intestine in pre-ruminant calves. GALT activation wasreduced via the Peyer’s patches in the ileum. Inclusion of1% lactulose did not affect growth performance, but ADGtended to increase when lactulose inclusion was 3%. Theeffects of lactulose are obviously sex-specific: male calvestended to have higher body weight and female calvestended to have more changes in intestinal morphology inresponse to lactulose. Further studies are required totest the interaction between lactulose and probiotics suchas E. faecium.
Acknowledgements
The research was supported by the H. Wilhelm Schaumann-Stiftung in Germany. Special thanks are due to the Landesun-tersuchungsamt (LUA, Oberschleißheim) in Germany for theirexcellent paraffin embedding and many thanks to Milei GmbHproviding the Lactusat, and Milkivit, Trouw Nutrition, locatedin Burgheim, Germany, for preparing the milk replacer.
References
Ballongue J, Schumann C and Quignon P 1997. Effects of lactulose andlactitol on colonic microflora and enzymatic activity. Scandinavian Journal ofGastroenterology 32, 41-44.
Bezkorovainy A 2001. Probiotics: determinants of survival and growth in thegut. American Journal of Clinical Nutrition 73, 399-405.
Bianchi G, Ronchi M and Marchedini G 1997. Effects of lactulose oncarbohydrate metabolism and diabetes mellitus. Scandinavian Journal of Gas-troenterology 32, 62-64.
Blattler U, Hammon JM, Morel C, Philipona C, Rauprich A, Rome V,Le Huerou-Luron I, Guilloteau P and Blum JW 2001. Feeding colostrum, itscomposition and feeding duration variably modify proliferation and mor-phology of the intestine and digestive enzyme activities of neonatal calves.Journal of Nutrition 131, 1256-1263.
Branner GR, Bohmer BM, Erhardt W, Henke J and Roth-Maier DA 2004. Inves-tigation on the precaecal and faecal digestibility of lactulose and inulin andtheir influence on nutrient digestibility and microbial characteristics. Archivesof Animal Nutrition 58, 353-366.
Busch A, Hermann HH, Kuhn I, Simon O, Struck J and Suphke E 2004.Probiotics in animal nutrition. Arbeitsgemeinschaft fur Wirkstoffe in derTierernahrung e.V. (AWT). (http://www.awt-feedadditives.de/fileadmin/awt/pdf/probiotics.pdf)
Fernandes J, Venketeshwer Rao A and Wolever TMS 2000. Different sub-strates and methane producing status affect short-chain fatty acid profilesproduced by in vitro fermentation of human feces. The Journal of Nutrition130, 1932-1936.
Fuller R 2005. Probiotics, the scientific basis. Chapman and Hall, London.
Ganapathy V, Brandsch M and Leibach FH 1994. Intestinal transport ofamino acids and peptides. In Physiology of the gastrointestinal tract, vol. 2(eds LR Johnson, DH Alpers, J Christensen, ED Jacobson and JH Walsch),pp. 1773-1794. Raven Press, New York.
Fleige, Preißinger, Meyer and Pfaffl
6
ANM 6-0089—17:15, 15/12/2006——266185

Gibson GR, Beatty ER, Wand X and Cumings JH 1995. Selective stimulation ofBifidobacteria in the human colon by oligofructose and inulin. Gastroenterol-ogy 108, 975-982.
Gorbach SL 2000. Probiotics and gastrointestinal health. American Journal ofGastroenterology 95, 2-4.
Hall PA, Coates PJ, Ansari B and Hopwood D 1994. Regulation of cell numberin the mammalian gastrointestinal tract: the importance of apoptosis. Journalof Cell Science 107, 3569-3577.
Hughes R and Rowland IR 2001. Stimulation of apoptosis by two prebioticchicory fructans in the rat colon. Carcinogenesis 22, 43-47.
Johnson S 2001. Clostridial constipation’s broad pathology. Medical Hypoth-eses 56, 532-536.
Johnson et al. 1994.Q3Q4
Kamphues J, Tabeling R and Stuke O 2003. [Possible interesting dieteticeffects of lactulose as a feed additive in pig feed.] Deutsche TierarztlicheWochenschrift 110, 365-368.
Kien CL, Chang JC, Cooper JR and Frankel WL 2004. Effects of prefeeding aprebiotic on diarrhea and colonic cell proliferation in piglets fed lactulose.Journal of Parenteral and Enteral Nutrition 28, 22-26.
Kien CL, Murray RD, Qualman SJ and Marcon M 1999. Lactulose feeding inpiglets: a model for persistent diarrhoea and colitis induced by severe sugarmalabsorption. Digestive Disease and Science 44, 1476-1484.
Kleesen B, Hartmann C and Blaut M 2001. Oligofructose and long-chaininulin: influence on the gut microbial ecology of rats associated with humanfaecal flora. British Journal of Nutrition 80, 1-11.
Klien CL, Schmitz-Brown M, Solley T, Sun D and Frankel WL 2006. Increasedcolonic luminal synthesis of butyric acid is associated with lowered coloniccell proliferation in piglets. Journal of Nutrition 136, 64-69.
Krueger M, Schroedl W, Isik K, Lange W and Hagemann L 2002. Effects oflactulose on the intestinal microflora of periparturient sows and their piglets.European Journal of Nutrition 41, 26-31.
Landwirtschaftskammer Westfalen Lippe and Universitat Leipzig 2003.[Lactulose – an method for resolution during gastro-intestinal disease inanimals for production.] Symposium, 29 January, Munster, Germany.
Loerch SC and Fluharty FL 1999. Physiological changes and digestive capabili-ties of newly received feedlot cattle. Journal of Animal Science 77, 1113-1119.
McNaught CE and MacFie J 2001. Probiotics in clinical practice: a criticalreview of the evidence. Nutrition Research 21, 343-353.
Mandal M, Olson DJ, Sharma T, Vadlamudi RK and Kumar R 2001. Butyricacid induces apoptosis by up-regulating Bax expression via stimulation of thec- Jun N-terminal kinase/activation protein-1 pathway in human colon cancercells. Gastroenterology 120, 71-78.
Mosenthin R and Zimmermann B 2000. Probiotics and prebiotics in pignutrition – alternatives for antibiotics? In Selected topics in animal nutrition.(ed ?????). pp. 29-50 Biochemistry and Physiology, University of Alberta,Edmonton, Alberta, Canada.Q5
Nabuurs MJ, Van Essen GJ, Nabuurs P, Niewold TA and Van der Meulen J2001. Thirty minutes transport causes small intestinal acidosis in pigs.Research in Veterinary Science 70, 123-127.
Nilsson U and Nyman M 2005. Short-chain fatty acid formation in the hindgutof rats fed oligosaccharides varying in monomeric composition, degree ofpolymerisation and solubility. British Journal of Nutrition 94, 705-713.
Norrman J, David CW, Sauter SN, Hammon HM and Blum JW 2003. Effects ofdexamethasone on lymphoid tissue in the gut and thymus of neonatal calvesfed with colostrum or milk replacer. Journal of Animal Science 81, 2322-2332.
North Carolina Cooperative Extension 2005. Searching for alternatives to anti-biotic growth promoters. North Carolina State University, USA.
Quigley J-D, Wolfe TA and Elsasser TH 2006. Effects of additional milk repla-cer feeding on calf health, growth, and selected blood metabolites in calves.Journal of Dairy Science 89, 207-216.
Pelicano ERL, Souza PA, Souza HBA, Figueiredo DF, Boiago MM, Carvalho SRand Bordan VF 2005. Intestinal mucosa development in broiler chickens fednatural growth promoters. Brazilian Journal of Poultry Science 7, 221-229.
Roberfroid MB 1998. Prebiotics and synbiotics: concept and nutritional proper-ties. British Journal of Nutrition 80, 197-202.
Schroedl W, Jaekel L and Krueger M 2003. C-reactive protein and antibacterialactivity in blood plasma of colostrom-fed calves and the effect of lactulose.Journal of Dairy Science 86, 3313-3320.
Schumann C 2002. Medical, nutritional and technological properties of lactu-lose. An update. European Journal of Nutrition 41, 117-125.
Sheridan JF, Dobbs C, Brown D and Zwilling B 1994. Psychoneuroimmunology:stress effects on pathogenesis and immunity during infection. Clinical Micro-biology Reviews 7, 200-212.
Smart JB, Pillidge CJ and Garman JH 1993. Growth of lactic acid bacteria andbifidobacteria on lactose and lactose-related mono-, di- and trisaccharidesand correlation with distribution of beta-galactosidase and phospho-beta-galactosidase. Journal of Dairy Research 60, 557-568.
Soderholm JD and Perdue MH 2001. Stress and the gastrointestinal tract II.Stress and intestinal barrier function. American Journal of Physiology. Gastro-intestinal and Liver Physiology 280, G7-G13.
Statistical Packages for the Social Sciences 2003. Sigma Stat 3.0. SPSS Inc.,Chicago, IL.
Vanbelle M, Teller E and Focant M 1990. Probiotics in animal nutrition: areview. Archiv fur Tierernahrung 40, 543-567.
Lactulose for pre-ruminant calves
7
ANM 6-0089—17:15, 15/12/2006——266185

Appendix
Appendix IV:
Fleige S, Preißinger W., Meyer HHD, Pfaffl MW (2007):
Lactulose: Effect on apoptotic- and immunological markers in the gastrointestinal
tract of pre-ruminant calves.
Veterinarni Medicina 52(10): 437-444.

Veterinarni Medicina, 52, 2007 (10): 437–444 Original Paper
437
Nutritional and disease problems in calves con-tinue to be an important part of dairy practice and are an important and increasing source of revenue for beef practitioners. In recent years there have been many advances in the prevention and treat-ment of calf problems. A large number of feed prod-ucts are available to prevent scours and promote gut health and animal growth rates. The actual benefits of these products are hard to quantify, but clearly they modify and protect the gut health in periods of stress and disease. The most common milk additives are probiotics, prebiotics, rennet, sodium bentonite, antibiotics, vitamins and miner-als (Schouten, 2005).
Prebiotics like lactulose containing fructose have been used in the diets of calves and pigs to im-prove intestinal health and to reduce the incidence of diseases (Flickinger et al., 2003; Patterson and
Burkholder, 2003). The prebiotic lactulose is a syn-thetic disaccharide which is neither absorbed nor suggested to be metabolized in the upper gastro-in-testinal tract (GIT) (Macfarlane et al., 2006). More recently, prebiotics have been proposed as a mean to manipulate the bacterial flora of the intestinal tract of animals to potentially reduce the incidence of diseases (Bohmer et al., 2005), and they have direct effects on immune responses (Macfarlane and Cummings, 1999; Pie et al., 2007). Physiological effects of not absorbable carbohydrates include in-creased fecal bulk, increased short chain fatty acids (SCFA) production, and modification of bacterial populations (Jenkins et al., 1999; Gibson et al., 2005; Tuohy et al., 2005). SCFA produced by intestinal bacteria and the colonic microbes affect mucosal and systemic immunity in the host (Hooper et al., 2002). Bacterial products with immunomodulato-
Lactulose: effect on apoptotic- and immunological-markers in the gastro-intestinal tract of pre-ruminant calves
S. Fleige1, W. Preißinger2, H.H.D. Meyer1, M.W. Pfaffl1
1Physiology Weihenstephan, Center of Life and Food Sciences, Technical University of Munich, Freising, Germany
2Institute of Animal Nutrition and Feed Management, Bavarian Regional Office for Agriculture, Poing-Grub, Germany
ABSTRACT: The study was conducted to elucidate the effects of orally administered lactulose in combination with Enterococcus faecium on immune response of the intestinal tract in pre-ruminant calves. The mRNA expression of pro- and anti-inflammatory cytokines and proliferation and apoptosis markers were investigated in jejunum, ileum, colon and caecum. Simmental calves were fed diets containing 1% (L1) or 3% (L3) lactulose and the probiotic strain of the genus E. faecium, and compared with a non treated control group. Primarily the high dose feeding with lactulose showed an effect on several mRNA gene expression parameters. In the jejunum a down-regulation of the anti-apoptotic marker Bcl-xl was determined and IL-10 mRNA gene expression was 2.6-fold up-regulated (P < 0.05). In the colon a 1.9-fold (P < 0.05) up-regulation of IL-10 and only in caecum an about 2-fold increase of TGF-β1 (P < 0.05) was found for both lactulose feedings. Caspase 3 was up-regulated in caecum only in the 3% lactulose treated group (P < 0.05). The enhanced apoptotic rate of caspase 3 seems to be associated with a decrease in crypth depth due to lactulose supplementation. The results indicated that mainly the high 3% lactulose dose in
probiotic-fed calves has an affect on the intestinal immune function and on diverse apoptotic markers.
Keywords: intestine; morphology; health

Original Paper Veterinarni Medicina, 52, 2007 (10): 437–444
438
ry properties include also endotoxic lipopolysac-charides, peptidoglycans, and lipoteichoic acids (Parvez et al., 2006). Whether prebiotics modulate
the immune response directly, by affecting the com-position of the intestinal flora and thus affecting the gastro-intestinal tract (Wilson et al., 1996), or indirectly by the fermentation to short chain fatty acids (SCFA), is presently unknown.
As well as modulating gut flora composition, prebiotics may exert cancer protective effects at the cellular level following SCFA formation. SCFA induce apoptosis in colon adenoma and cancer cell lines (Hague et al., 1994). In the colonic crypts, apoptosis maintains the balance in cell number be-tween newly generated and surviving cells and at the luminal surface where differentiated epithelial cell are exfoliated (Potten, 1992). Previous inves-tigations showed an effect of lactulose feeding on the morphology of the small and large intestine in pre-ruminant calves (Fleige et al., 2007). Based on histomorphological analyses, the study indicates that lactulose reduced the villus sizes in the ileum and decreased crypt depth in the caecum.
The aim of the present study was to determine the intestinal immune functions induced through a prebiotic treatment by lactulose in pre-ruminant calves. Furthermore, changes in the intestinal mRNA gene expression of apoptotic markers were analyzed to confirm previous morphological investigations (Fleige et al., 2007). Calve diseases have significant effect on the profitability of every calf raising enter-prise. During weaning, dairy calves fed with milk replacer are susceptible to many pathogens that cause diseases. We hypothesized that lactulose in probiotic-fed calves would modify immune respons-es in the intestine and have an effect on the mRNA gene expression of pro- and anti-apoptotic markers. Therefore, we fed calves with milk replacer (MR) supplemented with E. faecium and different doses of lactulose. We assessed a broad spectrum of pro- and anti-inflammatory cytokines and apoptosis marker in the small and large intestine.
MATERIAL AND METHODS
Experimental animals and treatments
Forty-two Simmental calves from various farms were directly bought from the Simmental breeding organization (Zuchtverband für oberbayerisches Alpenfleckvieh e.V.) in Miesbach, Germany. All
calves were single-born and were separated from their dams immediately after birth. They were di-vided into three homogenous experimental groups with a balanced weight of 74.4 ± 2.1 kg, age ranged at 39 ± 2 days and gender was 50% male plus 50% female. During the feeding experiment, all calves were fed with MR from Milkibeef Top (Milkivit, Trouw Nutrition, Burgheim, Germany) and further on 109 CFU (colony forming units) Enterococcus faecium. Standard feeding group (Control) was only fed with the MR, and served as control. The other two treatment groups were fed with MR enriched by 1% (L1) and 3% lactulose (L3). Therefore, the MR for group L1 and L3 was mixed with 2.5% and 7.5% Lactusat (Milei GmbH, Germany) which contains 42% lactulose. To guarantee a balanced feeding re-gime, in terms of energy and protein concentration, the Lactusat was added in exchange against whey powder. Calves of all feeding groups received MR in volumes up to 17.5 l/day in the experimental period of 19 weeks controlled by transponder au-tomatic feeder (Förster Technik, Engen, Germany). The MR was reconstituted in hot water (65°C) and fed at a temperature of approximately 41°C. The starting MR concentration at the beginning of the study was 125 g/l, with a continuous increase up to 250 g/l at the end of the study. All calves had free access to fresh water and 0.5 kg hay per day. After the dosing period of 133 ± 8 days the calves were slaughtered. The animal housing, sampling and euthanasia employed in this study followed the actual German law on animal production and veterinary inspection (LfL, Grub, Germany).
Tissue collection
Samples of the middle part of jejunum, ileum, colon and caecum were obtained at the time of slaughter. All animals were healthy and had no visible pathological signs in gastro-intestinal tract (GIT). Immediately after collection the tissues were placed into individually labeled cryotubes and fro-zen in liquid nitrogen. Cryotubes were removed from liquid nitrogen in the laboratory and stored at –80°C until analysis.
RNA extraction and RNA quality control
Total RNA from each tissue sample (~50 mg) was extracted by using TriFast reagent (Peqlab,

Veterinarni Medicina, 52, 2007 (10): 437–444 Original Paper
439
Table 1. Primers used for real-time qRT-PCR
Identity Sequence (5' → 3') Size (bp) Accession No.
β-Actin 202 AY141970
GAPDH 197 U85042
U biqutin 198 Z18245
IL-1β 198 M37211
TNF-α 197 NM173966
IL-8 149 AF232704
TGF-β1 267 XM592497
IL-10 132 U00799
EGFR 173 AY486452
PECAM-1 187 NM_174571
Bcl-xl 203 AF245487
BAX 194 L22473
Caspase 3 64 AY57500
Erlangen, Germany) as recommended by the manu-facturer. The quality and quantity of extracted total RNA were assessed using UV spectrophotometry. Integrity of the extracted total RNA was verified by optical density A260nm/A280nm absorption ratio. A second quality control was done by a micro-fluid-ic capillary electrophoresis (Fleige and Pfaffl, 2006). 100 ng of each experimental RNA sample was load-ed onto a RNA 6000 Nano Chip and assayed using the Bioanalyzer 2100 (Agilent Technologies, Palo Alto, CA). A commercially available and optimized RNA length standard ladder (Ambion, Austin, TX) during electrophoresis allows the evaluation of sizes of RNA bands. The algorithm assigns a RIN number score from 1 to 10, whereas level 10 rep-resents a completely intact RNA, and 1 presents a highly degraded RNA. In this way, interpretation of an RNA integrity shown in detail as electrophe-rogram was facilitated and comparison of samples were enabled.
Real-time qRT-PCR
One step real-time qRT-PCR were performed by using the SuperScript III Platinum SYBR Green One-Step qRT-PCR Kit (Invitrogen Life Technologies, Carlsbad, CA) by a standard pro-tocol in a Rotor-Gene 3000 (Corbett Life Science, Sydney, Australia). The master-mix was prepared (to the indicated end-concentration) as follows: 5 µl 2X SYBR Green Reaction Mix, 0.5 µl forward primer (10 pmol), 0.5 reverse primer (10 pmol) and 0.2 µl SYBR Green One-Step Enzyme Mix. Bovine sequence-specific primers were designed by using the HUSAR program (DKFZ, Heidelberg, Germany) and were synthesized by a commercial facility (MWG Biotech, Ebersberg, Germany). Sequences used for primer design were obtained from public databases (GenBank, National Center for Biotechnology Information) as coding DNA sequence (CDS). The primer sequences are listed

Original Paper Veterinarni Medicina, 52, 2007 (10): 437–444
440
in Table 1. For one-step qRT-PCR 3.8 µl total RNA (10 ng/µl) was added as PCR template to 6.2 µl total volume of master-mix and for the reaction the following cycling protocol was used: (i) reverse transcription (10 min at 55°C); (ii) denaturation program (5 min at 95°C); (iii) 40 cycles of amplifica-tion and quantification (15 s at 95°C; annealing for 30 s at 60°C; elongation for 20 s at 68°C with a single fluorescence measurement); (iv) melting curve pro-gram (60–99°C with a heating rate of 0.5°C per sec-ond and a continuous fluorescence measurement); (v) cooling program down to 40°C.
Data evaluation
Crossing points (CP) and single run efficiency (E) were achieved for each analyzed sample and gene using the Rotor-Gene 3000 software version 6.0 (Corbett Life Science). The relative mRNA lev-els were calculated by using the single-run-spe-cific efficiency-corrected relative expression model (Pfaffl, 2001). To assess the effect of the prebiotic treatment on cytokine gene expression in the dif-ferent tissues the relative expression ration (R) was calculated compared to the arithmetic mean ex-pression of three reference genes (β-actin, GAPDH, Ubiquitin). To factor the PCR efficiency into the analyses each analyzed sample was calculated apart with the sample specific efficiency, according to the calculation model shown in Figure 1. Values were expressed as means ± SEM. All statistical analy-sis were performed with Sigma Stat 3.0 (SPSS Inc. Chicago, IL, USA) using the one-way ANOVA.
RESULTS
RNA quality
The purity of the total RNA extracted was veri-fied by an average A260/A280 ratio of 1.87 (range 1.76–1.98). An A260/A280 ratio greater than 1.8 is usually considered an acceptable indicator of high
quality RNA. The second quality control was done by the Bioanalyzer 2100. The average total RNA quality of all samples studied was a RIN of 7.4 ± 0.7.
Gene expression changes of reference genes
For an accurate normalization of real-time qRT-PCR data stable and optimal reference genes are essen-tial (Vandesompele et al., 2002). Ubiquitin, GAPDH and β-actin showed a constant expression level in all studied tissues and were determined as optimal reference genes.
Gene expression changes of pro- and anti-inflammatory cytokines
The high dose feeding (L3) induced mRNA ex-pression changes for two analyzed anti-inflamma-tory cytokines in different parts of the intestine. IL-10 mRNA gene expression was 2.6-fold up-regulated (P < 0.05) in the jejunum and 1.9-fold up-regulated in the colon (Figure 2). A 2.1-fold in-crease of transforming growth factor β1 (TGF-β1) in the caecum was found among lactulose treat-ment (P < 0.05). Similarly the L1 group showed a 1.9-fold trend of up-regulation of TGF-β1 in the caecum (Figure 2). No mRNA expression changes for further pro-inflammatory markers (IL-1β, IL-8, TNF-α) were induced by lactulose feeding (data not shown in figures).
Gene expression changes of pro- and anti-apoptotic molecules
The oral application of lactulose induced only in the high dose treatment group (L3) mRNA expres-sion changes for anti-apoptotic factors. A feeding with 3% lactulose affected a down-regulation about 76% of the Bcl-xl mRNA gene expression (Figure 3) in the jejunum (P < 0.05) and an up-regulation about 70% of caspase 3 (P < 0.05) in the caecum (Figure 3).
Figure 1. For normalization of each analyzed target gene (TG) in the presented study the arithmetic mean expres-sion of three reference genes (β-actin, GAPDH, and ubiquitin) was used. Further the efficiency of mentioned genes was included in the calculation model
R = (ERG1)CPtreated + (ERG2)CPtreated + (ERG3)CPtreated
÷ (ERG1)CPcontrol + (ERG2)CPcontrol
(ETG)CPtreated (ETG)CPtreated

Veterinarni Medicina, 52, 2007 (10): 437–444 Original Paper
441
No mRNA expression changes for PECAM, EGFR and BAX were induced by lactulose feeding (data not shown in figures).
DISCUSSION
The objective of the present study was to investi-gate the effects of lactulose as a prebiotic in probi-otic-fed calves on the intestinal immune functions. Furthermore, the effect on pro- and anti-apoptotic
factors in the intestine should be assayed to ensure previous histological investigations (Fleige et al., 2007). Animal studies, as well as data obtained from in vitro cell culture systems, have underlined the potential of certain prebiotics to protect against inflammatory and cancerous processes in the large intestine. The biochemical mechanisms are still unknown, but both the promotion of lactic acid-producing bacteria and the production of SCFA, particularly butyrate during the fermentation of prebiotics, could be key factors.
Figure 2. IL-10 and TGF-β1 mRNA expression changes due to lactulose feeding. Data are presented as relative expression in means ± SEM (n = 14). Up-regulated genes are shown as values higher than 1 and down-regulated genes as values lower than 1. Significant effects of lactulose are marked with an asterisk (*P < 0.05) and trends of regulation are shown with plus (+0.05 < P < 0.1)
Figure 3. Effect of lactulose on the anti-apoptotic factor Bcl-xl and apoptotic factor caspase 3 in various intestinal calf tissues, compared to the untreated control group. Data are presented as relative expression in means ± SEM (n = 14). Up-regulated genes are shown as values higher than 1 and down-regulated genes as values lower than 1. Significant effects of lactulose are marked with an asterisk (*P < 0.05)
IL-10 TGF-β1
Bcl-xl Caspase 3
Jejunum Ileum Caecum Colon Jejunum Ileum Caecum Colon
5.00
2.50
1.50
1.00
0.75
0.50
0.25
Rela
tive
expr
essi
on
5.00
2.50
1.50
1.00
0.75
0.50
0.25
Rela
tive
expr
essi
on
Rela
tive
expr
essi
on
Rela
tive
expr
essi
on
Jejunum Ileum Caecum Colon Jejunum Ileum Caecum Colon
5.00
2.50
1.50
1.00
0.75
0.50
0.25
5.00
2.50
1.50
1.00
0.75
0.50
0.25
Original Paper Veterinarni Medicina, 52, 2007 (10): 437–444
442
Stimulation of the GALT (gut associated lym-phoid tissue) via prebiotics and probiotics might influence immune modulation because of their ability to enhance production of IL-10 and TGF-β1. Both are anti-inflammatory cytokines, which might have an essential role in dampening allergen-in-duced responses. Overall, the 3% lactulose feed-ing significantly stimulated IL-10 production in the jejunum and colon. IL-10 is primarily produced by T-helper2/T-regualtory lymphocytes and dendritic cells. It binds to a specific receptor on intestinal epithelial cells and regulates the contribution of epithelial cells to the inflammatory and immune re-sponse in the digestive tract (Denning et al., 2000). IL-10 can inhibit antigen specific proliferation and cytokine secretion by Th1 lymphocytes and has down regulatory effects on macrophages and den-dritic cells, such as suppression of activation and IL-12 production (Moore et al., 1993; Tripp et al., 1993). IL-10 can also prevent interferon-γ induced disruption of colonic epithelial barriers (Madsen et al., 1997). Recent studies with mice also reported that consuming diverse prebiotics (fructooligo-saccharide or inulin enriched with oligofructose) enhanced IL-10 production (Hosono et al., 2003; Roller et al., 2004). Furthermore, the high dose lactulose feeding significantly stimulated TGF-β1 production in the caecum. TGF-β1 is a multifunc-tional cytokine that regulates many diverse cellular processes including proliferation, apoptosis, dif-ferentiation (Tanigawa et al., 2005) and immune regulation. Several reports suggest that TGF-β1 may function as a regulator of epithelial morpho-genesis in the GIT. TGF-β1 is an effective inhibitor of proliferation and tended to have its strongest inhibitory effects in the lower (stem cell) regions of the crypts (Potten et al. 1995), which could be a reason for the shortening of crypts in the caecum as was found in previous investigations by Fleige et al. (2007). Production of IL-10 and TGF-β1 leads to activation of regulatory T cells, which in turn inhibit the immune response and induce muco-sal tolerance (Maloy and Powrie, 2001; Singh et al., 2001). Generally, probiotics increase the pro-duction of intestinal anti-inflammatory cytokines (such as IL-10 and TGF-β1), while reducing the pro-duction of pro-inflammatory cytokines (Ewaschuk and Dieleman, 2006) and prebiotics could amplify this effect. Whether prebiotics modulate the im-mune response directly or indirectly, by affecting the composition of the intestinal flora and thus affecting the gut associated lymphoid tissue, or by
producing SCFA, is presently unknown. Postulated are effects on luminal micro ecology, mucosal bar-rier function, and immunoregulation.
In the small intestine we have shown that oral ad-ministration of lactulose has an suppressive effect on the anti-apoptotic marker Bcl-xl in the jejunum (P < 0.05). Bcl-xl is the dominant regulator of apop-tosis. It is known as the survival protein because the long form of Bcl-xl has cell death repressor activity (Sattler et al., 1997). The interaction with EGFR and its vital role in the apoptosis pathway makes Bcl-xl to an interesting candidate gene. Apoptosis is recognized as an important process responsible for maintenance of the cellular balance between proliferation and death. This form of cell death can be induced by a wide range of cellular signals, which lead to activation of cell death machinery within the cell and is characterized by distinct morpho-logical changes (Aschoff et al., 2004). Apoptosis is especially relevant in the GIT, as the mammalian intestinal mucosa undergoes a process of continual cell turnover that is essential for maintenance of normal gut epithelial function. Dysregulated apop-tosis is seen in a number of pathological conditions in the GIT (Ramachandran et al., 2000).
Therefore, a decreased anti-apoptotic rate seems to be associated with an increase in villus heights in the jejunum of lactulose treated calves. Fleige et al. (2007) reported about a trend of higher villus heights in the jejunum in 3% lactulose fed calves. Furthermore, the high lactulose feeding has up-regulated the apoptotic molecule caspase 3 in the caecum (P < 0.05). This result goes in line with previous histological investigation by Fleige et al. (2007), who found a decreasing crypt depth in the caecum due to lactulose-supplementation. The prebiotics are proven to increase apoptosis in the intestine (Hughes and Rowland, 2001). Especially lactulose is said to reduce cell proliferation af-ter supplementation for some days (Kien et al., 1999). The production of SCFA in the lumen of the hindgut by bacterial fermentation of lactulose was identified in previous work as a reason for this morphological effect (Mandal et al., 2001).
CONCLUSION
This study indicates that a high dose lactu-lose feeding in combination with E. faecium af-fects the intestinal immune function. The higher mRNA expression of IL-10 and TGF-β1 leads to
Veterinarni Medicina, 52, 2007 (10): 437–444 Original Paper
443
induce mucosal tolerance. Consequently, the calves might be more resistant to diseases. Further stud-ies with calves are required to confirm these data. Morphological changes due to lactulose could be explained by the up-regulation of caspase 3 and TGF-β1 in the large intestine.
Acknowledgement
We are indebted to the H.W. Schaumann Stiftung (Hamburg), who is supported the study.
REFERENCES
Aschoff A.P., Ott U., Funfstuck R., Stein G., Jirikowski G.F. (2004): Colocalization of BAX and BCL-2 in small intestine and kidney biopsies with different degrees of DNA fragmentation. Cell and Tissue Research, 296, 351–357.
Bohmer B.M., Branner G.R., Roth-Maier D.A. (2005): Pre-caecal and faecal digestibility of inulin (DP 10–12) or an inulin/Enterococcus faecium mix and effects on nutrient digestibility and microbial gut flora. Journal of Animal Physiology and Animal Nutrition, 89, 388–396.
Denning T.L., Campbell N.A., Song F., Garofalo R.P., Klimpel G.R., Reyes V.E., Ernst P.B. (2000): Expression of IL-10 receptors on epithelial cells from the murine small and large intestine. International Immunology, 12, 133–139.
Ewaschuk J.B., Dieleman L.A. (2006): Probiotics and prebiotics in chronic inflammatory bowel diseases. World Journal of Gastroenterology, 12, 5941–5950.
Fleige S., Pfaffl M.W. (2006): RNA integrity and the effect on the real-time qRT-PCR performance. Molecular Aspects of Medicine, 27, 126–139.
Fleige S., Preißinger W., Meyer, H.H.D., Pfaffl, M.W. (2007): Effect of lactulose on growth perfomance and intestinal morphology of pre-ruminant calves using a milk replacer containing Enterococcus faecium. Ani-mal, 1, 367–373.
Flickinger E.A., Van Loo J., Fahey G.C. Jr. (2003). Nutri-tional response to the presence of inulin and oligo-fructose in the diets of domesticated animals: a review. Critical Reviews in Food Science and Nutrition, 43, 19–60.
Gibson G.R., McCartney A.L., Rastall R.A. (2005): Pre-biotics and resistance to gastrointestinal infections. British Journal of Nutrition, 93, 31–34.
Hague A., Manning A.M., Hanlon K.A., Huschtscha L.I., Hart D., Paraskeva C. (1994): Sodium butyrate in-
duces apoptosis in human colonic tumour cell lines in a p53-independent pathway – implications for the pos-sible role of dietary fibre in the prevention of large bowel cancer. International Journal of Cancer, 55, 498–505.
Hooper L.V., Midtvedt T., Gordon J.I. (2002): How host-microbial interactions shape the nutrient environment of the mammalian intestine. Annual Review of Nutri-tion, 22, 283–307.
Hosono A., Ozawa A., Kato R., Ohnishi Y., Nakanishi Y., Kimura T., Nakamura R. (2003): Dietary fructooligo-saccharides induce immunoregulation of intestinal IgA secretion by murine Peyer’s patch cells, Bioscience, Biotechnology and Biochemistry, 67, 758–764.
Hughes R.M., Rowland I.R. (2001): Stimulation of apop-tosis by two prebiotic chicory fructans in the rat colon. Carcinogenesis, 22, 43–47.
Jenkins D.J., Kendall C.W., Vuksan V. (1999): Inulin, oli-gofructose and intestinal functions. Journal of Nutri-tion, 129, 1431–1433.
Kien C.L., Murray R.D., Qualman S.J., Marcon M. (1999): Lactulose feeding in piglets: a model for persistent di-arrhea and colitis induced by severe sugar malabsorp-tion. Digestive Diseases and Sciences, 44, 476–484.
Macfarlane G.T., Cummings J.H. (1999): Probiotics and prebiotics: can regulating the activities of intestinal bacteria benefit health? British Medical Journal, 10, 318, 999–1003.
Macfarlane S., Macfarlane G.T., Cummings J.H. (2006): Review article: prebiotics in the gastrointestinal tract. Alimentary Pharacology and Therapeutics, 24, 701–714.
Madsen K., Lewis S., Tavernini M. (1997): Interleukin 10 prevents cytokine-induced disruption of T84 mono-layer barrier integrity and limits chloride secretion. Gastroenterology, 113, 151–159.
Maloy K.J., Powrie F. (2001): Regulatory T cells in the control of immune pathology. Nature Immunology, 2, 816–822.
Mandal M., Olson D.J., Sharma T., Vadlamudi R.K., Ku-mar R. (2001): Butyric acid induces apoptosis by up-regulating Bax expression via stimulation of the c-Jun N-terminal kinase/activation protein-1 pathway in human colon cancer cells. Gastroenterology, 120, 71–78.
Moore K.W., O’Garro A., de Waal Malefyt R. (1993): Interleukin-10. Annual Review of Immunolology, 11, 165–190.
Parvez S., Malik K.A.. Ah Kang S., Kim K.J. (2006): Pro-biotics and their fermented food products are benefi-cial for health. Journal of Applied Microbiology, 100, 1171–1185.

Original Paper Veterinarni Medicina, 52, 2007 (10): 437–444
444
Patterson J.A.,Burkholder K.M. (2003): Prebiotic feed additives: Rationale and use in pigs. In: Ball R.A. (ed.): Proceedings of the 9 International Symposium on Di-gestive Physiology in Pigs. Banff, Canada, University of Alberta, vol. 1, 319–331.
Pfaffl M.W. (2001): A new mathematical model for rela-tive quantification in real-time RT-PCR. Nucleic Ac-ids Research, 29, e45.
Pie S., Awati A., Vida S., Falluel I., Williams B.A., Oswald I.P. (2007): Effects of added fermentable carbohydrates in the diet on intestinal pro-inflammatory cytokine specific mRNA content in weaning piglets. Journal of Animal Science, 85, 673–683.
Potten C.S. (1992): The significance of spontaneous and induced apoptosis in the gastrointestinal tract of mice. Cancer Metastasis Reviews, 11, 179–195.
Potten C.S., Owen G., Hewitt D., Chadwick C.A., Hen-dry H., Lord B.I., Woolford L.B. (1995): Stimulation and inhibition of proliferation in the small intestinal crypts of the mouse after in vivo administration of growth factors. Gut, 36, 864–873.
Ramachandran A., Madesh M., Balasubramanian K.A. (2000): Apoptosis in the intestinal epithelium: Its rel-evance in normal and pathophysiological conditions. Journal of Gastroenterology and Hepatology, 15, 109.
Roller M., Rechkemmer G., Watzl B. (2004): Prebiotic inulin enriched with oligofructose in combination with the probiotics Lactobacillus rhamnosus and Bifido-bacterium lactis modulates intestinal immune func-tions in rats. Journal of Nutrition, 134, 153–156.
Sattler M., Liang H., Nettesheim D., Meadows R.P., Har-lan J.E., Eberstadt M., Yoon H.S., Shuker S.B., Chang B.S., Minn A.J., Thompson C.B., Fesik S.W. (1997): Structure of Bcl-xL-Bak Peptide Complex: Recognition Between Regulators of Apoptosis. Science, 275, 983.
Corresponding Author:
M.W. Pfaffl, Physiology Weihenstephan, Technische Universität München, Weihenstephaner Berg 3, 85354 Freising, GermanyTel. +49 816 71 3511, fax +49 8161 71 4204, e-mail: [email protected]
Schouten B.W. (2005): Calf rearing – a review of the prevention and treatments of disease of this valuable calf. Side papers. http://www.side.org.nz/Papers
Singh B., Read S., Asseman C. (2001): Control of intes-tinal inflammation by regulatory T cells. Immuno-logical Reviews, 182, 190–200.
Tanigawa T., Pai R., Arakawa T., Higuchi K., Tarnawski A.S. (2005): TGF-β signaling pathway: its role in gas-trointestinal pathophysiology and modulation of ulcer healing, Journal of Physiology and Pharmacology, 56, 1–3.
Tripp C.S., Wolf S.F., Unanue E.R. (1993): Interleukin 12 and tumor necrosis factor alpha are costimulators of interferon gamma production by natural killer cells in severe combined immunodeficiency mice with liste-riosis, and interleukin 10 is a physiologic antagonist. Proceedings of the National Academy of Sciences USA, 90, 3725–2729.
Tuohy K.M., Rouzaud G.C., Bruck W.M., Gibson G.R. (2005): Modulation of the human gut microfl ora to-wards improved health using prebiotics – assessment of efficacy. Current Pharmaceutical Design, 11, 75–90.
Vandesompele J., De Preter K., Pattyn F., Poppe B., Van Roy N., De Paepe A., Speleman F. (2002): Accurate normalization of real-time quantitative RT-PCR data by geometric averaging of multiple internal control genes. Genome Biology, 3, research 0034.I
Wilson R.A., Zolnai A., Rudas P., Frenyo L.V. (1996): T-cell subsets in blood and lymphoid tissues obtained from fetal calves, maturing calves, and adult bovine. Veterinary Immunology and Immunopathology, 53, 49–60.
Received: 2007–03–24Accepted after corrections: 2007–07–26
Appendix
Appendix V:
Fleige S, Preißinger W., Meyer HHD, Pfaffl MW (2007):
The immune – modulating effect of lactulose in combination with Enterococcus
faecium in pre-ruminant calves.
Journal of nutrition. Submitted.

JOURNAL OF NUTRITION
SUBMITTED
The immune-modulating effect of lactulose on Enterococcus faecium fed pre-ruminant calves.
Simone Fleige1; Wolfgang Preißinger2; Heinrich H.D. Meyer1; Michael W. Pfaffl1*
ABSTRACT Prebiotics and probiotics could represent an effective alternative to the use of synthetic antibiotics in nutrition. The mechanisms by which prebiotics affect the immune system are not investigated yet in detail. Many effects are attributed to the increase of the innate and the acquired immune response. The study was conducted to elucidate the long term effects of orally administered lactulose on the immune response of the intestinal tract of probiotic-fed calves. Pre-ruminant calves were randomized to three feeding groups: the control group (L0) was fed milk replacer containing E. faecium; a lactulose group (L1) containing additional 1% lactulose and a second lactulose group (L3) containing additional 3% lactulose. The mRNA expression of different cell activation markers, pro- and anti-inflammatory cytokines and immunoglobulin A Fc Receptor (IgA FcR), were investigated in ileum, mesenterial lymph node, spleen and white blood cells. A significant higher number of lymphocytes were detected in the L3 group. The expression results indicated that the transcription of IgA FcR in the ileal mucosa of the L3 treatment group increased significantly in male calves and also tended to increase in female calves. Furthermore a decrease of IL-10 and IFN-γ mRNA expression was observed in the ileum. CD4 presenting lymphocytes were decreased significantly in the ileum and mesenteric lymph node, whereas CD8 presenting lymphocytes were increased in blood. Other pro-inflammatory cytokines (IL-1β, IL-8 and TNF-α) and anti-inflammatory cytokines (TGF-β1) did not show significant differences on mRNA level among treatment groups. The results indicate that additional lactulose feeding has an immune modulatory effect on the composition of T cell subsets in different immune compartments and minor effects on pro- and anti- inflammatory cytokine mRNA expression.
KEY WORDS lactulose, prebiotics, immunomodulation, T cell subsets, anti-inflammatory cytokines
* Author for correspondence: Michael W. Pfaffl Weihenstephaner Berg 3 Physiology Weihenstephan Technische Universität München 85354 Freising, Germany Tel: (+49) 8161 – 71 3511 Fax: (+49) 8161 – 71 4204 Email: [email protected] a Supported by the H. Wilhelm Schaumann-Stiftung, Germany
1

JOURNAL OF NUTRITION
2
INTRODUCTION
Calf diseases – particularly diarrhoea and respiratory disease represent a serious economic impact on cattle up breeding companies (1). Prior to weaning, dairy calves fed with milk replacer (MR) are susceptible to many pathogens (1). Probiotics and prebiotics have been proposed as agents to manipulate the bacterial flora of the intestinal tract of animals, potentially reducing the incidence of disease. Today, a growing interest exists in the potential health-promoting benefits of prebiotics in farm animals. Multiple mechanisms of action for the beneficial effect prebiotics have been postulated, particularly by its enhancing effect on probiotic growth in the gut (2). The beneficial effects include the prevention of pathogenic bacteria growth, production of antimicrobial agents, stimulation of mucosal barrier function, and altering immunoregulation (3). The prebiotic lactulose is a synthetic disaccharide with several properties, including an anti-endotoxin effect and the potential to alter faecal floral patterns (4). Therefore it is predominantly used as an osmotic laxative (4). It is neither absorbed nor metabolized in the upper gastro intestinal tract (GIT), but it is degraded to organic acids by the bacterial flora of the proximal colon. Lactulose is a common used prebiotic in human health because of its stabilizing effect on the gut (5). At present, only few studies have investigated the direct effects of prebiotics on the immune system (6). Whether prebiotics modulate the immune response directly or indirectly, by affecting the composition of the intestinal flora (7), or by the fermentation to short chain fatty acids (SCFA), is still unknown. It was reported that the prebiotics inulin and oligofructose can modulate functions of the immune system, primarily the activation of immune cells in Peyer´s patches (PP) (8). Another possibility to modulate the immune response is the combined use of prebiotics and probiotics (9) in order to improve survival of the probiotics by supplying a readily available and specific substrate for its fermentation (10). Especially probiotic effects are mediated through immune regulation,
particularly through balance control of pro-inflammatory and anti-inflammatory cytokines. Probiotics mediate suppression of lymphocyte proliferation and cytokine production by T cells (11) and down-regulate the expression of pro-inflammatory cytokines as tumour necrosis factor alpha (TNF-α), interleukin 1 beta (IL-1ß) and interferon gamma (INF-γ) (12). They interact with intestinal epithelia, and attenuate synthesis of inflammatory effector molecules elicited by diverse pro-inflammatory stimuli (13,14). Thus, probiotics and also prebiotics - that support the growth of probiotics - can be responsible for the unique tolerance of the gastrointestinal mucosa to pro-inflammatory stimuli. The used probiotic E. faecium belongs to the lactic acid bacteria and is a normal inhabitant of the gut flora of animals (15) with inhibitory effects against important enteropathogens (16). In several biological preparations E. faecium is used as feed additive and it was shown to stimulate the mucosal and the systemic immune system in dogs (17). Only a limited number of studies assessing the effect of lactulose on immune function have been published. The effect of a prebiotic administration or prebtiotic administration on probiotic-fed animals on the immune response was researched in previous studies with rats (18), mice (19), dogs (20) or pigs, neither with calves. Furthermore, results of several studies have been inconsistent and thus they were not directly comparable. The purpose of the present study was to investigate the effect of a long term lactulose administration on the immune response in probiotic fed female and male calves. Therefore, we fed female and male calves with MR supplemented with E. faecium and different dose of lactulose. We assessed a broad spectrum of cytokines, markers of the T cell population and IgA FcR in different immune compartments.
MATERIALS AND METHODS
Experimental animals and treatment 42 Simmental calves from various farms were directly bought from the Simmental

JOURNAL OF NUTRITION
3
breeding organisation (Zuchtverband für oberbayerisches Alpenfleckvieh e.V.) in Miesbach, Germany. All calves were single-born and were separated from their dams immediately after birth. They were divided into three homogenous experimental groups with a balanced weight of 74.4 ± 2.1 kg, age ranged from 39 ± 2 days and gender was 50% male plus 50% female calves. During the feeding experiment, all calves were fed with MR from Milkibeef Top (Milkivit, Trouw Nutrition, Burgheim, Germany) containing 109 CFU (colony forming units) E. faecium. The control group (L0) was fed MR containing E. faecium; a lactulose group (L1) containing additional 1% lactulose and a second lactulose group (L3) containing additional 3% lactulose dry matter. Therefore, the MR for group L1 was mixed with 2.5% Lactusat and group L3 with 7.5% Lactusat (Milei GmbH, Germany) which contains 42% lactulose. To guarantee a balanced feeding regime, in terms of energy and protein concentration, the Lactusat was added in exchange against whey powder. Calves of all feeding groups received MR in volumes up to 17.5 l/d in the experimental period of 19 weeks controlled by transponder automatic feeder (Förster Technik, Engen, Germany). The MR was reconstituted in hot water (65°C) and fed at a temperature of approximately 41°C. The starting MR concentration at the beginning of the study was 125 g/l, with a continuous increase up to 250 g/l at the end of the study. All calves had free access to fresh water and 0.5 kg hay per day. After the dosing period of 133 ± 8 days the calves were slaughtered. The animal housing, sampling and euthanasia employed in this study followed the actual German law on animal production and veterinary inspection (LfL, Grub, Germany).
Tissue collection and blood samples Tissue sampling: Samples of the middle part of ileum, mesenterial lymph node (mLN) and spleen were obtained at the time of slaughter. Immediately after collection the tissues were placed into individually labelled cryotubes and frozen in liquid nitrogen. Cryotubes were removed from liquid nitrogen in the laboratory and stored at -80°C until analysis. All animals had a healthy ileum,
mLN and spleen with no visible pathological signs.
Blood sampling: 2x 15 ml blood samples were collected from the jugular vein using an EDTA and serum vacutainer tube (Greiner bio-one GmbH, Frickenhausen, Germany) following euthanasia. For the haematological analysis the blood samples were forwarded in EDTA vacutainer tubes to a veterinary laboratory (Vetmed Labor, Unterhaching, Germany). The haematocrit value and haemoglobin concentration, erythrocyte, thrombocyte and white blood cell (WBC) numbers were determined with the CELL-DYN 3700SL System (Abbott Diagnostika GmbH, Wiesbaden, Germany). Furthermore a blood smear was sending to obtain a differential white cell count. Blood smears were stained with May-Grünwald’s eosin-methylene blue solution (Merck 1424) and Giemsa solution (Merck 9204) (22). The percentage of the different WBC subtypes, like granulocytes, lymphocytes, monocytes and atypical cells were determined. For WBC mRNA expression analysis EDTA blood was diluted 1/1 (v/v) with lysis buffer (830 mg NH4CL, 3.7 mg Na-EDTA, 100 mg KCL in 100 ml H2O pH 7.4) and centrifuged for 10 min at 220 g. The cell pellet was again suspended in lysis buffer and centrifugation was repeated. Supernatants of blood samples were discarded and leucocytes were transferred in 350 µl RNA extraction lysis buffer (Macherery-Nagel, Düren, Germany).
RNA extraction and RNA quality control Total RNA from blood samples and each tissue sample (~50 mg) was extracted by using TriFast reagent (Peqlab, Erlangen, Germany) essential as recommended by the manufacturer. The quality and quantity of extracted total RNA were assessed using UV spectrophotometry. Integrity of the extracted total RNA was verified by optical density A260nm/A280nm absorption ratio. A second quality control was done by a micro-fluidic capillary electrophoresis (23). 100 ng of each experimental RNA sample was loaded onto a RNA 6000 Nano Chip and assayed using the Bioanalyzer 2100 (Agilent Technologies, Palo Alto, CA). A commercially available and
JOURNAL OF NUTRITION
4
optimized RNA length standard ladder (Ambion, Austin, TX) during electrophoresis allows the evaluation of sizes of RNA bands. The algorithm assigns a RIN number score from 1 to 10, whereas level 10 represents a completely intact RNA, and 1 presents a highly degraded RNA. In this way, interpretation of an RNA integrity shown in detail as electropherogram was facilitated and comparison of samples were enabled.
Real-time qRT-PCR One step real-time qRT-PCRs were performed by using the SuperScript III Platinum SYBR Green One-Step qRT-PCR Kit (Invitrogen Life Technologies, Carlsbad, CA) by a standard protocol in a Rotor gene 3000 (Corbett Life Science, Sydney, Australia). The master-mix was prepared (to the indicated end-concentration) as follows: 5µl 2X SYBR Green Reaction Mix, 0.5 µl forward primer (10 pmol), 0.5 reverse primer (10 pmol) and 0.2 µl SYBR Green One-Step Enzyme Mix. Bovine sequence-specific primers were designed by using the HUSAR program (DKFZ, Heidelberg, Germany) and were synthesized by a commercial facility (MWG Biotech, Ebersberg, Germany). Sequences used for primer design were obtained from public databases (GenBank, National Center for Biotechnology Information) as coding DNA sequence (CDS). The primer sequences are listed in Tab. 1. For one-step qRT-PCR 3.8 µl total RNA (10 ng/µl) was added as PCR template to 6·2 µl total volume of master-mix and for the reaction the following cycling protocol was used: (i) reverse transcription (10 min at 55°C); (ii) denaturation program (5 min at 95°C); (iii) 40 cycles of amplification and quantification (15 sec at 95°C; annealing for 30 sec at 60°C; elongation for 20 sec at 68°C with a single fluorescence measurement); (iv) melting curve program (60-99°C with a heating rate of 0·5°C per sec and a continuous fluorescence measurement); (v) cooling program down to 40°C.
Data evaluation Crossing Point (CP) and single run efficiency (E) values were achieved for each analyzed sample and gene using the Rotor-Gene 3000 software version 6.0 (Corbett Life Science).
The relative expression changes were evaluated by using the single-run-specific efficiency-corrected relative expression model (24) (Fig.1). CP and E data for male and female calves (each n=7) were calculated separately. To assess the effect of the lactulose feeding on cytokine gene expression in the different tissues the relative expression ratio ( R ) was calculated, which is equal to a x-fold regulation. For normalization of each analyzed target gene (TG) the mean expression of the three reference genes (RG: ß-actin, GAPDH, Ubiquitin) was calculated. To factor the PCR efficiency into the analysis each analyzed sample was calculated apart with the sample specific efficiency. Cytokine mRNA expression is presented as relative expression whereas the appropriate mean control group (female or male control group) value was used as the calibrator. Values were expressed as means ± SEM. Analysis for the cytokine expression in all tissues studied was done by the two-way ANOVA. In order to find out whether lactulose has different sex-specific effects the pairwise multiple comparison procedures were processed with the Holm-Sidak method. The significance level was set at 0.05 for all tests. The statistical analysis was performed with Sigma Stat 3.0 (SPSS Inc. Chicago, IL, USA).
RESULTS
RNA quality Isolated total RNA quality was verified by an average A260/A280 ratio of 1.88 (range 1.75–2.01). An A260/A280 ratio greater than 1.8 is usually considered an acceptable indicator of high quality RNA. No phenolic contamination or background absorption was reported via the A260/A280 ratio. The second quality control was done by the Bioanalyzer 2100. The total RNA quality of all samples studied ranged from RIN 7.2 to 9.3.
Haematology
The number of thrombocytes and lmyphocytes was affected by lactulose feeding. The number of thrombocytes decreased from 1203 ± 475 G/l in the control

JOURNAL OF NUTRITION
5
group to 737 ± 318 G/l (P<0.05) in the L1 group. A significant higher number of lymphocytes from 56.4 ± 8.5% in the L3 group (P=0.02) versus 47.3 ± 10.5% in the control group was detected (Fig. 2). No differences in the haematocrit values, haemoglobin concentrations, and erythrocyte and leukocyte numbers were found among treatments.
Gene expression of pro- and anti-inflammatory cytokines Lactulose affected a slight down-regulation of IL-10 in the ileum of the total L3 feeding group (P<0.05). The IL-10 relative expression ( R ) in the total L3 group was 0.29. A gender specific change of mRNA expression could determined for male calves of the group L3, which showed a down-regulation of 67% for IFN-γ and only a trend of down-regulation of 65% for IL-10 (0.05<P<0.10). No effect on the IFN-γ / IL-10 ratio was found. For further pro-inflammatory cytokines (IL-1β, IL-8, and TNF-α) and anti-inflammatory cytokines (TGF-β1), no significant differences between mRNA expressions were found among treatment groups.
Alteration of T cell subgroups and T cell activation status Lactulose induced mRNA expression changes for diverse CD markers (CD4, CD8, CD25 and CD69) are shown in table 2. The L1 treatment affects CD4 T-lymphocytes in the mLN and ileum of female calves. The CD4 expression in the mLN decreased about 51% (P<0.01) and about 60% in the ileum. In the same group a 2.1-fold increase of the CD8 T-lymphocyte expression could be observed in WBC. The CD25 expression in the mLN of male calves was reduced about 57% in L3 (P<0.05), while the CD69 expression significant decreased about 65% (P<0.05) in the spleen of male calves (L1).
IgA Fc Receptor mRNA expression The treatments with lactulose show a significant effect on the mRNA expression of IgA FcR in the ileum. The male calves of L1 and L3 showed an up-regulation of IgA FcR,
2.6-fold (P<0·05) for L1 and 2-fold (0.05<P<0.10) for L3, respectively (Tab. 3).
DISCUSSION The results demonstrate that the ileum and mLN are the tissues that are primarily affected by long term lactulose feeding. In addition, the supplementation of 1% lactulose has induced a significant immunomodulation in female calves, whereas the supplementation of 3% lactulose affects male calves in different immune compartments. Moreover, the supplementation of 3% lactulose in male calves has reduced the production of IFN-γ. Considering that the humoral immunity is inhibited by IFN-γ we can assume that lactulose enhances the humoral immune response. The supplementation of lactulose in calves fed with E. faecium could have amplified the effect of the probiotic bacteria, which are able to enhance the humoral immune response and thereby promote the intestines immunologic barrier (11). In contrast to a number of animal studies (18,19) we could show a decrease of IL-10 mRNA expression in the ileum of the L3 group. Other studies with mice or rats demonstrated that consuming prebiotics like fructooligo-saccharide or inulin enhanced IFN-γ and IL-10 production by PP cells and that the combined use of pre- and probiotics abrogated the strong effect of prebiotics on PP cytokine production (19). A combined application of probiotics and prebiotics could have different effects from those of the individual supplements. In rats, a probiotic treatment modestly affected immune functions, whereas systemic immuno-modulatory effects were observed by a combined application of pre- and probiotic (18). Immunologic responses to pathogens are mediated by the IgA FcR. The receptor is a transmembrane glycoprotein presented on the surface of myeloid lineage cells such as neutrophils, monocytes, macrophages and eosinophils, where it mediates immunologic responses to pathogens (25). Ligation of FcRs by Ig-coated targets can trigger numerous cellular effector functions including

JOURNAL OF NUTRITION
6
phagocytosis, antibody-dependent cell-mediated cytotoxicity, respiratory burst, synthesis and release of cytokines and other inflammatory mediators (26). The IgA FcR expression increased in male calves due to the lactulose feeding. The availability of lactulose in the ileum may support the growth
of the supplemented E. faecium and consequently could stimulate IgA FcR synthesis. Additionally, studies reveal that feeding lactulose is associated with increases in IgA secretion and IgA cells in GALT (27). Thus, FcRs provide a crucial link between the humoral and cellular arms of the immune system (28). The high-affinity FcγRI is not constitutively expressed. A high level on neutrophils and cytokines such as INF-γ need to be administered to up-regulate the receptor expression. However, we found no correlation between changes in IFN-γ production and IgA FcR expression in the ileum due to lactulose feeding (data not shown). In which way lactulose or prebiotics in general influenced the IgA FcR is still unclear. The immunostimulatory effect of prebiotics has already been demonstrated through the proliferation and activation of immune cells, particularly CD4 CD8 T lymphocytes in peripheral blood and in the secondary lymphoid organ (18). A significant higher number of lymphocytes could be shown in the high lactulose L3 treatment. Other studies conducted with recognized prebiotic fibres have shown an alteration of the proportion of T cells (CD4 and CD8) and increased lymphocyte and leukocyte numbers in the GALT of canine (29) and in the peripheral blood of calves (30). Our results confirmed these studies though lactulose increased the lymphocytes in blood. Overall, the treatments did not affect the subpopulations of lymphocytes in male calves, whereas the CD4 T-lymphocytes of female calves in PP and mLN decreased and the CD8 T-lymphocytes in WBC increased. CD4 cells secrete a number of cytokines that are important in the activation of B cells, T cells and cells of the innate immune system, whereas CD8 cells play a role in immunological tolerance, such as the tolerance to foreign antigens encountered in the gut (31). Furthermore, the
supplementation of 3% lactulose reduced the mRNA expression of cell surface receptor CD25 (α chain of the IL-2 receptor) in the mLN of male calves, which is expressed on activated T cells, B cells and monocytes. Formation of the high–affinity IL-2 receptor (expression of CD25) allows T cell proliferation and differentiation. Also the CD69 expression in spleen in the same feeding group indicating that lactulose is able to modulate the activation status of in vivo differentiated T cells. Low expression of CD69, a marker of leukocyte activation on CD8 cells could be attributed with a specific activation of CD3/CD8 T cells (32). The identification of the cellular subpopulations activated by different nonpathogenic bacterial strains was analyzed by Haller et al. (2000) (32) and only natural killer cells, which were activated by different nonpathogenic bacterial strains, are able to up-regulate activation markers. Due to lactulose feeding the lymph follicles in the Peyers patches of the ileum revealed smaller sizes which were obvious sex-specific different (20). This could suggest a lower immunological activity throughout the lactulose rich feeding (20). The stabilization of the intestinal environment by the reduction of pathogen bacteria by lactulose could have lead to a reduced activation of the immune system. Because all calves were in the best of health, no possible decrease of infections could be analysed. The intention to scientifically prove the positive effects of lactulose in calf nutrition, as they are known from human nutrition, was only partly successful. Moreover, it need be noted, that high individual differences between the animals complicate the proof of the effectiveness of the lactulose concept.
CONCLUSION The results indicate that the supplementation of lactulose to E. faecium fed calves has an immune modulatory effect on the lymphocyte content and on the composition of T cell subsets in different immune compartments. The supplementation of 1% lactulose induced more significantly immuno-modulation in female calves, whereas the supplementation of 3% lactulose affects the male calves in different immune

JOURNAL OF NUTRITION
7
compartments. Further studies are needed to confirm these findings and better define the mechanisms for immunomodulation through lactulose, and the ultimate impact on health. There is convincing preliminary data to suggest that the feeding of lactulose can modulate immune parameters in GALT, secondary lymphoid tissues and peripheral circulation in pre-ruminant calves.
ACKNOWLEDGEMENTS Many thanks to Milei GmbH providing the Lactusat, and Milkivit, Trouw Nutrition, located in Burgheim, Germany, for preparing the milk replacer.
LITERATURE CITED 1. Schulte-Märter F. Calve diseases during a period of 16 years (Inquiry at a university clinic from 1980 until 1995). [dissertation]. School of Veterinary Medicine Hannover; 2000. 2. Macfarlane S., Macfarlane G.T., Cummings J.H. Review article: prebiotics in the gastrointestinal tract. Aliment. Pharmacol. Ther. 2006; 24:701-714. 3. Novak J., Katz J.A. Probiotics and prebiotics for gastrointestinal infections. Curr. Infect. Dis. Rep. 2006; 8:103-109. 4. Battle M., Martin T., Fulton J. Lactulose may help prevent urinary tract infections. BMJ 2001; 323:936.5. Brannner G.R., Roth-Maier D.A. Influence of pre-, pro-, and synbiotics on the intestinal availability of different B-vitamins. Arch. Anim. Nutr. 2006; 60(3):191-204. 6. Schley P.D., Field C.J. The immune-enhancing effects of dietary fibres and prebiotics. Br. J. Nutr. 2002; 87(2):S221-S230. 7. Wilson R.A., Zolnai A., Rudas P., Frenyo L.V. T-cell subsets in blood and lymphoid tissues obtained from foetal calves, maturing calves, and adult bovine. Vet. Immunol. Immunopathol . 1996; 53:49-60. 8. Watzl B., Girrbach S., Roller M. Inulin, oligofructose and immunomodulation. Br. J. Nutr. 2005; 93(1):S49-S55. 9. Gibson G.R., Beatty E.R., Wang X., Cummings J.H. Selective stimulation of bifidobacteria in the human colon by oligofructose and inulin. Gastroenterology 1995; 108:975-982. 10. Fooks L.J., Gibson G.R. Probiotics as modulators of the gut flora. Br. J. Nutr. 2002; 88:S39-S49.
11. Isolauri E., Sutas Y., Kankaanpaa P., Arvilommi H., Salminen S. Probiotics: effects on immunity. Am. J. Clin. Nutr. 2001; 73:444S-450S. 12. Stewart R.J., Kashour T.S., Marsden P.A. Vascular endothelial platelet endothelial adhesion molecule-1 (PECAM-1) expression is decreased by TNF-alpha and IFN-gamma. Evidence for cytokine-induced destabilization of messenger ribonucleic acid transcripts in bovine endothelial cells. J. Immunol. 1996; 156:1221-1228. 13. Otte J.M., Podolsky D.K. Functional modulation of enterocytes by gram-positive and gram-negative microorganisms. Am. J. Physiol. Gastrointest. Liver Physiol. 2004; 286:G613-G626. 14. Bai A.P., Ouyang Q., Zhang W., Wang C.H., Li S.F. Probiotics inhibit TNF-alpha-induced interleukin-8 secretion of HT29 cells. World J. Gastroenterol. 2004; 10:455-457. 15. Willard M.D., Simpson R.B., Cohen N.D., Clancy J.S. Effects of dietary fructo-oligosaccharide on selected bacterial populations in feces of dogs. Am. J. Vet. Res. 2000; 61: 820-825. 16. Benyacoub J., Perez P.F., Rochat F., et al. Enterococcus faecium SF68 enhances the immune response to Giardia intestinalis in mice. J. Nutr. 2005; 135:1171-1176. 17. Benyacoub J., Czarnecki-Maulden G.L., Cavadini C., Sauthier T., Anderson R.E., Schiffrin E.J. Supplementation of food with Enterococcus faecium (SF68) stimulates immune functions in young dogs. J. Nutr. 2003; 133:1158-1162. 18. Roller M., Rechkemmer G., Watzl B. Prebiotic inulin enriched with oligofructose in combination with the probiotics Lactobacillus rhamnosus and Bifidobacterium lactis modulates intestinal immune functions in rats. J. Nutr. 2004; 134:153-156. 19. Hosono A., Ozawa A., Kato R., Ohnishi Y., Nakanishi Y., Kimura T., Nakamura R. Dietary fructooligosaccharides induce immunoregulation of intestinal IgA secretion by murine Peyer's patch cells. Bioscience Biotechn. Biochem. 2003; 67:758-764. 20. Fleige S., Preißinger W., Meyer H.H.D., Pfaffl M.W. Effects of lactulose on growth performance and intestinal morphology of pre-ruminant calves using a milk replacer containing Enterococcus faecium. Animal 2007; 1:367-373. 21. Mowat A.M. Anatomical basis of tolerance and immunity to intestinal antigens. Nat. Rev. Immunol. 2003: 3:331-341. 22. Dacie J.V., Lewis S.M. Practical Haematology, 6th ed., 1984; 50–56. Edinburgh, Scotland: Churchill Livingstone. 23. Fleige S., Pfaffl M.W. RNA integrity and the effect on the real-time qRT-PCR performance. Mol. Aspects Med. 2006; 27:126-139.
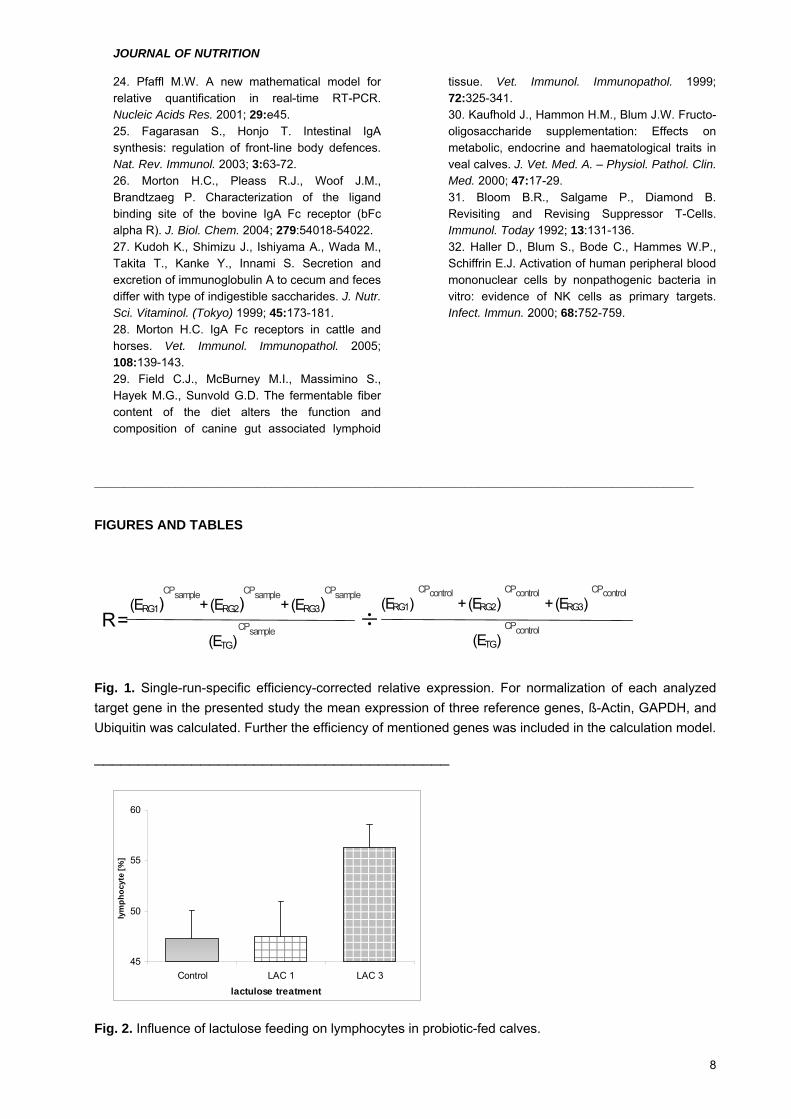
JOURNAL OF NUTRITION
24. Pfaffl M.W. A new mathematical model for relative quantification in real-time RT-PCR. Nucleic Acids Res. 2001; 29:e45.
8
45
50
55
60
Control LAC 1 LAC 3lactulose treatment
lym
phoc
yte
[%]
25. Fagarasan S., Honjo T. Intestinal IgA synthesis: regulation of front-line body defences. Nat. Rev. Immunol. 2003; 3:63-72. 26. Morton H.C., Pleass R.J., Woof J.M., Brandtzaeg P. Characterization of the ligand binding site of the bovine IgA Fc receptor (bFc alpha R). J. Biol. Chem. 2004; 279:54018-54022. 27. Kudoh K., Shimizu J., Ishiyama A., Wada M., Takita T., Kanke Y., Innami S. Secretion and excretion of immunoglobulin A to cecum and feces differ with type of indigestible saccharides. J. Nutr. Sci. Vitaminol. (Tokyo) 1999; 45:173-181. 28. Morton H.C. IgA Fc receptors in cattle and horses. Vet. Immunol. Immunopathol. 2005; 108:139-143. 29. Field C.J., McBurney M.I., Massimino S., Hayek M.G., Sunvold G.D. The fermentable fiber content of the diet alters the function and composition of canine gut associated lymphoid
tissue. Vet. Immunol. Immunopathol. 1999; 72:325-341. 30. Kaufhold J., Hammon H.M., Blum J.W. Fructo-oligosaccharide supplementation: Effects on metabolic, endocrine and haematological traits in veal calves. J. Vet. Med. A. – Physiol. Pathol. Clin. Med. 2000; 47:17-29. 31. Bloom B.R., Salgame P., Diamond B. Revisiting and Revising Suppressor T-Cells. Immunol. Today 1992; 13:131-136. 32. Haller D., Blum S., Bode C., Hammes W.P., Schiffrin E.J. Activation of human peripheral blood mononuclear cells by nonpathogenic bacteria in vitro: evidence of NK cells as primary targets. Infect. Immun. 2000; 68:752-759.
_________________________________________________________________________________
FIGURES AND TABLES
(E RG1 ) CP sample
(E TG )CP sample ÷ R =
+ (ERG2)CPcontrol
(ETG)CPcontrol
+ (E RG2)CP sample
(ERG1)CPcontrol
+ (E RG3 ) CPsample
+ (E RG3 ) CP control
Fig. 1. Single-run-specific efficiency-corrected relative expression. For normalization of each analyzed target gene in the presented study the mean expression of three reference genes, ß-Actin, GAPDH, and Ubiquitin was calculated. Further the efficiency of mentioned genes was included in the calculation model.
________________________________________
Fig. 2. Influence of lactulose feeding on lymphocytes in probiotic-fed calves.

JOURNAL OF NUTRITION
Tab. 1. Primers used for quantitative one-step RT-PCR.
Identity Sequence [5'-> 3'] Size [bp] Accession No
FOR AAC TCC ATC ATG AAG TGT GAC G ß-Actin REV GAT CCA CAT CTG CTG GAA GG
202 AY141970
FOR GTC TTC ACT ACC ATG GAG AAG G GAPDH REV TCA TGG ATG ACC TTG GCC AG
197 U85042
FOR AGATCCAGGATAAGGAAGGCAT Ubiquitin REV GCTCCACCTCCAGGGTGAT
198 Z18245
FOR TTC TCT CCA GCC AAC CTT CAT T IL-1ß REV ATC TGC AGC TGG ATG TTT CCA T
198 M37211
FOR CCA CGT TGT AGC CGA CAT C TNF-α REV CCC TGA AGA GGA CCT GTG AG
197 NM173966
FOR ATG ACT TCC AAG CTG GCT GTT G IL-8 REV TTG ATA AAT TTG GGG TGG AAA G
149 AF232704
FOR ACG TCA CTG GAG TTG TGC GG TGF-ß1 REV TTC ATG CCG TGA ATG GTG GCG
267 XM592497
FOR CCT GGA AGA GGT GAT GCC AC IL-10 REV GTT TTC GCA GGG CAG AAA GCG
132 U00799
FOR CTT GAA TGG CAG CTC TGA GAA AC IFN-γ REV GGC CTC GAA AGA GAT TCT GAC
112 M29867
FOR GAC AAA CCC TTT CTC TCC ACC IgA FcR (CD89) REV ACA GGA CCC AGA GTG AAG TC
180 AY247821
FOR ATG GAG CCA AGC TTG CTG ATG T CD25 REV TCT GCG GAA GCC TGT CTT GCA
171 NM_174358
FOR GTC ATT GAT TCT AAA GAG GAC ATG A CD69 REV AGG TTG AAC CAG TTG TTA AAT TCT
137 AF272828
FOR GAT CGA GGT CTT GCC TTC AG CD4 REV GAT CTG AGA CAT CCG TTC TGC
237 Multi
FOR ACT GTG TAT GGC AAG GAG GTG CD8 REV GGG TAT CCC AAT GAT CAT GCA G
127 XM585436
9

JOURNAL OF NUTRITION
Tab. 2.: Diverse CD markers: CD4 and CD8 for the different population of lymphocytes, and the
activation markers CD25 and CD69. Data are presented as relative expression (shown as x-fold
regulation) in means of male and female calves ± SEM (n=7). Up-regulated genes are shown as values
higher than 1 and down-regulated genes as values lower than 1. Significant effects of lactulose are
marked with an asterisk (* P<0.05) and trends of regulation are shown with plus (+ 0.05<P<0.1). The
control groups have a constant level of 1 ± SEM.
CD4 CD8 CD25 CD69
tissue group sex x-fold reg. SEM P-
value x-fold reg. SEM P-
valuex-fold reg. SEM P-
value x-fold reg. SEM P-
value
male 1.0 0.28 1.67 0.49 1.62 0.57 1.78 0.42 L1 female 0.40 0.06 * 0.42 0.11 0.89 0.43 0.65 0.12
male 0.97 0.34 1.66 0.57 0.50 0.18 1.12 0.20
10
ileum
L3 female 0.60 0.21 0.80 0.21 1.39 0.43 1.27 0.46
male 1.78 0.39 + 1.27 0.37 0.92 0.40 1.37 0.22 L1 female 0.49 0.10 * * 0.96 0.26 1.58 0.52 1.20 0.28
male 1.17 0.37 1.15 0.18 0.43 0.10 * 1.07 0.25 mLN
L3 female 0.75 0.09 0.88 0.20 1.63 0.29 0.95 0.14
male 1.70 0.53 0.69 0.22 1.35 0.62 0.44 0.13 L1 female 0.66 0.17 0.80 0.31 0.80 0.45 0.75 0.34
male 0.90 0.17 1.56 0.43 1.09 0.31 0.35 0.11 * spleen
L3 female 0.72 0.18 0.55 0.13 0.58 0.36 0.58 0.15
male 1.06 0.23 0.68 0.10 1.06 0.27 0.74 0.17 L1
female 1.56 0.43 2.10 0.42 * 1.53 0.28 2.00 0.39 +
male 1.07 0.22 0.46 0.16 1.34 0.35 1.34 0.38 WBC
L3 female 0.83 0.20 1.31 0.24 1.43 0.29 1.63 0.25

JOURNAL OF NUTRITION
Tab. 3.: Effect on the IgA FcR mRNA expression in the ileum and blood. Data are presented as relative
expression (shown as x-fold regulation) in means of male and female calves ± SEM (n=7). Up-regulated
genes are shown as values higher than 1 and down-regulated genes as values lower than 1. Significant
effects of lactulose are marked with an asterisk (* P<0.05) and trends of regulation are shown with plus (+
0.05<P<0.1). The control groups have a constant level of 1 ± SEM.
IgA FcR
tissue group sex x-fold reg. SEM P-value
male 2.61 0.67 * L1
female 1.29 0.28
male 2.03 0.52 + ileum
L3 female 1.75 0.49
male 1.12 0.31 L1
female 1.24 0.33
male 2.19 0.73 blood
L3 female 1.43 0.45
11