Embed Size (px)
Citation preview

Reis. Rev.Esp.Investig.Sociol. ISSN-L: 0210-5233. N.º 171, Julio - Septiembre 2020, pp. 43-62
doi:10.5477/cis/reis.171.43
La segregación ocupacional por sexo. Evolución en España 2001-2011: diez años de caminar sin avanzar
Occupational Segregation by Sex in Spain 2001-2011: Ten Years without Progress
Marta Ibáñez y María Rosalía Vicente
Palabras claveCenso
Encuesta de •Estructuras Salariales (EES)
Encuesta de •Población Activa (EPA)
Ocupaciones •femeninas
Ocupaciones •masculinas
Regresión •multinomial
ResumenFrente a la idea general de que la segregación ocupacional es un fenómeno en retroceso, se comprueba su aumento en España entre los Censos de 2001 y 2011. Replicando una investigación anterior (Ibáñez, 2008), se comparan resultados entre la Encuesta de Población Activa (EPA) y la de Estructuras Salariales (EES). Los resultados invitan a adoptar una perspectiva compleja, y subrayan la preocupante permanencia de la segregación laboral femenina. Las mujeres no han conseguido entrar ni en ocupaciones tradicionalmente masculinas no cualificadas pero con altas remuneraciones, ni tampoco en aquellas nuevas ligadas a actividades de la informática que requieren una elevada cualificación y perciben una elevada remuneración. Queda patente así que la segregación laboral es, y sigue siendo, una fuente de discriminación entre los sexos.
Key wordsCensus
Wage Structure •Survey
Economically Active •Population Survey
Female Occupations•Male Occupations•Multinomial •
Regression
AbstractContrary to the general idea that occupational segregation is a declining phenomenon, it increased in Spain between 2001 and 2011. We replicate a previous study (Ibáñez, 2008) and compare findings from the Economically Active Population Survey and the Wage Structure Survey. Results suggest a complex situation and raise concern about the continuation of women’s occupational segregation. Women have not been able to access traditional male or skilled high salary occupations, nor new highly qualified and paid occupations in the fields of computer and data science. Hence, labour market segregation is still a source of discrimination between the sexes.
Cómo citarIbáñez, Marta y Vicente, María Rosalía (2020). «La segregación ocupacional por sexo. Evolución en España 2001-2011: diez años de caminar sin avanzar». Revista Española de Investigaciones Sociológicas, 171: 43-62. (http://dx.doi.org/10.5477/cis/reis.171.43)
La versión en inglés de este artículo puede consultarse en http://reis.cis.es
Marta Ibáñez: Universidad de Oviedo, Departamento de Sociología | [email protected]
María Rosalía Vicente: Universidad de Oviedo, Área de Estadística y Econometría | [email protected]

44 La segregación ocupacional por sexo. Evolución en España 2001-2011: diez años de caminar sin avanzar
Reis. Rev.Esp.Investig.Sociol. ISSN-L: 0210-5233. N.º 171, Julio - Septiembre 2020, pp. 43-62
IntroduccIón
Hablar de segregación ocupacional por género sigue teniendo sentido por distin-tos motivos. Desde la teoría sociológica, porque la segregación ocupacional es un indicador de la división sexual del trabajo, piedra angular del patriarcado. Su análisis nos da pistas sobre cómo se concreta en la actualidad la primera división social (el gé-nero), es decir, qué cualidades se adscri-ben a lo masculino y lo femenino. El interés teórico no es el único. La interiorización de este orden social (trabajos «masculinos» y trabajos «femeninos») condiciona las deci-siones formativas y laborales de hombres y mujeres, reduciendo el número de posibles elecciones. Además, hay suficiente eviden-cia empírica como para afirmar que los tra-bajos ocupados mayoritariamente por mu-jeres tienen peores condiciones laborales y, sobre todo, que la segregación ocupacio-nal es una de las fuentes fundamentales de la diferencia salarial por género (Polavieja, 2008: 199). Su interés también es político.
En este sentido, aunque la evolución ge-neral de los indicadores laborales nos mues-tra que hombres y mujeres se van pare-ciendo (especialmente en cuanto a las tasas de empleo y paro, o al tiempo de vida en el mercado laboral), una mala noticia es que no es así con la división sexual del trabajo. En España, la segregación ocupacional por sexo es elevada (Jarman et al., 2012: 1009) y no disminuye sustancialmente desde la dé-cada de los años noventa del pasado siglo (Cebrián y Moreno, 2008: 129; Ibáñez y Vi-cente, 2017: 24). Una tendencia que se inicia más tarde en otros países, y se generaliza (Cohen, 2013, para los Estados Unidos).
Nuestro objetivo en estas páginas es doble y así se refleja en la estructura del texto. En la primera parte, más descriptiva, se comprueba la evolución de la segrega-ción ocupacional en España. Para ello se repasan los resultados obtenidos en las
distintas investigaciones completando algu-nos aspectos con análisis ad hoc. En con-creto, se visualizan las diferencias a través de las curvas de Lorenz de ambos años; se identifican las ocupaciones masculinas y fe-meninas más segregadas y sus diferencias en la década, mostrando cómo las ocupa-ciones masculinas sufren cambios mien-tras que las femeninas se mantienen; y se comprueba cómo estas ocupaciones feme-ninas presentan un perfil propio. Todo ello utilizando los censos de habitantes, lo cual resulta muy interesante para la elaboración de índices de segregación pues estos son especialmente sensibles al número de uni-dades, en nuestro caso de ocupaciones.
La segunda parte pretende comprobar hasta qué punto esta segregación es una fuente de discriminación, o en otras pala-bras, si ceteris paribus el resto de factores, los trabajos femeninos presentan diferentes características y recompensas que los mas-culinos o los neutros. Esta parte es conti-nuación de Ibáñez (2008)1. Allí se analizaban las características (de los/las trabajadoras y los puestos, y de las empresas) asociadas a las ocupaciones masculinas, femeninas y mixtas con la Encuesta de Población Activa (EPA) y la Encuesta de Estructura Salarial (EES) de 2002. Aquí se retoma esta metodo-logía utilizando datos de diez años después. Los objetivos son obvios: concretar qué cambios se han producido en estos años, habida cuenta del cambio estructural acon-tecido en el mercado de trabajo: mayor peso de las ocupaciones profesionales y de los trabajadores de los servicios, dos caracterís-ticas tradicionalmente asociadas al empleo femenino (Garrido y González, 2005).
Con todo esto, el presente trabajo realiza tres contribuciones a la literatura. En primer lugar, si bien estudios previos han analizado
1 Como este trabajo continúa a otro ya publicado, se ha evitado la repetición de cierta información, por ejemplo, las referencias anteriores a 2008 (ya utilizadas) centrán-donos en las aportaciones de los diez últimos años.

Reis. Rev.Esp.Investig.Sociol. ISSN-L: 0210-5233. N.º 171, Julio - Septiembre 2020, pp. 43-62
Marta Ibáñez y María Rosalía Vicente 45
la evolución de la segregación ocupacio-nal en España en periodos similares al aquí considerado (Alonso-Villar y Río, 2010; Igle-sias y Llorente, 2010; Aldaz y Eguía, 2016; Dueñas et al., 2014 y 2016), en general sus análisis se basan en el cálculo de índices de segregación, descomponiéndolos por gru-pos sociodemográficos. Esta perspectiva, siendo útil para captar la evolución general de la segregación, no permite identificar al-teraciones en la importancia de los distintos factores asociados. Cambios que sí se pue-den identificar con el enfoque aquí adoptado mediante la estimación de regresiones logís-ticas multinomiales y la comparación con los resultados de 2001. En segundo lugar, al de-finir el tipo de ocupación (femeninas, mas-culinas, mixtas) a partir de la información del Censo, se evitan posibles errores muestra-les, frente a la práctica tradicional de definir-las sobre la información de encuestas mues-trales. En tercer lugar, el uso de dos fuentes de datos nos permitirá apreciar la robustez de los resultados y, así, las características inequívocas de la segregación al margen de la fuente empleada2.
EvolucIón dE la sEgrEgacIón ocupacIonal En España
A lo largo de la década 2001-2011 la so-ciedad española y su mercado laboral prota-gonizan fuertes cambios. Por un lado, la po-blación española pasa de casi 38,5 millones de habitantes a 46,5 millones, con el consi-guiente incremento del número de activos, de 18,5 millones en 2001 a casi 25 millones en 2011 (INE, 2011a). Por otro lado, la fuerte crisis económica y laboral que se vive desde 2008 (con tasas de paro del 20%, que llega-rán al 27% en 2013). Estos dos fenómenos, el aumento de activos y el de parados, son
2 El artículo dispone de material suplementario en la web del grupo de investigación: https://www.unioviedo.es/mi-banez/WordPress/es/mujeres-en-mundos-de-hombres/
una realidad completamente distinta para cada uno de los géneros, que se concreta en las diferencias intercensales de los ocupa-dos. Mientras que los varones han perdido más de medio millón de trabajadores en es-tos diez años (que han ido a engrosar el paro y la inactividad), en 2011 han entrado a la ocupación más de millón y medio de muje-res, reduciéndose el número de inactivas.
¿Qué trabajos desempeñan esas casi 1.700.000 nuevas mujeres ocupadas que han hecho que las tasas de ocupación fe-meninas casi se igualen a las masculinas? En general, los mismos que venían ocu-pando, pues los índices de segregación en España se mantienen elevados. Así, Bet-tio y Verashchagina (2009) en un informe para la Comisión Europea, y Aldaz y Eguía (2016a) coinciden al calcular —mediante el índice de Karmel y Maclachlan3 y datos de la EPA— que el 25% de las mujeres ocupa-das debería cambiar de ocupación para que desapareciese la segregación en España.
Ibáñez y Vicente (2017: 24) confirman este aumento de la segregación —con da-tos de los Censos de Población— obte-niendo que el índice de Gini pasa de 0,32 en 2001 a 0,37 en 2011, y el de disimilaridad de 30,5 a 32,4. El gráfico 1 muestra estos re-sultados con la curva de Lorenz, donde la diagonal representaría el reparto perfecta-mente igualitario de varones y mujeres en-tre las ocupaciones. Es evidente el aumento en la segregación que se ha producido entre 2001 y 2011. En concreto, se observa que las ocupaciones feminizadas cada vez lo es-tán más: por ejemplo, el 40% de las muje-res ocupadas —el punto 40 horizontal— es-taba trabajando en ocupaciones en las que en 2001 había un 15% del total de varones, mientras que en 2011 pasa a solo un 10%; mientras que los varones siguen trabajando en ocupaciones a las que no entran mujeres, con pocos cambios en estos diez años.
3 Véase Ibáñez y Vicente (2017) para una revisión de estos índices.

46 La segregación ocupacional por sexo. Evolución en España 2001-2011: diez años de caminar sin avanzar
Reis. Rev.Esp.Investig.Sociol. ISSN-L: 0210-5233. N.º 171, Julio - Septiembre 2020, pp. 43-62
GRáfIco 1. Curva de Lorenz de ocupaciones según su proporción de mujeres y varones
10080604020
2011 2001 Equidistribución
10
20
30
40
50
60
70
80
90
100
00
Fuente: Elaboración propia a partir de INE (2011a).
Algo especialmente interesante es la di-ferencia entre los años de crecimiento y la crisis económica. La segregación aumenta hasta el año 2008 (Iglesias y Llorente, 2010; Dueñas et al., 2014, mediante el índice de Duncan con datos de la EPA y la Encuesta de Condiciones Laborales, respectiva-mente), cuando entran al mercado de tra-bajo la gran mayoría de ese millón y medio de nuevas trabajadoras; y tiende a dismi-nuir ligeramente en esos años de la crisis, cuando salen del empleo más varones (re-cordemos la crisis de la construcción) (Bet-tio y Verashchagina, 2009).
España no es un caso aislado. Frente a la disminución de los índices de segregación ocupacional en los años setenta y ochenta del pasado siglo, en los últimos 20 años la tendencia se desacelera y/o se estanca en los países anglosajones (Blau et al., 2013; Hegewisch y Hartmann, 2014, para EE.UU.; Dueñas et al., 2014, para Reino Unido), y los
cambios en el mercado laboral producto de la globalización no lo evita (Gauchat et al., 2012); aunque con diferentes ritmos e in-tensidades según países (Murphy y Oesch, 2016; Dueñas et al., 2014).
Este aumento de la segregación ocu-pacional en España no ha sido homogé-neo. Analizando segregación masculina y femenina por separado, Alonso-Villar y Río (2010) —con datos EPA 1994-2009— con-cluyen que, para la etapa analizada, siendo la segregación mucho mayor para las muje-res, la evolución por sexos ha sido distinta: entre los varones ha aumentado la segrega-ción, mientras que entre las mujeres ha dis-minuido levemente (ibid.: 113).
También se han observado diferencias según edad, nivel educativo, tipo de con-trato y tipo de trabajo, siendo mayor en los/las jóvenes (también en las mujeres mayo-res), entre los niveles educativos más altos, en los trabajos temporales que ocupan los

Reis. Rev.Esp.Investig.Sociol. ISSN-L: 0210-5233. N.º 171, Julio - Septiembre 2020, pp. 43-62
Marta Ibáñez y María Rosalía Vicente 47
varones (entre las mujeres es alta también en indefinidos) y en los trabajos a tiempo parcial que ocupan las mujeres (Río y Alon-so-Villar, 2010). En cuanto a la edad, Aldaz y Eguía (2016b) —con datos EPA 2002-2014— muestran que «la intensidad de la segregación se acentúa en función de la edad entre las mujeres» (ibid.: 133); hecho que Torre (2017) explica, para los Estados Unidos, por el desgaste y posterior aban-dono de las mujeres en ocupaciones muy masculinas —especialmente las de menor estatus—.
Por grandes grupos ocupacionales, Ibá-ñez y Vicente (2017) —con datos censa-les— identifican las categorías donde más ha aumentado la segregación en el periodo 2001-2011: las mujeres en «Trabajadores de los servicios de restauración, persona-les, protección y vendedores», «Ocupacio-nes elementales» y «Empleados contables, administrativos y otros empleados de ofi-cina»; mientras que los varones en «Arte-sanos y trabajadores cualificados de las industrias manufactureras y de la construc-ción» (ibid.: 31).
Tabla 1. Listado de ocupaciones más y menos segregadas (CNO-11)
Las 10 ocupaciones más segregadas a favor de los varones (12,5% de los varones)
Índice de segregación parcial
593 – Bomberos –0,958
740 – Mecánicos y ajustadores de maquinaria –0,954
751 – Electricistas de la construcción y afines* –0,927
723 – Pintores, empapeladores y afines –0,917
591 – Guardias civiles –0,911
834 – Marineros de puente, marineros de máquinas y afines –0,908
843 – Conductores de camiones –0,908
712 – Albañiles, canteros, tronzadores, labrantes y grabadores de piedras –0,906
711 – Trabajadores en hormigón, encofradores, ferrallistas y afines –0,905
001 – Oficiales y suboficiales de las Fuerzas Armadas –0,905
Las 10 ocupaciones más segregadas a favor de las mujeres (25% de las mujeres)
910 – Empleados domésticos 25,674
571 – Trabajadores de los cuidados personales a domicilio (excepto cuidado-res de niños)
14,056
561 – Auxiliares de enfermería 11,266
225 – Maestros y educadores de enseñanza infantil 10,226
572 – Cuidadores de niños 9,020
921 – Personal de limpieza de oficinas, hoteles y otros establecimientos similares 6,801
581 – Peluqueros y especialistas en tratamientos de estética, bienestar y afines 5,986
212 – Profesionales de enfermería y partería 4,989
361 – Asistentes administrativos y especializados 3,596
282 – Sociólogos, historiadores, psicólogos y otros profesionales en ciencias sociales
3,198
Nota: Las ocupaciones en cursiva coinciden con Ibáñez (2008). *El tercer puesto corresponde a «283 – Sacerdotes de las distintas religiones», que no se ha incluido dado su bajo número de observaciones.
Fuente: Elaboración propia a partir INE (2011a).

48 La segregación ocupacional por sexo. Evolución en España 2001-2011: diez años de caminar sin avanzar
Reis. Rev.Esp.Investig.Sociol. ISSN-L: 0210-5233. N.º 171, Julio - Septiembre 2020, pp. 43-62
Trabajar con grandes grupos de ca-tegorías puede enmascarar realidades muy distintas entre las ocupaciones de un mismo grupo, especialmente cuando se ha podido comprobar que la dinámica de la segregación ocupacional no es lineal, pro-duciéndose «puntos de inflexión» (tipping) a partir de los cuales una ocupación tradi-cionalmente masculina se convierte rápi-damente en femenina (Pan, 2015, con los Censos de EE.UU. 1940-1990). Si se cal-culan los índices de segregación parcial para cada ocupación al nivel más desa-gregado (tres dígitos de la Clasificación Nacional de Ocupaciones, CNO-11) y se comparan con Ibáñez (2008), se observa que prácticamente no ha habido cam-bios en las ocupaciones más feminizadas: nueve de las diez coinciden con las de 2001. Por el contrario, sí que se observan cambios en las más masculinizadas y neu-tras: solamente coinciden tres de las diez de cada grupo.
consIdEracIonEs tEórIcas
Los factores asociados a que una ocu-pación tenga una mayor presencia feme-nina o masculina pueden ser muy varia-dos. En conjunto los podemos agrupar en las características de los empleados y puestos, y aquellas más estructurales de las empresas. Nos encontramos así, por un lado, con la teoría del capital humano y de las diferencias compensatorias, y por el otro, con la segmentación y la perspectiva de género.
características de los empleados y los puestos
La conocida teoría del capital humano del Nobel de Economía Gary Becker plan-tea que las mujeres realizan una menor in-versión en formación tanto general, que se
concreta en las titulaciones académicas, como específica, experiencia laboral y for-mación en el puesto. Sin embargo, tras-curridos más de 50 años desde su apari-ción, el último Informe de la Organización Internacional del Trabajo (OIT) (ILO, 2018) nos señala que el nivel de estudios ya no es un factor diferenciador entre hombres y mujeres. De hecho, las empleadas tienen similares o mejores niveles educativos que los empleados.
Tradicionalmente, para explicar la se-gregación ocupacional, el nivel de estu-dios se ha considerado la variable más relevante, pues «poseer estudios de ni-vel superior (…) determina la asignación de hombres y mujeres a ramas de acti-vidad u ocupaciones de carácter inte-grado» (Iglesias y Llorente, 2010: 103). Sin embargo, no fue este el resultado de los modelos de Ibáñez (2008): las diplo-maturas presentaban las mayores pro-babilidades de acceder a ocupaciones de mayoría femenina. Interesa entonces comprobar si el fenómeno se mantiene y en qué medida.
Un aspecto asociado con el nivel de estudios es la categoría ocupacional de los puestos. Dejando aparte la discusión de si las cualificaciones asociadas a la socialización de género se infravaloran en el caso femenino (domésticas y de cui-dado), Brynin y Perales (2016), con datos de Reino Unido, señalan diferencias entre las ocupaciones feminizadas que deman-dan cualificaciones medias y altas frente a las no cualificadas, que presentan me-nores ingresos y recompensas. Se espera entonces que entre las ocupaciones femi-nizadas haya serias diferencias según el nivel de estudios requeridos, estando en situación especialmente negativa las ocu-paciones no cualificadas.
E l capi ta l humano especí f ico se concreta en la formación en el puesto. Polavieja (2008), con datos para España

Reis. Rev.Esp.Investig.Sociol. ISSN-L: 0210-5233. N.º 171, Julio - Septiembre 2020, pp. 43-62
Marta Ibáñez y María Rosalía Vicente 49
de la Encuesta Social Europea, ana-liza este aspecto a través de la pregunta «Tiempo que requeriría a una persona con la cualificación correcta aprender a rea-lizar el trabajo». Sus resultados son cla-ros: el efecto de la segregación ocupa-cional en los ingresos desaparece cuando se introduce esta medida de la formación específica para el puesto. Por su parte, Grönlund y Magnusson (2013) comprue-ban igualmente que la segregación ocupa-cional se asocia sobre todo con la forma-ción en el puesto.
Cuando no se cuenta con variables de medición directas, un proxy posible es el número de meses en el puesto. La idea es que aquellos trabajos con mayor forma-ción en el puesto tendrán menor rotación, debido a los gastos en los que se incurre cada vez que entra un/a nueva trabaja-dora. En suma, se espera que los traba-jos feminizados presenten menor tiempo en la empresa y, por lo tanto, mayor rota-ción; una realidad asociada a la tempora-lidad en la contratación. Sin embargo, con datos de 2001 se pudo comprobar que las ocupaciones mayoritariamente femeni-nas presentan mayor probabilidad que las mixtas de conseguir contratos indefinidos (Ibáñez, 2008); de nuevo, interesa com-probar si este fenómeno (que contradice las premisas de la formación en el puesto) se mantiene.
En paralelo con las teorías anteriores, se puede plantear que los trabajos femi-nizados tienen salarios más bajos porque las mujeres quieren trabajos más cómo-dos, más flexibles, con los que compatibi-lizar, trabajar dentro y fuera: las llamadas teorías de las diferencias compensatorias. Las ocupaciones mayoritariamente feme-ninas presentarán por ello una mayor pro-porción de jornadas a tiempo parcial, con-tinuas, en el domicilio, evitando trabajo en fin de semana y festivos, o ampliación de jornadas a tardes y/o noches.
En concreto, el tiempo parcial es co-mún que explique una gran proporción de las diferencias de ingresos entre varones y mujeres. Por ejemplo, Bardasi y Gornick (2008) comprueban que de seis países analizados (Canadá, Alemania, Italia, Sue-cia, Reino Unido y Estados Unidos), solo en uno, Suecia, no está penalizado eco-nómicamente el trabajo a tiempo parcial. Además, las trabajadoras a tiempo parcial tienden a concentrarse en las ocupacio-nes más feminizadas (con datos para Es-paña, Río y Alonso-Villar, 2010: 357; Igle-sias y Llorente, 2010: 103).
El talón de Aquiles de la visión de que las mujeres «eligen» el trabajo a tiempo parcial es el hecho de que la mitad de las mujeres que están trabajando a tiempo parcial es por no haber encontrado nada a tiempo completo (INE, 2011b). Dueñas et al. (2014: 320) introducen este aspecto con la variable «horas de trabajo» distin-guiendo: tiempo completo, parcial por elección y por no elección. Sus resulta-dos, a partir de la Encuesta de Condicio-nes Laborales, muestran que los varones que optan voluntariamente por el tiempo parcial presentan menores probabilidades de acceder a un trabajo masculinizado. Mientras que el tiempo parcial en las mu-jeres (voluntariamente o no) aumenta la probabilidad de acceder a un trabajo fe-minizado.
características de las empresas
No todas las empresas operan bajo las mismas condiciones. Las teorías de la segmentación analizan cómo la titula-ridad de las empresas o instituciones, su tamaño, implantación sindical o la am-plitud de sus mercados, «segmentan» los mercados laborales. A estos facto-res se añade el sector de actividad, el proxy más directo para observar la divi-sión sexual del trabajo y, por lo tanto, la

50 La segregación ocupacional por sexo. Evolución en España 2001-2011: diez años de caminar sin avanzar
Reis. Rev.Esp.Investig.Sociol. ISSN-L: 0210-5233. N.º 171, Julio - Septiembre 2020, pp. 43-62
perspectiva de género. Bajo estas teo-rías, la hipótesis de partida es que los trabajos femeninos estarán en aquellos segmentos con menores recompensas, mayor rotación y, en general, peores con-diciones laborales.
Respecto a la titularidad de la em-presa o institución, diversos factores han sugerido tradicionalmente que las ocupa-ciones con mayoría femenina están aso-ciadas a la titularidad pública. Las razo-nes son variadas: el peso de lo público en sectores muy feminizados (sanidad, educación, cuidado y funcionariado en general); la tendencia a que las mujeres acudan a procesos de selección de tipo universalista (adelantándose a la posible discriminación en la selección); las con-diciones laborales en estas instituciones, especialmente el horario que permite una mejor conciliación con otras responsabi-lidades; y la mayor probabilidad de que los sueldos de los trabajos femeninos sean menores en el sector privado (Mur-phy y Oesch, 2016). Sin embargo, Ibáñez (2008) evidenció la mayor presencia de ocupaciones integradas en el sector pú-blico frente a las segregadas, especial-mente femeninas. Es interesante ver si esta tendencia se ha mantenido a lo largo de estos diez años, o si el sector público se ha convertido en el refugio de las mu-jeres durante el periodo de crisis.
Sobre el tamaño de la empresa, te-niendo en cuenta que a mayor tamaño, mayores salarios medios (Espina, 2016, con datos EPA) y mayor uso de procesos de selección formal (Alonso et al., 2015), es de esperar que a mayor tamaño me-nor segregación femenina. Mientras que, sobre la negociación colectiva, habida cuenta de que los convenios territoria-les reflejan de media mayor tendencia al alza que los de empresa (Goerlich, 2018: 681), se espera que las ocupaciones fe-meninas utilicen más el rango empresa-
rial, y estén menos sujetas a convenio de rango territorial.
Por último, la característica de la em-presa más asociada a la división sexual del trabajo es su rama de actividad, al punto que el último informe de la OIT so-bre las diferencias de ingresos por hora entre sexos señala como elemento fun-damental asociado a la segregación ocu-pacional la polarización por género de sectores y actividades económicas (aso-ciado también a las opciones educati-vas adoptadas en la adolescencia) (ILO, 2018). La perspectiva de género incide en esa reproducción de los roles sexua-les a partir del proceso de socialización y la construcción de la identidad feme-nina/masculina, que genera que varones y mujeres estemos orientados a activida-des específicas y distintas. Y, además, que las mujeres estén concentradas en pocas actividades4. En España, las ra-mas de actividad presentan una muy alta segregación por género (Vicente Merino et al., 2010: 83; Iglesias y Llorente, 2010), de forma que más de la mitad de las mu-jeres trabaja en cuatro sectores (comer-cio, sanidad, educación y hostelería) y más de la mitad de los varones trabaja en otros cuatro (industria manufacturera, comercio, construcción y administración) (Ibáñez y Vicente, 2017).
En suma, se defiende aquí una visión sistémica, pues se entiende que los as-pectos micro y macro, o de acción y es-tructura (y dentro de lo micro, de oferta y demanda) interactúan entre sí y en el tiempo en un juego de expectativas.
4 Con la concentración de las mujeres en pocas activi-dades aparece la hipótesis del amontonamiento (crow-ding) que plantea cómo se produce una sobreoferta de mano de obra y con ello una peor remuneración. Ade-más, como las mujeres tienen pocas ocupaciones entre las que elegir, se rebaja su capacidad de negociación de las condiciones laborales. Sin embargo, con da-tos suecos, no se termina de comprobar esta hipótesis (Grönlund y Magnusson, 2013).

Reis. Rev.Esp.Investig.Sociol. ISSN-L: 0210-5233. N.º 171, Julio - Septiembre 2020, pp. 43-62
Marta Ibáñez y María Rosalía Vicente 51
Dicho de otro modo, no podemos diri-gir la dirección de la causalidad, pues las personas nos adaptamos a los trabajos que se nos ofrecen. Como se ha dicho, nuestra orientación es sistémica y por ello nos interesa observar el conjunto de factores asociados a la segregación ocu-pacional por género, entendiendo que las diferentes orientaciones teóricas y expli-caciones más que excluyentes, son los diferentes aspectos que dan sentido al fenómeno. Es decir, su inclusión en el análisis lo enriquecen.
MEtodología
Al igual que en la investigación de re-ferencia (Ibáñez, 2008), las fuentes em-pleadas son los microdatos de la EPA y la EES (INE, 2010, 2011b), diez años después (EPA11 y EES10, en adelante). Para la comparación de los resultados es necesario tener en cuenta que en es-tos años la EES10 amplía su cobertura en dos sentidos: se amplía el ámbito po-blacional (al incorporar los centros de trabajo de menos de 10 asalariados) y sectorial (INE, 2017: 6). Gracias a este cambio metodológico las muestras de ambas encuestas se parecen mucho más que en 2001. Sí mantienen una diferen-cia metodológica fundamental: su fuente de información; mientras que la EPA se basa en la declaración personal, la EES es completada por la empresa. Su análi-sis en paralelo nos permitirá observar el grado de coherencia entre los coeficien-tes, desechando entonces los resultados no suficientemente congruentes.
La variable de interés, ocupación se-gregada, se ha construido manteniendo los criterios de Ibáñez (2008) y anali-zando exclusivamente a los asalariados. Los tres valores de la variable (ocupacio-nes masculinas, femeninas y mixtas) se definen de forma que serán «ocupacio-
nes segregadas aquellas en las que uno de los sexos está representado 20 pun-tos por encima de la proporción que se recoge en la población estudiada en su conjunto» (Ibáñez, 2008: 104)5. En el caso de la EPA, esta división se ha realizado a partir del Censo de 2011, con lo que se evitan errores muestrales. Teniendo en cuenta que la EPA y la EES tienen dis-tinta población muestral, el punto de re-ferencia en la construcción de esta varia-ble también será distinto: para la EPA11 será el 48 (pues las mujeres suponen el 48% de los asalariados); mientras que en la EES10 la proporción de mujeres es menor: 42,65%.
La variable ocupación tiene distinto nivel de desagregación en la EPA y ESS (a tres y dos dígitos de la CON, respec-tivamente), de forma que presenta dis-tinta distribución en cada una de ellas (tabla 2). Como no podía ser de otra ma-nera, la pérdida de detalle en las ocupa-ciones lleva aparejado una merma en la precisión con la que se captura el fenó-meno de la segregación (Siltanen et al., 1995; Blackburn, 2012).
Como técnica de análisis se ha utilizado el modelo logístico multinomial, donde la variable dependiente es el tipo de ocupa-ción según se trate de femenina, mascu-lina o mixta, tomando esta última como re-ferencia. Como variables independientes se han empleado las utilizadas por Ibáñez (2008) a efectos de poder analizar y com-parar las características de la segregación ocupacional en España en 2001 y 2011. Así, se consideran las características per-sonales de los trabajadores, ocupación, empresa y jornada laboral. En los mode-los con datos EPA11, se han incluido dos
5 Este es un criterio conservador en la literatura desde Rytina (1981) y Sokoloff (1992). Frente al más «agresivo» de Hakim (1998) con +15% o 10%, o Grönlund y Magnusson (2013) el 10%. Hegewisch y Haartmann (2014), Dueñas et al. (2014) utilizan +25%.

52 La segregación ocupacional por sexo. Evolución en España 2001-2011: diez años de caminar sin avanzar
Reis. Rev.Esp.Investig.Sociol. ISSN-L: 0210-5233. N.º 171, Julio - Septiembre 2020, pp. 43-62
variables que estaban ausentes en las es-timaciones de 2001: salario (en decilas) y supervisión a otros trabajadores. Los diez grandes grupos de categorías ocupacio-nales que recoge la CNO-11 se han tenido que reagrupar para evitar los estimadores infinitos producto de valores nulos.
Se presentan los resultados pondera-dos6 a partir del comando MLOGIT del pa-quete STATA©.
rEsultados
La tabla 3 muestra los resultados de las estimaciones de los modelos logit multino-miales; en concreto, se presentan los coefi-cientes estimados cuyo signo nos indica el tipo de asociación (positiva/negativa) exis-tente entre la segregación ocupacional y las variables independientes consideradas.
6 En la EPA no se aprecian cambios al ponderar los da-tos; sin embargo, en la EES hay ciertos cambios en los resultados de algunas categorías.
Desde la teoría del capital humano se ha defendido tradicionalmente que las ocupa-ciones femeninas están asociadas a menor nivel de estudios, y con ello a menores sa-larios. Los resultados de 2001 habían des-montado la primera parte de esta hipótesis al mostrar evidencia de que las ocupacio-nes femeninas estaban asociadas a niveles de estudios superiores a los de las neutras, especialmente por el peso de las diploma-turas. Sin embargo, se cumplía la segunda parte mostrando claramente la relación ne-gativa entre salario y ocupaciones feme-ninas. Los datos de 2011 de las dos en-cuestas analizadas vuelven a confirmar la asociación positiva entre estudios superio-res y ocupaciones femeninas, así como el resultado relativo a las diplomaturas.
En cuanto al salario, las estimaciones ratifican los patrones de remuneración ob-servados en 2001 en las ocupaciones se-gregadas, con las femeninas percibiendo salarios (significativamente) menores que las neutras mientras que las masculinas ob-tienen salarios (significativamente) mayores.
TabLa 2. Clasificación de ocupaciones masculinas, femeninas y neutras
TRabaJaDORES (en %) OCUPaCIONES (en %)
Censo11Ocupados(55v/45m)*
EPa11Ocupados
(55/45)
EPa11asalariados
(52/48)
EES10asalariados
(57/43)
EPa11asalariados
(52/48)
EES10asalariados
(57/43)
Ocupaciones masculinas 30,80 30,24 29,94 21,48 46 26,6
Ocupaciones femeninas 33,20 30,99 35,15 31,10 16 26,6
Ocupaciones mixtas 36,00 38,77 34,91 47,42 37 46,8
TOTAL 100 100 100 100 100 100
17.514.550
Muestra 38.395
Población18.398.840
Muestra31.441
Población15.367.561
Muestra195.777
Población10.772.181
(N = 166) (N = 60)
Nota: *Proporciones de hombres y mujeres sobre las que se calculan los tres valores de la variable dependiente Ocupación segregada (20 puntos por encima).
Fuente: Elaboración propia a partir de INE (2010, 2011a y 2011b).

Reis. Rev.Esp.Investig.Sociol. ISSN-L: 0210-5233. N.º 171, Julio - Septiembre 2020, pp. 43-62
Marta Ibáñez y María Rosalía Vicente 53
Tabla 3. Resultados de las estimaciones de los modelos logit multinomiales sobre la segregación ocupacional
EPa 2011Ocup. Masc.
Ocup.Fem.
EES 2010OcupMasc.
Ocup Fem.
EDAD –0,014*** –0,002 EDAD 0,004*** 0,014***
SEXO (Ref. Varón) SEXO (Ref. Varón)
Mujer –1,514*** 1,358*** Mujer –2,054*** 1,189***
NIVEL DE ESTUDIOS (Ref. Grado y más) NIVEL DE ESTUDIOS (Ref. Grado y más)
Primaria y menos 0,352*** 0,215* Primarios 0,730*** –0,206***
Secundarios obligatorios 0,763*** 0,370*** ESO 0,818*** –0,206***
Bachiller 0,710*** 0,750*** Bachiller 0,751*** 0,136**
FP2 0,827*** 0,664*** FP1 1,045*** 0,009
FP3 y + 0,675*** 0,579*** FP2 1,057*** 0,073
Diplomaturas y Tít. propios 0,739*** 1,737*** Diplomatura –0,084 0,195***
SALARIO en decilas 0,167*** –0,048*** SALARIO/HORA 0,032*** –0,025***
CAT. OCUPACIONAL (Ref. Directivos y profesionales) CAT. OCUPACIONAL
(3) Técnicos de apoyo 1,382*** 0,934*** (3) Técnicos de apoyo 2,786*** 1,226***
(4+5) Empleados de oficina y atención al público
0,387*** 1,469***(4+5) Empleados de oficina y atención al público
3,615*** 1,730***
(6+7+8+9) Trabajadores manuales 2,592*** 1,188*** (6+7+8+9) Trabajadores manuales 5,758*** 1,184***
TIPO DE CONTRATO (Ref. Temporal) DURACIÓN DEL CONTRATO
Indefinido 0,335*** 0,203*** Indefinido 0,058* 0,143***
MESES EN LA EMPRESA –0,001*** 0,001*** MESES EN LA EMPRESA –0,003 0,005
SUPERVISIÓN (Ref. No) SUPERVISIÓN
Sí 0,218*** –0,774*** Sí 0,785*** –0,206***
SEC. PÚBLICO O PRIVADO PROPIEDAD O CONTROL
Asalariado, Sector Público –0,848*** 0,206** Público –0,006 0,395***
TIPO DE JORNADA (Ref. Tiempo completo) TIPO DE JORNADA (Ref. Tiempo completo)
No encontrar –0,044 0,191* Tiempo parcial –0,595*** 0,579***
No querer 0,473* 0,317*
Otros 0,435*** 0,109
TAMAÑO (Ref. de 50 y más empleados) TAMAÑO ESTABLECIMIENTO (Ref. 50 y +)
De 0 a 5 empleados –0,009 0,067 De 1 a 4 empleados 0,310*** 0,003
de 6 a 10 y No Sabe pero < 10 –0,012 0,101 De 5 a 9 empleados 0,184*** –0,132**
de 11 a 19 empleados 0,150 0,411*** De 10 a 19 empleados 0,266*** –0,011
de 20 a 49 empleados 0,021 0,388*** De 20 a 49 empleados 0,126*** –0,071*
No Sabe pero más de 10 0,012 0,314***
NS/NC 0,026 0,006
RAMA DE ACTIVIDAD (Ref. Actividades financieras) RAMA DE ACTIVIDAD (Ref. Actividades financieras)
(A) Agricultura, ganadería y pesca 1,123*** –1,820***
(B+D+E) Ind. extractivas, Ener-gía Agua
3,115*** 1,071***(B+D+E) Ind. extractivas, Energía Agua
1,489*** –0,140**
(C) Industria Manufacturera 2,015*** 0,071 (C) Industria Manufacturera 1,467*** –0,594***
(F) Construcción 3,592*** 1,211*** (F) Construcción 4,146*** 0,579***

54 La segregación ocupacional por sexo. Evolución en España 2001-2011: diez años de caminar sin avanzar
Reis. Rev.Esp.Investig.Sociol. ISSN-L: 0210-5233. N.º 171, Julio - Septiembre 2020, pp. 43-62
EPa 2011Ocup. Masc.
Ocup.Fem.
EES 2010OcupMasc.
Ocup Fem.
(G) Comercio y reparaciones 2,251*** 1,475*** (G) Comercio y reparaciones 1,710*** 1,322***
(H) Transporte y almacenamiento 3,239*** 0,927*** (H) Transporte y almacenamiento 2,690*** –0,215***
(I) Hostelería –0,814*** –0,319** (I) Hostelería –0,098 –0,360***
(J) Información y Comunicaciones 2,372*** 0,484** (J) Información y Comunicaciones 1,707*** –0,266***
(M) Activi. profesionales, científi-cas y técnicas
1,573*** 0,662***(M) Activi. profesionales, cientí-ficas y técnicas
1,238*** 0,582***
(N) Acti. Administrativas y Serv. auxiliares
2,979*** 2,539***(N) Acti. Administrativas y Serv. auxiliares
2,850*** 1,568***
(O+U) Admon. Pública y Defensa 3,663*** 1,562*** (O+U) Admon. Pública y Defensa 3,705*** 1,022***
(P) Educación 0,969*** 1,306*** (P) Educación 1,364*** 0,119
(Q) Sanidad y Servicios Sociales 1,056*** 2,155*** (Q) Sanidad y Servicios Sociales 3,463*** 3,589***
(R) Act. Artísticas, recreativas y de entretenimiento
0,880*** –0,185(R) Act. Artísticas, recreativas y de entretenimiento
1,971*** 0,232***
(S) Otros Servicios 1,918*** 1,800*** (S) Otros Servicios 1,598*** –0,536***
(T) Servicio doméstico en los hogares 0,774** 2,860***
TRAB. EN EL DOMICILIO (Ref. Ningún día)MERCADO DE LA EMPRESA (Ref. Unión Europea e internacional)
No sabe 0,210 –0,521** Local o regional 0,466*** 0,300***
Ocasionalmente –0,086 0,105 Nacional 0,205*** 0,023
Más de la mitad de los días 0,518*** 0,266**
TIEMPO DE JORNADA (Ref. Partida)
Continuada –0,238*** –0,103* CONVENIO (Ref. De empresa)
TRABAJÓ SÁBADO (Ref. Ninguno) Estatal de sector 0,284*** –0,141***
NS/NC –0,316** 0,085 De ámbito superior a la empresa 0,272*** 0,158***
Uno –0,177 –0,367***
Dos o más –0,446*** 0,199**
TRABAJÓ DOMINGO (Ref. ninguno)
No sabe 0,496** 0,170
Uno 0,454*** 0,095
Dos o más 1,003*** –0,065
TRABAJÓ FINAL TARDE (Ref. Ningún día)
No sabe 0,650* 0,056
Ocasionalmente 0,194** –0,307***
Más de la mitad de los días –0,065 –0,119*
TRABAJÓ NOCHE (Ref. Ningún día)
No sabe 0,370 –0,321
Ocasionalmente 0,225* –0,454***
Más de la mitad de los días 0,409*** –0,355***
NO DESEA TRABAJAR MÁS HORAS (Ref. Sí)
Sí
No –0,128 –0,095
Nota: ***, ** y * significativo al 1, 5 y 10%.
Tabla 3. Resultados de las estimaciones de los modelos logit multinomiales sobre la segregación ocupacional (Continuación)

Reis. Rev.Esp.Investig.Sociol. ISSN-L: 0210-5233. N.º 171, Julio - Septiembre 2020, pp. 43-62
Marta Ibáñez y María Rosalía Vicente 55
Cuando se observan las probabilida-des de estar en ocupaciones segregadas teniendo en cuenta nivel de estudios y sa-lario (gráfico 2) vemos que estamos ha-blando de una realidad completamente distinta entre las ocupaciones femeninas y masculinas. Por un lado, la probabilidad de estar en una ocupación femenina dis-minuye a medida que aumenta el nivel de ingresos, y eso es así en todos y cada uno de los niveles de estudios recogidos. Algo a tener en cuenta es que la probabilidad de trabajar en una ocupación con mayo-ría femenina no está ordenada por niveles de estudios: vemos que son los individuos con diplomaturas los que tienen mayores probabilidades de estar en este tipo de ocupaciones7. A las diplomaturas le siguen el bachiller y la FP; estudios primarios y ESO tienen unas probabilidades inferiores al resto y similares entre sí; y las licencia-turas, grado y posgrado dibujan una pro-babilidad intermedia, aunque con una pen-diente menor; es decir, estos trabajadores no presentan tanta dispersión de ingresos (especialmente en la EPA).
Por su parte, es de destacar la situa-ción inversa de las ocupaciones masculi-nas, en las que el nivel de estudios ordena la probabilidad de estar asalariado en ocu-paciones masculinas: especialmente pe-queña en universitarios (que trabajan en ocupaciones mixtas) y especialmente am-plia en estudios primarios y obligatorios. Además, es de destacar el sentido de las pendientes: las probabilidades de estar en ocupaciones masculinas aumentan a me-dida que aumenta el nivel de ingresos.
También desde la perspectiva del ca-pital humano se ha defendido tradicio-nalmente la mayor temporalidad de los
7 Una diferencia mucho más marcada en la EPA, se-guramente porque la EES (gráfico A1) solo recoge a los cotizantes en el Régimen General de la Seguridad So-cial y pierde a maestras/os y enfermeras/as de servi-cios públicos.
trabajos femeninos, asociados a menor formación en el puesto y, por lo tanto, a menor antigüedad en la empresa y ma-yor rotación. Los resultados de 2001 des-armaron tal hipótesis al mostrar que eran justamente estas las «que presentan una probabilidad mayor de permanencia en el puesto» (Ibáñez, 2008: 114). Con los da-tos de 2011, se confirma que las ocupa-ciones segregadas están asociadas con una mayor probabilidad de contrato indefi-nido que las mixtas, tanto las ocupaciones masculinas como femeninas.
En concreto, los trabajos femeninos pre-sentan menor rotación que los mixtos, pues tienen mayor probabilidad que aquellos de tener mayor experiencia en el puesto y con-tratos indefinidos. La situación de los mas-culinos es más compleja: por un lado, sí tienen mayor probabilidad de contrato inde-finido, pero por el otro presentan mayor ro-tación (medido en meses de experiencia).
Ingresos y temporalidad de la relación laboral, junto con la posición jerárquica de la ocupación (asociada al prestigio y me-dido por la categoría ocupacional) y la su-pervisión sobre otros, constituyen el con-junto de recompensas asociadas a los puestos laborales. Nuestros resultados son congruentes con los de 2001: los directivos y profesionales son los que menos probabi-lidad tienen de pertenecer a una ocupación segregada (aunque hay que tener en cuenta que dentro de los directivos no había nin-guna ocupación clasificada como femenina y sí como masculina).
En cuanto a la supervisión, las dos en-cuestas muestran de forma congruente que las ocupaciones femeninas siguen estando asociadas a una menor probabilidad de su-pervisión. Sin embargo, se aprecia un cam-bio notable en las masculinas para las que se revierte la situación respecto a la de 2001; esto es, tiene una probabilidad de su-pervisión superior a las de las ocupaciones neutras, congruente en las dos muestras.

56 La segregación ocupacional por sexo. Evolución en España 2001-2011: diez años de caminar sin avanzar
Reis. Rev.Esp.Investig.Sociol. ISSN-L: 0210-5233. N.º 171, Julio - Septiembre 2020, pp. 43-62
GRáfIco 2. Probabilidad de trabajar en una ocupación femenina y masculina según el nivel de estudios y decila de salario mensual (EPA2011)
OCUPaCIONES FEMENINaS
ESO Bachiller FP2 FP3 Grado +Posgrado
salario_decilas
Primarios Diplomatura
1
0,9
0,8
0,7
0,6
0,5
0,4
0,3
0,2
0,1
0
1 2 3 4 5 6 7 8 9 10
OCUPaCIONES MaSCULINaS
Postgradosecondary graduate VET VET + Grad
salario_decilas
ESO Bachiller FP2 FP3 Grado +PosgradoPrimarios Diplomatura
1
0,9
0,8
0,7
0,6
0,5
0,4
0,3
0,2
0,1
0
1 2 3 4 5 6 7 8 9 10

Reis. Rev.Esp.Investig.Sociol. ISSN-L: 0210-5233. N.º 171, Julio - Septiembre 2020, pp. 43-62
Marta Ibáñez y María Rosalía Vicente 57
Por su parte, la teoría de las diferen-cias compensatorias asocia las ocupacio-nes femeninas con jornadas laborales más flexibles y cómodas que permitan compa-tibilizar el trabajo fuera y dentro de casa. Los resultados de 2001 apoyaban en gene-ral esta teoría; ahora se identifican ciertos cambios que la matizarían. Así, el trabajo en el domicilio, que en 2001 no presentaba una asociación significativa con los traba-jos femeninos, ahora sí la presenta para la categoría «más de la mitad de los días». Si este trabajo en el domicilio se deriva del teletrabajo, entonces podría considerarse como una evidencia adicional que apoya la teoría de las diferencias compensatorias; sin embargo, si se trata de «llevarse trabajo a casa», entonces supondría la asunción de unas peores condiciones laborales, lo cual parece plausible en el contexto de crisis económica existente en 2011. El hecho de que en las ocupaciones masculinas la signi-ficación de esta variable pase de la catego-ría «ocasionalmente» (en 2001) a «más de la mitad de los días» (2011) parece apoyar esa segunda explicación. De manera simi-lar puede interpretarse que trabajar los do-mingos, que en 2001 estaba negativamente asociado a las ocupaciones femeninas, se vuelva ahora no significativo.
Un caso particular es el trabajo a tiempo parcial. Las estimaciones de 2001 mostra-ban cómo las ocupaciones femeninas esta-ban claramente asociadas al tiempo parcial, mientras que las masculinas, al completo. En 2011, se mantiene en este patrón. Ade-más, los resultados de la EPA11 permiten ahondar en las razones del tiempo parcial, observando que en las ocupaciones feme-ninas está fundamentalmente asociado a no encontrar otro tipo de trabajo; mientras que en las masculinas cuando hay tiempo parcial es básicamente por motivos distin-tos a no encontrar.
La teoría de la segmentación del mer-cado considera las características de las empresas para explicar la segregación ocu-
pacional asociando, por un lado, las ocu-paciones femeninas al sector público y, por otro, a empresas y mercados pequeños con poco nivel de sindicación.
Sobre la titularidad de las empresas, en estos diez años las ocupaciones femeni-nas han pasado de estar asociadas al sec-tor privado a estarlo al público, de una ma-nera muy congruente, pues se registra en las dos muestras. En cuanto a las ocupa-ciones masculinas, la situación cambia se-gún se considere una encuesta u otra: se concentran en el sector privado en la EPA en ambos años, mientras que están en el público en la EES (justo en la muestra en la que no se recogen a los funcionarios), si bien este último resultado en 2010 no es estadísticamente significativo. Como se señalaba anteriormente, cuando el resul-tado depende tanto de las muestras, hace sospechar que hay otros factores que no están recogidos. Un fenómeno similar al que se observa en la influencia del tamaño del establecimiento.
Los datos de 2011 verifican también que la segregación ocupacional tanto feme-nina como masculina está asociada a las empresas que operan en los mercados más pequeños, locales, y en menor medida a los nacionales respecto a los internacionales.
En cuanto a la importancia de la nego-ciación colectiva, uno de los aspectos más interesantes del trabajo de 2001 es que se habían detectado estructuras distintas para las ocupaciones femeninas y masculinas, estas últimas con una mayor probabilidad de estar sujetas a convenios de empresas (y, como dijimos anteriormente, en conjunto menor poder en la negociación colectiva). En 2011 se invierte la tendencia y son las masculinas las que presentan una menor probabilidad de estar sujetas a convenios de empresas.
Por último, la variable referida a la rama de actividad tiene una gran capacidad para explicar la pertenencia a ocupaciones se-

58 La segregación ocupacional por sexo. Evolución en España 2001-2011: diez años de caminar sin avanzar
Reis. Rev.Esp.Investig.Sociol. ISSN-L: 0210-5233. N.º 171, Julio - Septiembre 2020, pp. 43-62
gregadas frente a las mixtas, siendo el fac-tor por excelencia a la hora de reflejar la división sexual del trabajo. De hecho, es-timando los modelos multinomiales única-mente con esta variable se obtienen unos Pseudo R2 de 0,24 y 0,20 —con EPA11 y EES10, respectivamente—, lo que supone prácticamente la mitad de la capacidad ex-plicativa de los modelos finales —Pseudo R2 de 0,423 y 0,395—.
A lo largo de estos diez años se ha mantenido la división sexual del trabajo, con una distribución de la población y unos coeficientes muy similares entre los dos años de estudio: los trabajos femeni-nos se reparten mayoritariamente entre la sanidad y los servicios sociales, comercio y reparaciones, la educación, la adminis-tración pública y los servicios domésticos en los hogares; mientras que los mascu-linos lo hacen en la industria manufactu-rera, la construcción, el sector primario y la administración pública y defensa. Este último sector, donde también hay una gran proporción de asalariados en ocupaciones femeninas, muestra cómo los sectores de actividad agrupan ocupaciones segrega-das hacia uno y otro género.
Finalmente, es interesante llamar la atención sobre las actividades de «Informa-ción y Comunicaciones», rama que no exis-tía como tal en la CNAE-94 y que aglutina los trabajos relacionados con telecomuni-caciones e informática, claramente asocia-dos a las ocupaciones masculinas en línea con los resultados de Fernández (2017) y Martínez-Cantos y Castaño (2017), entre otros.
conclusIonEs
Frente a la idea de que la segregación ocupacional estaba en retroceso, los da-tos demuestran su falsedad. El más de mi-llón y medio de mujeres que ha entrado al mercado de trabajo en el periodo intercen-
sal 2001-2011 lo ha hecho en ocupaciones tradicionalmente femeninas y las recom-pensas de estos trabajos no parecen ha-ber mejorado.
Gracias a nuestro análisis se ha po-dido comprobar la evolución de los índi-ces de segregación (general y por ocu-paciones) sin error muestral, con datos censales. La visualización de las curvas de Lorenz nos señala que el aumento de la segregación viene de la mano de las ocupaciones feminizadas, pues son estas las que aumentan; además, los diez tra-bajos más feminizados casi no cambian y en 2011 ocupan al 25% del total de la mano de obra femenina.
Además, las características asocia-das a estas ocupaciones y sobre todo sus recompensas no han mejorado en los 10 años analizados. Los trabajos femeni-nos ganan menos que los neutros y estos menos que los de mayoría masculina. El mismo orden que para otra recompensa laboral, el mando sobre otros, que además ahora está claramente asociada a las ocu-paciones masculinas. Aunque, frente a es-tos resultados, la recompensa de la seguri-dad en el empleo mantiene otra pauta: son las ocupaciones segregadas (masculinas y femeninas) las que tienen mayor probabili-dad de contrato indefinido.
Al igual que con los datos de 2001, se comprueba la teoría de las diferencias compensatorias, pero, como entonces, con escasa incidencia, pues la propor-ción de trabajadores/as con horarios no estándar es pequeña. Un comentario es-pecial merece el trabajo a tiempo parcial, que sigue estando claramente asociado a las ocupaciones femeninas (y el trabajo a tiempo completo claramente asociado a las masculinas); aunque hay que resaltar que la situación no se debe tanto a un de-seo por parte de las trabajadoras, como a la imposibilidad de encontrar un trabajo a tiempo completo.

Reis. Rev.Esp.Investig.Sociol. ISSN-L: 0210-5233. N.º 171, Julio - Septiembre 2020, pp. 43-62
Marta Ibáñez y María Rosalía Vicente 59
Una de las conclusiones más intere-santes se refiere al aspecto de la «jerar-quía» en las ocupaciones segregadas. Por ejemplo, se observa claramente que las ocupaciones de mayoría femenina no son jerárquicamente inferiores, pues presentan un fuerte peso de las antiguas diplomatu-ras, asociadas a los mercados de trabajo públicos, tradicionalmente con mejores condiciones laborales. De hecho, en estos diez años se ha producido un cambio es-tructural interesante, pues mientras que en el 2001 la segregación (masculina y feme-nina) era un fenómeno asociado al sector privado (y nos congratulábamos del efecto de la selección universalista en lo público para que esto fuese así), en 2011 la segre-gación femenina está asociada al sector público.
La diferencia a favor de los varones aparece en los trabajos no cualificados (asociados a los estudios primarios y obli-gatorios), pues estos son muy distintos se-gún sean mayoritariamente masculinos o femeninos. Es decir, mientras que los fe-meninos se encuentran mayoritariamente en los salarios inferiores, los masculinos con esos niveles de estudios tienen ma-yores probabilidades de mejores ingresos. En suma, en las ocupaciones masculinas, los niveles educativos más bajos no pena-lizan el salario, casi lo recompensan. Si a esto unimos la presencia que tienen en es-tas ocupaciones los convenios colectivos superiores al de empresa (y recordemos que están asociadas a mayores retribu-ciones y poder que las mixtas), podemos concluir que las ocupaciones masculinas disfrutan de una situación especialmente ventajosa en el mercado laboral, una ob-servación que ya se venía haciendo desde el análisis más cualitativo —oficiales de la construcción, estiba portuaria, conducción de trenes (Ibáñez, 2017; Aguado y Balles-teros, 2018)—.
Por otra parte, en las ocupaciones más cualificadas observamos que la especiali-
zación en los estudios universitarios sigue muy segregada por género. Así, las acti-vidades de Información y Comunicacio-nes donde se encuentran todas las nuevas ocupaciones relacionadas con las teleco-municaciones, la informática y el análisis de datos, entre otras, son claramente mas-culinas. Las mujeres acceden de forma mi-noritaria a ellas a pesar de su alta remune-ración y de que constituyen importantes nichos de empleo, donde existe una esca-sez de personal cualificado y con enorme potencial de crecimiento.
Nuestros resultados apuntan por tanto en dos direcciones (no excluyentes) a la hora del diseño de políticas públicas para reducir la segregación ocupacional. Por un lado, tratar de abrir a las mujeres las ocu-paciones tradicionalmente masculinas de poca cualificación, pero bien remuneradas. Seguramente solo a través de mecanismos legales que fijen estándares de empleo en los organismos públicos y las empresas que contratan con el Estado se pueda in-troducir cuñas en mundos tan cerrados. Por otro lado, fomentar el acceso feme-nino a esas nuevas ocupaciones muy cua-lificadas con alta remuneración donde la presencia femenina es aún muy baja, cui-dando que la entrada de mujeres no lleve aparejado un empeoramiento de las con-diciones laborales, ya que las ocupacio-nes universitarias, tradicionalmente mejor remuneradas, han sido las que más han sufrido cuando han entrado mujeres (Man-del, 2013, para Estados Unidos). Estamos hablando de las STEM (Science, Tecnho-logy, Engineering and Mathematics), la alta dirección, el análisis financiero y el análi-sis de datos. En este caso, y dada la re-ciente aparición de muchas de estas ocu-paciones, se trata de poner el foco en que las mujeres no pierdan este nuevo tren donde se están generando grandes opor-tunidades de empleo y al que estará ligada buena parte de la actividad económica del futuro más próximo.

60 La segregación ocupacional por sexo. Evolución en España 2001-2011: diez años de caminar sin avanzar
Reis. Rev.Esp.Investig.Sociol. ISSN-L: 0210-5233. N.º 171, Julio - Septiembre 2020, pp. 43-62
BIBlIografía
Aguado Bloise, Empar y Ballesteros Doncel, Esme-ralda (2018). Segregación ocupacional: participa-ción y reconocimiento de mujeres empleadas en trabajos de dominación masculina. Valencia: Ti-rant lo Blanc.
Aldaz Odriozola, Leire y Eguía Peña, Begoña (2016a). «Segregación ocupacional por género y naciona-lidad en el mercado laboral español/Gender and Nationality Based Occupational Segregation in the Spanish Labor Market». Revista Española de Investigaciones Sociológicas, 156: 3-20.
Aldaz Odriozola, Leire y Eguía Peña, Begoña (2016b). «Segregación laboral por género en España y en el País Vasco. Un análisis de cohortes». Estudios de Economía Aplicada, 34(1): 133-154.
Alonso, Pamela; Moscoso, Silvia y Cuadrado, Dá-maris (2015). «Procedimientos de selección de personal en pequeñas y medianas empresas es-pañolas». Revista de Psicología del Trabajo y de las Organizaciones, 31(2): 79-89.
Alonso-Villar, Olga y Río, Coral del (2010). «Segre-gation of Female and Male Workers in Spain: Occupations and Industries». Hacienda Pública Española, 194(3): 91-121.
Bardasi, Elena, y Gornick, Janet C. (2008). «Wor-king for Less? Women’s Part-time Wage Penal-ties across Countries». Feminist economics, 14(1): 37-72.
Bettio, Francesca y Verashchagina, Alina (2009). Gender Segregation in the Labour Market: Root Causes, Implications and Policy Responses in the EU. Luxembourg: Publications Office of the European Union, European Commission.
Blackburn, Robert M. (2012). «The Measurement of Occupational Segregation and its Component Dimensions». International Journal of Social Re-search Methodology, 15(3): 175-198.
Blau, Francine D.; Brummund, Peter y Liu, Albert Y. H. (2013). «Trends in Occupational Segre-gation by Gender 1970-2009: Adjusting for the Impact of Changes in the Occupational Coding System». Demography, 50(2): 471-492.
Brynin, Malcolm y Perales, Francisco (2016). «Gen-der Wage Inequality: the De-gendering of the Occupational Structure». European Sociological Review, 32(1): 162-174.
Cohen, Philip N. (2013). «The Persistence of Work-place Gender Segregation in the US». Sociology Compass, 7(11): 889-899.
Dueñas Fernández, Diego; Iglesias Fernández, Carlos y Llorente Heras, Raquel (2014). «Occupational Segre-gation by Sex in Spain: Exclusion or Confinement?». International Labour Review, 153(2): 311-336.
Dueñas Fernández, Diego; Iglesias Fernández, Car-los y Llorente Heras, Raquel (2016). «Por qué las mujeres no se distribuyen de forma homogénea en el mercado de trabajo español? El “efecto re-chazo” y el “efecto atracción”». El Trimestre Eco-nómico, 83(2): 339-369.
Espina, Álvaro (2016). «Anomalías de la negociación colectiva en España: esclerosis, segmentación, desequilibrios y colusión». Boletín Económico de ICE 3079: 27-52.
Fernández, Ana Belén (2017). «Mujeres informáticas. La elección formativa». En: Ibáñez, M. (dir.). Muje-res en mundos de hombres: la segregación ocupa-cional a través del estudio de casos. Madrid: Cen-tro de Investigaciones Sociológicas, pp. 191-222.
Garrido, Luis y González, Juan Jesús (2005). «Mer-cado de trabajo, ocupación y clases sociales». En: Requena y Díez de Revenga, Miguel y Gonzá-lez, Juan Jesús (coords.). Tres décadas de cam-bio social en España. Madrid: Alianza, pp. 81-126.
Gauchat, Gordon; Kelly, Maura y Wallace, Michael (2012). «Occupational Gender Segregation, Globa-lization, and Gender Earnings Inequality in US Me-tropolitan Areas». Gender & Society 26(5): 718-747.
Goerlich Peset, José María (dir.) (2018). Evolución de los contenidos económicos de la negociación colectiva en España (2007/2015). Madrid: Minis-terio de Empleo y Seguridad Social.
Grönlund, Anne y Magnusson, Charlotta (2013). «Devaluation, Crowding or Skill Specificity? Ex-ploring the Mechanisms behind the Lower Wa-ges in Female Professions». Social Science Re-search, 42(4): 1006-1017.
Hakim, Catherine (1998). Social Change and Inno-vation in the Labour Market. Oxford: Oxford Uni-versity Press.
Hegewisch, Ariane y Hartmann, Heidi (2014). Occupa-tional Segregation and the Gender Wage Gap: A job Half Done. Washington D.C.: Institute for Women’s Policy Research. Disponible en: http://www.iwpr.org/publications/pubs/occupationalsegregation-and-the-gender-wage-gap-a-job-half-done
Ibáñez, Marta (2008). «La segregación ocupacional por sexo a examen. Características personales, de los puestos y de las empresas asociadas a las ocupa-ciones masculinas y femeninas». Revista Española de Investigaciones Sociológicas, 123: 87-122.

Reis. Rev.Esp.Investig.Sociol. ISSN-L: 0210-5233. N.º 171, Julio - Septiembre 2020, pp. 43-62
Marta Ibáñez y María Rosalía Vicente 61
Ibáñez, Marta (dir.) (2017). Mujeres en mundos de hombres. La segregación ocupacional a través del estudio de casos. Madrid: Centro de Investi-gaciones Sociológicas.
Ibáñez, Marta y Vicente, María R. (2017). «Concep-tos, medidas y evolución de la segregación la-boral». En: Ibáñez, M. (dir.). Mujeres en mundos de hombres: la segregación ocupacional a tra-vés del estudio de casos. Madrid: Centro de In-vestigaciones Sociológicas, pp. 15-33.
Iglesias Fernández, Carlos y Llorente Heras, Raquel (2010). «Evolución reciente de la segregación la-boral por género en España». Revista Universita-ria de Ciencias del Trabajo, 11: 81-105.
ILO (2018). Global Wage Report 2018/19. What Lies Behind Gender Pay Gaps. Geneva: International Labour Organization.
INE (2010). Encuesta de Estructura Salarial 2010. Microdatos. Madrid: INE.
INE (2011a). Censo de Población y Viviendas. Madrid: INE.
INE (2011b). Encuesta de Población Activa 2011. Microdatos. Madrid: INE.
INE (2017). Encuesta de Estructura Salarial. Metodo-logía. Disponible en: https://www.ine.es/metodo-logia/t22/meto_ees14.pdf
Jarman, Jennifer; Blackburn, Robert M. y Racko, Girts (2012). «The Dimensions of Occupatio-nal Gender Segregation in Industrial Coun-tries». Sociology, 46(6): 1003-1019.
Mandel, Hadas (2013). «Up the Down Staircase: Women’s Upward Mobility and the Wage Pe-nalty for Occupational Feminization, 1970-2007». Social Forces, 91(4): 1183-1207.
Martínez García, José S. (2017). Estructura social y desigualdad en España. Madrid: Los libros de la Catarata.
Martínez-Cantos, José Luis y Castaño, Cecilia (2017). «La brecha digital de género y la escasez de mujeres en las profesiones TIC». Panorama Social, 25: 49-65.
Murphy, Emily y Oesch, Daniel (2016). «The Femini-zation of Occupations and Change in Wages: A panel Analysis of Britain, Germany, and Switzer-land». Social Forces, 94(3): 1221-1255.
Pan, Jessica (2015). «Gender Segregation in Occu-pations: The Role of Tipping and Social Interac-tions». Journal of Labor Economics, 33(2): 365-408.
Polavieja, Javier (2008). «The Effect of Occupational Sex-Composition on Earnings: Job- Specializa-tion, Sex-Role Attitudes and the Division of Do-mestic Labour in Spain». European Sociological Review, 24(2): 199-213.
Polavieja, Javier (2012). «Socially Embedded Invest-ments: Explaining Gender Differences in Job Specific Skills». American Journal of Sociology, 118(3): 592-634.
Río, Coral del y Alonso-Villar, Olga (2010). «Gender Segregation in the Spanish Labor Market: An Al-ternative Approach». Social Indicators Research, 98(2): 337-362.
Rytina, Nancy (1981). «Occupational Segregation and Earnings Differences by Sex». Monthly La-bor Review, 104(1): 49-53.
Siltanen, Janet; Jarman, Jennifer y Blackburn, Ro-bert M. (1995). Gender inequality in the labour market. Occupational concentration and segre-gation. Geneva: International Labour Office.
Sokoloff, Natalie J. (1992). Black Women and White Women in the Professions: Occupational Se-gregation by Race and Gender 1960-1980. New York: Routledge.
Torre, Margarita (2017). «Attrition from Male-domi-nated Occupations: Variation among Occupa-tions and Women». Sociological Perspectives, 60(4): 665-684.
Vicente Merino, Ana M.; Martínez Aguado, Juliana; Martínez Aguado, Timoteo; Calderón Milán, M. José y Moreno Ruiz, Rafael (2010). Cambios en el mercado laboral español: la incorporación de la mujer al mercado laboral: factores determinan-tes a nivel geográfico, profesional y por activida-des en el Sistema de Seguridad Social. Madrid: Ministerio de Trabajo e Inmigración.
RecepcIón: 14/02/2019apRobacIón: 26/09/2019

62 La segregación ocupacional por sexo. Evolución en España 2001-2011: diez años de caminar sin avanzar
Reis. Rev.Esp.Investig.Sociol. ISSN-L: 0210-5233. N.º 171, Julio - Septiembre 2020, pp. 43-62
anExos
GRáfIco a1. Probabilidad de trabajar en una ocupación femenina y masculina según el nivel de estudios y de-cila de salario (EES2010)
OCUPaCIONES FEMENINaS
salario por hora_decilas
ESO Bachiller FP2 FP3 Grado +PosgradoPrimarios Diplomatura
1
0,9
0,8
0,7
0,6
0,5
0,4
0,3
0,2
0,1
0
1 2 3 4 5 6 7 8 9 10
OCUPaCIONES MaSCULINaS
salario por hora_decilas
ESO Bachiller FP2 FP3 Grado +PosgradoPrimarios Diplomatura
1
0,9
0,8
0,7
0,6
0,5
0,4
0,3
0,2
0,1
0
1 2 3 4 5 6 7 8 9 10

Reis. Rev.Esp.Investig.Sociol. ISSN-L: 0210-5233. N.º 171, July - September 2020, pp. 43-62
doi:10.5477/cis/reis.171.43
Occupational Segregation by Sex in Spain 2001-2011: Ten Years without Progress
La segregación ocupacional por sexo. Evolución en España 2001-2011: diez años de caminar sin avanzar
Marta Ibáñez and María Rosalía Vicente
Key wordsCensus
Wage Structure •Survey
Economically Active •Population Survey
Female Occupations•Male Occupations•Multinomial •
Regression
AbstractContrary to the general idea that occupational segregation is a declining phenomenon, it increased in Spain between 2001 and 2011. We replicate a previous study (Ibáñez, 2008) and compare findings from the Economically Active Population Survey and the Wage Structure Survey. Results suggest a complex situation and raise concern about the continuation of women’s occupational segregation. Women have not been able to access traditional male or skilled high salary occupations, nor new highly qualified and paid occupations in the fields of computer and data science. Hence, labour market segregation is still a source of discrimination between the sexes.
Palabras claveCenso
Encuesta de •Estructuras Salariales (EES)
Encuesta de •Población Activa (EPA)
Ocupaciones •femeninas
Ocupaciones •masculinas
Regresión •multinomial
ResumenFrente a la idea general de que la segregación ocupacional es un fenómeno en retroceso, se comprueba su aumento en España entre los Censos de 2001 y 2011. Replicando una investigación anterior (Ibáñez, 2008), se comparan resultados entre la Encuesta de Población Activa y la de Estructuras Salariales. Los resultados invitan a adoptar una perspectiva compleja, y subrayan la preocupante permanencia de la segregación laboral femenina. Las mujeres no han conseguido entrar ni en ocupaciones tradicionalmente masculinas no cualificadas pero con altas remuneraciones, ni tampoco en aquellas nuevas ligadas a actividades de la informática que requieren una elevada cualificación y perciben una elevada remuneración. Queda patente así que la segregación laboral es, y sigue siendo, una fuente de discriminación entre los sexos.
CitationIbáñez, Marta and Vicente, María Rosalía (2020). “Occupational Segregation by Sex in Spain 2001-2011: Ten Years without Progress”. Revista Española de Investigaciones Sociológicas, 171: 43-62. (http://dx.doi.org/10.5477/cis/reis.171.43)
Marta Ibáñez: Universidad de Oviedo, Departamento de Sociología | [email protected]
María Rosalía Vicente: Universidad de Oviedo, Área de Estadística y Econometría | [email protected]

44 Occupational Segregation by Sex in Spain 2001-2011: Ten Years without Progress
Reis. Rev.Esp.Investig.Sociol. ISSN-L: 0210-5233. N.º 171, July - September 2020, pp. 43-62
IntroductIon
To study occupational segregation by gender continues to make sense for differ-ent reasons, and from the perspective of so-ciological theory in particular, because oc-cupational segregation is an indicator of the sexual division of labour, a corner stone of patriarchy. Its analysis will provide clues re-garding how the first social division (gender) is currently concretized, in other words, what qualities are ascribed to the masculine and the feminine. Interest is not limited to the the-oretical; the internalisation of this social order (“masculine” jobs and “feminine” jobs) con-ditions educational and labour market de-cisions of men and women, reducing their number of possible choices. In addition, there is enough empirical evidence to state that jobs that are in their majority held by women, have worse employment and working condi-tions and, above all, that occupational segre-gation is one of the main sources of the gen-der wage gap (Polavieja, 2008: 199).
In this sense, although the overall evolu-tion of many employment indicators show that men and women are becoming more similar (particularly in terms of employment and unemployment rates, or the time of life spent being economically active), the bad news is that this is not the case with regard to the sexual division of the labour market. In Spain, occupational segregation by gender is high (Jarman et al., 2012: 1009) and has not declined significantly since the 1990s (Cebrián and Moreno, 2008; 129; Ibáñez and Vicente, 2017: 24). This interruption in the downward trend in segregation began later in other countries although it has now spread (see Cohen, 2013 for the United States).
We have two aims in this article, which are reflected in its structure. In the first, more descriptive part we examine the evolu-tion of occupational segregation in Spain. To do this we look at the results from previous studies, completing some aspects with our own ad hoc analysis. In concrete, we visu-
alise occupational differences using Lorenz curves for 2001 and 2011, the two years on which our analysis is based, identifying the most segregated masculine and feminine occupations and their differences over that decade, and showing how masculine oc-cupations underwent changes, while femi-nine ones remained the same. In addition, we reveal how these feminine occupations have their own profile. All of this is based on Spanish census data, which is very useful for developing segregation indices, as these are particularly sensitive to the number of units, in our case, per occupation.
The second part examines the extent to which segregation is a source of discrimina-tion, or in other words, all other things being equal, if feminine jobs have different charac-teristics and compensations than masculine or neutral jobs. This part is a continuation of the study by Ibáñez (2008)1. That study analysed the characteristics of workers, po-sitions and firms associated with mascu-line, feminine and mixed occupations using the Economically Active Population Sur-vey (EPA) and the Wage Structure Survey (ESS) of Spain’s National Statistics Institute, for 2002. Here we use the same methodol-ogy with data from 10 years later. Our ob-jectives are clear: concretise what changes have taken place over these years, in view of structural changes in the labour market: greater weight of professional occupations and of jobs in the service sector, both tra-ditionally associated with feminine employ-ment (Garrido and González, 2005).
Thus, this article makes three contribu-tions to the literature. First, although previ-ous studies have analysed the evolution of occupational segregation in Spain in periods similar to the one considered here (Alon-so-Villar and Río 2010; Iglesias and Llorent,
1 As this study is a continuation of another earlier pub-lished study, we have avoided repeating certain infor-mation, i.e., the references prior to 2008 (already used), focusing on the contributions from the last 10 years.

Reis. Rev.Esp.Investig.Sociol. ISSN-L: 0210-5233. N.º 171, July - September 2020, pp. 43-62
Marta Ibáñez and María Rosalía Vicente 45
2010; Aldaz and Eguía 2016; Dueñas et al., 2014, 2016), in general their analyses are based on calculating segregation indices, breaking them down by socio-demographic groups. Such a perspective is useful for capturing the overall evolution of segre-gation, but does not allow us to identify changes in the importance of different asso-ciated factors. These changes can be identi-fied with the approach adopted here, based on estimating multinomial logistic regres-sions using 2011 data and comparing them with results from 2001. Secondly, by defin-ing occupation types (feminine, masculine, mixed) based on census information, we avoid possible sample errors, which can oc-cur using the traditional practice of defining them using data from survey samples. Third, the use of two data sources permits us to assess the robustness of our results and in this way, the distinct characteristics of seg-regation apart from the source employed2.
the evolutIon of occupatIonal segregatIon In spaIn
Over the decade from 2001 to 2011, Spanish society and its labour market un-derwent major changes. During this time, the Spanish population grew from approxi-mately 38.5 million inhabitants to 46.5 mil-lion, with a consequent increase in the number of economically active persons from 18.5 million in 2001 to almost 25 mil-lion in 2011 (INE, 2011a). However, the country faced a major economic and em-ployment crisis beginning in 2008 (with un-employment rates above 20% and reach-ing 27% in 2013). These two phenomena, the increase in the active population and in the unemployed, impact men and women in completely different ways, which can be
2 Supplementary material for this article can be found at the web for the research group: https://www.unioviedo.es/mibanez/WordPress/es/mujeres-en-mundos-de-hombres/
seen in inter-census differences among the employed. While men lost more than half a million jobs in these 10 years (indicated by growth in both the unemployed and the economically inactive), by 2011 the number of employed women had increased by al-most 1.7 million, reducing significantly the number of inactive women.
What jobs do these newly employed women, who have led to feminine employ-ment rates almost equalling male rates, carry out? In general, the same jobs that women have been holding, as segregation indexes in Spain continue being high. Thus, Bettio and Verashchagina (2009), in a report for the European Commission, and Aldaz and Eguía (2016a) agree in calculating (us-ing the Karmel and Machachlan index3 and data from the Active Population Survey) that 25% of employed women would have to change their occupations for occupational segregation to disappear in Spain.
Ibáñez and Vicente (2017: 24) confirm this increase in segregation with data from the population census, finding that the Gini index went from 0.32 in 2001 to 0.37 in 2011, and that the dissimilarity index went from 30.5 to 32.4. Graph 1 shows these re-sults using a Lorenz curve, in which the di-agonal represents a perfectly equal distri-bution of occupations between men and women. The increase in segregation that has occurred between 2001 and 2011 is clear. In concrete, we see that feminine oc-cupations have increased more: for exam-ple, 40% of employed women —the 40 point mark on the horizontal axis— were working in occupations that in 2001 em-ployed 15% of all employed men, while in 2011, the percentage of men employed in those jobs dropped to 10%. At the same time, men continued working in occupa-tions in which women did not enter, with few changes over these ten years.
3 See Ibáñez and Vicente (2017) for a review of these indexes.

46 Occupational Segregation by Sex in Spain 2001-2011: Ten Years without Progress
Reis. Rev.Esp.Investig.Sociol. ISSN-L: 0210-5233. N.º 171, July - September 2020, pp. 43-62
Particularly interesting is the difference between the years of economic growth and those of economic crisis. Segrega-tion increases until 2008 (Iglesias and Llorente, 2010; Dueñas et al., 2014, us-ing the Duncan segregation index based on data from the EPA and the Working Conditions Survey, respectively), when the great majority of these approximately 1.7 million new women workers entered the labour market, and tended to decline slightly in the years of the crisis, when more men became unemployed (remem-ber the crisis in construction) (Bettio and Verashchagina, 2009).
Spain is not a unique case. In con-trast to the decline in occupational seg-regation in the 1970s and 80s, in the last 20 years the trend has been a decelera-tion or stagnation in desegregation in An-glo-Saxon countries (Blau et al., 2013 and
Hegewish and Hartmann, 2014 for the United States; Dueñas et al., 2014 for the United Kingdom), and changes in the la-bour market resulting from globalisation have not halted this trend (Gauched et al., 2012), although the rates and intensities differ depending on the country (Murphy and Oesch, 2016; Dueñas et al., 2014).
The increase in occupational segre-gation in Spain has not been homoge-nous. Analysing masculine and feminine segregation separately, Alonso-Villar and Río (2010), using EPA data from 1994 to 2009, conclude that, for the period an-alysed, as segregation had been much greater for women, the evolution for each gender was different: among men segre-gation increased, while among women it decreased slightly (p.113).
Differences by age, education level, type of contract and type of work have
GRaph 1. Lorenz curve for occupations based on their proportion of women and men
10080604020
2011 2001 Equal distribution
10
20
30
40
50
60
70
80
90
100
00
Source: By authors based on INE (2011a).

Reis. Rev.Esp.Investig.Sociol. ISSN-L: 0210-5233. N.º 171, July - September 2020, pp. 43-62
Marta Ibáñez and María Rosalía Vicente 47
also been found; segregation being greater among young people (as well as among older women), among those with higher levels of education, in the temporary jobs that men hold (it is also high among women with indefinite contracts) and in part-time occupations held by women (Río and Alonso-Villar, 2010). Regarding age, Aldaz and Eguía (2016b) —using EPA data from 2002 to 2014— show how “the intensity of segregation grows with the age of women” (ibid.: 133); a finding which Torre (2017) ex-plains, in the US case, as resulting from burnout and subsequent abandonment by
women of jobs in very masculine occupa-tions – particularly those of low status.
Regarding major occupational groups, Ibáñez and Vicente (2017), using census data, identify the categories where seg-regation increased the most in the pe-riod from 2001 to 2011: among women in “workers in catering, personal, and pro-tection services and trade salespersons”, “elementary occupations” and “account-ing, administrative and other office em-ployees”, while among men in “skilled manufacturing industry and construction craftspersons and workers” (ibid.: 31).
Table 1. List of most and least segregated occupations (CNO-11)
The 10 most segregated occupations for men (12.5% of men) Partial segregation index
593 – Fire-fighters –0.958
740 – Machinery mechanics and adjusters –0.954
751 – Building and related electricians* –0.927
723 – Painters, paper hangers and related workers –0.917
591 – Civil guards –0.911
834 – Ships deck crews, engine crews and related workers –0.908
843 – Truck drivers –0.908
712 – Brick layers and related workers, stone masons, stone cutters, splitters and carvers
–0.906
711 – Concrete, formwork, steel fixing and related workers –0.905
001 – Commisioned and non-commissioned armed forces officers –0.905
The 10 most segregated occupations for women (25% of women)
910 – Domestic employees 25.674
571 – Home based personal care workers (except child care workers) 14.056
561 – Nursing assistants 11.266
225 – Primary school and early childhood teachers 10.226
572 – Child care workers 9.020
921 – Office, hotel and similar establishment cleaning workers 6.801
581 – Hairdressers, beauticians, well-being and related workers 5.986
212 – Nursing and midwifery professionals 4.989
361 – Administrative and specialised secretaries 3.596
282 – Sociologists, historians, psychologists and other social sciences profes-sionals
3.198
Note: The occupations in italics are the same ones as found in Ibañez (2008). *The third position belongs to “283 – Priests of different religions”, which is not included because of the low number of observations.
Source: By authors based on INE (2011a).

48 Occupational Segregation by Sex in Spain 2001-2011: Ten Years without Progress
Reis. Rev.Esp.Investig.Sociol. ISSN-L: 0210-5233. N.º 171, July - September 2020, pp. 43-62
Working with very large groupings of categories can hide very different reali-ties among occupations within the same group, especially when it has been found that the dynamic of occupational segre-gation is not linear, producing “tipping points” when a traditionally masculine oc-cupation rapidly converts into a feminine one (Pan, 2015, based on the US census from 1940 to 1990). If we calculate par-tial segregation indexes for each occupa-tion at the most disaggregated level (three digits from the National Classification of Occupations – CNO-11), and we com-pare them with Ibáñez (2008), we find that there have been practically no changes in the most feminized occupations: nine of the ten are the same as in 2001. In con-trast, if we look at the changes for the most masculinized and neutral occupa-tions: only three of the ten are the same occupations as found as in 2001 for each group.
theoretIcal consIderatIons
The factors associated with an oc-cupation having a greater feminine or masculine presence can vary greatly. In general, they can be related to the char-acteristics of the persons employed, the positions and to the structures of the em-ployer. Thus, in terms of these factors we find ourselves, on the one hand, with the-ories of human capital and of compensatory differences, and on the other, with the theory of labour market segmentation from a gender perspective.
Characteristics of the employed and the positions
Nobel economist Gary Becker’s theory of human capital argues that women make a lesser investment in education both in
terms of general education as measured by academic degrees, as well as specific education measured by employment ex-perience and on-the-job training. How-ever, now 50 years since the theory first appeared, the latest report of the Inter-national Labour Organisation (ILO) (ILO, 2018), indicates that education level is no longer a differentiating factor between men and women. In fact, women work-ers have similar or higher education levels than men workers.
Traditionally, to explain occupational segregation, education level was consid-ered the most important variable, as “hav-ing a higher education (…) determines the allocation of men and women to branches of activities or occupations of an inte-grated nature” (Iglesias and Llorente, 2010: 103). However, this was not the finding from Ibañez’s models (2008): in Spain, three year “diplomatura” univer-sity degrees were linked to greater likeli-hood of accessing occupations that were majority feminine. Thus, it is of interest to see if this phenomenon continues and to what extent.
An aspect associated with educa-tion level is the occupational category of jobs. Leaving aside the discussion of whether skills associated with gender so-cialisation are undervalued in the case of women (domestic and care-giving skills), Brynin and Perales (2016) with data for the United Kingdom, find differences be-tween feminized occupations that require middle and high level qualifications versus unskilled occupations with lower pay and fewer benefits. The assumption would be that among feminized occupations there are significant differences based on re-quired education level, with those in un-skilled jobs facing particularly difficult sit-uations.
Human capital can specifically take the form of on-the-job training. Polavieja

Reis. Rev.Esp.Investig.Sociol. ISSN-L: 0210-5233. N.º 171, July - September 2020, pp. 43-62
Marta Ibáñez and María Rosalía Vicente 49
(2008), using data for Spain from the Eu-ropean Social Survey, analyses this as-pect through a question regarding “Time that would be required for people with the right qualification to learn to do [respond-ent’s] job well”. The results are clear: the effect of occupational segregation on in-come disappears when this measure of the specific training for a position is intro-duced. For their part, Grönlund and Mag-nusson (2013) found that occupational segregation is associated, above all, with on-the-job training.
When variables with direct measures are not available, a possible proxy is the number of months in the job. The idea is that jobs with greater on-the-job training will see less turnover, due to the costs in-curred each time a new worker is hired. In short, it is assumed that feminized jobs are held for less time and, therefore, there is higher turnover, a reality associated with temporary contracting. However, based on data from 2001, we found that there is a greater probability of obtain-ing an indefinite contract working in oc-cupations that are in their majority held by women than working in mixed occupa-tions (Ibáñez, 2008). It would be interest-ing to see if this result (which contradicts the premises regarding the impact of on-the-job training) is true today.
Along with the mentioned theories, others have suggested that feminized jobs have lower wages because women want jobs that are more accommodating and more flexible, and thus more compat-ible with work in the home. This so-called theory of compensatory differences ar-gues that a greater proportion of women working in feminised occupations work part-time, continuous shifts, at home, and avoiding weekend and holiday hours, working late afternoons and/or nights.
In concrete, part time work is com-monly used to explain a large propor-
tion of the income differences between men and women. For example, Bardasi and Gornick (2008) found that in the six countries they analysed (Canada, Ger-many, Italy, Sweden, the United Kingdom and the United States), only in one, Swe-den, was working part time not penalised economically. In addition, women work-ing part time tend to be concentrated in more feminised occupations (with data for Spain, see Río and Alonso-Villar, 2010: 357; Iglesias and Llorente, 2010: 103).
The Achilles heel of this perspective that women “choose” to work part time is the fact that half the women who do work part time do so because they are unable to find full time work (INE, 2100b). Dueñas et al. (2014: 320) introduce this factor with the variable “hours of work”, distin-guishing between full time work, part time work by choice and not by choice. Their findings, using the Working Conditions Survey, show that men that voluntarily choose to work part time have lower like-lihood of accessing masculine jobs. While part time work among women (voluntarily or not) increases the likelihood of access-ing a feminised occupation.
Characteristics of the firm
Not all firms operate under the same conditions. Segmentation theories ana-lyse how the ownership of the firm/institu-tion, its size, its unionised (or not) labour force and the extent of its markets, “seg-ment” labour markets. Along with these factors we can add sector of activity, the most direct proxy for observing the sexual division of the labour market and, there-fore, taking a gender perspective. Under these theories, the starting hypothesis is that feminine jobs are in those segments with lower pay and benefits, higher turn-over and, in general, poorer working and employment conditions.
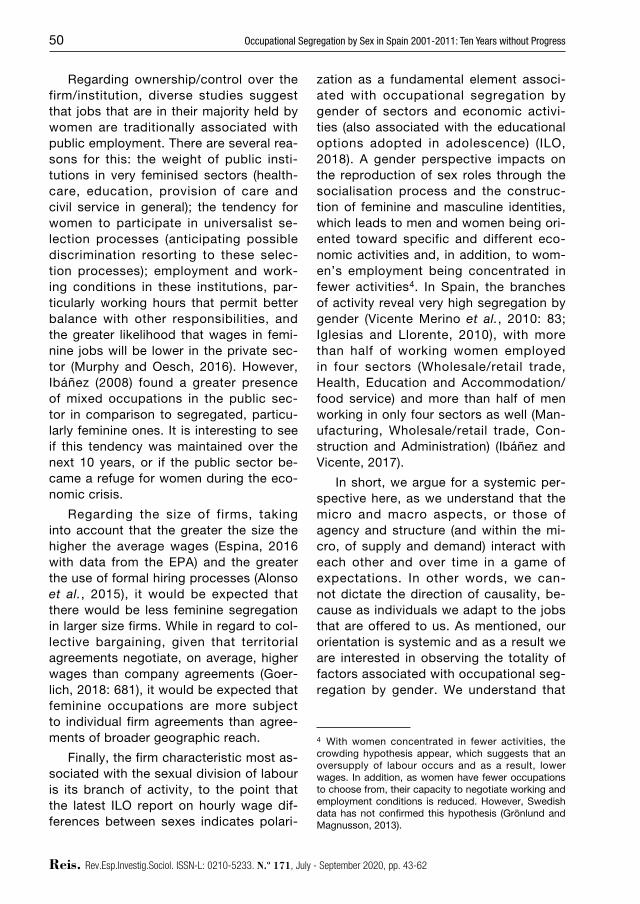
50 Occupational Segregation by Sex in Spain 2001-2011: Ten Years without Progress
Reis. Rev.Esp.Investig.Sociol. ISSN-L: 0210-5233. N.º 171, July - September 2020, pp. 43-62
Regarding ownership/control over the firm/institution, diverse studies suggest that jobs that are in their majority held by women are traditionally associated with public employment. There are several rea-sons for this: the weight of public insti-tutions in very feminised sectors (health-care, education, provision of care and civil service in general); the tendency for women to participate in universalist se-lection processes (anticipating possible discrimination resorting to these selec-tion processes); employment and work-ing conditions in these institutions, par-ticularly working hours that permit better balance with other responsibilities, and the greater likelihood that wages in femi-nine jobs will be lower in the private sec-tor (Murphy and Oesch, 2016). However, Ibáñez (2008) found a greater presence of mixed occupations in the public sec-tor in comparison to segregated, particu-larly feminine ones. It is interesting to see if this tendency was maintained over the next 10 years, or if the public sector be-came a refuge for women during the eco-nomic crisis.
Regarding the size of firms, taking into account that the greater the size the higher the average wages (Espina, 2016 with data from the EPA) and the greater the use of formal hiring processes (Alonso et al., 2015), it would be expected that there would be less feminine segregation in larger size firms. While in regard to col-lective bargaining, given that territorial agreements negotiate, on average, higher wages than company agreements (Goer-lich, 2018: 681), it would be expected that feminine occupations are more subject to individual firm agreements than agree-ments of broader geographic reach.
Finally, the firm characteristic most as-sociated with the sexual division of labour is its branch of activity, to the point that the latest ILO report on hourly wage dif-ferences between sexes indicates polari-
zation as a fundamental element associ-ated with occupational segregation by gender of sectors and economic activi-ties (also associated with the educational options adopted in adolescence) (ILO, 2018). A gender perspective impacts on the reproduction of sex roles through the socialisation process and the construc-tion of feminine and masculine identities, which leads to men and women being ori-ented toward specific and different eco-nomic activities and, in addition, to wom-en’s employment being concentrated in fewer activities4. In Spain, the branches of activity reveal very high segregation by gender (Vicente Merino et al., 2010: 83; Iglesias and Llorente, 2010), with more than half of working women employed in four sectors (Wholesale/retail trade, Health, Education and Accommodation/food service) and more than half of men working in only four sectors as well (Man-ufacturing, Wholesale/retail trade, Con-struction and Administration) (Ibáñez and Vicente, 2017).
In short, we argue for a systemic per-spective here, as we understand that the micro and macro aspects, or those of agency and structure (and within the mi-cro, of supply and demand) interact with each other and over time in a game of expectations. In other words, we can-not dictate the direction of causality, be-cause as individuals we adapt to the jobs that are offered to us. As mentioned, our orientation is systemic and as a result we are interested in observing the totality of factors associated with occupational seg-regation by gender. We understand that
4 With women concentrated in fewer activities, the crowding hypothesis appear, which suggests that an oversupply of labour occurs and as a result, lower wages. In addition, as women have fewer occupations to choose from, their capacity to negotiate working and employment conditions is reduced. However, Swedish data has not confirmed this hypothesis (Grönlund and Magnusson, 2013).

Reis. Rev.Esp.Investig.Sociol. ISSN-L: 0210-5233. N.º 171, July - September 2020, pp. 43-62
Marta Ibáñez and María Rosalía Vicente 51
the different theoretical perspectives and explanations are not necessarily exclu-sive, but instead reveal different factors that explain this phenomenon. That is, the inclusion of multiple perspectives en-riches the analysis.
Methodology
As with the study of reference (Ibáñez, 2008), the sources employed are the mi-cro data from the EPA and the ESS (INE, 2010; 2011b) ten years later (EPA11 and ESS10 in what follows). To compare the results it is necessary to take into account that in these years the ESS10 broadened its coverage in two ways: it widened the populational sphere (by incorporating workplaces with less than 10 workers) and the sectorial sphere (INE, 2017: 6). Thanks to this methodological change the sam-ples from both surveys are much more similar than they were in 2001. However, an essential methodological difference is maintained: their source of information. While the EPA is a survey of individuals, the ESS is based on information provided by employers. Their analysis in parallel permits us to observe the degree of con-sistency between coefficients, thus dis-carding the results that are not sufficiently congruent.
The variable of interest, occupational segregation, is constructed maintaining the criteria found in Ibáñez (2008) and exclusively analysing wage earners. The three values for the variable (masculine, feminine and mixed occupations) are de-fined such that “segregated occupations are those in which one of the sexes is represented in a proportion 20 percent-age points above that found for the entire population studied” (Ibáñez, 2008: 104)5.
5 This is a conservative criterion in the literature, from Rytina (1981) and Sokoloff (1992), in comparison to a
In the case of the EPA, this division is based on the 2011 Census, in this way avoiding sampling errors. Taking into ac-count that the EPA and the ESS have dif-ferent sample populations, the reference point in the construction of this variable will also be different: for the EPA11 it is 48% (as women constitute 48% of wage-earners), while for the EES10 the propor-tion of women is lower: 42.65%.
The occupation variable has different levels of disaggregation in the EPA and the ESS (based on three and two digits in the CNO, respectively), so that the dis-tributions are different for each one (Ta-ble 2). This loss of detail in occupations leads to a decrease in the precision with which the phenomenon of segregation is captured (Siltanen et al., 1995; Blackburn, 2012).
As a technique of analysis we used a multinomial logistic model, in which the dependent variable is type of occupation according to whether it is feminine, mas-culine or mixed, taking the latter as the reference. As the independent variables, we used those employed in the study by Ibáñez (2008) so that we could analyse and compare the characteristics of occu-pational segregation in Spain in 2001 and 2011. Thus, the personal characteristics of workers, their occupations, firm char-acteristics and working hours are con-sidered. In the models using EPA11 data, two variables that were absent in the es-timate for 2001 are included: salaries (in deciles) and supervision of other workers. The 10 largest groupings of occupational categories that are in the CNO-11 have been regrouped to avoid infinite estimates from null values.
more “aggressive” definition found in Hakim (1998) of +15% or 10%, or the 10% in Grönlund and Magnusson (2013). Hegewisch and Haartmann (2014), Dueñas et al. (2014) use +25%.

52 Occupational Segregation by Sex in Spain 2001-2011: Ten Years without Progress
Reis. Rev.Esp.Investig.Sociol. ISSN-L: 0210-5233. N.º 171, July - September 2020, pp. 43-62
The weighted results6 are presented based on the MLOGIT command using the STATA© statistical package.
results
Table 3 shows the results of the esti-mations from the multinomial logistic mod-els; in concrete, we see the estimated co-efficients whose sign indicates the type of existing association (positive/negative) be-tween occupational segregation and the in-dependent variables considered.
Traditionally, it has been argued from the perspective of human capital theory that feminine occupations are associated with a lower level of education, and as a
6 No changes are found in weighting the data from the EPA; however, in the EES, there are certain changes in the results for some categories.
result, lower salaries. The results for 2001 discredit the first part of this hypothesis by showing that feminine occupations are associated with higher levels of education than so called neutral or mixed occupa-tions, specifically because of the weight of three-year university degrees, referred to as diplomaturas in Spain. However, the results clearly shows the negative rela-tionship between salary and feminine oc-cupations. The 2011 data for the two sur-veys analysed again confirm the positive association between higher education and feminine occupations, as well as the ear-lier result regarding diplomaturas.
Regarding wages, the estimations reveal wage patterns found in 2001 in segregated occupations, with feminine occupations paying significantly lower wages than neu-tral ones and masculine occupations paying significantly higher wages.
Table 2. Classification of masculine, feminine and neutral occupations
WORKERS (in %) OCCUPATIONS (in %)
Censo11Employed(55m/45w)*
EPA11Employed
(55/45)
EPA11Wage-earners(52/48)
EES10Wage-earners (57/43)
EPA11Wage-earners(52/48)
EES10Wage-earners (57/43)
Masculine occupations 30.80 30.24 29.94 21.48 46 26/06/20
Feminine occupations 33.20 30.99 35.15 31.10 16 26.6
Mixed occupations 36.00 38.77 34.91 47.42 37 46.8
TOTAL 100 100 100 100 100 100
17,514,550
Sample38,395
Population18,398,840
Sample31,441
Population15,367,561
Sample195,777
Population10,772,181
(N = 166) (N = 60)
Note: *Proportions of men and women on which the three values for the dependent variable, Segregated occupation, are calculated (20 points above their proportion for the overall population studied) .
Source: By authors based on INE (2010, 2011a,b).

Reis. Rev.Esp.Investig.Sociol. ISSN-L: 0210-5233. N.º 171, July - September 2020, pp. 43-62
Marta Ibáñez and María Rosalía Vicente 53
Table 3. Results of the estimates from the multinomial logistic models of occupational segregation
EPA 2011Occup. Male
Occup.Fem.
EES 2010OccupMale
Occup Fem.
AGE –0.014*** –0.002 AGE 0.004*** 0.014***
SEX (Ref. Male) SEX (Ref. Male)
Female –1.514*** 1.358*** Female –2.054*** 1.189***
EDUCATION LEVEL (Ref. U degree+more) EDUCATION LEVEL (Ref. U degree+more)
Primary and below 0.352*** 0.215* Primary and below 0.730*** –0.206***
Obligatory secondary 0.763*** 0.370*** Obligatory secondary 0.818*** –0.206***
High school 0.710*** 0.750*** High school 0.751*** 0.136**
VT 2 0.827*** 0.664*** VT1 1.045*** 0.009
VT 3 and + 0.675*** 0.579*** VT2 1.057*** 0.073
Diplomaturas and other certifications 0.739*** 1.737*** Diplomatura –0.084 0.195***
SALARY in deciles 0.167*** –0.048*** SALARY/HOUR 0.032*** –0.025***
OCCUPATIONAL CAT. (Ref Directors and Professionals) OCCUPATIONAL CAT.
(3) Technicians 1.382*** 0.934*** (3) Technicians 2.786*** 1.226***
(4+5) Office employees and customer service clerks
0.387*** 1.469***(4+5) ) Office employees and customer service clerks
3.615*** 1.730***
(6+7+8+9) Manual workers 2.592*** 1.188*** (6+7+8+9) Manual workers 5.758*** 1.184***
CONTRACT TYPE (Ref. Temporary) LENGTH OF CONTRACT
Indefinite 0.335*** 0.203*** Indefinite 0.058* 0.143***
MONTHS IN THE FIRM –0.001*** 0.001*** MONTHS IN THE FIRM –0.003 0.005
SUPERVISION (Ref. No) SUPERVISION
Yes 0.218*** –0.774*** Yes 0.785*** –0.206***
PUBLIC OR PRIVATE PUBLIC OR PRIVATE
Wage-earner, Public Sector –0.848*** 0.206** Public –0.006 0.395***
TYPE OF WORK DAY (Ref. full-time) TYPE OF WORK DAY (Ref. full-time)
Did not find –0.044 0.191* Part-time –0.595*** 0.579***
Did not want 0.473* 0.317*
Others 0.435*** 0.109
SIZE (Ref. 50 or more employees) SIZE (Ref. 50 and up)
From 0 to 5 employees –0.009 0.067 From 1 to 4 employees 0.310*** 0.003
From 6 to 10 and Don’t know but < 10 –0.012 0.101 From 5 to 9 employees 0.184*** –0.132**
From 11 to 19 employees 0.150 0.411*** From 10 to 19 employees 0.266*** –0.011
From 20 to 49 employees 0.021 0.388*** From 20 to 49 employees 0.126*** –0.071*
Don’t know but more than 10 0.012 0.314***
DK/NA 0.026 0.006
BRANCH OF ACTIVITY (Ref. Financial activities) BRANCH OF ACTIVITY (Ref. Financial activities)
(A) Agriculture, livestock and fisheries 1.123*** –1.820***
(B+D+E) Mining and quarrying, electricity, gas and water supply
3.115*** 1.071***(B+D+E) Mining and quarrying, electricity, gas and water supply
1.489*** –0.140**
(C) Manufacturing 2.015*** 0.071 (C) Manufacturing 1.467*** –0.594***
(F) Construction 3.592*** 1.211*** (F) Construction 4.146*** 0.579***
(G) Wholesale and retail trade; repair 2.251*** 1.475*** (G) Wholesale and retail trade; repair 1.710*** 1.322***

54 Occupational Segregation by Sex in Spain 2001-2011: Ten Years without Progress
Reis. Rev.Esp.Investig.Sociol. ISSN-L: 0210-5233. N.º 171, July - September 2020, pp. 43-62
EPA 2011Occup. Male
Occup.Fem.
EES 2010OccupMale
Occup Fem.
(H) Transportion and storage 3.239*** 0.927*** (H) Transportion and storage 2.690*** –0.215***
(I) Hotels and Restaurants –0.814*** –0.319** (I) Hotels and Restaurants –0.098 –0.360***
(J) Information and Communication 2.372*** 0.484** (J) Information and Communication 1.707*** –0.266***
(M) Professional, Scientific and Technical activities
1.573*** 0.662***(M) Professional, Scientific and Technical activities
1.238*** 0.582***
(N) Administration and Support Service Activities
2.979*** 2.539***(N) Administration and Sup-port Service Activities
2.850*** 1.568***
(O+U) Public Administration and Defense
3.663*** 1.562***(O+U) Public Administration and Defense
3.705*** 1.022***
(P) Education 0.969*** 1.306*** (P) Education 1.364*** 0.119
(Q) Health and Social Services 1.056*** 2.155*** (Q) Health and Social Services 3.463*** 3.589***
(R) Arts, Entertainment and Recreation
0.880*** –0.185(R) Arts, Entertainment and Recreation
1.971*** 0.232***
(S) Other Service Activities 1.918*** 1.800*** (S) Other Service Activities 1.598*** –0.536***
(T) Activities of households 0.774** 2.860***
WORK AT HOME (Ref. No days) FIRM MARKET (Ref. European Union and International)
DK 0.210 –0.521** Local or Regional 0.466*** 0.300***
Occasionally –0.086 0.105 National 0.205*** 0.023
On more than half the days 0.518*** 0.266**
WORK SHIFT (Ref. Split)
Continual –0.238*** –0.103* AGREEMENT (Ref. Firm level)
WORK SATURDAY (Ref. None) State sector agreement 0.284*** –0.141***
DK/NA –0.316** 0.085 Above the level of the firm 0.272*** 0.158***
One –0.177 –0.367***
Two or more –0.446*** 0.199**
WORK SUNDAY (Ref. None)
Don’t know 0.496** 0.170
One 0.454*** 0.095
Two or more 1.003*** –0.065
WORK EVENINGS (Ref. No)
Don’t know 0.650* 0.056
Occasionally 0.194** –0.307***
More than half the days –0.065 –0.119*
WORK NIGHTS (Ref. Never)
Don’t know 0.370 –0.321
Occasionally 0.225* –0.454***
More than half the days 0.409*** –0.355***
DON’T WANT TO WORK MORE HOURS (Ref. Yes)
Yes
No –0.128 –0.095
Note: ***, ** and * significant at the 1, 5 and 10% levels.
Table 3. Results of the estimates from the multinomial logistic models of occupational segregation (Continuation)

Reis. Rev.Esp.Investig.Sociol. ISSN-L: 0210-5233. N.º 171, July - September 2020, pp. 43-62
Marta Ibáñez and María Rosalía Vicente 55
When we look at the probabilities of being in segregated occupations taking into account education and wage levels (Graph 2), we see that we are referring to completely different realities when compar-ing feminine and masculine occupations. On the one hand, the probability of being in a feminine occupation decreases as income level increases, and this is the case for each one of the education levels exam-ined. Something to consider is that the like-lihood of working in an occupation with a majority feminine workforce is not ordered by education levels: we see that individuals with diplomaturas have the highest prob-abilities of being in these types of occupa-tions7. After this degree is a high school di-ploma and vocational training; persons with primary education and secondary education have lower probabilities than others; per-sons with university degrees and graduate studies reveal an intermediate probability, although with a lower slope, that is, these workers do not show such a dispersion in income (especially in the EPA data).
Regarding masculine occupations, we find the inverse situation, as education level reflects the order of the probability of be-ing a wage-earner in masculine occupa-tions: particularly reduced among university educated (who work in mixed occupations) and particularly higher among those with primary and secondary educations. In ad-dition, the direction of the slope should be highlighted: the probabilities of being in masculine occupations increase as income levels increase.
The higher level of temporariness in em-ployment in feminine occupations has tradi-tionally also been defended from a human capital perspective, associating it with po-sitions that require less on-the-job train-
7 This differences is much clearer in the EPA, because the EES (Graph A1) only includes contributors to the general social security system, and loses publicly em-ployed teachers and nurses.
ing, and therefore less seniority in the firm and greater turnover. The results from 2001 do not support such a hypothesis, as they show that it is specifically persons em-ployed in feminine occupations “that have a greater probability of remaining in their po-sitions” (Ibáñez, 2008: 114). With the data from 2011, we confirm that segregated oc-cupations, whether feminine or masculine, are associated with a greater likelihood of having an indefinite contract than mixed oc-cupations.
In concrete, feminine jobs have lower turnover than mixed, as they have a higher probability of having greater experience in positions and indefinite contracts. The sit-uation for masculine occupations is more complex: on the one hand, persons em-ployed in masculine occupations are more likely to have indefinite contracts, but on the other, there is greater turnover (meas-ured in months of experience).
Income and temporariness in employ-ment, along with the hierarchical position of the occupation (its association with pres-tige and measured by the occupational cat-egory) and supervision over others, consti-tute the totality of rewards associated with employment. Our results are consistent with those from 2001: managers and profession-als have the lowest probability of employ-ment in a segregated occupation (although it must be taken into account that within management positions, there are no occu-pations classified as feminine, while there are those classified as masculine).
Regarding supervision, the two surveys both show that feminine occupations con-tinue to be associated with lower probability of exercising supervision over others. How-ever, a notable change can be seen in mas-culine occupations, for which the situation in 2011 is reverse that found in 2001; that is, there is a higher probability of women exercising supervision in masculine occu-pations than in neutral ones, where the re-sults are consistent over both surveys.

56 Occupational Segregation by Sex in Spain 2001-2011: Ten Years without Progress
Reis. Rev.Esp.Investig.Sociol. ISSN-L: 0210-5233. N.º 171, July - September 2020, pp. 43-62
GRaph 2. Probability of working in a feminine or masculine occupation by education level and monthly salary in deciles (EPA2011)
FEMININE OCCUPATIONS
Primary Obligatorysecondary
High Schoolgraduate
BasicVET
AdvancedVET
Diplomatura Udegree+ Grad
Salary in deciles
1
0.9
0.8
0.7
0.6
0.5
0.4
0.3
0.2
0.1
0
1 2 3 4 5 6 7 8 9 10
MASCULINE OCCUPATIONS
Primarios ESO Bachiller FP2 FP3 Diplomatura Grado +PostgradoPrimary Obligatory
secondary High Schoolgraduate
BasicVET
AdvancedVET
Diplomatura Udegree+ Grad
Salary in deciles
1
0.9
0.8
0.7
0.6
0.5
0.4
0.3
0.2
0.1
0
1 2 3 4 5 6 7 8 9 10

Reis. Rev.Esp.Investig.Sociol. ISSN-L: 0210-5233. N.º 171, July - September 2020, pp. 43-62
Marta Ibáñez and María Rosalía Vicente 57
The theory of compensatory differences associates feminine occupations with more flexible working hours that per-mit balancing work inside and outside the home. The 2001 results support this theory in general; however, we can iden-tify certain changes based on our more recent data that qualify it. Thus, working at home, which in 2001 showed no sig-nificant association with feminine jobs, in 2011 did for the those who answered a question about working at home with the response “on more than half the days”. If working at home refers to telecommut-ing, then we could consider this as addi-tional evidence that supports the theory of compensatory difference; however, if it is a case of “taking work home”, then it would imply worse working conditions, which seems plausible in the context of the economic crisis existing in 2011. The fact that in masculine occupations the significant association in 2001 was with the response “occasionally” in regard to working at home, while it was “on more than half the days” in 2011, seems to support the latter conclusion. We also find that working on Sundays in 2001 was negatively associated with feminine oc-cupations while in 2011 it was no longer significant.
A particular case is part-time work. The 2001 estimates show how feminine occupations were clearly associated with part-time work and masculine ones with full-time jobs. In 2011, this pattern con-tinued. In addition, the results from the EPA11 permit us to examine the motive behind part-time work, as we find that in feminine occupations, it is fundamentally associated with not finding full-time em-ployment, while in masculine occupations working part-time is basically for other reasons.
The theory of labour market segmentation considers the characteristics of firms to explain occupational segregation, as-
sociating feminine occupations with both the public sector and with small firms and small markets with low levels of unionisa-tion.
Regarding firm ownership, in the ten years examined, feminine occupations went from being associated with the pri-vate sector to the public sector in a con-sistent manner as shown by the two sam-ples. Regarding masculine occupations, the situation changes depending on the survey: In the EPA they are found concen-trated in the private sector in both years of the survey; while for the EES (the sam-ple that does not include civil servants), the results are not statistically significant. As mentioned earlier, when the results are so dependent on the samples, it makes one suspect that there are other factors not considered, a similar phenomenon to that observed regarding the influence of the size of the firm/employer.
The 2011 data also show that occu-pational segregation, both feminine and masculine, is associated with firms that operate in small, local markets, and to a lesser extent, in national markets rather than international ones.
In terms of the importance of collec-tive bargaining, one of the most interest-ing aspects of the findings from the 2001 surveys is that they found different struc-tures for feminine and masculine occupa-tion, the latter having a greater likelihood of being subject to company agreements (and as we said earlier, in general, less power in collective bargaining). In 2011, the tendency is the reverse, and it is the masculine occupations that have a lower likelihood of being subject to company agreements.
Lastly, the variable referring to branch of activity has a great capacity to explain belonging to segregated or mixed oc-cupations, being the factor that best re-flects the sexual division in the labour

58 Occupational Segregation by Sex in Spain 2001-2011: Ten Years without Progress
Reis. Rev.Esp.Investig.Sociol. ISSN-L: 0210-5233. N.º 171, July - September 2020, pp. 43-62
market. In fact, estimating the multino-mial models using only this variable we obtain pseudo r-squared of 0.25 and 0.20 with the EPA11 and EES10, respectively, which amounts to practically half the ex-planatory capacity of the final models: pseudo r-squared of 0.423 and 0.395, re-spectively.
Over these 10 years, the sexual di-vision in employment continued, with a distribution of the population and coeffi-cients very similar between the two years of the study: feminine jobs are in their majority distributed among Health and Social Services, Catering and Trade Ser-vices, Education, Public Administration and Domestic Services in Households; while masculine jobs are in Manufacturing Industry, Construction, the Primary Sector and Public Administration and Defence. The latter, where there is also a great pro-portion of wage earners in feminine occu-pations shows how the sectors of activ-ity group occupations segregated toward one or the other gender.
Lastly, it is interesting to consider In-formation and Communication activities, a branch that did not exist as such in the CNAE-94 and which gathers together work related with telecommunications and computers, clearly associated with mas-culine occupations in line with the re-sults found in studies by Fernández (2017) and Martínez-Cantos and Castaño (2017) among others.
conclusIons
Despite the belief that occupational segregation has been declining, the data show this is not the case. The more than one and a half million women that entered the labour market during the inter-census period from 2001 to 2011, did so through employment in traditionally feminine oc-
cupations and the wages and benefits in these jobs do not seem to have im-proved.
Thanks to our analysis we have been able to examine the evolution of segrega-tion indices (both general and regarding occupations) without sampling error using census data. Looking at the Lorenz curves suggests that the increase in segregation is a result of an increase in feminised oc-cupations; in addition, the ten most femi-nised jobs recorded almost no change between 2001 and 2011 and in the latter year accounted for 25% of the total femi-nine workforce.
In addition, the characteristics associ-ated with these occupations, in particular their wages and benefits, did not improve over the 10 years analysed. Feminine jobs pay less than neutral ones, and these, in turn, pay less than masculine occupa-tions. The same can be said for another employment characteristic —supervision over others—, which is also clearly cor-related with masculine occupations. In contrast with these results, the benefit of secure employment follows a differ-ent pattern: it is segregated occupations (both masculine and feminine) that have a greater probability of indefinite contracts (in comparison with neutral or mixed oc-cupations).
As with the 2001 data, the theory of compensatory differences is tested using the 2011 data, but, as previously found, is not supported by our findings, as the pro-portion of workers, both men and women, with non-standard hours is small. Part-time work merits special attention, as it is clearly associated with feminine occu-pations (and full-time work is clearly as-sociated with masculine ones); although it must be noted that part-time work is not based so much on the preferences of workers but rather on the impossibility of finding full-time work.
Reis. Rev.Esp.Investig.Sociol. ISSN-L: 0210-5233. N.º 171, July - September 2020, pp. 43-62
Marta Ibáñez and María Rosalía Vicente 59
One of the most interesting findings is in reference to the aspect of the “hierar-chy” of segregated occupations. For ex-ample, we clearly see that occupations that are in their majority held by women are not hierarchically inferior, as they reveal the weight of the old three year diplomatura degrees associated with the public labour market, traditionally with better working and employment condi-tions. In fact, over the ten years being ex-amined, an interesting structural change took place. While in 2001 segregation (both masculine and feminine) was as-sociated with the private sector (and we welcomed the effect of universal selec-tion in the public sector), in 2011 femi-nine segregation is associated with the public sector.
The difference in favour of men ap-pears in unskilled jobs (associated with lower levels of education), as these jobs differ greatly depending on whether they are in their majority masculine or femi-nine occupations. In other words, while those which are largely feminine occupa-tions have lower wages, the masculine occupations with low levels of education are more likely to have higher wages. In short, in masculine occupations, low lev-els of education do not mean low wages. If we add to this the presence in these occupations of collective agreements above the company level (and remember that they are associated with higher sala-ries and power than mixed occupations), we can conclude that masculine occupa-tions enjoy a particularly advantageous situation in the labour market, an obser-vation that had already been made from a more qualitative analysis (for example, in regards to construction workers, dock-workers and train drivers-Ibáñez, 2017; Aguado and Ballesteros, 2018).
In addition, in skilled occupations we find that specialisation through university studies continues to be very segregated
by gender. For example, information and communication activities, where we find all the new occupations related to tele-communications, computer science and data analysis, among others, are clearly masculine. Women constitute a minority of these occupations despite their high salaries and their importance in new la-bour market niches, where there is a lack of qualified personnel and an enormous potential for growth.
Our results point in two (not exclusive) directions in terms of the design of pub-lic policies to reduce occupational seg-regation. On the one hand, there is the need to open up the traditionally low-skilled but well-paid masculine occupa-tions to women. It may only be through legal mechanisms that set employment standards for public bodies and for com-panies that contract with the state, that a wedge can be introduced into these closed worlds. On the other hand, pol-icy must foster women’s access to the high-skilled and well-paid new occupa-tions mentioned, where the presence of women is still very low, while also ensur-ing that their entry into these occupa-tions is not accompanied by a worsening of working and employment conditions, as occupations requiring university de-grees, traditionally better paid, have been the ones that most suffer in this regard when women enter them (Mandel, 2013 for the United States). We are specifically referring to the STEM (science, technol-ogy, engineering and mathematics), up-per management, financial analysis and data analysis. In this case, and given the recent appearance of many of these oc-cupations, it is a question of giving at-tention to women having access to these jobs that are currently generating signifi-cant employment opportunities and that will be closely linked to a significant part of economic activity in the near future.
60 Occupational Segregation by Sex in Spain 2001-2011: Ten Years without Progress
Reis. Rev.Esp.Investig.Sociol. ISSN-L: 0210-5233. N.º 171, July - September 2020, pp. 43-62
BIBlIography
Aguado Bloise, Empar and Ballesteros Doncel, Esmeralda (2018). Segregación ocupacional: participación y reconocimiento de mujeres empleadas en trabajos de dominación masculina. Valencia: Tirant lo Blanc.
Aldaz Odriozola, Leire and Eguía Peña, Begoña (2016a). “Gender and Nationality Based Occupa-tional Segregation in the Spanish Labor Market/ Segregación ocupacional por género y nacio-nalidad en el mercado laboral español”. Revista Española de Investigaciones Sociológicas, 156: 3-20.
Aldaz Odriozola, Leire and Eguía Peña, Begoña (2016b). “Segregación laboral por género en Es-paña y en el País Vasco. Un análisis de cohor-tes”. Estudios de Economía Aplicada, 34(1): 133-154.
Alonso, Pamela; Moscoso, Silvia and Cuadrado, Dámaris (2015). “Procedimientos de selección de personal en pequeñas y medianas empresas españolas”. Revista de Psicología del Trabajo y de las Organizaciones, 31(2): 79-89.
Alonso-Villar, Olga and Río, Coral del (2010). “Seg-regation of Female and Male Workers in Spain: Occupations and Industries”. Hacienda Pública Española, 194(3): 91-121.
Bardasi, Elena, and Gornick, Janet C. (2008). “Work-ing for Less? Women’s Part-time Wage Penal-ties across Countries”. Feminist economics, 14(1): 37-72.
Bettio, Francesca and Verashchagina, Alina (2009). Gender Segregation in the Labour Market: Root Causes, Implications and Policy Responses in the EU. Luxembourg: Publications Office of the European Union, European Commission.
Blackburn, Robert M. (2012). “The Measurement of Occupational Segregation and its Component Dimensions”. International Journal of Social Research Methodology, 15(3): 175-198.
Blau, Francine D.; Brummund, Peter and Liu, Al-bert Y. H. (2013). “Trends in Occupational Seg-regation by Gender 1970-2009: Adjusting for the Impact of Changes in the Occupational Coding System”. Demography, 50(2): 471-492.
Brynin, Malcolm and Perales, Francisco (2016). “Gender Wage Inequality: the De-gendering of the Occupational Structure”. European Sociological Review, 32(1): 162-174.
Cohen, Philip N. (2013). “The Persistence of Work-place Gender Segregation in the US”. Sociology Compass, 7(11): 889-899.
Dueñas Fernández, Diego; Iglesias Fernández, Car-los and Llorente Heras, Raquel (2014). “Occu-pational Segregation by Sex in Spain: Exclusion or Confinement? ”. International Labour Review, 153(2): 311-336.
Dueñas Fernández, Diego; Iglesias Fernández, Car-los and Llorente Heras, Raquel (2016). “Por qué las mujeres no se distribuyen de forma homogé-nea en el mercado de trabajo español? El ‘efecto rechazo’ y el ‘efecto atracción’”. El Trimestre Económico, 83(2): 339-369.
Espina, Álvaro (2016). “Anomalías de la negociación colectiva en España: esclerosis, segmentación, desequilibrios y colusión”. Boletín Económico de ICE 3079: 27-52.
Fernández, Ana Belén (2017). “Mujeres informáticas. La elección formativa”. In Ibáñez, M. (dir.). Mujeres en mundos de hombres: la segregación ocupacional a través del estudio de casos.Madrid: Centro de Investigaciones Sociológicas, pp. 191-222.
Garrido, Luis and González, Juan Jesús (2005). “Mer-cado de trabajo, ocupación y clases sociales”. In: Requena y Díez de Revenga, Miguel and González, Juan Jesús (coords.). Tres décadas de cambio social en España. Madrid: Alianza, pp. 81-126.
Gauchat, Gordon; Kelly, Maura and Wallace, Michael (2012). “Occupational Gender Segrega-tion, Globalization, and Gender Earnings Inequal-ity in US Metropolitan Areas”. Gender & Society 26(5): 718-747.
Goerlich Peset, José María (dir.) (2018). Evolución de los contenidos económicos de la negociación colectiva en España (2007/2015). Madrid: Minis-terio de Empleo y Seguridad Social.
Grönlund, Anne and Magnusson, Charlotta (2013). “Devaluation, Crowding or Skill Specificity? Exploring the Mechanisms behind the Lower Wages in Female Professions”. Social Science Research, 42(4): 1006-1017.
Hakim, Catherine (1998). Social Change and Innovation in the Labour Market. Oxford: Oxford Univer-sity Press.
Hegewisch, Ariane and Hartmann, Heidi (2014). Occupational Segregation and the Gender Wage Gap: A job Half Done. Washington D.C.: Institute for Wom-en’s Policy Research. Available at: http://www.iwpr.org/publications/pubs/occupationalsegrega-tion-and-the-gender-wage-gap-a-job-half-done

Reis. Rev.Esp.Investig.Sociol. ISSN-L: 0210-5233. N.º 171, July - September 2020, pp. 43-62
Marta Ibáñez and María Rosalía Vicente 61
Ibáñez, Marta (2008). “La segregación ocupacional por sexo a examen. Características personales, de los puestos y de las empresas asociadas a las ocupa-ciones masculinas y femeninas”. Revista Española de Investigaciones Sociológicas, 123: 87-122.
Ibáñez, Marta (dir.) (2017). Mujeres en mundos de hombres. La segregación ocupacional a través del estudio de casos. Madrid: Centro de Investi-gaciones Sociológicas.
Ibáñez, Marta and Vicente, María R. (2017). “Con-ceptos, medidas y evolución de la segregación laboral”. In: Ibáñez, M. (dir.). Mujeres en mundos de hombres: la segregación ocupacional a través del estudio de casos. Madrid: Centro de Investigaciones Sociológicas, pp. 15-33.
Iglesias Fernández, Carlos and Llorente Heras, Ra-quel (2010). “Evolución reciente de la segrega-ción laboral por género en España”. Revista Universitaria de Ciencias del Trabajo, 11: 81-105.
ILO (2018). Global Wage Report 2018/19. What Lies Behind Gender Pay Gaps. Geneva: International Labour Organization.
INE (2010). Encuesta de Estructura Salarial 2010. Microdatos. Madrid: INE.
INE (2011a). Censo de Población y Viviendas. Ma-drid: INE.
INE (2011b). Encuesta de Población Activa 2011. Microdatos. Madrid: INE.
INE (2017). Encuesta de Estructura Salarial. Metodología. Available at: https://www.ine.es/metodolo-gia/t22/meto_ees14.pdf
Jarman, Jennifer; Blackburn, Robert M. and Racko, Girts (2012). “The Dimensions of Occupational Gender Segregation in Industrial Countries”. Sociology, 46(6): 1003-1019.
Mandel, Hadas (2013). “Up the Down Staircase: Women’s Upward Mobility and the Wage Penalty for Occupational Feminization, 1970-2007”. Social Forces, 91(4): 1183-1207.
Martínez García, José S. (2017). Estructura social y desigualdad en España. Madrid: Los libros de la Catarata.
Martínez-Cantos, José Luis and Castaño, Cecilia (2017). “La brecha digital de género y la escasez de mujeres en las profesiones TIC”. Panorama Social, 25: 49-65.
Murphy, Emily and Oesch, Daniel (2016). “The Femi-nization of Occupations and Change in Wages: A panel Analysis of Britain, Germany, and Switzer-land”. Social Forces, 94(3): 1221-1255.
Pan, Jessica (2015). “Gender Segregation in Oc-cupations: The Role of Tipping and Social In-teractions”. Journal of Labor Economics, 33(2): 365-408.
Polavieja, Javier (2008). “The Effect of Occupational Sex-Composition on Earnings: Job- Specializa-tion, Sex-Role Attitudes and the Division of Do-mestic Labour in Spain”. European Sociological Review, 24(2): 199-213.
Polavieja, Javier (2012). “Socially Embedded Invest-ments: Explaining Gender Differences in Job Specific Skills”. American Journal of Sociology, 118(3): 592-634.
Río, Coral del and Alonso-Villar, Olga (2010). “Gen-der Segregation in the Spanish Labor Market: An Alternative Approach”. Social Indicators Research, 98(2): 337-362.
Rytina, Nancy (1981). “Occupational Segregation and Earnings Differences by Sex”. Monthly Labor Review, 104(1): 49-53.
Siltanen, Janet; Jarman, Jennifer and Blackburn, Robert M. (1995). Gender inequality in the labour market. Occupational concentration and segregation. Geneva: International Labour Office.
Sokoloff, Natalie J. (1992). Black Women and White Women in the Professions: Occupational Segregation by Race and Gender 19601980. New York: Routledge.
Torre, Margarita (2017). “Attrition from Male-dom-inated Occupations: Variation among Occupa-tions and Women”. Sociological Perspectives, 60(4): 665-684.
Vicente Merino, Ana M.; Martínez Aguado, Ju-liana; Martínez Aguado, Timoteo; Calderón Mi-lán, M. José and Moreno Ruiz, Rafael (2010). Cambios en el mercado laboral español: la incorporación de la mujer al mercado laboral: factores determinantes a nivel geográfico, profesional y por actividades en el Sistema de Seguridad Social. Madrid: Ministerio de Trabajo e Inmigración.
ReCepTION: February 14, 2019aCCepTaNCe: September 26, 2019

62 Occupational Segregation by Sex in Spain 2001-2011: Ten Years without Progress
Reis. Rev.Esp.Investig.Sociol. ISSN-L: 0210-5233. N.º 171, July - September 2020, pp. 43-62
appendIx
GRaph a1. Probability of working in a feminine or masculine occupation by education level and salary in deciles (EES2010)
FEMININE OCCUPATIONS
Primary Obligatorysecondary
High Schoolgraduate
BasicVET
AdvancedVET
Diplomatura Udegree+ Grad
Hourly salary by deciles
1
0.9
0.8
0.7
0.6
0.5
0.4
0.3
0.2
0.1
0
1 2 3 4 5 6 7 8 9 10
MASCULINE OCCUPATIONS
Primary Obligatorysecondary
High Schoolgraduate
BasicVET
AdvancedVET
Diplomatura Udegree+ Grad
Hourly salary by deciles
1
0.9
0.8
0.7
0.6
0.5
0.4
0.3
0.2
0.1
0
1 2 3 4 5 6 7 8 9 10