Embed Size (px)
Citation preview
Justifying Simulation
Why use simulation? Accurate Depiction of Reality
Anyone can perform a simple analysis manually. However, as the complexity of the analysis increases, so does the need to employ computer-based tools. While spreadsheets can perform many calculations to help determine the operational status of simple systems, they use averages to represent schedules, activity times, and resource availability. This does not allow them to accurately reflect the randomness and interdependence present in reality with resources and other system elements. Simulation, however, does take into account the randomness and interdependence which characterize the behavior of your real-life business environment.
Using simulation, you can include randomness through properly identified probability distributions taken directly from study data. For example, while the time needed to perform an assembly may average 10 minutes, special orders may take as many as 45 minutes to complete. A spreadsheet will force you to use the average time, and will not be able to accurately capture the variability that exists in reality.
Simulation also allows interdependence through arrival and service events, and tracks them individually. For example, while order arrivals may place items in two locations, a worker can handle only one item at a time. Simulation accounts for that reality, while a spreadsheet must assume the operator to be available simultaneously at both locations.
Insightful system evaluations
Simulation tracks events as they occur and gathers all time-related data for reporting purposes. The information available about system operations is more complete with simulation than with other techniques. With static analysis techniques such as queuing theory and spreadsheets, you know the average wait time and number of items in a queue but there is no way to further examine the data. With simulation, you know the wait time, number of items, minimum and maximum values, confidence interval, data distribution, and the time plot of values. It is always more valuable to know that the number of items in a queue exceeds 10 only 5% of the time than to know that the average number waiting is 2.
Static analysis techniques allow you to use only average parameters. Such limitations can mislead you with estimates that suggest an over- or under-capacity situation. For example, spreadsheets assume that production orders move unconstrained when, in fact, an operator must facilitate the move. This can yield a wildly inaccurate capacity estimate, and can put millions of dollars at risk in unnecessary capital investment or late delivery of orders.

Justifying Simulation
Simulation Modeling vs. Spreadsheet Analysis Dynamics for Predictive Analysis
Spreadsheets are static and can only provide a quantitative result for one moment in of time, where simulation replicates your dynamic business reality. The idea of “running next year’s anticipated orders through the plant” can not be done dynamically in a spreadsheet. The power to “look into the future” and understand the impact on multiple key metrics is what simulation provides.
The ability to accurately track future system performance and understand key performance metrics is illustrated in the ProModel output report below. Here we can see the precise amount of WIP at any given point in time through the duration of the simulation run. Note the dynamics of the results for this model run, and see the point in time where the simulated facility ran out of raw materials for one product line at approximately 1800 hrs.

Justifying Simulation
Simulation Modeling vs. Spreadsheet Analysis Spreadsheets = Error of Averages
Spreadsheets are also deterministic, meaning that average values are used to describe the behavior of any variable event in order to make calculations. Use of averages for cycle times, resource availability, and arrival patterns for performance analysis quickly leads to a significant cumulative inaccuracy known as the “error of averages.” Simulation allows the user to capture the specific variability of multiple interdependent processes and provides results which are orders of magnitude more accurate than deterministic analysis.
Consider the simple example below, which shows a simple manufacturing cell. The results below show the difference of using an average work arrival of 30 sec, vs using a distribution of arrivals (some early, some late). Note the significant difference in cycle time, queue time, and throughput results even in this simple example.
TT oo ttaa ll CC yy cc llee TT iimmee ((aa vv gg.. ))
PP eerr ffoo rrmmaa nncc ee MMeettrr iicc
SS ttaa ttiioo nnss UU ttii ll iizz aa ttiioo nn
WW oo rrkk iinn QQ uueeuuee ((aa vv gg.. ))
((mmaa xx .. ))
AA vv gg ttiimmeess
110000%%
11 mmiinn
00
00
TT rr iiaa nngguu llaa rr ddiiss ttrr iibbuu ttiioonnss
9999.. 66%%
1100.. 0077 mmiinn
4411
4433
SS ttaa ttiicc AA nnaa llyy ss iiss DD yy nnaa mmiicc AA nnaa llyy ss iiss
((mmaa xx .. )) 11 mmiinn 2222.. 5522 mmiinn
TT hhrroo uugghh ppuu tt 990044995566
Avg. Work Arrival interval = 30 sec.
Avg. Station process time = 1 min.
CSR
QQuuee uuee
Station 1
Station 2
Incoming Work
Actual Work Arrival interval =
Triangular Distribution Min 10 sec
Mode 30 sec Max 50 sec
Actual Station process time = Triangular
Distribution Min 30 sec
Mode 60 sec Max 100 sec
Results from just 8 hours...

Justifying Simulation
Simulation Modeling vs. Spreadsheet Analysis Understanding Interdependencies
What happens when two or three simultaneous events occur, all of which require a single resource? For example, an operator may be responsible for loading and unloading several machines and addressing downtimes. This creates competition for that operator and causes delays downstream for which a spreadsheet cannot account. This interdependence which exists in your business reality is a key component of simulation.
The idea of interdependencies goes beyond competition of resources (labor and machines) to include the impact of skill level, order types, order volume, cost of money over time, and other key issues. Simulation allows the user to quickly see bottlenecks caused by system interdependencies before implementing process changes and improvements. The output below illustrates the interdependent performance summary of labor and machines, and their combined impact on part flow and throughput.

Justifying Simulation
Simulation Modeling vs. Spreadsheet Analysis Experimentation and Data
Spreadsheet based experimentation (manipulating cells and formulas) provides only very basic metrics, and requires cumbersome reports which do not intuitively direct a decision maker to the source of a problem. ProModel collects statistics on all user-defined key performance metrics in a simulation run, which allows for rapid design of experiments with detailed comparative results.
Consider one type of simulation experiment to understand the maximum capacity of a system by testing constrained vs. un-constrained scenarios. This allows the user to understand how the system would perform “in a perfect world” if system constraints were eliminated. Simulation will generate a demand profile for those constraints, showing exactly what the maximum requirements would be, AND at what point in time they are required. For the example below, imagine a process that requires 3 different types of resources to complete. The unconstrained simulation assumes every time a process requires a resource they are available, and the report shows how many resources were needed and when over the model run time. In the constrained system there are only 6 resources available, so only 6 are used and the time required to complete the process is longer. In the unconstrained system sometimes 30 people are used and other times almost none, but the time required to complete the process is much shorter. This demonstrates the maximum capacity of the system, and subsequent experiments might test different scheduling options and the impacts of these constraints on service level.

Justifying Simulation
Simulation Modeling vs. Spreadsheet Analysis Animated Visualization
Animation is an extremely powerful aspect of simulation. Feedback from animation assures model accuracy, identifies bottlenecks, and helps isolate which system elements you could modify to achieve better results. Animation is also an excellent presentation and training tool. Simulation animations communicate new ideas easily and effectively, and clearly demonstrate the effects of a local change on a global system. It is much easier to communicate using an animation of your process over your facility layout than using standard spreadsheet data.
Advanced optimization techniques Optimization techniques such as linear, goal, and dynamic programming are valuable when you want to maximize or minimize a single element (e.g., cost, utilization, revenue, or wait time). Unfortunately, these techniques limit you to only one element, often at the expense of secondary goals. They do not allow randomness, which requires use of averages and leads to inaccurate results as described above. Simulation with optimization allows you to examine multiple elements simultaneously and track system performance with respect to activity time, arrival and exit rates, costs, revenues, and system utilization. Optimizing for multiple elements allows you to apply more effective solutions by provides you with better information to make decisions. ProModel’s built-in optimization module allows you to define multiple objective functions through weighting factors assigned to each element.
Justifying Simulation
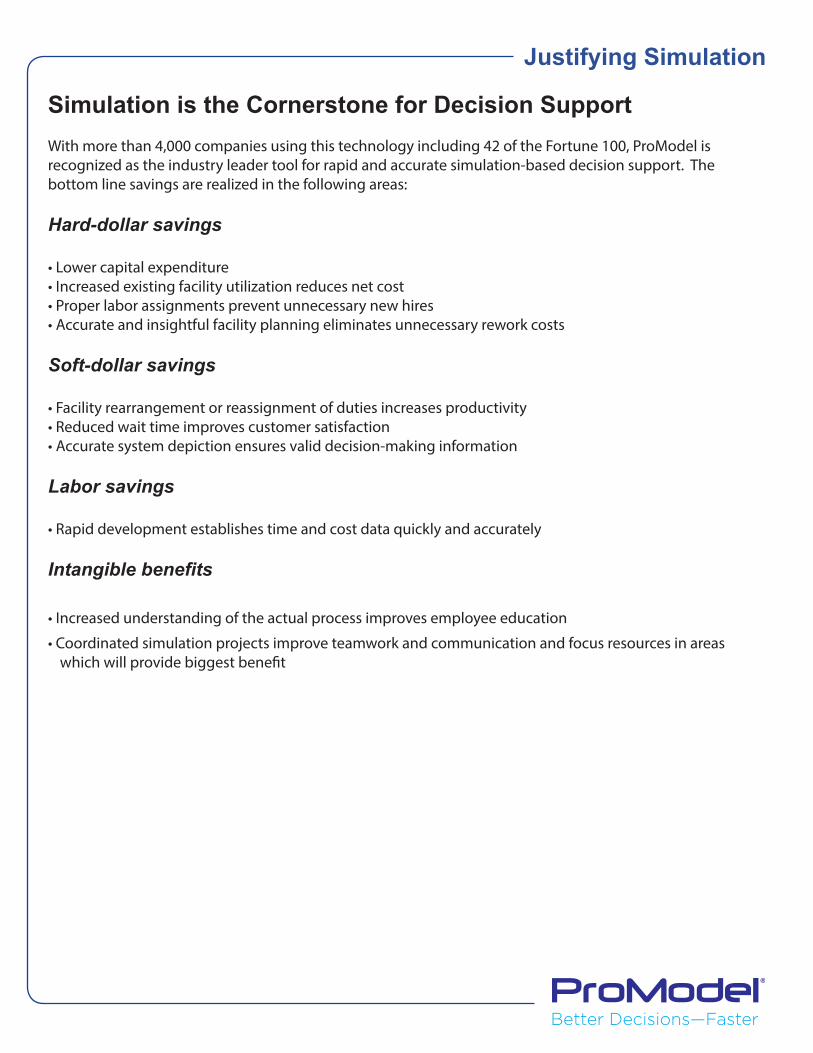
Simulation is the Cornerstone for Decision Support With more than 4,000 companies using this technology including 42 of the Fortune 100, ProModel is recognized as the industry leader tool for rapid and accurate simulation-based decision support. The bottom line savings are realized in the following areas:
Hard-dollar savings • Lower capital expenditure • Increased existing facility utilization reduces net cost • Proper labor assignments prevent unnecessary new hires • Accurate and insightful facility planning eliminates unnecessary rework costs
Soft-dollar savings • Facility rearrangement or reassignment of duties increases productivity • Reduced wait time improves customer satisfaction • Accurate system depiction ensures valid decision-making information
Labor savings
• Rapid development establishes time and cost data quickly and accurately
Intangible benefits
• Increased understanding of the actual process improves employee education
• Coordinated simulation projects improve teamwork and communication and focus resources in areas which will provide biggest benefit