Embed Size (px)
Citation preview

Juniper M Series
Device Management
Supports Management Module SM-JPR1000

D e v i c e M a n a g e m e n t Page 2 J u n i p e r M S e r i e s
Copyright NoticeDocument 3600. Copyright © 2002-present Aprisma Management Technologies, Inc. All rights reserved worldwide. Use, duplication, or disclosure by the United States government is subject to the restrictions set forth in DFARS 252.227-7013(c)(1)(ii) and FAR 52.227-19.
Liability DisclaimerAprisma Management Technologies, Inc. (“Aprisma”) reserves the right to make changes in specifications and other information contained in this document without prior notice. In all cases, the reader should contact Aprisma to inquire if any changes have been made.The hardware, firmware, or software described in this manual is subject to change without notice.IN NO EVENT SHALL APRISMA, ITS EMPLOYEES, OFFICERS, DIRECTORS, AGENTS, OR AFFILIATES BE LIABLE FOR ANY INCIDENTAL, INDIRECT, SPECIAL, OR CONSEQUENTIAL DAMAGES WHATSOEVER (INCLUDING BUT NOT LIMITED TO LOST PROFITS) ARISING OUT OF OR RELATED TO THIS MANUAL OR THE INFORMATION CONTAINED IN IT, EVEN IF APRISMA HAS BEEN ADVISED OF, HAS KNOWN, OR SHOULD HAVE KNOWN, THE POSSIBILITY OF SUCH DAMAGES.Trademark, Service Mark, and Logo InformationSPECTRUM, IMT, and the SPECTRUM IMT/VNM logo are registered trademarks of Aprisma Management Technologies, Inc., or its affiliates. APRISMA, APRISMA MANAGEMENT TECHNOLOGIES, the APRISMA MANAGEMENT TECHNOLOGIES logo, MANAGE WHAT MATTERS, DCM, VNM, SpectroGRAPH, SpectroSERVER, Inductive Modeling Technology, Device Communications Manager, SPECTRUM Security Manager, and Virtual Network Machine are unregistered trademarks of Aprisma Management Technologies, Inc., or its affiliates. For a complete list of Aprisma trademarks, service marks, and trade names, go tohttp://www.aprisma.com/manuals/trademark-list.htm.All referenced trademarks, service marks, and trade names identified in this document, whether registered or unregistered, are the intellectual property of their respective owners. No rights are granted by Aprisma Management Technologies, Inc., to use such marks, whether by implication, estoppel, or otherwise. If you have comments or concerns
about trademark or copyright references, please send an e-mail to [email protected]; we will do our best to help.Restricted Rights Notice(Applicable to licenses to the United States government only.)
This software and/or user documentation is/are provided with RESTRICTED AND LIMITED RIGHTS. Use, duplication, or disclosure by the government is subject to restrictions as set forth in FAR 52.227-14 (June 1987) Alternate III(g)(3) (June 1987), FAR 52.227-19 (June 1987), or DFARS 52.227-7013(c)(1)(ii) (June 1988), and/or in similar or successor clauses in the FAR or DFARS, or in the DOD or NASA FAR Supplement, as applicable. Contractor/manufacturer is Aprisma Management Technologies, Inc. In the event the government seeks to obtain the software pursuant to standard commercial practice, this software agreement, instead of the noted regulatory clauses, shall control the terms of the government's license.
Virus DisclaimerAprisma makes no representations or warranties to the effect that the licensed software is virus-free.Aprisma has tested its software with current virus-checking technologies. However, because no antivirus system is 100 percent effective, we strongly recommend that you write-protect the licensed software and verify (with an antivirus system in which you have confidence) that the licensed software, prior to installation, is virus-free.Contact InformationAprisma Management Technologies, Inc.273 Corporate DrivePortsmouth, NH 03801Phone: 603-334-2100U.S. toll-free: 877-468-1448Web site: http://www.aprisma.com

D e v i c e M a n a g e m e n t Page 3 J u n i p e r M S e r i e s
ContentsINTRODUCTION 5
Purpose and Scope ........................................................5Required Reading ...........................................................5Supported Devices..........................................................6The SPECTRUM Model ..................................................6
TASKS 10
DEVICE VIEW 11
Interface Icons ..............................................................12Interface Icon Subviews Menu......................................13Secondary Address Panel ............................................14
DEVICE TOPOLOGY VIEW 15
APPLICATION VIEWS 16
Main Application View...................................................16Supported Applications .................................................17
Common Applications................................................17Device-Specific MIBs.................................................18
Application Icons...........................................................19MPLS Application..........................................................19
MPLS Configuration View..........................................20Administration Group Section ................................20
MPLS LSP Table .......................................................21MPLS LSP Path Table...............................................21
MPLS Path Table ......................................................22
PERFORMANCE VIEWS 24
CONFIGURATION VIEWS 25
Router Configuration View ............................................ 25
STATISTICS 27
CPU/Memory Statistics ................................................. 27Environmental Statistics................................................ 28DCU Statistics............................................................... 28Firewall Statistics .......................................................... 29
Firewalls Table .......................................................... 29Firewall Counter Table .............................................. 29
Alarm Statistics ............................................................. 30
REDUNDANT COMPONENT MONITORING INTELLIGENCE 31
Passive Monitoring........................................................31Active Monitoring .......................................................... 32
REDUNDANCY 33
Redundancy Configuration ...........................................33Redundancy Information............................................... 33

C o n t e n t s C o n t e n t s
D e v i c e M a n a g e m e n t Page 4 J u n i p e r M S e r i e s
MODEL INFORMATION VIEW 35
INDEX 36

D e v i c e M a n a g e m e n t Page 5 J u n i p e r M S e r i e s
Introduction
This section introduces the SPECTRUM Device Management documentation for the M5, M10, M20, M40,
M40e, and M160 Internet Backbone Routers manufactured by Juniper M Series NetworksR.
This introduction provides the following topics:
• Purpose and Scope
• Required Reading
• Supported Devices (Page 6)
• The SPECTRUM Model (Page 6).
Purpose and ScopeUse this document as a guide for managing the Juniper M Series devices described on Page 6 with SPECTRUM management module SM-JPR1000. The documentation describes the icons, menus, and views that enable you to remotely monitor, configure, and troubleshoot Juniper M Series Networks devices through software models in your SPECTRUM database.
Information specific to SM-JPR1000 is what is primarily included under this documentation topic. For general information about device management using SPECTRUM and explanations
of basic SPECTRUM functionality and navigation techniques, refer to the topics listed under Required Reading.
Required ReadingTo use this documentation effectively, you must be familiar with the information covered by the other SPECTRUM online documentation topics listed below.
• Getting Started with SPECTRUM for Operators
• Getting Started with SPECTRUM for Administrators
• How to Manage Your Network with SPECTRUM
• SPECTRUM Views
• SPECTRUM Menus
• SPECTRUM Icons
• Management Module Software Release Notice

I n t r o d u c t i o n S u p p o r t e d D e v i c e s
D e v i c e M a n a g e m e n t Page 6 J u n i p e r M S e r i e s
Supported DevicesSPECTRUM management module SM-JPR1000 currently lets you model the Juniper M5, M10, M20, M40, M40e, and M160 Internet Backbone Routers. These are high performance routers that support a variety of Internet applications such as high speed access, public and private peering, site hosting, and backbone core networking. All of the routers run the same JUNOS internet software, Internet Processor ASIC technology, and Multiprotocol Label Switching for traffic control.
The routers have the characteristics listed in Table 1. The ASIC Forwarding Rate is 40 Mpps for all routers except the M160, which is 160 Mpps (aggregate).
The SPECTRUM ModelThe model types for Juniper M series devices are:
• JNPR_Mxxx• JnprRedundRtr• AlarmMib• ATMMib• IPv4Mib• IPv6Mib• DCUMib • JNPR_MPLS_Mib • JNPR_MPLS_App • Juniper • JNPR_If_Mib • JNPRDev • JNPR_Chas_Mib • JNPR_AppDerPt • FirewallMib
The JNPR_Mxxx model type is now used to model Juniper M Series routers that do not support the redundant component architecture. These include the Juniper M5, M10, and M40. This provides basic modeling functionality and includes support for all of Juniper’s proprietary Mibs.
The JnprRedundRtr model type is now used to model Juniper M Series routers that support the
Table 1: Router Characteristics
Model Number
Throughput (Gbps)
Number PIC Slots
M5 5 4
M10 10 8
M20 20 16
M40 40 32
M40e 40 32
M160 160 32

I n t r o d u c t i o n T h e S P E C T R U M M o d e l
D e v i c e M a n a g e m e n t Page 7 J u n i p e r M S e r i e s
redundant component architecture. These include the Juniper M20, M40e, and M160. This provides Passive and Active Monitoring in addition to the functionality that is provided by the JNPR_Mxxx model type.
Modeling results in the creation of Device icons that represent the devices and Application icons that represent their supported applications.
The Device icons contain double-click zones and provide access to Icon Subviews menus that let you perform device management activities such as those listed in Tasks (Page 10) section.
As Figure 1 shows, the appearance of the Device icons varies slightly depending on the kind of view it appears in.
Figure 1: Device Icons
The device-specific Icon Subviews menu options available from the Device icon for JNPR_Mxxx (M5, M10, M40) are listed in Table 2.
Note:Note:
The management interface of each Routing Engine needs to be assigned a unique IP Address. The IP address of the backup Routing Engine should be added to the Preferred Address List. This ensures that SPECTRUM can regain contact with the router should the Master Routing Engine fail, or be reset. See Setting the Preferred Address List on Page 26 for further information.
Table 2: JNPR_Mxxx Icon Subviews
Option Accesses the...
Device Device View (Page 11)
DevTop Device Topology View (Page 15)
Application Application Views (Page 16)
Configuration Configuration Views (Page 25)
Statistics Statistics (Page 27)
Model Name
JNPR_Mxxx
Model Name
JNPR_Mxxx
Small Device icon appears inTopology and Application views
Large Device icon appears inDevice Topology, Location, andInterface Device views.

I n t r o d u c t i o n T h e S P E C T R U M M o d e l
D e v i c e M a n a g e m e n t Page 8 J u n i p e r M S e r i e s
The device-specific Icon Subviews menu options available from the Device icon for JnprRedundRtr (M20, M40e, M160) are listed in Table 3.
The rest of this document covering the Juniper M Series management module is organized as follows:
• Tasks (Page 10)
• Device View (Page 11)
• Device Topology View (Page 15)
• Application Views (Page 16)
• Performance Views (Page 24)
• Configuration Views (Page 25)
• Statistics (Page 27)
Fault Management
For further information refer to How to Manage Your Network with SPECTRUM documentation.
Model Information
Model Information View (Page 35)
Primary Application
Menu options that let you select the primary application; for example, Gen Bridge App, MIB-II, etc.
Table 3: JnprRedundRtr Icon Subviews
Option Accesses the...
Device Device View (Page 11)
DevTop Device Topology View (Page 15)
Application Application Views (Page 16)
Configuration Configuration Views (Page 25)
Table 2: JNPR_Mxxx Icon Subviews
Option Accesses the...
Statistics Statistics (Page 27)
Redundancy Redundancy (Page 33)
Fault Management
For further information refer to How to Manage Your Network with SPECTRUM documentation.
Model Information
Model Information View (Page 35)
Primary Application
Menu options that let you select the primary application; for example, Gen Bridge App, MIB-II, etc.
Table 3: JnprRedundRtr Icon Subviews
Option Accesses the...

I n t r o d u c t i o n T h e S P E C T R U M M o d e l
D e v i c e M a n a g e m e n t Page 9 J u n i p e r M S e r i e s
• Redundant Component Monitoring Intelligence (Page 31)
• Redundancy (Page 33)
• Model Information View (Page 35)

D e v i c e M a n a g e m e n t Page 10 J u n i p e r M S e r i e s
Tasks
This section contains an alphabetical list of device management tasks, with each task providing one or more links to views that let you perform the task.
Administrative Information (check)• Model Information View (Page 35)
Alarm Thresholds (set)• Interface Icon Subviews Menu (Page 13)
Configuration Information (check)• Configuration Views (Page 25)
IP Address (find/change)• Device View (Page 11)• Secondary Address Panel (Page 14)
LSP Transmission Info (check)• MPLS LSP Table (Page 21)• MPLS LSP Path Table (Page 21)• MPLS Path Table (Page 22)
MPLS/LSP Configuration (check)• MPLS Configuration View (Page 20)
Network Type (check)• Network Type Label (Page 13)
Performance (check)• Device View (Page 11)• Interface Icons (Page 12)• Performance Views (Page 24)
Redundancy Configuration (set)• Active Monitoring (Page 33)• Active Polling Interval (Page 33)
Redundant Component Monitoring Intelli-gence (set)
• Passive Monitoring (Page 31)• Active Monitoring (Page 32)
Topology (check)• Device Topology View (Page 15)

D e v i c e M a n a g e m e n t Page 11 J u n i p e r M S e r i e s
Device View
This section describes the Device views and subviews available for models of Juniper M Series devices in SPECTRUM.
Access: From the Icon Subviews menu for the Device icon, select Device.
This view (Figure 2) uses icons and labels to represent the device and its components, such as modules, ports, and applications. The view provides dynamic configuration and performance information for each of the device’s serial and network I/O ports, which are represented by Interface icons in the bottom panel of the view. The middle panel of the view displays a Device icon, which lets you monitor the device operation and access other device-specific views.
Figure 2: Device View
SpectroGRAPH: Router Device: Model Name
File View HelpTools
Model NameContactDescriptionLocation
Sys Up TimeManufacturerDevice TypeSerial Number
Network Address
Interface Description
Filter Physical
Interface Options PanelDevice Icon
XYZ_Mxxx
Model Name
1Ethernet
0:0:1D:F:FD:B6
ei0
0.0.0.0
ON
5SFTWARLPBK
0:0:1D:F:FD:B6
lo0
0.0.0.0
ON
9ATM8023
0:0:1D:F:FD:B6
zn1
0.0.0.0
ON
512AAL5
UAAL5
0.0.0.0
ON
2ATMCPU
0.0.0.0
ON
6ATM portCPU.1
0.0.0.0
ON
ATM7A1
0.0.0.0
ON
ATM7B1
0.0.0.0
ON
ATM7B2
0.0.0.0
ON
ATM7B3
0.0.0.0
ON
ATM8B1
0.0.0.0
ON
ATM8B2
0.0.0.0
ON
ATM8B3
0.0.0.0
ON
ATM8B4
0.0.0.0
ON
10
2783905 2783909
11
7
3 4
8
Interface Icons
Bookmarks
Model Name of type XYZ_Mxxx of Landscape node: Primary
Primary Application Gen Bridge App

D e v i c e V i e w I n t e r f a c e I c o n s
D e v i c e M a n a g e m e n t Page 12 J u n i p e r M S e r i e s
Interface IconsFigure 3 shows a close-up of an Interface icon from the Device view. Most of the informational labels on the icon also provide double-click access to other views, as explained in the following label descriptions.
Figure 3: Interface Icon
Interface Number LabelThis label displays the interface (port) number.
IF Status LabelThis label displays the current status of the interface for the primary application selected, e.g., Gen Rtr App or MIB-II App. Table 4 lists the possible label color representations. Note that the color of the label also depends on the interface’s current Administrative Status, which you set in the Interface Configuration View. This view can be accessed by double-clicking the Interface Type label.
Interface Type LabelThis label identifies the interface type (Ethernet, ATM, etc.). Double-click this label to access the Interface Configuration view. See the SPECTRUM Views documentation.
c
f
b
1ethernet
0:0:1D:F:FD:B6
a
a Interface Number Label
b IF Status Label
c Interface Type Label
d Network Type Label
e Physical Address Label
f IP Address Label
fxp0
0.0.0.0
d
e
ONTable 4: Interface Status Label Colors
Color OperationalStatus
AdministrativeStatus
LabelText
Green up up ON
Blue down down OFF
Yellow down up OFF
Red testing testing TEST

D e v i c e V i e w I n t e r f a c e I c o n S u b v i e w s M e n u
D e v i c e M a n a g e m e n t Page 13 J u n i p e r M S e r i e s
Network Type LabelThis label identifies the type of network to which the interface is connected. Double-click the label to open the Model Information view for the interface.
Physical Address LabelThis label displays the physical (MAC) address of the interface. Double-click this label to open the Address Translation Table (AT).
IP Address LabelThis label displays the IP address for the interface. Double-click this label to open the Secondary Address Panel (Page 14), which lets you change the address and mask for the interface.
Interface Icon Subviews MenuTable 5 lists the device-specific interface Icon Subviews menu options and the views to which they provide access.
Table 5: Interface Icon Subviews Menu
Option Accesses the...
Detail Interface Detail view, which displays packet, error, and discard breakdown statistics for the interface.
IF Configuration Interface Configuration view (see SPECTRUM Views).
Address Translation Table
Address Translation Table (AT) (see SPECTRUM Views).
Secondary Address Panel
Secondary Address Panel (Page 14).
Thresholds Interface Threshold view, which lets you set the on/off alarm thresholds for load, packet rate, error rate, and% discarded for the interface.
Model Information
Model Information View (Page 35).
Trap Configuration
Interface Trap Configuration view (see How to Manage Your Network with SPECTRUM).

D e v i c e V i e w S e c o n d a r y A d d r e s s P a n e l
D e v i c e M a n a g e m e n t Page 14 J u n i p e r M S e r i e s
Secondary Address PanelAccess: From the Icon Subviews menu for the Interface icon in the Device view, select Secondary Address Panel.
This panel provides a table of IP addresses and masks obtained from the Address Translation table within the device’s firmware. You can change the current address displayed in the IP Address field by selecting an entry from the table in this panel and clicking the Update button.

D e v i c e M a n a g e m e n t Page 15 J u n i p e r M S e r i e s
Device Topology View
This section provides a brief description of the Device Topology view available for models of the Juniper M Series devices.
Access: From the Icon Subviews menu for the Device icon, select DevTop.
The Device Topology view (Figure 4) shows the connections between a modeled device and other network entities. The lower panel of the view uses Interface icons to represent the device’s serial, network, and I/O ports. These icons provide the same information and menu options as those in the Device View (Page 11). If a device is connected to a particular interface, a Device icon appears on the vertical bar above the Interface icon along with an icon representing the network group that contains the device.
Refer to the SPECTRUM Views documentation for details on Device Topology view.
Figure 4: Device Topology View
* File View HelpTools
1Ethernet
0:0:1D:F:FD:B6ei0
0.0.0.0
ON 2ATM
0:0:1D:F:FD:B6A2
0.0.0.0
ON 3ATM
0:0:1D:F:FD:B6CPU
0.0.0.0
ON
JNPR_Mxxx
Model Name
Bookmarks
SpectroGRAPH: Device Topology: Model Name
Graphic ofJuniper M Series
Device
Model Name of type JNPR_Mxxx of Landscape node: Primary

D e v i c e M a n a g e m e n t Page 16 J u n i p e r M S e r i e s
Application Views
This section describes the main Application view and the associated application-specific subviews available for models of Juniper M Series devices in SPECTRUM.
Access: From the Icon Subviews menu for the Device icon, select Application.
Main Application ViewWhen a device model is created, SPECTRUM automatically creates models for each of the major and minor applications supported by the device. The main Application view identifies all of these application models, shows their current condition status, and provides access to application-specific subviews. Figure 5 shows this view in the Icon mode. If you prefer the List mode, which displays applications as text labels, select View > Mode > List.
For more information on this view, refer to the MIBs and the Application View document.
Figure 5: Main Application View
SpectroGRAPH: Application: Model Name
Model Name
Contact
Description
Location
Network Address System Up Time
Manufacturer
Device Type
Serial Number
Model Name
6E132_25
Model Name
Model Type
File View Tools Bookmarks
Model Name of type <model type> of Landscape node: Primary
Help

A p p l i c a t i o n V i e w s S u p p o r t e d A p p l i c a t i o n s
D e v i c e M a n a g e m e n t Page 17 J u n i p e r M S e r i e s
Supported ApplicationsSPECTRUM’s applications can be grouped within two general categories as follows:
• Applications associated with non proprietary MIBs. See Common Applications below.
• Applications associated with device-specific MIBs. See Device-Specific MIBs (Page 18).
Common ApplicationsFor the most part, these applications represent the non proprietary MIBs supported by devices. Listed below (beneath the title of the SPECTRUM document that describes them) are some of the common applications currently supported by SPECTRUM. Refer to these documents when your devices support these applications.
• Routing Applications- Generic Routing- Repeater- AppleTalk- DECnet
- OSPF- OSPF2- BGP4- VRRP- RFC 2932
• Bridging Applications- Ethernet Special Database- Spanning Tree- Static- Transparent- PPP Bridging- Source Routing- Translation- QBridge
• MIB II Applications- SNMP- IP- ICMP- TCP- System2- UDP
• Transmission Applications- FDDI- Point to Point- DS1- DS3
Note:Note:
The documents listed below (in bold font) are available for viewing at:
www.aprisma.com/manuals/

A p p l i c a t i o n V i e w s S u p p o r t e d A p p l i c a t i o n s
D e v i c e M a n a g e m e n t Page 18 J u n i p e r M S e r i e s
- RS-232- WAN- Frame Relay- Token Ring- Ethernet- Fast Ethernet- RFC 1317App- RFC 1285App- RFC 1315App- 802.11App- SONET
• Technology Applications- APPN- ATM Client- DHCP- DLSw- PNNI- RFC 1316App- RFC 1514- RFC 2287- RFC 2790- RFC 2925
• DOCSIS Applications- DOCSISCblDvApp - DOCSISQOSApp- DOCSISBPI2App - DOCSISBPIApp
- DOCSISIFApp
• Digital Subscriber Line (DSL) Applications- ADSL
Device-Specific MIBsSPECTRUM imports the following device-level proprietary MIBs into its database:
• JUNIPER-DCU-MIB (mib-dcu)• JUNIPER-FIREWALL-MIB (mib-firewall)• JUNIPER-IF-MIB (mib-interface-extensions)• JUNIPER-MIB (mib-chassis)• MPLS-MIB (mib-mpls) • JUNIPER-PING-MIB (mib-ping)• JUNIPER-ALARM-MIB (mib-alarm)• JUNIPER-IPv4-MIB (mib-ipv4)• JUNIPER-IPv6-MIB (mib-ipv6)• JUNIPER-ATM-MIB (mib-atm)
These MIBs can be used in conjunction with SPECTRUM’s optional customization products (referred to as the Level I Tool Kits) to create application models and views that display the condition of selected MIB objects.

A p p l i c a t i o n V i e w s A p p l i c a t i o n I c o n s
D e v i c e M a n a g e m e n t Page 19 J u n i p e r M S e r i e s
The following device-specific applications are described in the remainder of this section:
• MPLS Application.
Application IconsWhen the main Application view is in the Icon mode, each application model is represented by an icon (Figure 6). Double-clicking the Model Name label opens the associated Model Information view—see Model Information View (Page 35). For some applications, the Model Type label is also a double-click zone, which opens an
application-specific view. Any views accessible through these double-click zones are also accessible from the Application icon’s Icon Subviews menu.
Figure 6: Application Icon
MPLS ApplicationMPLS has emerged from the IETF’s effort to standardize a number of proprietary multilayer switching solutions for the Internet. It provides an alternative to ATM for multiplexing multiple services over individual circuits. MPLS uses a control driven model to initiate the assignment
Note:Note:
Aprisma Management Technologies can provide training, technical assistance, and custom engineering support services for creating application models and their associated views.
Note:Note:
Some views contain color-coded pie charts that display statistics. Also, some views contain Sort, Find, and Update buttons that let you update values in a view and find information. Refer to SPECTRUM Views for more information on these subjects.
a Model Name Label
b Condition Status Label
c Model Type Label
a
b
cSNMP2_Agent
MIB II App
SNMP2_Agent

A p p l i c a t i o n V i e w s M P L S A p p l i c a t i o n
D e v i c e M a n a g e m e n t Page 20 J u n i p e r M S e r i e s
and distribution of label bindings for the establishment of Label Switched Paths (LSPs). With LSPs, traffic flows in one direction from the head end toward the tail end. Duplex traffic requires two LSPs, one to carry traffic in each direction. An LSP is created by concatenating one or more label switched hops, allowing a packet to be forwarded from one Label Switching Router (LSR) to another across the MPLS domain. An LSR supports MPLS based forwarding. MPLS uses its own standards-based IP signaling and label distribution protocols and does not implement any ATM Forum protocols. SPECTRUM implements a Juniper-based MPLS MIB.
This application provides access to the following views and tables that provide Multiprotocol Layer Switching (MPLS) information:
• MPLS Configuration View• MPLS LSP Table (Page 21)• MPLS LSP Path Table (Page 21)• MPLS Path Table (Page 22)
MPLS Configuration ViewAccess: From the Icon Subviews menu for the MPLS Application icon, select Configuration.
This view provides the following MPLS configuration information.
MPLS VersionThe MPLS version number.
Signaling ProtocolThe MPLS signaling protocol. The possible values are none, other, rsvp, and ldp.
Active LSPsThe number of active LSPs.
Configured LSPsThe number of configured LSPs.
Traffic Engineering ProtocolThe protocol used to distribute traffic engineering and topology information to each LSR for the purpose of path computation. The possible values are none, isis, ospf, and isis-ospf.
Administration Group SectionThis section of the MPLS Configuration view provides the administration group number and group name, which are used to label links in the traffic engineering topology in order to place
A p p l i c a t i o n V i e w s M P L S A p p l i c a t i o n
D e v i c e M a n a g e m e n t Page 21 J u n i p e r M S e r i e s
constraints (include and exclude) on LSP paths. The group number can be 0 through 31.
MPLS LSP TableAccess: From the Icon Subviews menu for the MPLS Application icon, select LSP Table.
This table provides the following fields, which contain information about LSPs.
NameThe name of the LSP.
StateThe operational state of the LSP. The possible values are unknown, up, and down.
Forwarded OctetsThe number of octets forwarded over the LSP.
Forwarded PacketsThe number of packets forwarded over the LSP.
AgeThe age (i.e., time since its creation) of the LSP, in 10-millisecond periods.
Up TimeThe total time in 10-millisecond periods that this LSP has been operational. The percentage up time can be determined by Up Time/Age * 100.
TransitionsThe number of state transitions (up > down and down > up) that the LSP has undergone.
Last TransitionThe time, in 10-millisecond units, since the last transition occurred on the LSP.
MPLS LSP Path TableAccess: From the Icon Subviews menu for the MPLS Application icon, select LSP Path Table.
This table provides the following fields.
NameThe name of the LSP.
StateThe operational state of the LSP. The possible values are unknown, up, and down.
Source IPThe source IP address of the LSP.
Destination IPThe destination address of the LSP.
Path ChangesThe number of path changes this LSP has had.

A p p l i c a t i o n V i e w s M P L S A p p l i c a t i o n
D e v i c e M a n a g e m e n t Page 22 J u n i p e r M S e r i e s
Last ChangeThe time (in 10-millisecond units) since the last change occurred on the LSP.
Configured PathsThe number of paths configured for the LSP
Standby PathsThe number of standby paths configured for the LSP.
OperationalThe number of operational paths for the LSP, including the path currently active as well as operational standby paths.
MPLS Path TableAccess: From the Icon Subviews menu for the MPLS Application icon, select Path Table.
This table provides the following fields.
NameThe name of the active path for this LSP. If there is no active path for the LSP, this field will be blank and the other fields in the table will be meaningless.
TypeThe type of path that is active. The possible values are primary, secondary, standby, and other.
Explicit RouteThe explicit route used to set up this LSP, which may be a route configured by the user or a route automatically computed to satisfy constraints set by the user.
Record RouteThe route actually used for this path, as recorded by the signaling protocol.
BandwidthThe configured bandwidth for this LSP, in Kbps.
Service ClassThe configured Class Of Service on this path. If the value is between 0 and 7, inclusive, this value will be inserted in the 3-bit COS field in the label. If the value is 255, the value in the COS field of the label will depend on other factors.
IncludeA configured set of colors (administrative groups) specified as a bit vector (i.e., bit n is 1 if color n is in the set, where n = 0 is the LSB). For each link that this path goes through, the link must have colors associated with it, and the intersection of the link’s colors and the “include” set must be non-null.
ExcludeA configured set of colors (administrative groups) specified as a bit vector (i.e., bit n is 1 if color n is

A p p l i c a t i o n V i e w s M P L S A p p l i c a t i o n
D e v i c e M a n a g e m e n t Page 23 J u n i p e r M S e r i e s
in the set, where n = 0 is the LSB). For each link that this path goes through, the link must have colors associated with it, and the intersection of the link’s colors and the “exclude” set must be null.
Setup PriorityThe setup priority configured for this path.
Hold PriorityThe hold priority configured for this path.
PropertiesThe set of configured properties for this path, expressed as a bit map. For example, if the path is an adaptive path, the bit corresponding to bit value xxx is set. The possible values are cspf, adaptive, record-route, mergeable, preemptable, preemptive, and fast-reroute.

D e v i c e M a n a g e m e n t Page 24 J u n i p e r M S e r i e s
Performance Views
This section introduces the Performance view. For details concerning this view, refer to the SPECTRUM Views documentation.
Performance views display performance statistics in terms of a set of transmission attributes, e.g., cell rates, frame rates, % error, etc. A typical view is shown in Figure 7. The instantaneous condition of each transmission attribute is recorded in a graph. The statistical information for each attribute is presented in the adjacent table.
Generally, you determine performance at the device level through Performance views accessed from the Device and Application icons. You determine performance at the port/interface level through Performance views accessed from Interface icons.
Figure 7: Performance View
SpectroGRAPH: Type Routing
Model Name
Contact
Description
Location
Network Address System Up Time
Manufacturer
Device Type
Serial Number
Log
100.0
10.00
1.00
0.10
0.01
000:40:0 0:30:0 0:20:0
Value Average Peak Value
* Frame Rate
% Delivered
% Forwarded
% Transmit
% Error
DetailGraph Properties Scroll to Date-Time
File View Tools Bookmarks
% Discarded*Frames per second
type routing of type IP Routing of Landscape node: Primary
Primary Application
D e v i c e M a n a g e m e n t Page 25 J u n i p e r M S e r i e s
Configuration Views
This section describes the Configuration views available for models of the Juniper M Series devices in SPECTRUM.
Configuration views let you view and modify current settings for the modeled device and its interfaces, ports, and applications. The following Configuration views are available for models of Juniper M Series devices:
• MPLS Configuration View (Page 20)• Router Configuration View
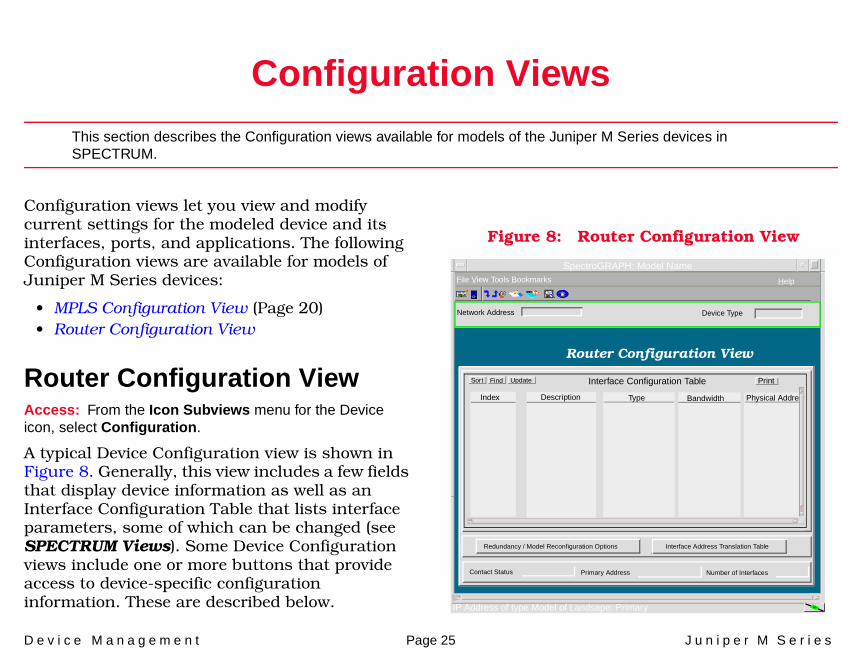
Router Configuration ViewAccess: From the Icon Subviews menu for the Device icon, select Configuration.
A typical Device Configuration view is shown in Figure 8. Generally, this view includes a few fields that display device information as well as an Interface Configuration Table that lists interface parameters, some of which can be changed (see SPECTRUM Views). Some Device Configuration views include one or more buttons that provide access to device-specific configuration information. These are described below.
Figure 8: Router Configuration View
SpectroGRAPH: Model Name
File View Tools Bookmarks Help
Network Address Device Type
Router Configuration View
Interface Configuration Table
Index Description Type Bandwidth Physical Addre
IP Address of type Model of Landsape: Primary
Find UpdateSort Print
Redundancy / Model Reconfiguration Options Interface Address Translation Table
Contact Status Primary Address Number of Interfaces

C o n f i g u r a t i o n V i e w s R o u t e r C o n f i g u r a t i o n V i e w
D e v i c e M a n a g e m e n t Page 26 J u n i p e r M S e r i e s
Refer to the SPECTRUM Views documentation.
Setting the Preferred Address ListFrom the device model, right-click and select Configuration. Click the Redundancy / Model Reconfiguration Options button, then click the Preferred Addresses button. This will open the Preferred Addresses window. The IP address of the backup Routing Engine should be added to the Redundancy Preferred Address List.
Refer to the SPECTRUM Views documentation.
Redundancy / Model Reconfiguration Options
Note:Note:
The management interface of each Routing Engine needs to be assigned a unique IP address. The IP address of the backup Routing Engine should be added to the Preferred Address List. This will ensure that Spectrum can regain contact with the router should the master Routing Engine fail, or be reset.
Interface Address Translation Table

D e v i c e M a n a g e m e n t Page 27 J u n i p e r M S e r i e s
Statistics
This section describes the various statistical views available for models of the Juniper M Series devices in SPECTRUM.
Access: From the Icon Subviews menu for the Device icon, select Statistics.
The Statistics view provides five buttons that allow you access to the following views:
• CPU/Memory Statistics• Environmental Statistics (Page 28)• DCU Statistics (Page 28)• Firewall Statistics (Page 29)• Alarm Statistics (Page 30)
Double-clicking any column entry within the Statistics views, opens a statistics-specific column information view. The above Statistics views are described in the rest of this section.
CPU/Memory StatisticsAccess: From the Statistics view, click on CPU/Memory.
This view provides the following fields.
DescriptionThe name or detailed description of this subject.
StateThe operating state.
% CPU UseThe CPU utilization in percentage (0 if unavailable or nonapplicable).
% CPU in ISRThe CPU utilization in percentage spending in interrupt service routine (ISR) (0 if unavailable or nonapplicable).
% Buffer UseThe buffer pool utilization in percentage (0 if unavailable or nonapplicable).

S t a t i s t i c s E n v i r o n m e n t a l S t a t i s t i c s
D e v i c e M a n a g e m e n t Page 28 J u n i p e r M S e r i e s
% Heap UseThe heap utilization in percentage (0 if unavailable or nonapplicable).
Environmental StatisticsAccess: From the Statistics view, click on Environmental.
This view provides the running state and temperature for such device components as the power supplies, fans, midplane, SSB, FPC and routing engine. This view provides the following fields.
DescriptionThe name or detailed description of this object.
StateThe operating state of this subject.
Temperature (Degrees Celsius).The temperature in Celsius (degrees C) (0 if unavailable or nonapplicable).
DCU StatisticsAccess: From the Statistics view, click on DCU.
This view provides the following fields.
Source Interface IndexThe source interface index where statistics are counted for the specified DCU entry.
Destination Class NameThe name of the destination class. This is the name of a valid configuration group defining a set of IP addresses and/or prefixes.
PacketsThe number of packets being counted (pertaining to the specified DCU entry).
BytesThe number of bytes being counted (pertaining to the specified DCU entry).

S t a t i s t i c s F i r e w a l l S t a t i s t i c s
D e v i c e M a n a g e m e n t Page 29 J u n i p e r M S e r i e s
Firewall StatisticsAccess: From the Statistics view, click on Firewall.
This view provides fields in the following areas:
• Firewalls Table• Firewall Counter Table
Firewalls TableFilterThe name of the firewall filter.
CounterThe name of the counter or policer. This name is specific within the firewall filter.
TypeThe type of object counter or a policer.
PacketsThe number of packets being counted pertaining to the specified counter or policer.
BytesThe number of bytes being counted pertaining to the specified counter. For policers, this field is always 0 because policers do not count the number of bytes.
Firewall Counter TableFilter NameThe name of the firewall filter.
NameThe name of the counter or policer. Whether this Field is associated with a counter or a policer is indicated by the Type field entry.
Type Identified by the Name field. What it is associated with - a counter or a policer. It is possible to have two counters of the same name and different type.
Packet CountThe number of packets being counted pertaining to the specified counter or policer.
Byte CountThe number of bytes being counted pertaining to the specified counter. For policers, this field is always 0 because policers do not count number of bytes.
S t a t i s t i c s A l a r m S t a t i s t i c s
D e v i c e M a n a g e m e n t Page 30 J u n i p e r M S e r i e s
Alarm StatisticsAccess: From the Statistics view, click on Alarm
This view provides the following fields:
Alarm Relay ModeThe alarm relay mode of the craft interface panel for both yellow and red alarms. Both yellow and red alarms could be cut off by a front panel Alarm Cutoff/Lamp Test (ACO/LT) button. In the passOn mode, the alarm relay will be activated to pass on the yellow or red alarms. In the cutOff mode, both yellow and red alarms will be cut off from the alarm relays which are normally connected to audible sirens or visual flashing devices.
Yellow Alarm StateThe yellow alarm state on the craft interface panel. The yellow alarm is on when there is some system warning such as maintenance alert or significant temperature increase. This yellow alarm state could be turned off by the ACO/LT (Alarm Cut Off/Lamp Test) button on the front panel module.
Yellow Alarm CountThe number of currently active and non-silent yellow alarms. This field is independent of the ACO/LT (Alarm Cut Off/Lamp Test) button.
Yellow Alarm Last ChangeThe value of sysUpTime when the yellow alarm last changed - either from off to on or vice versa. 0 if unknown or never changed since the agent was up.
Red Alarm StateThe red alarm indication on the craft interface panel. The red alarm is on when there is some system failure, power supply failure, system hardware malfunction or some threshold is being exceeded. This red alarm state could be turned off by the ACO/LT (Alarm Cut Off/Lamp Test) button on the front panel module.
Red Alarm CountThe number of currently active and non-silent red alarms. This field is independent of the ACO/LT (Alarm Cut Off/Lamp Test) button.
Red Alarm Last ChangeThe value of sysUpTime when the red alarm last changed - either from off to on or vice versa. 0 if unknown or never changed since the agent was up.

D e v i c e M a n a g e m e n t Page 31 J u n i p e r M S e r i e s
Redundant Component Monitoring Intelligence
This section describes the Redundant Component Monitoring intelligence available for support of JnprRedundRtr (M20, M40e, and M160) routers in SPECTRUM.
The Redundant Component Architecture is currently supported by Juniper M20, M40e, and M160 routers. Redundant components include those pieces of hardware that are necessary for proper routing functionality. The following specific components for these routers are mentioned in the rest of this section:
• Passive Monitoring• Active Monitoring (Page 32)
When either Passive Monitoring or Active Monitoring are invoked, they will check for status
changes in each type of redundant component. The redundant components of Juniper M Series routers differ based on the router models (listed below):
• Juniper M20 - System and Switch Board(s), Routing Engine(s).
• Juniper M40e - Routing Engine(s), Miscellaneous Control System(s), System and Forwarding Module(s), PFE Clock Generators.
• Juniper M160 - Routing Engine(s), Miscellaneous Control System(s), System and Forwarding Module(s), PFE Clock Generators.
Passive MonitoringThis intelligence is used to report changes in the status of redundant components only after Spectrum has lost contact with the router. When
Note:Note:
All Juniper M Series routers can be modeled, without this functionality, by type as a JNPR_Mxxx. This will provide basic modeling functionality as is described for the JNPR_Mxxx model type.

R e d u n d a n t C o m p o n e n t M o n i t o r i n g I n t e l l i g e n c e A c t i v e M o n i t o r i n g
D e v i c e M a n a g e m e n t Page 32 J u n i p e r M S e r i e s
contact is reestablished with the device, Spectrum will query the device to find out if component status changes have occurred. Passive Monitoring is always on, but only checks for component status changes in the above mentioned case.
Active MonitoringThis intelligence is used to report changes in the status of redundant components based on the value of the Active Polling Interval (Page 33). For example, if the Active Polling Interval is set to 60, the device will be queried every 60 seconds to find out if there were any component status changes. When Active Monitoring (Page 33) is enabled, it
works in addition to the functionality provided by Passive Monitoring.
In addition to this attribute, there are several other ways of enabling/disabling this functionality. If the Active Polling Interval is set to 0, then this functionality will be disabled. Changing the Active Polling Interval from 0 to some number of seconds will enable this functionality (provided the Active Monitoring attribute is set to True). (The Active Monitoring attribute is designed to turn on or off the Active Monitoring intelligence.) Changing the Polling Status (see Model Information View) of the device model to False will cause Active Monitoring to be disabled. Changing the Polling Interval (see Model Information View) of the device model to 0 will cause Active Monitoring to be disabled. However, changing Polling Status to True or changing the Polling Interval to some number of seconds will not cause Active Monitoring to be enabled. It will have to be re-enabled if the functionality is desired.
Furthermore, the Active Polling Interval should never be set to a value that is less than the "steady" state time for the given router type. For example, the "steady" state time for an M20 is 60 seconds. The Active Polling Interval should always be set to a value that is larger than 60.
Note:Note:
When contact is reestablished with the device, the components are not always in a “steady” state. The components need to be given time to reach their steady state before their states are actually checked. Each router type (M20, M40e, or M160) takes a different amount of time to reach its steady state. Because of this, Passive Monitoring will wait 60, 90, or 120 seconds before checking the states of the M20, M40e, or M160 components, respectively.

D e v i c e M a n a g e m e n t Page 33 J u n i p e r M S e r i e s
Redundancy
This section describes the redundancy views supported by Juniper M Series Model type JnprRedundRtr (M20, M40e, and M160) routers in SPECTRUM.
This section provides information on the following views available for model type JnprRedundRtr (M20, M40e, and M160) routers:
• Redundancy Configuration• Redundancy Information
Redundancy ConfigurationAccess: From the Icon Subviews menu for the Device icon, select Redundancy->Configuration.
This view provides the following button and field:
This button has the option of enabling or disabling the Active Monitoring (Page 32) intelligence. Default is set to Disabled.
Active Polling IntervalIndicates how often (in seconds) the Active Monitoring intelligence will query the device to
find out if there are any component status changes. This field is read/write (for further details see Active Monitoring on Page 32).
Redundancy InformationAccess: From the Icon Subviews menu for the Device icon, select Redundancy->Information.
This view provides the following fields:
DescriptionThe name or detailed description of this subject.
ConfigurationThe election priority of redundancy configuration for this subject.
StateThe current running state for this subject.
Switchover CountThe total number of switchover as perceived by this subject since routing engine has been up and
Active Monitoring

R e d u n d a n c y R e d u n d a n c y I n f o r m a t i o n
D e v i c e M a n a g e m e n t Page 34 J u n i p e r M S e r i e s
running. The switchover is defined as a change in state of jnxRedundancyState from master to backup or vice versa. Its value is reset when the routing engine is reset or rebooted.
Switchover TimeThe value of sysUpTime when the jnxRedundancyState of this subject was last switched over from master to backup or vice versa. The value of 0 is given if unknown or never switched over since the routing engine has been up and running.
Switchover ReasonThe reason for the last switchover for this subject.
Keepalive TimeoutThe timeout period in seconds, by the keepalive watchdog timer, before initiating a switch over to the backup subsystem. The value of 0 is given if unavailable or nonapplicable.
Note:Note:
Redundancy Information is only supported by JUNOS 5.2 or later. Therefore, the menu pick will be grayed out if the router is not running JUNOS 5.2 or later.

D e v i c e M a n a g e m e n t Page 35 J u n i p e r M S e r i e s
Model Information View
This section provides a brief overview of the Model Information view.
This view displays administrative information about the device and its applications and lets you set thresholds and alarm severity for the device.
Figure 9 shows a sample Model Information view. The layout of this view is the same for all model types in SPECTRUM but some information will vary depending on the model it defines. Refer to SPECTRUM Views for a complete description of this view.
Figure 9: Model Information View
Model Name ContactDescriptionLocation
SpectroGRAPH: Model Name
File View Tools Bookmarks Help
IP Address of Model Type of Landscape: Primary
ManufacturerSysUpTime
Net AddressDevice TypeSerial Number
Model Information View
MM Name
MM Part Number
MM Version Number
Model Type
Model Creation Time
Model Created By
Model State
Security String
Communication Information
Poll / Log Information
Condition Value
Contact Status
DCM TimeOut
DCM Retry
Lost Child Count
Value When Yellow
Value When OrangeValue When Red
Community Name
Mgnmt Protocol
Poll Interval
Poll Status
Log Ratio
Last Successful Poll
Logged Polled
True
General InformationCondition

D e v i c e M a n a g e m e n t Page 36 J u n i p e r M S e r i e s
Index
AAddress
Interface IP 13MPLS 21Physical (MAC) 13Translation 14
Admin Status 12Applications 16
BBandwidth, MPLS 22
CConfiguration
Device 25MPLS 20
DDevTop Views 15Document
Section Views 8
Documentation 5
EExclude, Include 22
HHardware 6
IIcons
Application 19Device 7Interface 12
IFAddress Translation 26
Include, Exclude 22Interface
Type, Device 12IP Address, MPLS 21
LLSP Path 21LSP Table 21
MManagement Tasks 10Mask 14Model
Information 35Types of 6
JNPR_Mxxx 6Icon Subviews 7
JnprRedundRtr 6Icon Subviews 8
MPLS Configuration 20Administration Group Section 20
MPLS Path 22Multiprotocol Layer Switching 19
NNetwork I/O ports 15Network Type 13

I n d e x I n d e x
D e v i c e M a n a g e m e n t Page 37 J u n i p e r M S e r i e s
OOctets Forwarded, MPLS 21
PPackets Forwarded, MPLS 21Path Properties, MPLS 23Paths, MPLS 22Performance Statistics 24Port Number, Device 12Priority, MPLS 23
RRedundancy 33
Redundancy Configuration 33Active Monitoring button 33Active Polling Interval 33
Redundancy Information 33Redundant Component Monitoring
Intelligence 31Active Monitoring 32Redundant Juniper router
models 31Route Information 22
SSerial ports 15Service Class 22Signaling Protocol, MPLS 20Statistics 27
Alarm Statistics 30CPU/Memory Statistics 27DCU Statistics 28Environmental Statistics 28Firewall Statistics 29
Firewall Counter Table 29Firewalls Table 29
MPLS 19Views 27
TTasks
LSP Transmission Info 10MPLS/LSP Configuration 10Redundancy Configuration 10Redundancy Internal
Operations 10Threshold Information 13Traffic Engineering Protocol 20Transitions, MPLS 21Troubleshooting 10
UUp Time 21