Embed Size (px)
Citation preview
June 2015
Advertisers around the world spend more on digital display formats than any other internet-based ads—and spending is rising rapidly. But traditional banners aren’t enough. Most US display spending is now transacted programmatically, and automation, targeting and cross-device attribution are critical for success. eMarketer has curated this Roundup of key insights, articles and interviews to help educate advertisers about the latest developments in display.
DIGITAL DISPLAY ROUNDUP
presented by

Digital Display Roundup Copyright ©2015 eMarketer, Inc. All rights reserved. 2
DIGITAL DISPLAY ROUNDUP
Overview
Around the world, marketers will spend $75.50 billion on display advertising this year. That’s up 22.3% over 2014, making display the fastest-growing of any ad format worldwide. By 2019, 47.4% of all digital ad spending will go toward display.
Display is also the fastest-growing digital ad format in the US. eMarketer predicts US advertisers will spend $27.05 billion on display this year, representing a 21.8% increase. Display already accounts for 46.2% of US paid digital media spending, more than any other format, and will grab an outright majority of dollars by 2018. Most US display spending occurs on mobile devices.
Already, more than half of US digital ad spending is being transacted programmatically, according to eMarketer estimates. Programmatic display buys will total $14.88 billion this year, and rise by nearly another $5 billion in 2016.
A significant amount of programmatic spending is also happening on mobile, as advertisers continue to come to terms with consumers’ shifting media consumption habits. Cross-device campaigns are a must, and with good reason: 193.8 million people in the US will use the internet via mobile phone this year, and 158.8 million will use a tablet.
Most marketers agree that targeting audiences across devices and delivering a cohesive brand message to each screen is the path toward success. But challenges abound, chief among them audience tracking across screens; producing creative assets that will render properly on all devices; cross-screen targeting; and measurement. In a Q2 2014 survey conducted by multiscreen advertising provider Jivox, US agency professionals were asked to name the top challenges associated with cross-screen advertising and responses were near evenly split across the aforementioned areas. The small degree of variance in responses suggests all four areas are troublesome.
eMarketer believes the industry is months, not years, away from overcoming the challenges and misconceptions that stand in the way of implementing a people-based strategy across devices. Last year, significant advances were made in cross-screen audience tracking, targeting and ad serving.
A big breakthrough is needed in multitouch attribution but eMarketer believes that will not be a roadblock; cross-screen advertising at scale is expected to become a reality for a large number of brands over the next 12 to 18 months.
billionsUS Display Ad Spending, by Device, 2014-2017
2014
$12.56
$9.65
2015
$12.38
$14.67
2016
$11.59
$20.80
2017
$11.67
$25.69
Desktop* Mobile**
Note: includes banners, rich media, sponsorships, video and other (staticdisplay ads such as Facebook's News Feed Ads and Twitter's PromotedTweets); *includes spending primarily on desktop-based ads; **adspending on tablets is includedSource: eMarketer, March 2015186471 www.eMarketer.com
billions, % change and % of total digital display ad spending*
US Programmatic Digital Display Ad Spending,2013-2016
2013
$4.24
108.7%
24.0%
2014
$9.99
135.5%
45.0%
2015
$14.88
48.9%
55.0%
2016
$20.41
37.2%
63.0%
Programmatic digital display ad spending% change % of total digital display ad spending*
Note: digital display ads transacted via an API, including everything frompublisher-erected APIs to more standardized RTB technology; includesadvertising that appears on desktop/laptop computers as well as mobilephones and tablets; *includes banners, rich media, sponsorship, video andotherSource: eMarketer, March 2015186642 www.eMarketer.com

Digital Display Roundup Copyright ©2015 eMarketer, Inc. All rights reserved. 3
Facebook and Twitter Will Take 33% Share of US Digital Display Market by 2017
Social media companies gain share while Google and Yahoo slip
Spending on digital display advertising in the US will total $27.05 billion in 2015, according to new figures from eMarketer, and the market is shifting toward the leading social networks. By 2017, when US digital display ad expenditure will reach $37.36 billion, Facebook and Twitter together will account for 33.7% of the market, up from 30.2% this year.
In 2015, Facebook’s US digital display ad revenues will reach $6.82 billion, just over one-quarter of the total market, and Twitter will take 5.0% share, increasing its digital display ad revenues to $1.34 billion. By 2017, Facebook’s portion will continue to creep upward, reaching 26.9%, and Twitter will take 6.8%.
Notably, Twitter will surpass Yahoo in total US digital display ad revenues for the first time in 2015, eMarketer estimates. Even though we project that Yahoo will see positive display ad growth this year for the first time since we started tracking the company’s ad revenues in 2009, its market share will continue a rapid decline, falling to 4.6% in 2015, down from 5.5% last year and 7.2% in 2013.
Throughout our forecast, Google will maintain its market position behind Facebook, but its share of US digital display ad revenues will dip from 13.7% in 2014 to 13.0% this year—and down to 11.1% by 2017.
Both Facebook’s and Twitter’s gains in the digital display market are driven by mobile advertising. For the first time in 2015, mobile will surpass desktop in display ad spending in the US, increasing from $9.65 billion in 2014 to $14.67 billion. Meanwhile, desktop display ad spend will decline in 2015, falling to $12.38 billion, from $12.56 billion last year.
This year, Facebook will close in on $5 billion in US mobile ad revenues alone, all of which appear in display formats. Likewise, nearly 90% of Twitter’s US ad revenues will come from mobile devices this year, totaling over $1.19 billion, also all in display formats. By 2017, Facebook’s US mobile
billions, % change and % of total
Net US Digital Display Ad Revenues, by Company,2013-2017
—% change
—% of total
—% change
—% of total
—% change
—% of total
Yahoo
—% change
—% of total
AOL
—% change
—% of total
Amazon
—% change
—% of total
Microsoft
—% change
—% of total
—% change
—% of total
IAC
—% change
—% of total
Total digital display
2013
$3.28
50.5%
18.6%
$2.54
15.4%
14.4%
$0.43
95.5%
2.4%
$1.27
-6.4%
7.2%
$0.76
9.5%
4.3%
$0.46
73.3%
2.6%
$0.68
-21.6%
3.9%
$0.21
37.2%
1.2%
$0.08
-21.0%
0.4%
$17.68
2014
$5.29
61.0%
23.8%
$3.05
20.2%
13.7%
$0.83
91.0%
3.7%
$1.23
-2.9%
5.5%
$0.83
8.1%
3.7%
$0.66
42.3%
3.0%
$0.49
-28.2%
2.2%
$0.27
29.7%
1.2%
$0.11
46.8%
0.5%
$22.20
2015
$6.82
29.0%
25.2%
$3.52
15.1%
13.0%
$1.34
62.1%
5.0%
$1.24
1.0%
4.6%
$0.94
14.0%
3.5%
$0.82
23.4%
3.0%
$0.46
-5.6%
1.7%
$0.31
14.1%
1.1%
$0.12
6.3%
0.4%
$27.05
2016
$8.50
24.6%
26.2%
$3.81
8.3%
11.8%
$1.92
43.0%
5.9%
$1.27
2.0%
3.9%
$1.07
13.2%
3.3%
$0.99
21.9%
3.1%
$0.44
-4.9%
1.4%
$0.37
19.7%
1.1%
$0.13
10.3%
0.4%
$32.39
2017
$10.03
18.1%
26.9%
$4.13
8.6%
11.1%
$2.54
32.9%
6.8%
$1.29
2.0%
3.5%
$1.19
11.9%
3.2%
$1.19
19.2%
3.2%
$0.44
-0.1%
1.2%
$0.43
14.7%
1.1%
$0.14
10.1%
0.4%
$37.36
Note: includes advertising that appears on desktop and laptop computersas well as mobile phones and tablets; net ad revenues after companies paytraffic acquisition costs (TAC) to partner sites; includes banner ads andother (static display ads such as Facebook's News Feed Ads and Twitter'sPromoted Tweets), rich media, sponsorships and video (in-banner,in-stream, in-text)Source: company reports; eMarketer, March 2015186480 www.eMarketer.com

Digital Display Roundup Copyright ©2015 eMarketer, Inc. All rights reserved. 4
ad revenues will grow more than 50% from this year, totaling about $7.53 billion, and Twitter will nearly double its US mobile ad revenues to $2.29 billion, closing in on Google in the mobile display category.
Digital Advertisers Focus on Holistic Customer Experience
Mobile trumps desktop in ad spending
The much-anticipated shift toward mobile will occur this year in the two largest digital advertising categories: search and display. For the first time, US advertisers will spend more in these areas to reach consumers on mobile devices than desktop computers, according to a new eMarketer report, “The State of US Digital Advertising 2015: Mobile Trumps Desktop, People Trump Devices.”
eMarketer estimates US advertisers will spend $52.71 billion on search and display advertising in 2015, up 16.6% from the prior year. In an effort to catch up with consumers toting smartphones and tablets, more than half (52.2%) of this expenditure is expected to go toward mobile campaigns.
billionsUS Display and Search Ad Spending, by Device, 2015
Search ad spending
$12.82
$12.85
$25.66
Display ad spending
$12.38
$14.67
$27.05
Desktop* Mobile**
Note: numbers may not add up to total due to rounding; *includesspending primarily on desktop-based ads; **ad spending on tablets isincludedSource: eMarketer, March 2015186591 www.eMarketer.com
millions
Net US Mobile Display Ad Revenues, by Company,2013-2017
Pandora
Apple (iAd)
Yahoo
Millennial Media
Amazon
Yelp
Other
Total
2013
$1,532.0
$629.7
$320.1
$369.2
$260.2
-
$79.4
$12.4
$5.4
$2.1
$2,098.4
$5,308.9
2014
$3,541.8
$1,133.5
$694.1
$559.7
$487.1
$189.7
$83.9
$88.1
$54.4
$6.6
$2,806.9
$9,645.8
2015
$4,911.1
$1,473.5
$1,192.3
$737.0
$795.0
$425.9
$96.8
$163.0
$108.6
$14.9
$4,750.1
$14,668.1
2016
$6,288.4
$1,886.1
$1,723.8
$926.0
$1,166.8
$756.1
$111.0
$265.1
$148.6
$28.3
$7,502.4
$20,802.6
2017
$7,525.5
$2,376.5
$2,290.2
$1,125.1
$1,464.1
$990.7
$125.8
$395.1
$196.0
$43.3
$9,153.7
$25,685.9
Note: net ad revenues after companies pay traffic acquisition costs (TAC) topartner sites; includes display (banners and other, rich media and video); adspending on tablets is included; excludes SMS, MMS and P2Pmessaging-based advertising; numbers may not add up to total due toroundingSource: company reports; eMarketer, March 2015186501 www.eMarketer.com
billionsUS Display Ad Spending, by Device, 2014-2017
2014
$12.56
$9.65
2015
$12.38
$14.67
2016
$11.59
$20.80
2017
$11.67
$25.69
Desktop* Mobile**
Note: includes banners, rich media, sponsorships, video and other (staticdisplay ads such as Facebook's News Feed Ads and Twitter's PromotedTweets); *includes spending primarily on desktop-based ads; **adspending on tablets is includedSource: eMarketer, March 2015186471 www.eMarketer.com

Digital Display Roundup Copyright ©2015 eMarketer, Inc. All rights reserved. 5
Average Number of Connected Devices Used by USInternet Users, by Generation, 2014
Gen Z (ages 18-24) 3.6
Millennials (ages 25-34) 4.0
Gen X (ages 35-44) 3.6
Younger baby boomers (ages 45-54) 2.9
Older baby boomers (ages 55-64) 2.6
Seniors (ages 65+) 2.0
Total 3.3
Source: Forrester Research, "The State of Consumers and TechnologyBenchmark 2014 US" as cited in company blog, Jan 16, 2015184904 www.eMarketer.com
Devices take center stage at the budgetary and tactical level, but strategically, marketers are focusing less on devices and more on people, specifically connecting with consumers wherever and whenever they access the web.
“The biggest change we’re seeing is the move towards people-centric marketing,” said Chad Gallagher, global director of mobile for AOL. “Both brand and performance advertisers are saying, ‘We don’t necessarily care about the device, we care about driving results against people.’ That’s a fundamental change.”
Marketers are keenly aware that the average person relies on multiple devices to access the internet, so the device itself is no longer a strong indicator of the type of person using it. According to Forrester Research, US consumers across all demographic groups used an average of 3.3 devices last year. Millennials used more—four devices on average.
Armed with such knowledge, marketers are thinking more holistically about the customer experience they deliver across multiple screens instead of focusing on each device and channel as a silo. The vast majority (86%) of marketers worldwide polled by Salesforce.com in November 2014 said delivering a cohesive customer journey across devices was very important or critical to the success of their business.
Marketers surveyed worldwide in January 2015 by Econsultancy on behalf of Adobe held similar views. Nearly six in 10 said cross-channel marketing would be a key focus for them this year.
Indeed, most agree that identifying target audiences across devices and delivering a cohesive brand message to each screen is the path toward success. “Marketers have all seen the graphs that show people are spending more and more time on mobile devices, and they know they need a strategy,” said Adam Berke, president and CMO of AdRoll. “However, if you ask, ‘What’s your business objective for mobile?’ they haven’t had a great answer for that.“ It’s difficult to extend campaigns beyond desktop, Berke added, if marketers don’t know what they’re aiming to achieve by serving ads to mobile devices.
% of respondents
Client-Side Marketing and Ecommerce ProfessionalsWorldwide for Whom Cross-Channel Marketing WillBe a Focus in 2015
Strongly agree14%
Agree45%
Neutral30%
Disagree8%
Strongly disagree3%
Source: Econsultancy, "Quarterly Digital Intelligence Briefing: Digital Trends2015" in association with Adobe, Jan 28, 2015187061 www.eMarketer.com
Digital Display Roundup Copyright ©2015 eMarketer, Inc. All rights reserved. 6
Retailers Account for One-Quarter of Programmatic Spend
Digital display ad spending skews heavily programmatic
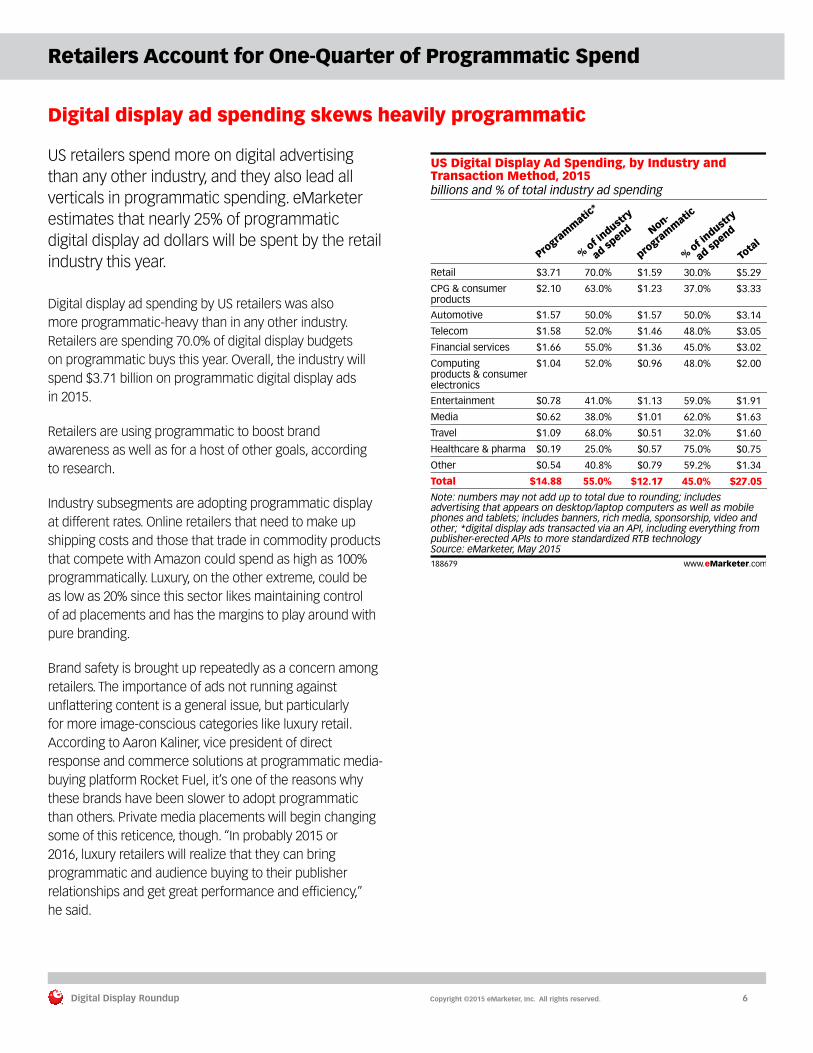
US retailers spend more on digital advertising than any other industry, and they also lead all verticals in programmatic spending. eMarketer estimates that nearly 25% of programmatic digital display ad dollars will be spent by the retail industry this year.
Digital display ad spending by US retailers was also more programmatic-heavy than in any other industry. Retailers are spending 70.0% of digital display budgets on programmatic buys this year. Overall, the industry will spend $3.71 billion on programmatic digital display ads in 2015.
Retailers are using programmatic to boost brand awareness as well as for a host of other goals, according to research.
Industry subsegments are adopting programmatic display at different rates. Online retailers that need to make up shipping costs and those that trade in commodity products that compete with Amazon could spend as high as 100% programmatically. Luxury, on the other extreme, could be as low as 20% since this sector likes maintaining control of ad placements and has the margins to play around with pure branding.
Brand safety is brought up repeatedly as a concern among retailers. The importance of ads not running against unflattering content is a general issue, but particularly for more image-conscious categories like luxury retail. According to Aaron Kaliner, vice president of direct response and commerce solutions at programmatic media-buying platform Rocket Fuel, it’s one of the reasons why these brands have been slower to adopt programmatic than others. Private media placements will begin changing some of this reticence, though. “In probably 2015 or 2016, luxury retailers will realize that they can bring programmatic and audience buying to their publisher relationships and get great performance and efficiency,” he said.
billions and % of total industry ad spending
US Digital Display Ad Spending, by Industry andTransaction Method, 2015
% of indust
ry
ad spend Non-
progra
mm
atic
% of indust
ry
ad spend
Tota
l
Retail
CPG & consumer products
Automotive
Telecom
Financial services
Computingproducts & consumer electronics
Entertainment
Media
Travel
Healthcare & pharma
Other
Total
Progra
mm
atic*
$3.71
$2.10
$1.57
$1.58
$1.66
$1.04
$0.78
$0.62
$1.09
$0.19
$0.54
$14.88
70.0%
63.0%
50.0%
52.0%
55.0%
52.0%
41.0%
38.0%
68.0%
25.0%
40.8%
55.0%
$1.59
$1.23
$1.57
$1.46
$1.36
$0.96
$1.13
$1.01
$0.51
$0.57
$0.79
$12.17
30.0%
37.0%
50.0%
48.0%
45.0%
48.0%
59.0%
62.0%
32.0%
75.0%
59.2%
45.0%
$5.29
$3.33
$3.14
$3.05
$3.02
$2.00
$1.91
$1.63
$1.60
$0.75
$1.34
$27.05
Note: numbers may not add up to total due to rounding; includesadvertising that appears on desktop/laptop computers as well as mobilephones and tablets; includes banners, rich media, sponsorship, video andother; *digital display ads transacted via an API, including everything frompublisher-erected APIs to more standardized RTB technologySource: eMarketer, May 2015188679 www.eMarketer.com

Digital Display Roundup Copyright ©2015 eMarketer, Inc. All rights reserved. 7
Local Advertising to Go Programmatic
Programmatic to more than double share of local digital ad spending this year
What’s up with local advertising? Programmatic spending, based on data released in April 2015 by Borrell Associates. The firm estimated that programmatic’s share of local digital ad spend in the US would more than double this year, from 4.7% to 10%, or $5 billion. By 2019, 61% of local digital ad spending, or $47 billion, was expected to be conducted programmatically.
Borrell found that currently, local publishers were most likely to sell between 11% and 30% of their online ad inventory through programmatic channels, cited by 25%, while 23% sold more than 31% and 21% sold 10% or less. Just over three in 10 did not use programmatic advertising.
Higher adoption of local programmatic comes with concerns, though. Top worries revolved around commoditizing the product (34%), a lack of experience (33%) and undermining direct sales relationships (30%).
Mobile is also gaining ground among local advertisers. Estimates released in April by BIA/Kelsey forecast that after an increase of 76% last year, local mobile ad spending in the US would rise 55.8% this year, from $4.3 billion to $6.7 billion. By 2019, this was expected to reach $18.2 billion. Between this year and 2019, mobile’s share of local ad budgets was forecast to rise from 4.8% to 11.5%—making it the fourth-largest local media behind direct mail (23.6%), over-the-air TV (13.7%) and pure play online (12.9%).
As both programmatic and mobile ad spending expand their reach among local advertisers, the two will likely intersect. eMarketer estimates that US mobile programmatic display ad spending will rise 88.4% this year to $8.36 billion. Next year, this figure will leap another 69.2% to $14.15 billion.
billions and CAGRUS Local Programmatic Ad Spending, 2015 & 2019
2015
$5
2019
$47(93.5%)
Note: in 2015, 10% of locally placed digital ad inventory will be purchasedprogrammatically; in 2019, 61% of locally placed digital ad inventory and97% of national digital ad inventory will be purchased programmaticallySource: Borrell Associates, "2015 to 2020 Local Programmatic Advertising"as cited in NetNewsCheck, April 22, 2015189349 www.eMarketer.com

Digital Display Roundup Copyright ©2015 eMarketer, Inc. All rights reserved. 8
Disagreement Persists Over Viewability Definition
Advertisers want more pixels in-view for desktop display ads, more seconds for video
US digital display ad spending—on both desktop/laptop computers and mobile devices—will rise 21.8% this year to hit $27.05 billion, eMarketer estimates, or 46.2% of digital ad spending. As advertisers increase dollars spent on the format, which will account for 51.9% of digital ad expenditure by 2019, viewability remains a hot issue. In a December 2014 study by The 614 Group and AdMonsters, 60.7% of US digital advertising, marketing and media executives cited viewability as the biggest challenge to digital publishing, and only 33.6% believed the majority of digital publishers would reach high viewability standards by the end of 2015.
April 2015 research by SQAD suggests that many industry professionals aren’t even aware of the current viewability standards—and most wanted stricter guidelines. Currently, the Media Rating Council (MRC) suggests desktop display ads be counted as viewable when 50% of the ad’s pixels are visible for at least 1 continuous second; however, just 30% of US advertising professionals identified this as the adopted definition for what is considered a viewable desktop display ad. Instead, the majority believed desktop display ads should have 75% or more pixels in-view for at least 1 second.
Recent research points to the importance of viewability standards for measurement across a wide range of advertising areas. In April 2015 polling by Econsultancy, 43% of UK and US senior marketers said they used viewability rate to determine the success of their programmatic ad campaigns—the second most popular metric. And April 2015 research by Digiday and PulsePoint found that about four in 10 UK and US agency and brand professionals used viewability rate to measure both native advertising and content marketing campaigns.
eMarketer expects US digital display video ad spending—on both desktop/laptop computers and mobile devices—to hit $7.77 billion this year, up 33.8% to represent 13.3% of digital ad dollars. And SQAD found that issues emerged when it came to desktop video viewability as well, which requires 50% of pixels to be viewed for at least 2 seconds. Nearly half of respondents thought that the minimum amount of time a video should be displayed for it to be considered viewable was 5 seconds or more. Just over a quarter were OK with a minimum of 3 seconds, while only 18% said the same about 2 seconds or less.
% of respondents
Definition of a Viewable Desktop Display Ad that WillBe Adopted in 2015 According to US AdvertisingProfessionals
Have 25% of pixels in-view for a minimum of 1 second13%
Have 50% of pixels in-view for a minimum of 1 second30%
Have 75% of pixels in-view for a minimum of 1 second26%
Have 100% of pixels in-view for a minimum of 1 second30%
Note: numbers may not add up to 100% due to roundingSource: SQAD, "Survey Questions for the 2015 ANA Conference," June 2,2015190830 www.eMarketer.com
% of respondents
Minimum Amount of Time that US AdvertisingProfessionals Feel a Desktop Video Ad Should BeDisplayed to Be Considered Viewable*, April 2015
1 second 10%
2 seconds 8%
3 seconds 26%
4 seconds 7%
5 seconds 28%
6+ seconds 21%
Note: *under the new industry definition that will be adopted in 2015Source: SQAD, "Survey Questions for the 2015 ANA Conference," June 2,2015190831 www.eMarketer.com
Digital Display Roundup Copyright ©2015 eMarketer, Inc. All rights reserved. 9
What Does Your Retargeting Budget Look Like?
Marketers are the most likely to increase social retargeting spend
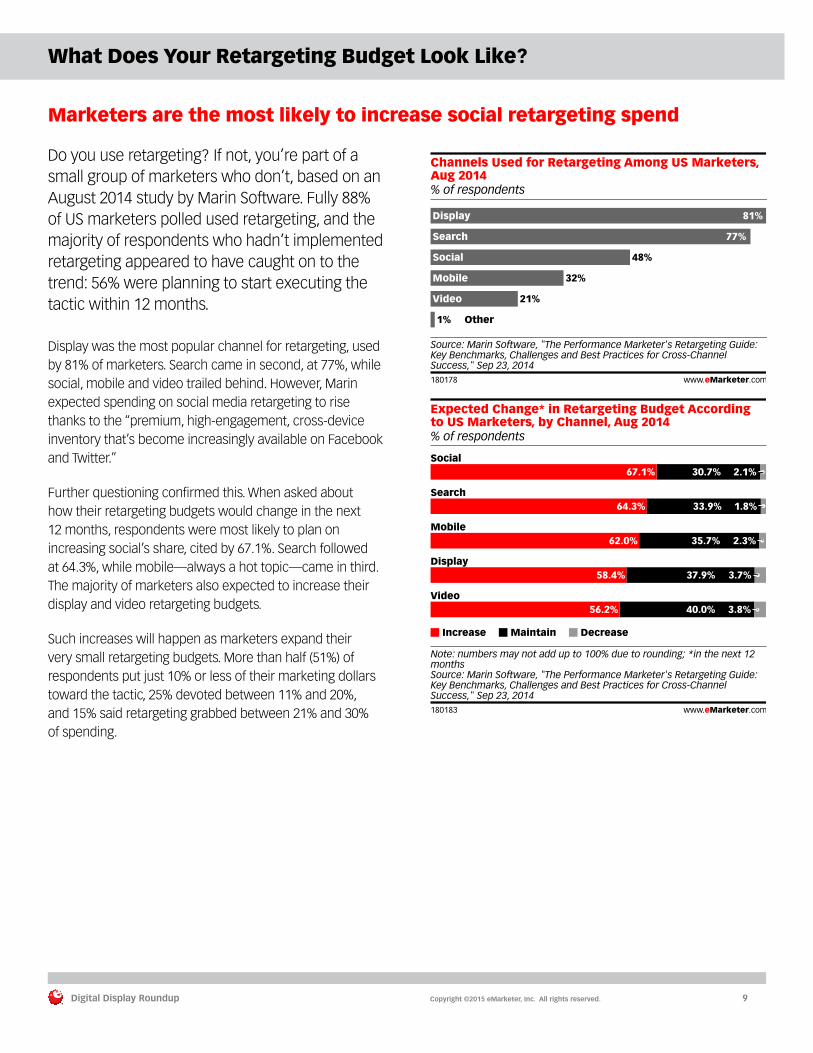
Do you use retargeting? If not, you’re part of a small group of marketers who don’t, based on an August 2014 study by Marin Software. Fully 88% of US marketers polled used retargeting, and the majority of respondents who hadn’t implemented retargeting appeared to have caught on to the trend: 56% were planning to start executing the tactic within 12 months.
Display was the most popular channel for retargeting, used by 81% of marketers. Search came in second, at 77%, while social, mobile and video trailed behind. However, Marin expected spending on social media retargeting to rise thanks to the “premium, high-engagement, cross-device inventory that’s become increasingly available on Facebook and Twitter.”
Further questioning confirmed this. When asked about how their retargeting budgets would change in the next 12 months, respondents were most likely to plan on increasing social’s share, cited by 67.1%. Search followed at 64.3%, while mobile—always a hot topic—came in third. The majority of marketers also expected to increase their display and video retargeting budgets.
Such increases will happen as marketers expand their very small retargeting budgets. More than half (51%) of respondents put just 10% or less of their marketing dollars toward the tactic, 25% devoted between 11% and 20%, and 15% said retargeting grabbed between 21% and 30% of spending.
% of respondents
Channels Used for Retargeting Among US Marketers,Aug 2014
Display 81%
Search 77%
Social 48%
Mobile 32%
Video 21%
Other1%
Source: Marin Software, "The Performance Marketer's Retargeting Guide:Key Benchmarks, Challenges and Best Practices for Cross-ChannelSuccess," Sep 23, 2014180178 www.eMarketer.com
% of respondents
Expected Change* in Retargeting Budget Accordingto US Marketers, by Channel, Aug 2014
Increase Maintain Decrease
Note: numbers may not add up to 100% due to rounding; *in the next 12monthsSource: Marin Software, "The Performance Marketer's Retargeting Guide:Key Benchmarks, Challenges and Best Practices for Cross-ChannelSuccess," Sep 23, 2014180183 www.eMarketer.com
Social67.1% 30.7% 2.1%
Search64.3% 33.9% 1.8%
Mobile62.0% 35.7% 2.3%
Display58.4% 37.9% 3.7%
Video56.2% 40.0% 3.8%

Digital Display Roundup Copyright ©2015 eMarketer, Inc. All rights reserved. 10
Cross-Device Targeting and Measurement Will Impact Digital Display Advertisers in 2015
Omar Tawakol
Group Vice President and General Manager, Oracle Data Cloud
Oracle
When Oracle acquired data management platform (DMP) BlueKai in February 2014, Omar Tawakol, BlueKai’s former CEO, was tapped to oversee Oracle’s Data Cloud, as well as the company’s Data as a Service for Business—both of which center around using information to provide greater intel to sales and marketing efforts. Tawakol, now group vice president and general manager of Oracle Data Cloud, recently spoke with eMarketer’s Lauren Fisher about how some of the biggest trends are driving digital advertising today.
eMarketer: What trends do you see affecting digital display advertisers this year?
Omar Tawakol: Cross-linking everything across screens and devices is the biggest and most important trend this year. Marketers have these first-party data assets: data tied to email, data tied to a physical address, data tied to cookies—and they’re all massively disconnected.
Linking allows you to target across devices and measure whether an ad on a mobile device or PC drove an in-store sale.
These types of insights will be important for advertisers, particularly those in the automotive, retail and travel industries, where a lot of transactions happen physically in the real world.
eMarketer: There are a number of companies offering device identification services, and each tends to take a slightly different approach. Will we see greater standardization to these offerings?
“Data quality has been a problem since day one.”
Tawakol: Absolutely. We’ll see focus on the quality of data and linkages you’re making with the data.
Data quality has been a problem since day one. We get demographic information from dozens of sources, and a lot of them are data companies that people know and trust. The problem is these companies have different quality metrics on what they think is acceptable for putting demographic data on a cookie.
Some might be putting household data onto a cookie. If a household attribute is tied to a cookie, that’s a problem for a household of four where half are female and half are male. They can’t all be tagged with a single demographic.
Originally, there was this phase of programmatic where people were more interested in having data on as many cookies as they cost-efficiently could.
As the market gets more sophisticated, this is going to change. Buyers will take a closer look at the data and go for what drives more value.
“The industry is getting fed up with interruptive ads. Some brands recognize that it’s better to provide services to people rather than interruptive ads.”
eMarketer: Are there any specific trends you’re seeing related to ad formats or types?
Tawakol: The industry is getting fed up with interruptive ads. Some brands recognize that it’s better to provide services to people rather than interruptive ads.
An extreme example would be Nike coming up with a useful running app. Rather than spending on an ad that tells you to buy shoes, you run with the Nike app. Guess what happens the next time you go to a store? You buy Nike shoes. Spend is built on service. It’s not easy for

Digital Display Roundup Copyright ©2015 eMarketer, Inc. All rights reserved. 11
everyone to figure out how to provide a service that gets someone to love their brand.
A less extreme example is native advertising, where you’re providing useful content that’s actually an ad. We’ll see native ads increasing more as people realize that hitting consumers over the head with interruptive messages in the midst of clutter isn’t effective.
eMarketer: Native ads seem to be the pendulum play for brands that are fed up with poor banner performance.
As more buyers swing toward native, do we run the risk of publishers trying to oversaturate it to the point of ineffectiveness?
Tawakol: That’s already happening, and it’s frustrating. Ultimately, the backlash will be lower performance. The reason the other stuff worked is because the ad was useful to the consumer and wasn’t mixed in a way that interrupted what they were doing. The more noisy we make native advertising, the more it hurts the unit to the point it starts to perform like a banner ad.
Heineken USA Toasts Programmatic for Niche Brand Desperados
Ron Amram
Senior Media Director
Heineken USA
Heineken USA plans to put 10% of its media budget into programmatic this year and partnered with TubeMogul, a web video ad technology, in February. Ron Amram, senior media director for Heineken USA, spoke with eMarketer’s Danielle Drolet about the company’s push into programmatic for its Desperados brand and what it means for the creative mindset.
eMarketer: Is programmatic buying redefining what “creative” means?
Ron Amram: Digital unlocks a lot in the creative space. Internally, what we’re trying to do is explain that new media and a new medium can unlock barriers that at least historically have existed with creative.
Go back to when television was launched in the 1950s, when we showed people their first TV spots. The original TV spots were basically radio spots with a billboard. And, people just didn’t know how to do visual. They didn’t have the [skill set].
Today, especially in the US and almost everywhere else we can take video and translate it from TV to digital video. That’s with digital completely unlocked. And now, with programmatic, we are able to literally learn what does well, what people are responding to and gravitating to, and then buy for effect. Essentially, it allows you to put your money on where the consumers are in an immediate fashion.
“Programmatic is about being smarter about targeting and in measuring impact.”
eMarketer: Is the goal to be able to create the ads themselves on the fly, or simply to have many creative modules available to quickly slot in, in real time?
Amram: To be honest, that’s not the initial objective. For us, programmatic is about being smarter about targeting and in measuring impact. We’re not simply measuring media TV junkies, per se, but instead we’re looking at what it does to our brands and consumers. Also, we’re looking to potentially save money.
eMarketer: How does the creative work in programmatic?
Amram: Honestly, it takes time to develop that creative muscle. We ask both our brand people and our creative agencies to think differently. It doesn’t happen overnight and is something that’s learned. What we may find is that what is creativity for one brand is not the same for another because of our wide portfolio.

Digital Display Roundup Copyright ©2015 eMarketer, Inc. All rights reserved. 12
Everyone has a different spin on what their brand’s voice is going to be. We’re not prescriptive on the expectation of creativity. And, it may not change much for one brand, while it may be drastic for another brand.
eMarketer: What’s the difference between programmatic creative and dynamic creative?
Amram: My view of programmatic creative is customized delivery of the message to the right person. It’s not necessarily creating things on the fly, or real-time creative.
One is more about applying data and understanding the person, while the other is listening and reacting rapid fire. They are two different tools that can be incredibly powerful. They are applied similarly but with two different skill sets.
eMarketer: Can you share an example of how programmatic creative with personalization works?
Amram: Take our Desperados brand. It’s a large, fast-growing brand in Europe that we brought to the Southeast in the US last year. It’s a tequila barrel aged beer, and we position it as a high-energy nightlife brand. It’s not the type of beer that you drink in the afternoon on a Sunday or one that you’re going to buy a lot of in a grocery store. But, if you’re out on a Thursday night, rather than a Saturday night, and you’re out late, it’s probably a good beer to pick.
So, Desperados has a very, very specific consumer set, mindset and drinking occasion tied to it. And, it’s geographically narrow. A traditional media or even regular digital Yahoo or a YouTube homepage takeover doesn’t really make much sense.
With programmatic you have the ability to target people at a specific time and geography, along with a history of consumption, including content behavior like what they’re doing, whether they’re searching for the next bar or nightclub or what artist that they want to go see. With those types of searches, all of a sudden, programmatic becomes extremely powerful and can unlock the creative. And even if it’s not real-time creative, you can be very targeted to that person.
eMarketer: What are the big questions the industry has about the role of creative within programmatic buying?
Amram: How much does it unlock?
“How much does customization and one-to-one interaction with the consumer increase your effectiveness of the campaign?”
It takes several full-time jobs for a level of creating and customizing 20, 30 or 40 different versions of the same campaign and then do it in real time, where we’re actually tweaking things based on what people are saying and reacting to and what’s happening in the news that day. All of a sudden, you’re adding complexity. But, what is it getting?
How much does customization and one-to-one interaction with the consumer increase your effectiveness of the campaign? That’s the real question because there’s obviously a cost and an energy associated with that level of sophistication in the creative process. Coming up with one big idea and hammering it out there on national television or video is a lot easier. Before jumping into this, brands have to think about testing and learning.

Serving over 20,000 advertisers and agencies worldwide, our marketing platform helps businesses in every industry use their customer data to execute high-ROI retargeting campaigns across platforms and devices.
Find out more at adroll.com

Coverage of a Digital WorldeMarketer data and insights address how consumers spend time and money, and what marketers are doing to reach them in today’s digital world. Get a deeper look at eMarketer coverage, including our reports, benchmarks and forecasts, and charts.
eMarketer Corporate Subscriptions: The Fastest Path to InsightAll eMarketer research is available to our clients via an annual corporate subscription. The subscription provides clients with access to all eMarketer analyst reports, signature charts, interviews, case studies, webinars and more. See for yourself how easy it is to � nd the intelligence you need. Learn more about subscription options.
Con� dence in the NumbersOur unique approach of analyzing data from multiple research sources provides our customers with the most de� nitive answers available about the marketplace. Learn why.
Schedule a personalized demonstration or request a quote today. Go to eMarketer.com, call 212-763-6010, or email [email protected].
The leading research � rm for marketing in a digital world.