Embed Size (px)
Citation preview

Journal of Constructional Steel Research 89 (2013) 21–29
Contents lists available at SciVerse ScienceDirect
Journal of Constructional Steel Research
Influence of surface integrity on the fatigue strength ofhigh-strength steels
Heikki Remes a,⁎, Eero Korhonen a, Pauli Lehto a, Jani Romanoff a, Ari Niemelä b,Pasi Hiltunen b, Tuomo Kontkanen b
a Department of Applied Mechanics, School of Engineering, Aalto University, Espoo, Finlandb STX Finland, Turku Shipyard, Turku, Finland
⁎ Corresponding author at: Department of Applied MeAalto University, P.O. BOX 15300, FIN-00076 Aalto, Finl
E-mail address: [email protected] (H. Remes).
0143-974X/$ – see front matter © 2013 Elsevier Ltd. Alhttp://dx.doi.org/10.1016/j.jcsr.2013.06.003
a b s t r a c t
a r t i c l e i n f oArticle history:Received 16 April 2013Accepted 7 June 2013Available online xxxx
Keywords:Fatigue strengthHigh-strength steelSurface integrityLarge-scale testingShip structure
This paper investigates experimentally the influence of surface integrity on the fatigue strength ofhigh-strength steel used in large structures. The investigation utilises large-scale specimens of the balconyopenings of a cruise ship. The test specimens, which have a dog-bone shape and yield strength of 355 MPa,460 MPa, or 690 MPa, are cut by plasma. After the cutting, the specimens are treated by grinding or by grind-ing followed by sandblasting, i.e. using post-cutting treatments that are suitable for shipyard conditions. Theresulting surface roughness, hardness profile, and residual stress are measured. Fatigue tests with a load ratioof R = 0.1 are carried out until the final failure of the specimens. The investigation shows that post-cuttingtreatments suitable for shipyard conditions can considerably increase the fatigue strength of high-strengthsteel used in opening corners of a large-scale structure. Sandblasting after grinding increases the surfaceroughness, but reduces the fatigue strength only slightly.
© 2013 Elsevier Ltd. All rights reserved.
1. Introduction
During recent years, increasing interest has been shown in new struc-tural alternatives that improve energy efficiency and product competi-tiveness. For instance, the general arrangement of cruise and passengerships has undergone dramatic changes and large openings are includedin the load-carrying side structures, as illustrated in Fig. 1. The large balco-ny openings result in more comfortable cabins, but at the same the cor-ners of these openings have become more strength-critical.
While the static strength can be increased by using high-strengthsteel, the fatigue strength of large structures such as ships does not in-crease at the same rate as the yield or ultimate strength of the material;see e.g. [1–3]. This is due to the fact that the cutting and welding of steelplates with conventional production technology introduces crack-likesurface defects. Positioning the weld seams away from the high-stressareas can solve this problempartially, but the existence of the cut surfaceis still a problem to be solved. The production-induced surface defect actsas an initial crack for the fatigue crack growth. If the defects have a cer-tain size, around 0.1 mm, themacro crack propagation dominates the fa-tigue process over the crack initiation [4], which leads to the loss of thebenefits of high-strength steel, as illustrated in Fig. 2. If surface treatmentis applied after the plate cutting, the size of the defects is significantly
chanics, School of Engineering,and. Tel.: +358 407025268.
l rights reserved.
smaller and the high-strength steel can be better utilised in fatigue-loaded structures.
The influence of surface treatments and different processingmethods on fatigue strength has been discussed, for example, byMurakami and Endo [5], Sasahara [6], Sperle [4], Gao et al. [7], andRyu et al. [8]. These investigations show that in addition to the basema-terial yield strength [9], the main parameters which affect the fatiguestrength are the surface roughness, microscopic notch radius, hardness,and residual stresses. For favourable surface conditions, a significant fa-tigue strength improvement was observed in the case of small-scalespecimens. However, the direct application of these results to largestructures is very difficult or impossible, since the main parametersthat have an effect are very sensitive to the processing method andthe small-scale specimen is not able to capture the influence of thewhole production process on the surface integrity and fatigue strength.
The aim of this study is to examine the influence of surface integrityon the fatigue strength of high-strength steelwhen production process-es suitable for the construction of a large steel structure are considered.A case structure, i.e. a cruise ship side structure with a balcony opening,is applied in order to include all the manufacturing steps of a realisticproduction environment. Steels with a nominal yield strength of460 MPa and 690 MPa are considered, and compared with the refer-ence material with a yield strength of 355 MPa. The reference materialrepresents the high-strength steel commonly used in shipbuilding.Large-scale specimens applied in the investigations are first plasmacut to a dog-bone shape simulating a balcony opening of a cruise ship.Then the specimens are grinded and finally sandblasted, which is
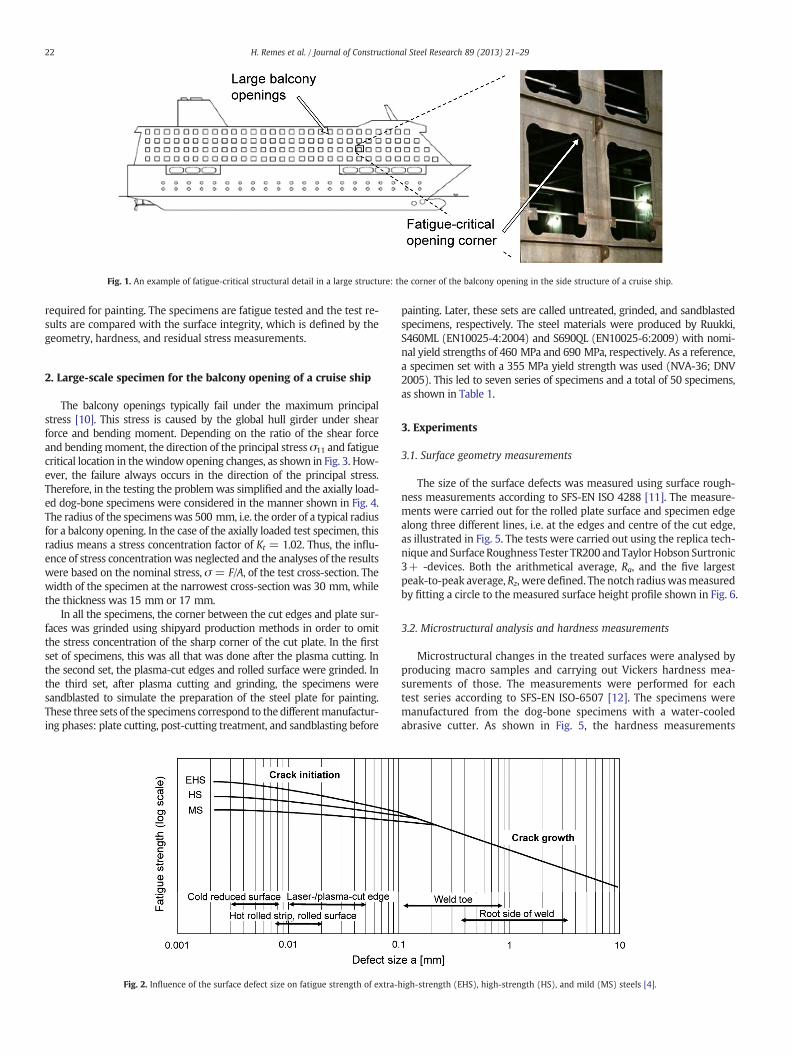
Fig. 1. An example of fatigue-critical structural detail in a large structure: the corner of the balcony opening in the side structure of a cruise ship.
22 H. Remes et al. / Journal of Constructional Steel Research 89 (2013) 21–29
required for painting. The specimens are fatigue tested and the test re-sults are compared with the surface integrity, which is defined by thegeometry, hardness, and residual stress measurements.
2. Large-scale specimen for the balcony opening of a cruise ship
The balcony openings typically fail under the maximum principalstress [10]. This stress is caused by the global hull girder under shearforce and bending moment. Depending on the ratio of the shear forceand bendingmoment, the direction of the principal stress σ11 and fatiguecritical location in thewindow opening changes, as shown in Fig. 3. How-ever, the failure always occurs in the direction of the principal stress.Therefore, in the testing the problemwas simplified and the axially load-ed dog-bone specimens were considered in the manner shown in Fig. 4.The radius of the specimenswas 500 mm, i.e. the order of a typical radiusfor a balcony opening. In the case of the axially loaded test specimen, thisradius means a stress concentration factor of Kt = 1.02. Thus, the influ-ence of stress concentrationwas neglected and the analyses of the resultswere based on the nominal stress, σ = F/A, of the test cross-section. Thewidth of the specimen at the narrowest cross-section was 30 mm, whilethe thickness was 15 mm or 17 mm.
In all the specimens, the corner between the cut edges and plate sur-faces was grinded using shipyard production methods in order to omitthe stress concentration of the sharp corner of the cut plate. In the firstset of specimens, this was all that was done after the plasma cutting. Inthe second set, the plasma-cut edges and rolled surface were grinded. Inthe third set, after plasma cutting and grinding, the specimens weresandblasted to simulate the preparation of the steel plate for painting.These three sets of the specimens correspond to the differentmanufactur-ing phases: plate cutting, post-cutting treatment, and sandblasting before
Fig. 2. Influence of the surface defect size on fatigue strength of extra-h
painting. Later, these sets are called untreated, grinded, and sandblastedspecimens, respectively. The steel materials were produced by Ruukki,S460ML (EN10025-4:2004) and S690QL (EN10025-6:2009) with nomi-nal yield strengths of 460 MPa and 690 MPa, respectively. As a reference,a specimen set with a 355 MPa yield strength was used (NVA-36; DNV2005). This led to seven series of specimens and a total of 50 specimens,as shown in Table 1.
3. Experiments
3.1. Surface geometry measurements
The size of the surface defects was measured using surface rough-ness measurements according to SFS-EN ISO 4288 [11]. The measure-ments were carried out for the rolled plate surface and specimen edgealong three different lines, i.e. at the edges and centre of the cut edge,as illustrated in Fig. 5. The tests were carried out using the replica tech-nique and SurfaceRoughness Tester TR200 and TaylorHobson Surtronic3+ -devices. Both the arithmetical average, Ra, and the five largestpeak-to-peak average, Rz, were defined. The notch radiuswasmeasuredby fitting a circle to the measured surface height profile shown in Fig. 6.
3.2. Microstructural analysis and hardness measurements
Microstructural changes in the treated surfaces were analysed byproducing macro samples and carrying out Vickers hardness mea-surements of those. The measurements were performed for eachtest series according to SFS-EN ISO-6507 [12]. The specimens weremanufactured from the dog-bone specimens with a water-cooledabrasive cutter. As shown in Fig. 5, the hardness measurements
igh-strength (EHS), high-strength (HS), and mild (MS) steels [4].

Fig. 3. Large-scale dog-bone specimen simulating the first principal stress at the open-ing corner under shear and tension loading.
Table 1Number of specimens applied in the test programme.
Yield strengtha [MPa] Surface treatment after plasma cutting of the plate
Untreated Grinded Sandblasted
355 – 5 –
460 5 5 5690 10 10 10
a Nominal yield strength of the material.
23H. Remes et al. / Journal of Constructional Steel Research 89 (2013) 21–29
were carried out for both the edge of the specimen cross-section,which was affected by the various treatments, and in the middle,which was unaffected by these. For the comparison of the results,the yield strength of the material was estimated from the Vickershardness values by using the relation σy = HV1 ∗ k, where k is ahardness conversion factor varying between 2 and 3 [13]. In the pres-ent study, a value of 2.5 was applied.
3.3. Residual stress measurements
Residual stresses were measured from the plate surface and theplasma-cut edge, as shown in Fig. 5. The specimen surfaces werecleaned with a HCL + C6H12N4 solution prior to the measurements.The X-ray diffraction technique with the modified χ-method (sin2ψ)was used for stress determination in accordance with the EN 15305standard [14]. A Stresstech xStress 3000 G2R X-ray diffractometerwith CrKα radiation (29.3 kV, 6.5 mA) was used for the residualstress measurements with a circular collimator with a diameter of3 mm. The measurement was carried out at multiple inclinations;see Appendix A. Then the residual stress was determined by Bragg'slaw with the plane stress assumption as a result of the shallow pene-tration depth, i.e. 5.8 μm for ferritic steels according to EN 15305 [14].The Young's modulus and Poisson's ratio used for the determinationof the residual stress were E = 211 GPa and v = 0.3, respectively.
3.4. Fatigue tests
The fatigue tests were carried out using cyclic tensile tests with aload ratio R = 0.1. As shown in Fig. 7, the specimens were fixed tohinged clamping jaws that allowed rotation of the specimen to avoidsecondary bending. The frequency of the test system was 1.8–3.5 Hz,depending on the load level defined for the test. The run-out pointwas defined at two million cycles. The specimens were instrumentedwith strain gauges on both sides of the specimens to verify that second-ary bending was not present during the experiment. The test wasforce-controlled and stopped at complete failure of the specimen.After the fatigue tests, the fracture surfaces were analysed to identifythe location of the fatigue crack initiation. Prior to the investigation,the fracture surfaces were cleaned using a HCL + C6H12N4 solution.
Fig. 4. The dimensions of the dog-bone specimen in millimetres.
Macroscopic images of the fracture surfaces were taken using a digitalsingle-lens reflex (dSLR) camera. From those images areas of interestwere identified for closer examination. Higher-magnification imageswere taken using a microscope.
4. Results
4.1. Surface roughness
Examples of surface profiles and extracted surface roughness valuesfor the various surface conditions are presented in Figs. 8 and 9, respec-tively. The surface profile of the grinded surface is considerably lowerthan those of the plasma-cut and sandblasted ones. This resulted inthe lowest roughness values for the grinded surfaces, as shown inFig. 9. Sandblasting causes the highest variations in surface profilesand thus, the surface roughness values are the highest, even beyondthe rolled surfaces produced by the steel mill. On the other hand, thesandblasted surface was very homogenous and the averaged notch ra-dius is larger than that of the grinded or plasma-cut surfaces.
4.2. Microstructure and hardness
The plasma cutting affected the material close to the plate edge, asshown in Fig. 10. On the basis of the hardness measurements, shownin Fig. 11, the heat-affected zone (HAZ) is about 0.5–1 mm wide,being slightly larger for the specimens with a lower yield strength.The hardness measurements also show that the transition zone be-tween the HAZ and base material is wider for the specimens with alower yield strength. In the case of the 690 MPa steel, the rapid changein the hardness profile indicates a very narrow transition zone. Grindingand sandblasting do not affect the hardness or width of the HAZ signif-icantly. Regardless of the basematerial, themaximumhardness value isbetween 460HV1 and 510HV1.When these values are compared to thebase material values below 300HV1, which are also shown in Table 2, itis evident that the surface of the cut edges has a considerably higheryield strength than that inside the specimen.
4.3. Residual stresses
The residual stresses for the rolled plate surface and plasma-cut plateedge are given in Fig. 12. Compressive residual stresses are present in therolled surface of the untreated specimen. The heat effect of plasma cut-ting has slightly increased the residual stress on the plate edge.Irrespective of the material yield strength, grinding induced significantcompressive residual stresses on both the rolled surface and the plateedge. For the rolled surface, sandblasting performed after grinding re-laxed the residual stresses to a level close to the untreated state. Stressrelaxationwas also observed for the plasma-cut plate edge, but to a less-er degree. Complete measurement results are presented in Appendix A.
4.4. Fatigue strength
Fatigue test results for the grinded specimens are presented inFig. 13; a 50% probability of survival is considered because of the lim-ited number of tests. When the grinded specimens are considered, aconsiderable increase in the fatigue strength is found for the

Fig. 5. The locations of the surface geometry, hardness, and residual stress measurements.
Fig. 6. Surface geometry measurements defining surface roughness, Ra and Rz, and the microscopic notch radius ρ.
Fig. 7. Fatigue test setup.
24 H. Remes et al. / Journal of Constructional Steel Research 89 (2013) 21–29

Fig. 8. Examples of surface profiles for plasma cut edge: A) untreated, B) grinded, and C) sandblasted.
25H. Remes et al. / Journal of Constructional Steel Research 89 (2013) 21–29
specimens with a higher yield strength. In addition, the slope of theS–N curve increases with an increase in the yield strength. All thetest results are well above the reference design curve of DNV [3]; cor-rosion protection is to be used, N b 107,m = 4, FAT160. For the spec-imens with a yield strength of 690 MPa, the fatigue strength is closeto the measured monotonic yield strength of 744 MPa–843 MPagiven in Table 2. The numerical values for the applied stress rangeand fatigue life are given in Appendix B.
In Fig. 14, the influence of different treatments on the fatigue strengthand slope value has been compared for the series with a yield strength of690 MPa. There a 97.7% probability of survival is considered. In this case,all the results are again well above the reference design curve [3]. Whenthe specimens have been grinded or sandblasted after the grinding, theslope increases considerably when compared to the untreated speci-mens. All the fatigue strength curves meet at the range of 104 to
Fig. 9. Surface roughness and defect radiu
Fig. 10. Macro section of the untreated specimens with
105 cycles, so that the S–N curve for the untreated specimens agreeswith the slope of the design curve,m = 4. It can also be seen that grind-ing the specimens increases the fatigue strength, but sandblasting aftergrinding reduces the fatigue strength only slightly.
4.5. Fracture surfaces
On the basis of the fracture surface analysis, three different fatiguecrack initiation types were observed: rolled plate surface, plate corner,and plasma-cut edge. Fig. 15 presents an example of each location ofthe fatigue crack initiation, while Table 3 summarises the crack initiationlocations for all the test specimens. The untreated specimens showed atendency for crack initiation from the rolled plate surface. In this case, sev-eral crack initiation locations were observed, as indicated by the ratchetmarks in Fig. 16A. Grinding and sandblasting changed the behaviour
s, ρ, for different surface treatments.
yield strengths of 460 MPa (A) and 690 MPa (B).

Fig. 11. Hardness for the specimens with a yield strength of 355 MPa (A), 460 MPa (B) and 690 MPa (C).
26 H. Remes et al. / Journal of Constructional Steel Research 89 (2013) 21–29
towards initiation in the corner of the plate. In the case of the sandblastedand grinded specimenswith a yield strength of 460 MPa or 690 MPa, thecracks mainly initiated close to the interface of the base material and theheat-affected zone, which is seen as a lighter shade of grey at the cut edgein Fig. 16B. For grinded specimens with a yield strength of 355 MPa, thecracks had a tendency to initiate at the plasma-cut edge. Consequently,it can be concluded that surface treatment removed the defects fromthe rolled surface and the crack initiation location changed from the rolledsurface to the plate corner or plasma-cut edge.
Fig. 12. Influence of the surface treatment on the maximum principal residu
Fig. 13. Influence of material yield strength on the fatigue strength of the gri
5. Discussion
The investigation shows that the fatigue strength of a large-scalestructure can be greatly increased by surface treatment. The treatmentremoved the surface defects, resulting in higher fatigue strength andalso differences in the location of the fatigue crack initiation. The bestresults in terms of fatigue strength are obtained by grinding theplasma-cut and rolled plate surface. The positive effects are slightly re-duced by sandblasting, which is required before the steel plates are
al stress for the rolled plate surface (A) and plasma-cut plate edge (B).
nded specimens. The reference design curve [3] is given for comparison.

Table 2Hardness-based estimation for the yield strength values of base material and theircomparison with the measured values given in the steel producers' certificates.
Surface treatment Nominalσy [MPa]
HardnessHV1
Estimatedσy [MPa]
Measuredσy [MPa]
Untreated 460 199 498Grinded 460 210 526 508Sandblasted 460 205 513Untreated 690 299 747Grinded 690 300 750 744–843Sandblasted 690 272 680
Table 3Crack initiation locations of the test specimens.
Surface treatment Nominalσy
Fatigue crack initiation location
Rolled surface Plate corner Plasma-cut edge
Grinded 355 – 1 2Untreated 460 3 – –
Grinded 460 1 2 –
Sandblasted 460 – 3 –
Untreated 690 7 – 1Grinded 690 2 6 –
Sandblasted 690 1 5 –
27H. Remes et al. / Journal of Constructional Steel Research 89 (2013) 21–29
painted, because of the increased surface roughness and reduced com-pressive residual stress in comparison to the initial state after grinding;see Figs. 8, 9, and 12. However, sandblasting has a positive effect on theshape of the defects, making the notch radius larger. In addition, thesurface treatment removed the defects from the rolled surface. As a re-sult of these factors, the sandblasted specimens have a higher fatiguestrength than the untreated specimens. These findings are supportedby the investigations of Sasahara [6] and Ngiam and Brennan [15],who concluded that the better shape of the crack-like flaws and com-pressive residual stresses increases the fatigue strength.
The utilisation of the results depends on the statistical treatment ofthe experimental results. According to the design guidelines [3], therecommended slope value is m = 4.0 for the base material in anon-corrosive environment when the number of cycles is less than107. The present results for the untreated specimens are in agreementwith this, considering a safety factor of fs = 1.65 between the designcurve and tested specimens (97.7% probability level). However, forthe grinded and sandblasted specimens the slopes observed in thetests are considerably higher than the slope m = 4.0. This is in linewith the results of Gao et al. [7], who showed that with different surface
Fig. 14. Influence of surface treatment on fatigue strength of the specimen with yield strencurve [3] are also given.
Fig. 15. Observed fatigue crack initiation locations: A) rol
treatments the slope is changed considerably in ultra-high-strengthsteel. Meanwhile, the results of this paper for the grinded specimens in-dicate that the slope value is also affected by the yield strength of thematerial when the specimens have a high surface quality. In this case,fitting the results to a fixed slope m = 4 leads to a situation wherethe scatter of the test results from the average curve becomes veryhigh and the fatigue strength within the range of 104 to 105 cycles be-comes higher than the measured yield strength of the material.
6. Conclusions
This paper investigated experimentally the influence of surface in-tegrity on the fatigue strength of high-strength steel plates used in thebalcony openings of cruise ship structures. Different surface treatmentswere considered to simulate themanufacturing process of the shipyard.The large-scale test specimens, which had a yield strength of 460 MPaor 690 MPa, were cut by plasma. After the cutting, the specimenswere treated by grinding or by grinding followed by sandblasting. Theresulting surface roughness, hardness, and residual stress were mea-sured. Fatigue tests with a load ratio R = 0.1 were carried out.
gth of 690 MPa. The trend lines at a 97.7% probability of survival and reference design
led surface, B) plate corner, and C) plasma-cut edge.

Fig. 16. Main difference in the fatigue crack initiation between untreated and treated specimens with yield strengths of 460 and 690 MPa: A) untreated plate surface with severalcrack initiation locations as indicated by the ratchet marks, and B) treated surface with one crack initiation location at the interface of the base material and heat-affected zone.
28 H. Remes et al. / Journal of Constructional Steel Research 89 (2013) 21–29
The investigation shows that post-cutting treatments suitable forshipyard conditions can considerably increase the fatigue strength ofhigh-strength steel used in large-scale structures. The increase in fatiguestrength is due to the reduced surface roughness and compressive resid-ual stress. Sandblasting after grinding increases the surface roughness andreduces the compressive residual stress. However, the influence on the fa-tigue strength is minor since sandblasting produces a favourable defectshape that has a larger notch radiuswhen compared to grinding. The sur-face treatment also has an influence on the slope of the S–N curve, whichdiffers significantly from the commonly applied slope valuem = 4.
The present study focused on the experimental investigation of thesurface integrity and its influence on the fatigue strength of large-scalestructures. Further analysis of the test results considering the theoreticalmodelling aspects is left for future work. In addition, the effect of theload history, i.e. variable amplitude loading, needs to be considered.
Acknowledgements
The research presented here was carried out in a Finnish researchproject funded by the Technology Agency of Finland, Tekes. The workis related to the Light and Innovations and Network projects withinthe scope of the Finnish Metals and Engineering Competence Centre.All the financial support is gratefully appreciated. Appreciation is also
Table A-1Residual stress measurement results, standard deviations, and principal stresses for the rol
Surface treatment Nominal σy Residual stress [MPa]
0° (x-direction) 45°
Grinded 355 −103.4 ± 5.3 −130.6 ±Untreated 460 −66.1 ± 4.3 −45.1 ±Grinded 460 −49.3 ± 5.3 −91.2 ±Sandblasted 460 −51.9 ± 2.5 −55.4 ±Untreated 690 −54.9 ± 2.7 −44.9 ±Grinded 690 −110 ± 4.8 −148.7 ±Sandblasted 690 −51.3 ± 2.5 −54.6 ±
Table A-2Residual stress measurement results, standard deviations, and principal stresses for the pla
Surface treatment Nominal σy Residual stress [MPa]
0° (x-direction) 45°
Grinded 355 −81.6 ± 3.7 −127.7 ±Untreated 460 −8.3 ± 3.0 −45.2 ±Grinded 460 −76.8 ± 7.6 −125.2 ±Sandblasted 460 −131.7 ± 2.4 −111.5 ±Untreated 690 −33.6 ± 3.0 −47.7 ±Grinded 690 −63.8 ± 5.6 −127.7 ±Sandblasted 690 −115.7 ± 2.5 −103.6 ±
due to Akseli Kukkonen from the Department of Engineering Designand Production at Aalto University for his assistance.
Appendix A. Residual stress measurement data
The residual stress measurement data for the rolled surface andplasma-cut edge of the specimens with and without surface treatmentare presented in Tables A-1 and A-2. In the residual stressmeasurementthe interference line from {211} ferrite lattice plane (2θ = 156.4°) wasregistered under 19 differentχ-inclination angles: 0.0°,±12.4°,±17.6°,±21.8°, ±25.4°, ±28.6°, ±31.7°, ±34.5°, ±37.3°, and ±40.0°. The ex-posure time for a single inclination was 5 s, and prior to the measure-ments a calibration measurement was made from a stress-free Fepowder. By applying Bragg's law, the bi-axial residual stresses were de-termined for the specimen surface. The calculated standard deviation ofa single residual stress measurement was about 5 MPa.
Appendix B. Fatigue test results
Table B-1 summarises the specimen dimensions, applied loadlevels, stress range, and fatigue life for the final failure. If the fatiguelife was longer than 2 million load cycles, the test was stopped andit was classified as a Run out test.
led surface of the specimens.
Principal stress [MPa]
90° (y-direction) σ1 σ2 φ
3.5 −193.8 ± 2.6 −99.9 −197.2 −10°3.7 −32.6 ± 7.7 −32.1 −66.7 7°5.0 −169.8 ± 3.2 −46.6 −172.5 −8°2.9 −51.3 ± 2.3 −47.8 −55.5 −42°3.4 −34.7 ± 3.7 −34.7 −54.9 0°3.3 −214 ± 3.7 −108.3 −215.7 −7°2.5 −57.1 ± 2.6 −51.3 −57.1 3°
sma-cut edge of the specimens.
Principal stress [MPa]
90° (z-direction) σ1 σ2 φ
4.0 −174.1 ± 3.6 −81.6 −174.1 0°2.8 −81.1 ± 3.7 −8.3 −81.1 0°4.5 −160.6 ± 4.9 −76.2 −161.1 −4°3.0 −111.9 ± 3.9 −107.6 −136.1 23°2.6 −82.9 ± 5.4 −31.5 −85.1 −11°3.9 −182.3 ± 2.0 −63.6 −182.4 2°2.4 −92.9 ± 2.2 −92.8 −115.8 −1°

Table B-1Summary of fatigue test results.
Yield strength Surface treatment Specimen name Plate thickness Width, w Load ratio Max. load Min. load Mean load Stress range Fatigue life
355 Grinded P2_355_1 17.2 30.4 0.10 203 21 112 349 Run outP2_355_2 17.1 30.2 0.10 245 25 135 427 107,852P2_355_3 17.1 30.1 0.10 248 25 136 434 99,839P2_355_4 17.5 30.2 0.10 241 24 132 412 141,924
460 Untreated P1_460_1 15.3 30.4 0.10 200 21 111 386 Run outP1_460_2 15.2 30.5 0.10 210 22 116 409 Run outP1_460_3 15.1 30.4 0.10 230 24 127 450 128,052P1_460_4 15.3 30.1 0.10 221 22 121 432 345,089P1_460_5 15.1 30.5 0.10 221 22 122 431 406,532
Grinded P2_460_1 15.0 30.1 0.10 240 24 132 479 340,454P2_460_2 14.9 30.3 0.10 250 25 137 499 191,725P2_460_3 14.8 30.1 0.10 249 25 137 504 180,729
Grinded and sand-blasted P3_460_1 15.1 30.2 0.10 230 23 126 455 132,519P3_460_3 15.0 30.0 0.10 220 22 121 440 Run outP3_460_4 15.1 30.3 0.10 225 22 124 444 133,496P3_460_5 15.0 30.4 0.10 225 22 124 445 1,683,779
690 Untreated P1_690_1 15.1 30.4 0,08 255 21 138 511 200,710P1_690_2 15.3 30.5 0,09 210 19 115 409 359,047P1_690_3 15.1 30.4 0.10 183 18 101 360 Run outP1_690_4 15.4 30.5 0.10 259 26 142 497 322,686P1_690_5 15.1 30.4 0.10 210 21 116 411 Run outP1_690_6 15.3 30.6 0.10 281 28 154 540 338,862P1_690_7 15.1 30.1 0.10 240 25 133 475 555,330P1_690_8 15.4 30.6 0.10 340 33 187 650 118,407P1_690_9 15.2 31.0 0,11 310 35 173 584 190,356P1_690_10 15.1 31.0 0.10 340 35 188 654 122,227
Grinded P2_690_1 14.9 30.2 0.10 335 34 184 670 132,574P2_690_2 15.0 30.5 0.10 340 34 187 669 204,120P2_690_3 14.9 30.7 0.10 320 32 176 630 1,784,428P2_690_4 15.0 30.1 0.10 350 35 192 700 140,676P2_690_5 15.0 30.6 0.10 349 35 192 685 159,009P2_690_6 14.9 30.1 0.10 340 34 187 680 468,579P2_690_7 15.0 30.4 0.10 330 34 182 649 207,989P2_690_9 15.1 30.1 0.10 350 35 193 696 142,475
Grinded and sand-blasted P3_690_4 15.0 30.0 0.10 290 29 160 580 Run outP3_690_5 15.1 30.5 0.10 330 33 182 647 119,358P3_690_6 14.9 30.2 0.10 320 32 176 638 90,681P3_690_7 15.0 30.4 0.10 310 31 171 613 752,909P3_690_8 15.1 30.3 0.10 315 31 173 624 377,856P3_690_9 15.1 30.5 0.10 315 32 173 618 495,229P3_690_10 15.0 30.1 0.10 320 32 176 639 479,482
29H. Remes et al. / Journal of Constructional Steel Research 89 (2013) 21–29
References
[1] Sharp JV, Billingham J, Stacey A. Performance of high strength steels used injack-ups. Mar Struct 1999;12(4):349–70.
[2] Miki C, Homma K, Tominaga T. High strength and high performance steels andtheir use in bridge structures. J Constr Steel Res 2002;58(1):3–20.
[3] Det Norske Veritas. Classification notes. Fatigue Assessment of Ship Structures,No. 30.7. Hovik, Norway: Det Norske Veritas; 2008 .
[4] Sperle J-O. Influence of parent metal strength on the fatigue strength of parentmaterial with machined and thermally cut edges. Weld World 2008;52(7–8):79–92.
[5] Murakami Y, Endo M. Effect of defects, inclusions and inhomogenities on fatiguestrength. Int J Fatigue 1994;16(3):163–82.
[6] Sasahara H. The effect on fatigue life of residual stress and surface hardnessresulting from different cutting conditions of 0.45%C steel. Int J Mach ToolsManuf 2005;25:131–6.
[7] Gao Y, Li X, Yang Q, Yao M. Influence of surface integrity on fatigue strength of40CrNi2Si2MoVA steel. Mater Lett 2007;61:466–9.
[8] Ryu HR, Kim WS, Ha HI, Kang SW, Kim MH. Effect of toe grinding on fatiguestrength of ship structure. J Ship Prod 2008;24(3):152–60.
[9] Jesus AMP, Matos R, Fontoura BFC, Rebelo C, Silva LS, Veljkovic M. A comparison ofthe fatigue behavior between S355 and S690 steel grades. J Constr Steel Res2012;79:140–50.
[10] Bäcktröm M, Kivimaa S. Estimation of crack propagation in a passenger ship'sdoor corner. Ships Offshore Struct 2009;4(3):241–51.
[11] SFS-EN ISO 4288. Geometrical Product Specifications (GPS) — surface texture:profile method — rules and procedures for the assessment of surface texture;1996 .
[12] SFS-EN ISO-6507. Metallic materials. Vickers hardness test. Part 1: test method;2005 .
[13] Pavlina EJ, Van Tyne CJ. Correlation of yield strength and tensile strength withhardness for steels. J Mater Eng Perform 2008;17(6):888–93.
[14] EN 15305:2008. Non-destructive testing—test method for residual stress analysis byX-ray diffraction. Brussels, Belgium: European Committee for Standardisation; 2008 .
[15] Ngiam SS, Brennan FP. Fatigue crack control in structural details using surfacepeening. J Ship Prod 2008;24(3):147–51.