Embed Size (px)
Citation preview

NAVAL FACILITIES ENGINEERING COMMAND Washington, DC 20374-5065
NAVIAC Technical Report
TR-2118-ENV
JET ENGINE TEST CELL NOISE REDUCTION
by
C. A. Kodres, Ph.D., P.E.
Naval Facilities Engineering Service Center Port Hueneme, CA 93043-4370
August 2000
Approved for public release; distribution is unlimited.
pTiG CgUAjuiXf Li.^±?:J>}c.*it ■* ^ pr\nted on recycled paper

REPORT DOCUMENTATION PAGE | oEÄSe Public reporting burden for this collection of information is estimated to average 1 hour per response, including the time for reviewing instructions, searching existing data sources, gathering and maintaining the data needed, and completing and reviewing the collection of information. Send comments regarding this burden estimate or any other aspect of this collection information, including suggestions for reducing this burden, to Washington Headquarters Services, Directorate for Information and Reports, 1215 Jefferson Davis Highway, Suite 1204, Arlington, VA 22202- 4302, and to the Office of Management and Budget Paperwork Reduction Project (0704-0188), Washington, DC 20503.
1. AGENCY USE ONLY (Leave blank) 2. REPORT DATE August 2000
3. REPORT TYPE AND DATES COVERED Final; Oct 1996 to Dec 1999
4. TITLE AND SUBTITLE
JET ENGINE TEST CELL NOISE REDUCTION
5. FUNDING NUMBERS
6. AUTHOR(S)
C.A.Kodres,Ph.D.,P.E.
7. PERFORMING ORGANIZATION NAME(S) AND ADDRESSE(S)
Naval Facilities Engineering Service Center 1100 23rd Ave. Port Hueneme, CA 93043-4370
8. PERFORMING ORGANIZATION REPORT NUMBER
TR-2118-ENV
9. SPONSORING/MONITORING AGENCY NAME(S) AND ADDRESSES
Chief of Naval Operations CodeN45 Washington, DC 22217
10. SPONSORING/MONITORINGAGENCYREPORT NUMBER
11. SUPPLEMENTARY NOTES
12a. DISTRIBUTION/AVAILABILITY STATEMENT
Approved for public release; distribution is unlimited.
12b. DISTRIBUTION CODE
13. ABSTRACT (Maximum 200 words)
Passive methods for decreasing jet engine test cell noise emissions are evaluated and compared. Such methods have the dual advantages of low cost and simplicity. In addition, the effect on the aerothermal performance of the test cell is minimal. Sound pressure levels were measured in and around test facilities equipped with various devices to further reduce noise. The data were supplemented with parametric studies of noise reduction techniques conducted using a 1/20* scale physical model of the Navy's standard T-10 jet engine test cell. Methods that attack the noise problem from outside and methods that attack the problem from inside the test cell are assessed, including trees and other vegetation, acoustic walls, core busters, and modifications to the exhaust stack. Mounting screens in the path of the jet and increasing the height of the exhaust stack are found to be the most effective.
14. SUBJECT TERMS
Jet engine test cell, hush house, sound, noise, noise reduction, jet noise 15. NUMBER OF PAGES
16. PRICE CODE
17. SECURITYCLASSIFICATION OFREPORT
Unclassified
18. SECURITYCLASSIFICATION OF THIS PAGE
Unclassified
19. SECURITY CLASSIFICATION OF ABSTRACT
Unclassified UL
NSN 7540-01-280-5500 Standard Form 298 (Rev. 2-89) Prescribed by ANSI Std. 239-18

EXECUTIVE SUMMARY
Passive methods for decreasing jet engine test cell noise are evaluated and compared. Sound pressure levels were measured in and around test facilities equipped with various devices to further reduce noise. The data were supplemented with parametric studies of noise reduction techniques conducted using a 1/20* scale physical model of the Navy's standard T-10 test cell. This project was funded by the Pollution Abatement Ashore Program, managed by Naval Facilities Engineering Command, and sponsored by the Environmental Protection, Safety, and Occupational Health Division (N45) of the Chief of Naval Operations.
Jet Engine Test Cells Are Noisy
Air-cooled test facilities have, by their nature, the capacity to generate very high levels of sound. The two air-cooled facilities with noise emissions most extensively measured are the Navy's standard A/F32T-10 jet engine test cell and the arched structure hush house used primarily by the Air Force. Both are exceeding their far-field design limit of 85 dBA. For example, far-field noise levels generated by the Navy's T-10 test facility reached 93 dBA at NAS Cubi Point while testing the afterburning F404 engine, and reached 96 dBA while testing the F110, and 91 dBA while testing the TF30 at NAS Oceana. Far-field noise levels reached 100 dBA while testing the new F414 engine in the T-10 test cell at NAS Patuxent River. The Air Force style hush houses are nearly as noisy, reaching 87 dBA while testing an afterburning F-18 (F404 engine) at the NARF Jacksonville and more than 90 dBA while testing an A-6E (J52 engine) at military power in the Grumman facility at Calverton, New York. The problem will get worse; future engines will be much more powerful.
Noisy Test Facilities Are More Than Just A Nuisance
The sound emitted from jet engine test facilities is of concern for three reasons: (1) as a cause of permanent hearing loss by test personnel and others in the vicinity, (2) as a cause of physiological and psychological trauma to test personnel and others in the vicinity, and (3) as a cause of structural damage, not only to the cell itself, but also to surrounding buildings.
Permanent hearing loss can be caused by short exposure to extremely high sound levels or by repeated exposures to more moderate levels. The criterion used by the Occupational Safety and Health Administration (OSHA) to numerically assess the danger of noise to the human ear is the DRC (hearing damage risk criterion), the noise level below which damage to hearing from habitual exposure to noise should not occur in normal ears. The DRC has been set at 90 dBA for a continuous 8-hour exposure to ordinary broadband noise. The DoD test cell design limit for noise is more stringent, to be no greater than 85 dBA at a distance of 250 feet from the facility.
Various studies have shown that if the noise level is excessive, people become irritable as well as less efficient. The increase in levels of stress hormones in children living near airports has actually been measured. Loud noise can produce effects such as fear and changes in pulse rate, respiration rate, metabolism, and acuity of vision. There is evidence showing that prolonged exposure to excessive loud noise will result in permanently elevated blood pressure.
The 85-dBA limit is not always an applicable limit since the A-scale is weighted according to those sound frequencies that are annoying to the human ear. High energy, low frequency sound waves, discounted in the A-scale, can excite mechanical vibration modes in test cell structure and surrounding buildings. Low frequency and infrasound (below the frequency

range of human hearing) emissions from hush houses at Luke, Langley, and Wright-Patterson Air Force Bases have vibrated houses and other structures at distances greater than 250 feet from the facility despite meeting the 85 dBA limit. Building vibrations in the vicinity of the Arkansas Air National Guard hush house have been sufficiently intense to raise questions concerning the safety of the occupants. The test cell has to provide an acceptable work environment but also be a good neighbor.
Many Methods for Reducing Test Cell Noise Have Been Proposed
Natural barriers such as trees and shrubs achieve only a small attenuation of the sound emitted by test cells, typically a few dB per 100 feet of woods. All jet engine test facilities should be surrounded with vegetation if the space is available, but trees are not a solution to jet noise problems.
Artificial barriers achieve a moderate attenuation of sound emitted by jet engines. For example, the acoustic wall surrounding the T-64 turboshaft test stand at MCAS Miramar reduced far-field noise by about 6 dB. Regardless, artificial barriers are not practical for any facilities other than test stands. They could not realistically be constructed to shield a test cell or hush house. At distances between source and receiver greater than a few hundred feet, it would be very difficult to provide man-made barriers large enough to produce any noticeable attenuation.
Sponsons, often referred to as "core busters," are an effective, relatively inexpensive method of decreasing test cell sound emissions. Measurements have shown that aerodynamic jet noise is generated near the jet nozzle by the turbulent mixing of the jet and augmentation air. It follows that breaking up the jet in this region would decrease noise. Screens are the most effective core buster; more than a 10-dB reduction can be achieved by installing screens in the path of the jet. The screens used in a T-10 jet engine test cell would have a "wire" diameter of about 1.25 inches with perhaps a 1-foot spacing. To be effective, they must be placed within about 15 feet of the jet nozzle. All materials that close to the engine need to be cooled.
Other suggested internal modifications do not attenuate jet noise nearly as well as the screens. Rectifier tubes like those installed in the hush house at NAF Atsugi have little effect. The "sawtooth" mounted at the top of the exhaust stack at NAS Lemoore decreased far-field noise by about 7 dB directly behind the facility but had little effect in all other directions. None of the sawtooth configurations tested using the physical model reduced noise by much more than 1 dB in any direction.
Increasing the height of the exhaust stack is a very effective method of decreasing test cell sound emissions. This is primarily attributable to the additional acoustic insulation. A 9-dB overall decrease in noise emitted by the test cell physical model was achieved by doubling the height of the stack. The concept has already been demonstrated on the retrofit of the "A" test cell at MCAS Miramar. A reduction of more than 10 dBA far field was achieved by adding a 25- foot extension to the exhaust stack. The noise was reduced across the entire frequency band.
The T-10 exhaust stack ramp does not perform very well acoustically. There is little overall attenuation of sound through the stack, and the frequency at which the sound is maximum is shifted toward the more troublesome lower frequencies. Removing the ramp and thus allowing the jet to impinge on the back wall of the stack has little effect on the acoustic performance of the NFESC test cell rig—no better but no worse. The ramp is the major component of the $300,000 T-10 exhaust stack. The acoustic performance of turning vanes is also very similar to the performance of the ramp. A colander performs best of the alternate
in

configurations appraised. Switching to a colander in the T-10 test cell will decrease far-field noise by 2 dB overall and 3 to 6 dB in the low and infrasound frequency range.
Screens And High Exhaust Stacks Are The Most Effective
An inexpensive quick fix to a noisy jet engine test cell is to install a screen across the inlet to the augmenter tube. The screen must, of course, be cooled.
Although initially more expensive, an equally effective method of reducing test cell noise emissions is to increase the height of the exhaust stack. Without the need for cooling water, the high stack is more reliable, less vulnerable, and cheaper to operate and maintain. The stack extension must be acoustically lined; baffles should be considered.
IV

CONTENTS Page
INTRODUCTION 1 Background 1 Air-Cooled Test Facilities Are Noisy 3
TEST CELL SOUND EMISSIONS 5 Low Frequency Sound Is the Problem 5 Methods for Reducing Noise 6
PASSIVE NOISE REDUCTION 11
ASSESSING METHODS OF REDUCING JETC NOISE 12 JETC Physical Model (Rig) 12 Sound Data Acquisition 14 Correlation Between Rig and JETC Noise 16
DEVELOPMENT OF SOUND THROUGH AND BEYOND THE TEST CELL 18
REDUCTION OF TEST CELL NOISE 20 Vegetation 20 Artificial Barriers 23 Sawtooth 30 Sponsons/Core Busters 32 Rectifier Tubes 36 Exhaust Stack Height 36 Exhaust Stack Configuration 42
SUMMARY 51
CONCLUSIONS 52
ACKNOWLEDGMENT 53
REFERENCES 53
APPENDDC - Jet Engine Test Cell Emissions Test Facility A-l

INTRODUCTION
A jet engine test cell (JETC) is an all-weather enclosure used for the post-maintenance testing of jet engine performance. Its principal function is to minimize the noise reaching the surrounding community.
Background
The first Navy jet engine test cells were built in the mid-1950s. These facilities were made of concrete and worked by spraying cooling water into the jet exhaust. The water reduced the energy of the jet, both decreasing noise and making the exhaust gases compatible with cell materials. However, several problems were inherent in this type of test cell. The most severe was the "fallout" from the exhaust plume. The plume was composed of saturated steam laden with unburned fuel and particulate matter, and of exhaust gases consisting partially of NOx and hydrocarbons remaining from incomplete combustion. The dirty wet fallout on adjacent buildings, aircraft, pavements, vehicles, and people was a nuisance. In addition, the plumes were highly visible. Activities in California were being cited by air pollution inspectors for violations of visible emissions regulations.
While the Navy continued to test jet engines in water-cooled test cells, air-cooled facilities were being developed in Europe. The first Navy air-cooled test facilities were hush houses (the engine remains mounted on the aircraft which is rolled into the test bay and secured) built in the early 1980s at Naval Air Station (NAS) Miramar and Marine Corps Air Station (MCAS) El Toro in response to the California visible emissions problems. The hush house exhaust system design was based on the technology developed by the Swedish firm Granges NyBy Steel Company for hush houses built in Sweden and England (Ference, 1995).
Figure 1 is a schematic of a typical air-cooled test cell. Of primarily stainless steel construction, the test cell acts as a large eductor. Engine exhaust gases, leaving the nozzle as a high velocity, high temperature, relatively small diameter jet, are directed into the augmenter tube. An expanding shear layer develops around the jet, pulling along a layer of cool ambient air. Momentum and energy are transferred to this augmentation air, decreasing the velocity and temperature of the jet.
Now nearly all jet engine test cells are air-cooled. There are currently 368 air-cooled test cells located at 130 test sites in the United States (EPA, 1994); about half of these are Department of Defense (DoD) facilities. There is no standard DoD test cell. Navy and Air Force JETCs are different. Commercial test facilities are also, for the most part, unique, with a large range of sizes and configurations.
The test cell shown in Figures 1 and 2 is the standard Navy jet engine test cell, designated the A/F32T-10. Air enters the T-10 through both a primary and secondary inlet. The secondary inlet provides additional cooling air without increasing engine intake air turbulence. The augmenter tube is circular; the flow is tunneled into the tube through an obround section. Figure 3 is a photograph of the augmenter tube taken from inside the test bay. Exhaust gases are then diverted up the stack by a 45-degree ramp. A detailed description of the Navy T-10 test cell is included in the report by Kodres and Murphy (1996).

Exhaust stack
Secondary air intake
Ramp Obround to round transition
Primary air intake
v Turning z ^ vanes
Figure 1. Schematic of the Navy's A/F32T-10 jet engine test cell.
.*mM
Figure 2. Front view of the Navy's standard T-10 jet engine test ceil.

Figure 3. Jet engine mounted in the test bay and exhausting into the augmenter tube.
Air-Cooled Test Facilities Are Noisy
Switching from water to air-cooling solved the fallout problem, but switching also caused a noise problem. Air-cooled test facilities have, by their nature, the capacity to generate very high levels of sound. The two air-cooled facilities with noise emissions most extensively measured are the Navy's standard T-10 test cell and the Air Force's arched structure hush house shown in Figure 4, and both are exceeding their design limit of 85 dBA at distances greater than 250 feet. For example, T-10 far-field noise levels reached 93 dBA at NAS Cubi Point while testing the afterburning F404 engine (Schmidt, 1987), and reached 96 dBA while testing the Fl 10 and 91 dBA while testing the afterburning TF30 at NAS Oceana (Fadeley, 1991). Far-field noise levels reached 100 dBA while testing the new F414 engine in the T-10 JETC at NAS Patuxent River. The Air Force hush houses are nearly as noisy, reaching 87 dBA while testing an afterburning F-18 (F404 engine) at the Naval Air Rework Facility (NARF) Jacksonville (Glass, 1986b) and more than 90 dBA while testing an A-6E (J52 engine) at military power in the Grumman facility at Calverton, New York (Glass, 1985a).
Aerodynamic jet noise increases exponentially with jet velocity and, as would be expected, noise generation is greatest when the test engine is afterburning. Figure 5 is a polar plot showing far-field noise measured in the vicinity of the T-10 test cell at NAS Lemoore (Glass, 1986a) while testing the F404 and TF41 engines. The sound pressure level is highest directly behind the facility, albeit if the exhaust stack rather than the engine nozzle is considered the source, the differences, circumferentially, would not be so pronounced.

Figure 4. Arched structure hush house at Kelly AFB, Texas.
330° 140° 380° 0° 10° *? *£. 40°
ruf sod° «°° «o°
Figure 5. Far-field noise measured in the vicinity of the T-10 test cell at NAS Lemoore (Glass, 1986a).
TEST CELL SOUND EMISSIONS
The sound emitted from jet engine test facilities is of concern for three reasons: (1) as a cause of permanent hearing loss by test personnel and others in the vicinity, (2) as a cause of physiological and psychological trauma to test personnel and others in the vicinity, and (3) as a cause of structural damage, not only to the cell itself, but also to surrounding buildings.
Permanent hearing loss can be caused by short exposure to extremely high sound levels or by repeated exposures to more moderate levels. The criterion used by the Occupational Safety and Health Administration (OSHA) to numerically assess the danger of noise to the human ear is the DRC (hearing damage risk criterion), the noise level below which damage to hearing from habitual exposure to noise should not occur in normal ears. The DRC has been set at 90 dBA for a continuous 8-hour exposure to ordinary broadband noise. OSHA regulation 29CFR1910.95 further limits occupational noise to a maximum of 115 dBA regardless of duration.
The DoD test cell design limit for noise is 85 dBA at a distance of 250 feet. The distance is a compromise, far enough from the facility so that the measured insertion loss is not varying but close enough so that atmospheric conditions do not unduly influence the measurements (Doelling, 1961). This is a measure of the noise reaching the adjacent community. The Noise Control Act regulates noise outside of the workplace but does not give State and local agencies jurisdiction over Federal noise sources. Navy efforts to reduce the noise levels from JETC are made because the noise disturbs the community.
Various studies have shown that if the noise level is excessive, people become irritable as well as less efficient. Cohen, et al. (1980)] and Evans, et al. (1995) have actually measured the increase in levels of stress hormones in children living near airports. Loud noise can produce effects such as fear, changes in pulse rate, respiration rate, metabolism, and acuity of vision. There is evidence to show that prolonged exposure to excessive loud noise will result in permanently elevated blood pressure (Bies and Hansen, 1988).
The 85-dBA limit is not always a true measure of noise emission limit since the A-scale is weighted according to those sound frequencies that are annoying to the human ear. High energy, low frequency sound waves, discounted in the A-scale, can excite mechanical vibration modes in test cell structure and surrounding buildings. Although sonic-induced vibrations measured in the older concrete test cells were below levels expected to cause long term fatigue damage, they certainly did augment the damage caused by the high velocity, high temperature flow (Piersol, 1985; Ver and Ungar, 1985). Low frequency and infrasound (below the frequency range of human hearing) emissions from hush houses at Luke, Langley, and Wright-Patterson Air Force Bases have vibrated houses and other structures at distances greater than 250 feet from the facility despite meeting the 85 dBA limit (VSE, 1985; Ellis, 1989). Building vibrations in the vicinity of the Arkansas Air National Guard hush house have been sufficiently intense to raise questions concerning the safety of the occupants (Battis, 1987). Future engines will be much more powerful. Limits on sound levels in the infrasound range will ultimately be required. The test cell has to provide an acceptable work environment but must also be a good neighbor.
Low Frequency Sound Is the Problem
Test cell noise is low frequency sound. Figure 6(a) illustrates this phenomenon, comparing 1/3 octave sound pressure levels at different locations in and around the T-10 test cell at MC AS Miramar (Fadeley, 1989). The maximum sound pressure level (SPL) occurs at a frequency of about 100 Hz. An afterburning TF30 was being tested. Microphones were placed

alongside the engine, at the top of the exhaust stack, and far field, 250 feet directly behind the engine. Also included in this figure is the far-field measurement adjusted for the increased distance from the source; the decrease in acoustic energy due to spreading has been added to the measured far-field value. Therefore, this last curve shows the attenuation by the atmosphere, plus absorption by the ground, and interference from sound reflected off the ground. The ground is rough dirt with thick grasses and weeds. There are no trees behind the facility.
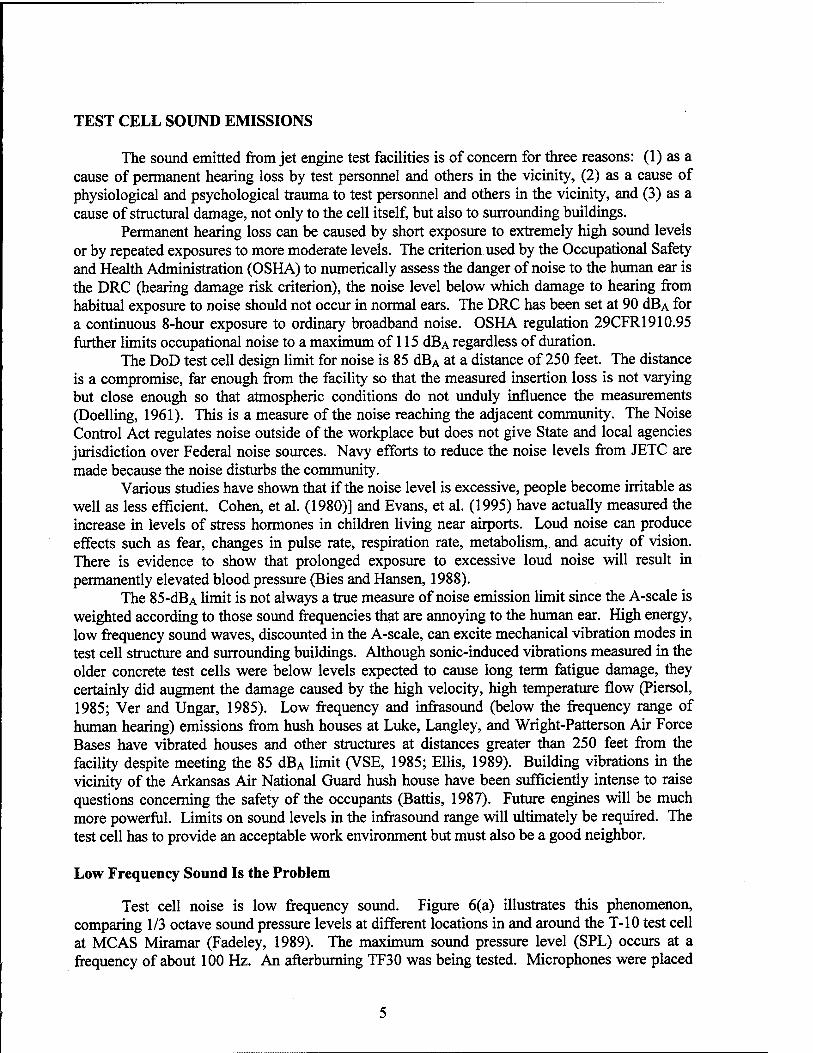
The human ear is sensitive to sound extending from 20 to 20,000 Hz, but is most sensitive to sound in the 500- to 4,000-Hz frequency range (Tocci, 1998). A-weighting accounts for this, filtering portions of the high and low frequencies to provide a sound level representative of what the ear hears. Thus, noise-induced hearing loss is directly related to A-weighted sound energy of an exposure. No other measure of noise exposure provides a better cause-effect relationship with hearing loss (von Gierke, 1992). Figure 6(b) duplicates Figure 6(a) except that the sound pressure levels are A-weighted. The results are the same. Jet engine test cell sound emissions most damaging to the ear occur at a frequency of about 100 Hz.
Some other test facilities perform better than the T-10, but the low frequency noise is still the major problem. Figure 7 compares 1/3 octave sound pressure levels at the same locations in and around the T-16 turboshaft engine test cell at MCAS Tustin (Rishel, 1997). The T-64 engine is being tested at military power. There is some reduction in low frequency sound between the engine and the top of the exhaust stack but the decrease is still predominantly at the higher frequencies.
Methods for Reducing Noise
Numerous flow path configurations are being employed with the goal of decreasing test cell sound emissions. The acoustic performances of the different air intakes and run rooms are similar, even including such a geometrically different configuration as the side inlet (Glass, 1986a). This would be expected. The air velocities into and through the run room are more than an order of magnitude lower than gas velocities through the hot sections.
The augmenter tube design does have a major effect on test cell sound emissions. Adding a transition section is an example. The objective is to decrease turbulence by inducing a smooth mixing of the jet and augmentation air. Increasing the size of the augmenter tube is another example. Larger augmenter tubes have a greater pillow surface area, increasing the attenuation of sound. Small augmenter tubes are cheaper to construct and maintain. Augmentation ratios are lower, however. High gas temperatures and damaged acoustic pillows are likely. Gas velocities are higher, increasing the generation of surface noise (Lancey, 1997).
The colanders/perforated baskets installed at the end of the augmenter tubes of the water- cooled test cells and some air-cooled facilities perform by breaking up the large-scale turbulence. The colanders were usually the same diameter as the augmenter tube, about 20 feet in length, and with typically 1.25-inch holes. An overall noise reduction of approximately 6 dB, primarily at the lower frequencies, was achieved by a colander while testing an F404 engine in an early air- cooled test cell at MCAS El Toro (Glass and MacCormack, 1986).
140
120
CD n _J ID > UJ
£100 ID (/) w LU
£ 80
O W 60
40 -
ALONGSIDE ENGINE {142 dBL)
FAR FIELD (114 dBL)
- FAR FIELD. SPREADING IS SUBTRACTED
NOTES: (1) TESTING AFTERBURNING TF30 ENGINE (2) REFERENCE: FADELEY, 1989 ■ ■ 1 1 1 1 1
10* 103 104
1/3 OCTAVE BAND CENTER FREQUENCY, HZ
Figure 6(a). Attenuation of sound through and beyond the T-10 jet engine test cell at MCAS Miramar.
107 105 104
1/3 OCTAVE BAND CENTER FREQUENCY, HZ
Figure 6(b). A-weighted attenuation of sound through and beyond the T-10 jet engine test cell at MCAS Miramar.

140 -
DO
_r LU > LU
"120 -
LU <r 100 3 W C/3 LU CC 0- 80 Q Z D o C/3 60 -
40 -
NOTES:
(1) TESTING T-64 ENGINE AT MILITARY POWER
(2) REFERENCE: RISHEL, 1997
ALONGSIDE ENGINE (136 dBL, 136 dBA)
TOP OF EXHAUST STACK (100 dBL, 93 dBA)
J
FAR FIELD, EFFECT OF SPREADING IS SUBTRACTED
FAR FIELD (79 dBL. 70 dBA)
_L -i i i i i i
102 103 104
1/3 OCTAVE BAND CENTER FREQUENCY, Hz
Figure 7. Attenuation of sound through and beyond the T-16 turboshaft engine test cell at MCAS Tustin.
Increasing the height of exhaust stack has been shown to be an effective means of reducing far-field noise levels (Lancey, 1997). The old "A" type test cells at MCAS Miramar and NAS Oceana were retrofitted with the T-10 secondary air intake, augmenter tube, and exhaust stack. Acoustic panels were then mounted around the top of the ramp to increase the height of the exhaust stack by 25 feet. These facilities are quieter than the T-10 test cells, as much as 10 dBA far field when testing an afterburning TF30 engine (Fadeley, 1994).
Many non-DoD test cells use vanes rather than a ramp in the exhaust stack. There is strong evidence that low frequency sound is generated by a ramp (Glass, 1986a; Schmidt, 1987; Fadeley, 1989; 1991). There is no indisputable evidence that turning vanes solve this problem. Glass (1986a) measured the sound below and above the turning vanes in the exhaust stack of the hush house at NAF Atsugi, noting an "actual increase in the lower frequency spectrum area" and concluding that "the vanes offer little acoustic benefit." In an early gas turbine noise study, the National Electrical Manufacturers Association (NEMA, 1964) concluded that a simple elbow is acoustically more effective, and that turning vanes "eliminate the attenuation that would otherwise be achieved." Conversely, a comparison of Figure 6 (the T-10 test cell has a ramp) and Figure 7 (the T-16 test cell has vanes) suggests that vanes do decrease the low frequency sound or, at least, are not a source.
Several simple flow restrictions have been or are being used to passively reduce test cell noise by changing the characteristics of the flow. The Naval Air Engineering Center installed a "sawtooth" perpendicular to the flow at the top of the exhaust stack of the T-10 test cell at NAS Lemoore as a barrier to low frequency noise (Croce, 1990). The device is shown in Figure 8. The theory is that the jagged edges reduce noise by spawning random sound waves - which

cancel rather than reinforce each other in the manner of waves diffracted along a straight edge (Klingner, 1996). The results were promising. The dominant frequencies far field were shifted from low to mid-band. Overall there was a 7-dBA reduction in noise directly behind the test cell when testing an afterburning F404 engine. The effectiveness of the sawtooth was noticeably less in the other directions.
Figure 8. Sawtooth installed at the top of the exhaust stack of the T-10 test call at NAS Lemoore.
Sponsons are installed on the RAF hush houses located in Markham, England (Glass, 1986a) and on the hush house used to test the engines of the supersonic Concorde. Some of the old Navy water-cooled test cells were equipped with sponsons. Often referred to as "core busters," these devices are pipes, normally water cooled, that protrude into the jet as close to the nozzle as practical. Most of the high intensity, low frequency noise emitted by the test facility is generated downstream from the jet nozzle by vortices formed by the shearing action of the jet. Sponsons decrease the low frequency noise generated in the jet by stopping the formation of these vortices. A sponson installed at the entrance to the augmenter tube of the Concorde hush house in England is shown in Figure 9. The efficiency of these sponsons has not been documented.
Rectifier tubes are installed inside the augmenter tubes of the hush houses at NAF Atsugi and MC AS Iwakuni (Glass, 1986a). These tubes are approximately 2 feet in diameter and they fill up the downstream third of the augmenter. Their function is to limit the wavelength of the sound and thus the low frequency noise. Figure 10 is a photograph of the augmenter tube of the hush house at the NAF Atsugi showing the rectifier tubes at the end. The acoustic performance of these facilities has not been documented, but Glass (1986a) measured the sound at both ends of the tubes in the NAF Atsugi facility. He found only a "minimal" shift toward the higher frequencies, noting the "structural problems associated with impingement of the high temperature, high velocity airflow." Similar tubes have been installed at the top of the exhaust stacks of several older Japanese hush houses (Kobayashi, 1975) and on the exhaust stacks of General Electric's jet engine test cells at Strother Field, Arkansas City, Kansas (Dickman, 1984).

Figure 9. "Core busters" installed at the entrance to the augmenter tube of a Concorde hush house.
Figure 10. Rectifier tubes installed at the end of the augmenter tube of the hush house at NAF Atsugi.
10

Tuned low frequency resonating cavities are installed inside the top of the exhaust stack of the engine test facility at the Fiat plant, Brindisi, Italy, tuned to a frequency of 35 Hz (Glass, 1986a). In theory, the oscillating mass into and out of these cavities works against the acoustic pressure fluctuations in the JETC gas flow (Sullivan, 1978). The acoustic performance of this facility has not been documented. Silbernagel (1986) suggests that resonators attenuate sound over too narrow a frequency range to satisfy jet engine test cell requirements.
The only external passive method of reducing test facility noise that has been applied is the use of acoustic barriers. A 16-foot high acoustic wall surrounds the T-64 turboshaft engine test stand at the MCAS Miramar. The Naval Air Engineering Center, Lakehurst, New Jersey installed a barrier constructed of 1/2-inch aspenite board alongside the T-58 test stand at the NAS Patuxent River. They achieved a 9-dBA reduction at a distance of 250 feet with a barrier about 12 feet high (Sule and VanSuetendael, 1985a; 1985b). The engine was running at military power. Sound attenuation was predominantly at the higher frequencies.
Three demonstrations of active JETC noise control have been conducted. The concept is to use secondary acoustic sources such as loudspeakers to generate an "anti-sound" that destructively interferes with the test cell noise (Smith, 1996). Thus the loudspeakers serve to "cancel" the noise generated by the JETC. The first test of active test cell noise control was conducted by the Naval Civil Engineering Laboratory in 1992 on the T-10 test cell at NAS Lemoore (Becker, 1993). The microphones and speakers were located behind the top of the exhaust stack. Based on far-field measurements, the active noise control system did not reduce jet engine noise levels generated during any of the engine tests. More recently, the development of two other active noise control systems was funded by the Air Force. BBN Technologies developed a system that would replace one or two of the augmenter tube sections containing the acoustic pillows. This system was only tested on a 1:4 scale model of a test cell. The results were favorable: an 8-dB to 15-dB reduction of low frequency noise in the 8- to 80-Hz range (Ver and Dignan, 1994). Concurrently, Wylie Laboratories developed a system to provide low frequency noise attenuation over a localized area. The system is installed in the vicinity of the area to be protected. It was demonstrated on a test cell at Virginia Polytechnic Institute and State University (Smith, 1996) and on a USAF hush house, achieving up to an 8-dB noise reduction over the 10- to 50-Hz bandwidth and covering an area of about an acre.
PASSIVE NOISE REDUCTION
Passive noise reduction has the dual advantages of low cost and simplicity. In addition, it has minimal effect on the aerothermal performance of the test cell. Methods that attack the noise problem from outside and methods that attack the problem from inside the test cell both show promise.
External passive methods refer to barriers, both natural and man-made. Trees, shrubs, and ground cover are natural barriers to noise. Vegetation is not an extremely efficient means of suppressing sound, however, and the planting of trees and shrubs for noise control is rarely considered. Estimates on the effectiveness of vegetation vary. The Connecticut Department of Transportation detected a 5-to IO-OBA reduction in vehicle generated noise through a 100-foot
11

wide strip of dense evergreen vegetation (Klingner, 1996). But the Handbook of Noise Control (Piercy and Embleton, 1979) recommends assuming a 10-dB decrease in sound pressure level at 300 yards when the sound passes through thick vegetation.
Buildings, fences, and other man-made barriers also attenuate noise. For example, fences along major highways are a common method of decreasing traffic noise reaching adjacent residences. Here also, 5- to 10-dB reductions in sound pressure level are typical (Sutherland and Daigle, 1998). Man-made barriers, and also vegetation, attenuate primarily higher frequency noise.
Nevertheless, for several reasons, external barriers may be the solution to some JETC noise emissions problems. First, a 10-dB decrease in sound pressure level at 100 feet from the source may be good enough. To the human ear, this would appear to be about half as loud. A reduction in total SPL of even 6 dB is a major achievement when it is considered that such a decrease reduces the area exposed to a specific noise level by one-half (von Gierke, 1957). Second, the sound emitted by a JETC is specular, with maximum intensity in the direction aft of the exhaust stack (Glass, 1985a: 1985b). Test cells will not have to be surrounded by barriers; barriers can be located strategically. Finally, the sound generated by a JETC is spectral, emitting the most noise at particular frequencies. Perhaps barriers can be selected/designed/located to attenuate noise generated at the most psychologically and physiologically damaging frequencies. It will perhaps be possible to improve on the generic 10-dB sound attenuation.
The success of the "sawtooth" at NAS Lemoore encourages the systematic re- examination of simple inexpensive internal modifications to passively decrease test cell noise emissions. An ordinary metal shield that reduces JETC noise by 7 dBA certainly should be classified as promising. Other existing modifications, such as core busters and rectifier tubes, are based on valid principles and should be evaluated, this time with their effectiveness documented.
ASSESSING METHODS OF REDUCING JETC NOISE
The efficiency of the different methods postulated for test cell passive noise reduction will be appraised using combinations of measurements acquired directly from several test facilities and measurements of noise emitted from a 1/20* scale physical model of the Navy's standard T-10 test cell. Although test cells will be emphasized, hush houses and test stands will also be studied when the results are pertinent.
JETC Physical Model (Rig)
A 1/20* scale physical model of the Navy's T-10 test cell was constructed at the Naval Facilities Engineering Service Center (NFESC) to evaluate different emissions reduction technologies. This rig models the test bay (run room), secondary air intake, augmenter tube, and exhaust stack. The front of the test bay is open; the insulated duct supplying air to the jet passes through this section. With a 1/20* scale, the rig is about 10 feet long and the augmenter tube is 8 inches in diameter. Figure 11 is a photograph of the physical model. It is shown schematically in Figure 12.
12

Figure 11. NFESC's 1/20* scale physical model of the Navy's T-10 jet engine test cell.
Exhaust Ramp
Jet c
1foot SIDE VIEW
Figure 12. Schematic of the NFESC physical model of the Navy's standard T-l 0 jet engine test cell.
13

The hot jet is provided by a natural gas burner developed by the Naval Civil Engineering Laboratory (now NFESC) to simulate a jet impinging on concrete airfield pavements (Hironaka and Malvar, 1996). The air blower supplying the burner has a capacity of about 0.5 lb/sec. At 1,150°F, this flow will choke the jet nozzle. The gas velocity and temperature under these conditions are equal to the nozzle velocity and temperature of the TF30 engine operating at military power. This is the upper limit of the rig. Lower engine power settings can be simulated by decreasing the burner temperature and flow rates. Cooper (1996) describes the burner and associated plumbing in detail in his report. The physical model is described in detail in the appendix.
This facility is equipped with instrumentation sufficient for a complete mapping of gas temperatures and velocities. Sampling ports are tapped at four locations along the augmenter tube, both horizontally and vertically. Thermocouples and pitot tubes are inserted through these ports and, by changing their radial position, used to determine temperature and velocity profiles as the gases proceed down the tube. A programmable moving probe is mounted on the top of the exhaust stack. The probe is used to map temperatures and velocities of the hot gases exiting the test facility.
The test bay and secondary air intake are lined with acoustic material. Unlike the T-10, the rig does not have sound absorbing material in the exhaust stack and the augmenter tube is not lined with acoustic pillows, both of which attenuate the higher frequency noise. Therefore, the frequency at which the sound pressure level peaks is shifted toward the higher end of the spectrum. The jet nozzle is also much smaller - 1.37-inch diameter compared with the 2-foot diameter nozzle of the TF30 operating at military power
Figure 13 is a schematic of the vicinity of the physical model. The entire region is paved. There is a building directly behind the rig and another building along the starboard side about 10 feet away. The air blower is located behind these buildings. An 8-foot high concrete block wall runs along the port side of the rig at a distance of about 25 feet.
With these glaring insertion effects, the existence of a far-field environment must be verified. The 1/3 octave sound pressure levels measured at different locations around the rig are compared in Figure 14. The rig is simulating an engine test at military power. The region directly aft of the "test cell" is the only region free of walls or buildings at a distance that might be considered far field. The tones shown at several frequencies in Figure 14 suggest the influence of obstacles. Weather effects may not be adequately accounted for in the rig results. For example, a strong wind blowing through the rig test area produces an intense low frequency sound, < 63 Hz.
Sound Data Acquisition
Sound pressure time history signals were collected with a Bruel & Kjaer Model 2230 Precision Integrating Sound Level Meter fitted with a 1/2-inch Type 4155 pre-polarized condenser microphone. The meter was horizontally mounted on a 3-foot tripod for all tests. The meter was fitted with a 3-inch diameter windscreen and pointed at the exhaust plane of the jet. Data were recorded with the sound level meter in the "linear" response mode from the "AC out" jack to Channel A of a Sony Digital Audio Tape (DAT) Recorder, Model TCD-D8. A 1-kHz 93.8 dB tone from a Bruel & Kjaer Sound Level Calibrator, Type 4230, was recorded on each tape before and after each test sequence to calibrate the analyzer.
14

Machine r
Pos 9 o 3'-0.068" 111.3dB
1
Poi8
ff-5.212"
Pos 6 O
112.5 dB
110.2 dB
Pob5
o I I 112.6 dB
I.
■ AftCracI Scrap Material
Pos 7 o
109.4 dB
Pos 4 o
111.2 dB
Center Crack
n I
Pos 3 o
118.1 dB
Mid Crack
50598 Sound Level Measurements
17-6.984"
110.8 dB
Test Cell
Jet
Pos2 O
3' -4.075"
Pos1 O
110.1 dB
T Fvwl Crack
Figure 13. Plan view of the vicinity of the NFESC test cell model.
15

100
10 16 31.5 63 125 250 500 1000 2000 4000 8000 16000 1/3 Octave Band Center Frequencies, Hz
Figure 14. Sound pressure levels measured in the vicinity of the test cell physical model while simulating an engine running at military power.
The tape recorded signals were played back by a Sony Model 75-ES Digital Audio Tape Deck studio DAT recorder/playback unit and fed into an MTS/DSP Technology Siglab Model 20-22A Signal Analyzer. During playback, the sound signal was aurally monitored with headphones to assure no distortion or discontinuities were analyzed. The FFT-based 1/3 octave analysis was performed by DSPT VTO One Third Octave Acoustic Analysis Software. Overall linear and A-weighting (which emphasizes frequencies that humans consider the loudest) were computed during analysis. The analyzer and software are MATLAB based for convenient plotting and archiving on a personal computer. MATLAB was used to prepare the plots for the report.
Correlation Between Rig and JETC Noise
An empirical correlation is available for extrapolating from rig jet noise generation to the actual JETC. The effect of nozzle diameter on the noise spectrum can be described mathematically by ratioing the Strouhal number, Nst,
Nst^fpd/U
where fP is the frequency at which the sound pressure level (SPL) is maximum and d and U are the jet diameter and velocity, respectively. The Strouhal number is roughly constant for a given jet temperature and jet orientation (Bies, 1988; Howe, 1992). The rig and JETC nozzle temperature and gas velocity are the same. It follows that the rig noise spectrum is shifted away
16

from the JETC spectrum, toward the higher frequencies, by a factor of about seventeen, the ratio of the jet diameters. Plotted on parallel scales shifted from each other by a factor of seventeen, rig and T-10 sound spectra should coincide. Figure 15 is such a plot, comparing the 1/3 octave spectrum of the test rig and the T-10 JETC at NAS Oceana (Fadeley, 1991) when testing the TF30 at military power. The peak SPLs differ by about an octave band. The rig peak SPL is higher, probably attributable to the lack of sound absorbing material in the augmenter tube and exhaust stack.
too
m 80 ■D
_T UJ > UJ
ID 60 CC
CO CO UJ
£40 Q 2
o CO
O 20
NOTES:
(1) TF30 AT MILITARY POWER
(2) MEASURED DIRECTLY AFT (180 DEG)
(3) T-10 AT 250 FT; RIG AT 15 FT
JETC 1/3 OCTAVE BAND CENTER FREQUENCY (HZ)
_L _L _!_ 31.5 JL 125 250 500 IK 2.K
80
no •o
UJ 60 >
UJ
cr CO
,„ to 40 UJ
IT CL Q Z
20 CO
UJ
31.5 63 125 250 500 1K 2K 4K 8K 16K
RIG 1/3 OCTAVE BAND CENTER FREQUENCY, Hz
Figure 15. Comparison of the T-10 test cell noise spectrum with noise generated by the NFESC test cell model.
This frequency shift must be accounted for when using the test cell rig to assess passive noise reduction modifications that directly interact with the jet plume. Core busters and rectifier tubes certainly fall in this category. For example, modifications made with the goal of reducing JETC low frequency noise, i.e., <100 Hz, must be tested on the rig for their ability to reduce noise in the 1- to 2-kHz range.
Increasing the height of the exhaust stack changes test cell noise emissions by several mechanisms, and a relationship for extrapolating the effect of stack height on sound emitted by the NFESC model to sound emitted by an actual test cell cannot be acquired from the technical literature. It can be deduced from sound measurements, however. An old "A" type test cell at MC AS Miramar was retrofitted with the T-10 configuration except that it was equipped with a high exhaust stack. Thus, the effect of a high stack on the NFESC test cell model can be directly compared with the effect on the T-10 JETC. It was found that the change in far-field overall SPL measured around the model was approximately the same as measured around the T-10. The frequency at which most of the attenuation occurred was shifted from around 2,000 Hz on the model to around 100 Hz on the T-10 test cell, i.e., stack extensions decreasing 2,000 Hz sound
17
emissions from the rig would decrease 100 Hz sound emissions from the T-10 test cell. This is about the same ratio of test cell dimensions used to correlate modifications interacting with the jet.
A relationship for extrapolating the effect of the exhaust stack configuration on sound emitted by the NFESC model to sound emitted by an actual test cell is also not available in the literature. There are no T-10 or any other test cell data comparing the acoustical performance of different exhaust stack configurations that can be used to deduce a correlation. The ratio of cell dimensions, valid for the other noise reduction modifications examined, will also be used to extrapolate the acoustical performance of the rig exhaust stack configuration to the performance of the JETC stack configuration.
DEVELOPMENT OF SOUND THROUGH AND BEYOND THE TEST CELL
The sound generated by the test engine includes contributions from sources inside the engine such as combustion and turbine noise, but the principal noise is generated outside the nozzle in the mixing region of the high-velocity jet and surrounding air (von Gierke, 1957). At full power, this aerodynamic jet noise outweighs, by far, all other sources and is responsible for the jet engine noise problem. Tests have shown that higher frequency sound is generated by the small-scale turbulence in the heavily sheared mixing region within a few nozzle diameters downstream from the nozzle. The low frequency sound is generated by the more nearly isotropic turbulence further downstream in the core of the jet, at a distance of from 5 to 20 diameters downstream from the nozzle (Porges, 1987). Thus, low frequency noise is being generated inside the secondary intake stack and part way along the augmenter tube of most jet engine test facilities.
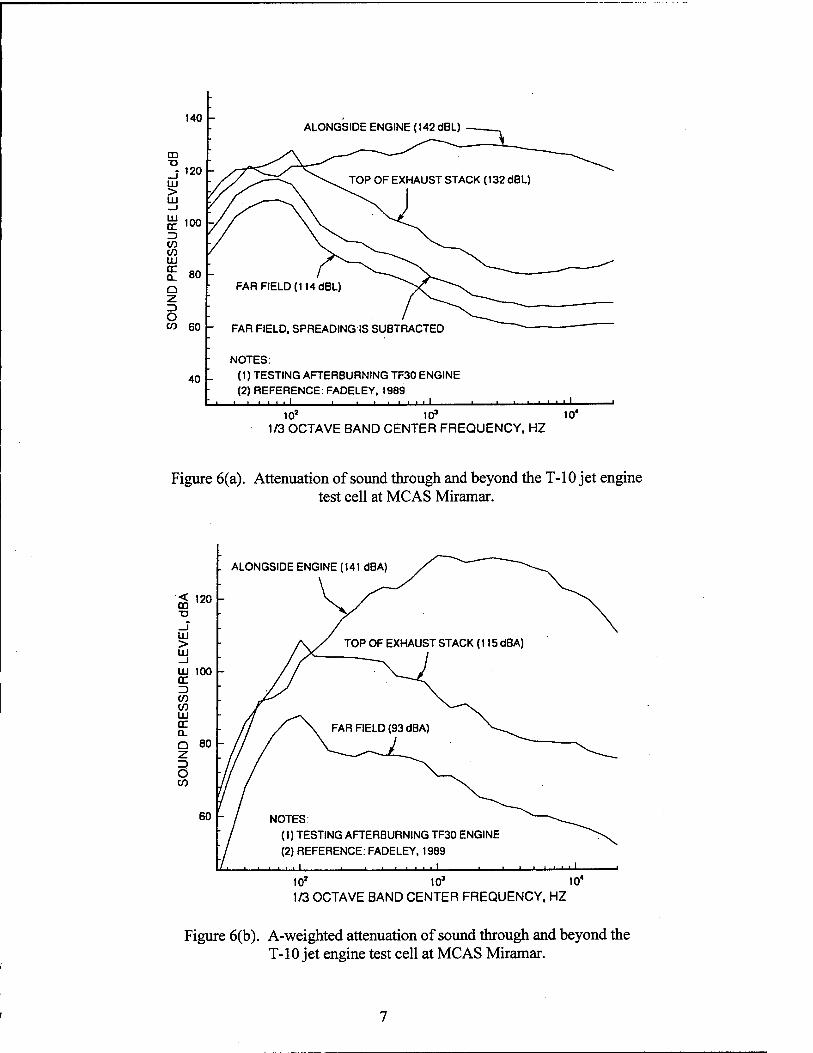
Concurrently, noise is being attenuated at all frequencies along the augmenter tube by the acoustic pillows and by interference as the sound is reflected off the walls of the tube. Sound pressure levels were measured along the test cell rig while simulating an engine test at military power. The results are shown in Figure 16. The parameter is the location of the microphone, alongside the jet and alongside the instrumentation port at the end of the augmenter tube. The tube is reducing the low and mid-frequency sound. Recall that the rig augmenter tube is not insulated. A similar characteristic was observed by Glass (1986a; Glass, Castile and Gary, 1986) on test cells and hush houses at NAS Lemoore, NAS Patuxent River, and NAS Jacksonville. The measurements in the NAS Jacksonville hush house, shown in Figure 17, are particularly enlightening. Sound pressure levels were measured at two locations along the augmenter tube. Noise was reduced by more than 20 dB at all frequencies.
18

10 16 31.5 63 125 250 500 1000 2000 4000 8000 16000 1/3 Octave Band Center Frequencies, Hz
Figure 16. Sound pressure levels measured along the NFESC physical model while simulating a TF30 test at military power.
140
_ 120 - m a. a. 8
§ ft 100 - w > £ o «3
80 -
60
F-18 (1 ENG MAX A/B) BO-ft SOFT, OBROUND AUOMENTER AND SHORT STACK WITH RAMP
57 ft DOWNSTREAM OF AUGMENTER BELLMOUTH (F-18 MAX A/B)
TOP OF EXHAUST STACK / {F-1B MAX A/B)
60 1» 200 500 FREQUENCY (Hz)
IK 2K 5K 10K
Figure 17. Noise levels inside NARF hush house at NAS Jacksonville (Glass, 1986a).
19

The exhaust stack had a major effect on the frequencies of sound emitted by the facility. A microphone was also placed alongside the top of the exhaust ramp of the rig. The overall SPL was slightly higher at the top of the stack than at the end of the augmenter tube. Most significant, the noise was generated at the lower frequencies. As observed by Glass, Castile, and Gary (1986), "correlated low frequency noise comes from the vicinity of the exhaust stack." Figure 17 also includes SPLs measured at the top of the exhaust stack of the NAS Jacksonville hush house. The exhaust stack had only a small effect overall, but there was a major shift from high to low frequencies. This exhaust stack has a ramp. Perhaps the sound absorbing material in the stack was attenuating the higher frequency sound while, simultaneously, the ramp was generating low frequency sound?
There is little reduction of test cell sound emissions out to the 250-foot far field not attributable to the increased distance. Although local effects caused by weather and terrain are common, their influence is usually minor. The spectra shown in Figure 6(a) are typical of all test facilities. At most, some facilities might show a greater attenuation at the higher frequencies; NAS Cubi Point is an example (Schmidt, 1987).
REDUCTION OF TEST CELL NOISE
Results of the tests to determine the effectiveness of passive methods of decreasing jet engine test cell noise emissions are presented.
Vegetation
The type of environment most effective at reducing noise varies with the frequency of the noise. There are three different phenomena occurring simultaneously (Aylor, 1971; Piercy and Embleton, 1979; Fricke, 1984). The attenuation of low frequency sound is due predominately to the interference between direct and ground reflected sound. For middle frequencies, attenuation is due to scattering by the trees and by air turbulence. For high frequency sound, absorption takes over as the dominant attenuation phenomenon.
The effect of vegetation on JETC noise emissions was measured through the copse adjacent to the T-10 test cell at the NAS Oceana. The wooded area starts about 100 feet from the port quarter of the facility as shown in Figure 18. The woods is a mixture of evergreen and deciduous trees, some brush, and has a relatively thick ground cover composed of both grasses and fallen leaves. Figure 19 is a photograph of the region in early September when the measurements were taken.
Noise reduction attributable to the woods was determined by measuring sound pressure levels at two locations and subtracting the spreading loss attributable to the increase in distance from the noise source. The F110 engine is being tested at military power. The results are summarized in Table 1.
The results vary depending upon location and on the source of the noise, from the engine exhaust nozzle or from the top of the test cell exhaust stack. The assumption that the sound is emanating from the exhaust stack is the most reasonable, albeit there is probably no single point source. Regardless, the attenuation of the noise emitted by the T-10 JETC at NAS Oceana is, at most, only a few dB per 100 feet of vegetation.
20

r»r CELL Mtiowa
xuuc oo
JtmnaiD nupn «It
Figure 18. Plan view of the T-10 jet engine test cell at NAS Oceana showing the location of the wooded area.
21

~-T-*-><j'-<i- ;vS-'.
s«$^>^:#^w;:..
Figure 19. The vegetation adjacent to the T-10 test cell at NAS Oceana in September.
Table 1. Attenuation of NAS Oceana T-10 JETC Noise Emissions by Adjacent Woods
Assume sound emitted from engine exhaust nozzle:
Compare SPL at Yellow Pipes and Pole #1; Wooded distance = 109 feet Expected spreading loss = 5 dB Measured loss =9.41dBA (8.0 dBL)
Compare estimated halfway and Pole #2; Wooded distance = 179 feet Expected spreading loss = 7.2 dB Measured loss = 10.32 dBA (8.0 dBL)
Compare Metal Stake and Pole #3; Wooded distance = 284 feet Expected spreading loss = 9.5 dB Measured loss =13.5 dBA (8.3 dBL)
Assume sound emitted from test cell exhaust stack:
Compare Yellow Pipes and Pole #1; Wooded distance = 109 feet Expected spreading loss = 7.5 dB Measured loss = 9.41 dBA (8.0 dBL)
Compare Yellow Pipes and Pole #2; Wooded distance = 188 feet Expected spreading loss = 10.7 dB Measured loss =11.8 dBA (10.6 dBL)
Compare Yellow Pipes and Pole #3; Wooded distance = 310 feet Expected spreading loss = 13.0 dB Measured loss =16.5 dBA (13.5 dBL)
22

A plot of sound attenuation versus frequency is enlightening. Figures 20 and 21 show the effect of 100 feet and 300 feet of woods, respectively. They assume the sound emanates from the exhaust stack. The curve is the measured decrease in sound between two locations in the woods. The decrease in noise due to spreading is included as a horizontal line. Therefore, the distance between the two lines is the sound attenuated by the trees and ground cover. It is apparent from both plots that the attenuation of the test cell noise by the woods occurs primarily at two frequencies, in the low frequency band at around 125 Hz and in the high frequency band at around 8 kHz. There is little effect at mid-band frequencies.
Artificial Barriers
The effect of man-made barriers to noise generated by test cells was assessed using the NFESC test cell model. Sound barriers were constructed by covering 3/8-inch plywood with 2- inch thick convoluted acoustical foam. These barriers are 8 feet high and mounted at angle of about 30 degrees back from the vertical. Figure 22 is a photograph of these barriers. The test facility is also located alongside an 8-foot high, 8-inch thick concrete block wall shown in the background in Figure 22. The blocks are not solid throughout but contain 4-inch cavities. Figure 23 is a sketch showing the test rig layout, the locations of the barriers and the wall, and the locations of the sound measurements.
Typical measured noise levels have been included in Figure 23. The noise generated by the rig, about 121 dB in front of the barrier, was decreased to about 100 dB by the barrier and down to 80 dB by the concrete wall. On the far side of the wall, overall sound pressure levels slowly increased, reaching 88 dB in about another 30 feet, before beginning to decrease again. Figure 24 is a plot of sound pressure level versus distance from the jet. The "shadow zone" formed behind the block wall is apparent. The subsequent increase in SPL beyond the wall is attributable to sound diffusing over this barrier. Also plotted on this figure is the decrease in SPL attributable to spreading of the acoustic energy with distance from the source. The difference between these two curves when they become parallel is the decrease in noise attributable primarily to absorption by the barrier and the wall.
Figure 25 is a plot of sound pressure levels versus 1/3 octave frequencies at locations on each side of the acoustical foam barrier. Most of the attenuation occurs at the higher frequencies although there is significant reduction at all frequencies. Figure 26 is a spectral plot showing the influence of the block wall. Again, the attenuation, absorption plus insertion, occurs primarily at the higher frequencies, but, again, there is some sound reduction at all frequencies.
23

40
o ü o Q. X o g 30
c
£ 20 a a.
i S
I 10 CM <D
m T3
a! 0 (A
?! UJ Q
-10
Note: The Fl 10 engine is being tested at military power;
Measured decrease in sound pressure level
u
mm^ .Decrease, in sound pressure, level, due to spreading
10 16 31.5 63 125 250 500 1000 2000 4000 8000 16000 Octave Frequencies, Hz
Figure 20. The decrease in sound through 100 feet of the woods adjacent to the T-10 test cell atNAS Oceana.
40 -o <g u &
55 20 «f a.
i 2 .o
o 10 CM
£ m
i 0
UJ a -10
Nöte: The Fl 10 engine is being tested at military power.
HMt=
Measured decrease in sound pressure ievel
Decrease in sound pressure level due to spreading
10 16 31.5 63 125 250 500 1000 2000 4000 8000 16000 Octave Frequencies, Hz
Figure 21. The decrease in sound through 300 feet of the woods adjacent to the T-10 test cell at NAS Oceana.
24

Figure 22. Convoluted foam acoustic barriers constructed alongside NFESC test cell physical model. The concrete block wall is in the background.
ilffacMoej
Pos 9 o
POS 8
Tl10.7dB
9' 5.2"
Misc Material
Pos 7 o
104.2 dB
Pos 6 Pos 5
1°07.9dB f ! 113.3 dB
Pos4 =:
104.9 dB S
Barrier Floor Position
17' 7.5"
103.8 dB ■ j,Pos2 I
!?«" J
CM; *-
P-: *". P0S1
104.2 dB
7/6/98 SOUND LEVEL MEASUREMENTS
5ft 10ft O C-
80.8 dB 82.7 dB
20 ft e - ■■ ■
84.7 dB
30 ft - -■ -o
80.2 dB
Figure 23. Plan view of the NFESC test cell layout. The locations and numbering system used to record SPL are also shown along with typical dB values at each location.
25

140 r
80 -
70
— 130 _i
m T3
Lu 120 - r\ > i \ l±J i ^ _l i LU i £E 110 - i D i W i W ■ i UJ • i^" 0C 100 0. 1
a 1
z D O 90 w
SPLAT EXHAUST STACK
NOTES:
(1) NOZZLE TEMP = 1150 DEGF
(2) NOZZLE VEL = 1880 FT/SEC
(3) AUGUST 31, 1998
EXPECTED DECAY DUE TO SPREADING
Xr-
MEASUREDSPL PROJECTED ACTUAL DECAY
---o- -o o
i—CONCRETE BLOCK WALL
- 2" ACOUSTIC FOAM BARRIER
20 40 60 80
DISTANCE FROM EXHAUST STACK, FEET
I
100
Figure 24. The decrease in sound pressure levels with distance in the vicinity of the NFESC test cell model.
120
110 « Q.
I O b I o CM
£ m ■o
100
90
80
0-
c 3 o w
70
60
50
-1L
10 16 31.5 63 125 250 500 1000 2000 4000 8000 16000 1/3 Octave Frequencies, Hz
Figure 25. Change in 1/3 octave spectrum across the acoustical foam barrier.
26

100
31.5 63 125 250 500 1000 2000 4000 8000 16000 1/3 Octave Frequencies, Hz
Figure 26. Change in 1/3 octave spectrum across and beyond the NFESC concrete block wall.
Piercy and Daigle (1991) provide an empirical relationship for the insertion loss of a thin barrier for sound with wavelength X,
ILbarrier=101og[3+10N]
where N is the Fresnel number,
N = (2/X)[di+d2-d]
and di is the distance from the source to the top of the barrier, d2 is the distance from the top of the barrier to the receiver, and d is the straight-line distance between the source and the receiver of the sound. Geometric spreading, atmospheric effects, and absorption by the barrier are being neglected. Applying this relationship, the expected loss across the block wall would be 11.43 dB at 63 Hz and 28.45 dB at 4 kHz. These losses agree with the measured values 5 feet beyond the block wall shown on Figure 26.
Also shown in this figure are 1/3 octave sound pressure levels at locations 20 and 60 feet beyond the wall. The noise is gradually increasing with distance, a trend previously shown in Figure 24. These characteristics are expected. The wall absorbs primarily the high frequency sound. The spectrum 5 feet from the wall, therefore, shows a large reduction in high frequency sound. Sound also defracts over the top of the wall. As summarized by the algebraic relationships above, the attenuation by diffraction is directly proportional to frequency and inversely proportional to the distance to the source. Put another way, the distance that this indirect sound travels before again "reaching the ground" is proportional to its wavelength. The
27

shorter wavelength sound arrives closer to the wall; hence the increase in high frequency noise in the first 20 feet. A 30-foot shadow zone implies a minimum frequency of about 38 Hz which, re- examining Figure 26, appears reasonable.
A 16-foot high acoustic wall surrounds the T-64 turboshaft engine test stand at MCAS Miramar. The wall is constructed of 22-gauge perforated steel plate on the inside, 6 inches of absorbing material, and 16-gauge rolled steel on the outside. Figure 27 shows the test stand with the engine in place. The engine exhausts into a short square uninsulated duct that diverts the flow to a vertical direction. Figure 28 is a plan view of this facility. Also shown in this figure are A-weighted sound pressure levels measured while the T-64 was being tested at full power. The region behind the test stand where the far-field sound pressure levels were measured is plowed up rocky soil covered with weeds and low brush. There are no trees. There is a 22-dB decrease in SPL across the wall. The SPL further decreases down to about 92 dBL (92 dBA) at a distance of 250 feet behind the engine, 7 dBA higher than the Navy far-field limit. The attenuation of engine noise across the wall and across the field beyond is plotted in Figure 29. Also shown in this figure is the decrease in sound energy due to increased distance from its source. The difference between these two curves is the attenuation provided by the acoustic wall. The shadow zone is not as pronounced as the zone beyond the NFESC block wall but extends for about 200 feet; the T-64 wall is higher and the peak frequency is lower. Beyond the shadow zone, the T-64 wall decreases sound pressure level by only 6 dB more than the normal decay due to spreading.
Figure 27. The T-64 turboshaft engine test stand at MCAS Miramar is enclosed within acoustic walls.
28

L
Grass Field
° 21 (95.9) °20(94.0dBA)
Paved Road
T-64 Engine
Dirt Field
(121.4) v °4 °5
\] (126.1 dE A)
019.2), " (93.3)^
j-10
\n (94.2 dBA)
■ fl2
° 19 (92.4)
Acoustic Wall
Parking Lot
°18 (88.2 dBA)
13 (93.9)
fi4 (94.3)
jis (93.6 dBA)
?16 (92.3)
47 (90.1)
Figure 28. Plan view of the T-64 test stand at MCAS Miramar.
29

130
120 DO ■o
t 2 2 (A CA
2 Q. ■o c o to
1
o c
110-
100
90
80
70
v - Expected SPL decay due tospreading
Data collected at MCAS Miramar, 11/04/99
50 100 150 200 250 Distance from Engine, Ft. Note Wall is at 20 ft.
300 350
Figure 29. The decrease in sound pressure levels across and beyond the acoustic wall surrounding the T-64 test stand at the MCAS Miramar.
Figure 30 is a plot of sound pressure levels versus 1/3 octave frequencies at locations on each side of the acoustic wall and at a distance of about 210 feet beyond the wall. As with both the NFESC acoustic foam and block walls, the attenuation of sound generated by the jet, absorption plus insertion, occurs primarily at the higher frequencies, but, again, there is some sound reduction at all frequencies. The increase in high frequency sound with increasing distance from the acoustic wall is apparent - another characteristic observed at NFESC. The sharp decrease in sound at the middle frequencies, from 125 to about 1,000 Hz, was not observed at NFESC. The distances are much greater. There was very little wind. Perhaps this phenomenon is attributable to reflection and interference caused by the very rough ground?
Sawtooth
Several sawtooth configurations were manufactured and installed at the top of the exhaust stack of the NFESC rig, perpendicular to the ramp. The first sawtooth tested was scaled from the random edge sawtooth that worked so well on the T-10 at NAS Lemoore, i.e., 1/20* the size of the original. The NAS Lemoore sawtooth is shown in Figure 8. A sawtooth with even teeth was also tested. The results were disappointing. Instead of the 7-dBA reduction in noise observed at NAS Lemoore, neither rig sawtooth decreased "far-field" noise by much more than 1 dB in any direction. Figure 31 compares the 1/3 octave spectrum of the rig with and without the NAS Lemoore style sawtooth. The sound was measured directly behind the facility. Smaller teeth, different spacing, and square teeth were all assessed. None of these configurations performed as well as the sawtooth scaled from the NAS Lemoore configuration.
30

120
10 16 31.5 63 125 250 500 1000 2000 4000 8000 16000 1/3 Octave Band Center Frequencies, Hz
Figure 30. Change in 1/3 octave spectrum across and beyond the T-64 test stand acoustical wall.
110
a a-100
1 E s s
CD •o c
90
3 S 80 3
S> 70
60
Thick line, base line, 110.2 dB
Thin line, Lemoore Saw Tooth, 109.1
Data collected 3/3/99, Position S
10 16 31.5 63 125 250 500 1000 2000 4000 8000 16000 1/3 Octave Band Center Frequencies, Hz
Figure 31. The acoustic performance of the NAS Lemoore sawtooth installed on the NFESC jet engine test cell.
31
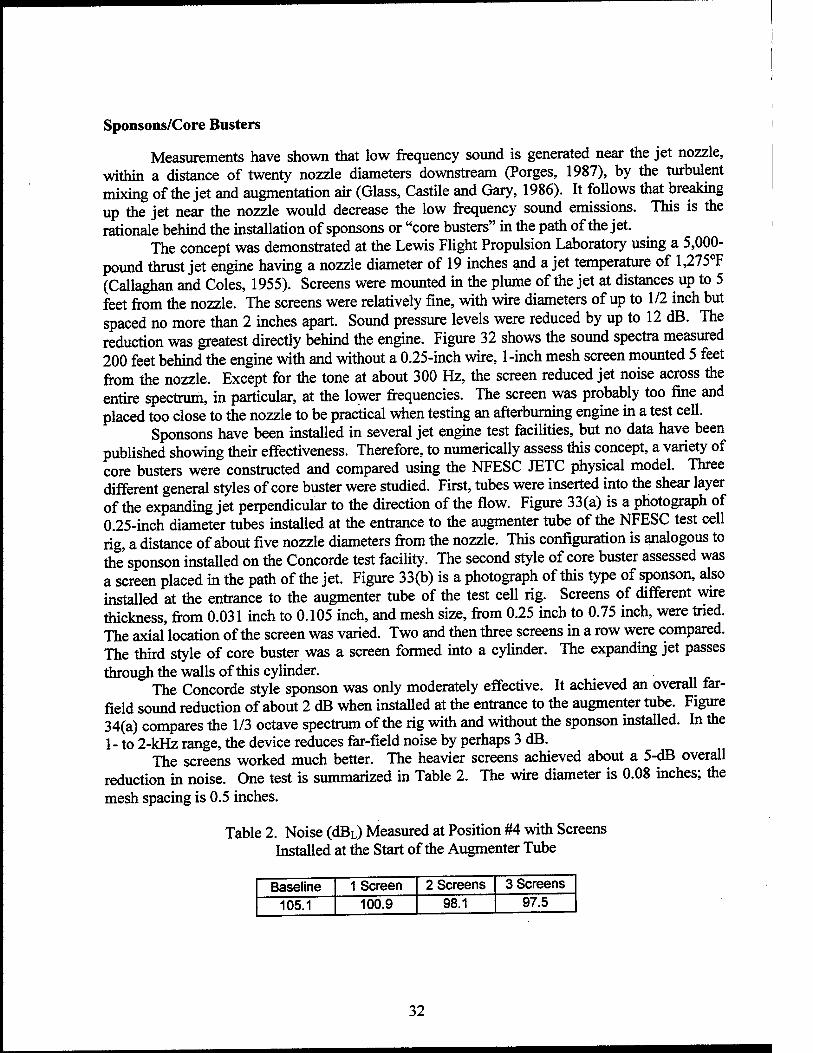
Sponsons/Core Busters
Measurements have shown that low frequency sound is generated near the jet nozzle, within a distance of twenty nozzle diameters downstream (Porges, 1987), by the turbulent mixing of the jet and augmentation air (Glass, Castile and Gary, 1986). It follows that breaking up the jet near the nozzle would decrease the low frequency sound emissions. This is the rationale behind the installation of sponsons or "core busters" in the path of the jet.
The concept was demonstrated at the Lewis Flight Propulsion Laboratory using a 5,000- pound thrust jet engine having a nozzle diameter of 19 inches and a jet temperature of 1,275°F (Callaghan and Coles, 1955). Screens were mounted in the plume of the jet at distances up to 5 feet from the nozzle. The screens were relatively fine, with wire diameters of up to 1/2 inch but spaced no more than 2 inches apart. Sound pressure levels were reduced by up to 12 dB. The reduction was greatest directly behind the engine. Figure 32 shows the sound spectra measured 200 feet behind the engine with and without a 0.25-inch wire, 1-inch mesh screen mounted 5 feet from the nozzle. Except for the tone at about 300 Hz, the screen reduced jet noise across the entire spectrum, in particular, at the lower frequencies. The screen was probably too fine and placed too close to the nozzle to be practical when testing an afterburning engine in a test cell.
Sponsons have been installed in several jet engine test facilities, but no data have been published showing their effectiveness. Therefore, to numerically assess this concept, a variety of core busters were constructed and compared using the NFESC JETC physical model. Three different general styles of core buster were studied. First, tubes were inserted into the shear layer of the expanding jet perpendicular to the direction of the flow. Figure 33(a) is a photograph of 0.25-inch diameter tubes installed at the entrance to the augmenter tube of the NFESC test cell rig, a distance of about five nozzle diameters from the nozzle. This configuration is analogous to the sponson installed on the Concorde test facility. The second style of core buster assessed was a screen placed in the path of the jet. Figure 33(b) is a photograph of this type of sponson, also installed at the entrance to the augmenter tube of the test cell rig. Screens of different wire thickness, from 0.031 inch to 0.105 inch, and mesh size, from 0.25 inch to 0.75 inch, were tried. The axial location of the screen was varied. Two and then three screens in a row were compared. The third style of core buster was a screen formed into a cylinder. The expanding jet passes through the walls of this cylinder.
The Concorde style sponson was only moderately effective. It achieved an overall far- field sound reduction of about 2 dB when installed at the entrance to the augmenter tube. Figure 34(a) compares the 1/3 octave spectrum of the rig with and without the sponson installed. In the 1- to 2-kHz range, the device reduces far-field noise by perhaps 3 dB.
The screens worked much better. The heavier screens achieved about a 5-dB overall reduction in noise. One test is summarized in Table 2. The wire diameter is 0.08 inches; the mesh spacing is 0.5 inches.
Table 2. Noise (dBL) Measured at Position #4 with Screens Installed at the Start of the Augmenter Tube
Baseline 1 Screen 2 Screens 3 Screens
105.1 100.9 98.1 97.5
32

Figure 34(b) is a plot of sound pressure levels versus 1/3 octave frequencies measured during this test. The screens decreased SPL by about 10 dB in the key 1- to 2-kHz frequency range. Recall that these frequencies correlate with the 100-Hz noise emitted from a T-10 jet engine test cell. Adding the second screen expands the frequency range over which the sponson is effective down to less than 500 Hz.
As would be expected, the acoustical performance of the cylinder was equivalent to the performance of the screen. A simple screen would appear to be preferable, however. It is less expensive and more adaptable to different engines.
100 r
90 m ■D
LU
5 80 _1
uu CC
W 7f) C/D /u
LU ec
Q g 60 O C/D
50
40
JET ENGINE WITHOUT SCREEN
SCREEN INSTALLED
NOTES:
;i) 5000 LB THRUST TURBOJET
(2) SCREEN 5 FT BEHIND NOZZLE
(3) 0.25" WIRE DIA, 1" SPACING
(4) REF: NACA TN 3452 (1955)
_l I I 1—1 I I L
10' 103 104
FREQUENCY, HZ
Figure 32. Reduction in jet noise by a screen placed in the jet plume.
33

[■ ;?■■ .-■':■ v:-"d!
Figure 33(a). Core buster installed at the entrance to the augmenter tube of the NFESC test cell model.
'■■'■«sSHPEta
Figure 33(b). Screen installed at the entrance to the augmenter tube of the NFESC test cell model to break up large scale turbulence.
34

110
«j a-100 p o E o CM
90 CD ■D
1 2 80 m «i o
T3 c 3 O 70
60
Thin line, Core Busier
Thick line, base line
Forward, 110.0
1.12.1 idB
Data collected 3/3/99, Position 5
10 16 31.5 63 125 250 500 1000 2000 4000 8000 18000 1/3 Octave Band Center Frequencies, Hz
Figure 34(a). The effect of Concorde style core buster on sound emitted by the NFESC jet engine test cell.
100
a a- 90
§ E 8 2 m ■o c
80
>
S 70 3 CO CO s 0. •D c 3
<8 60
50
i Thin Line: Base linej 105.1 idB Medium Line,: Single screen at tube front; 100.9 Thick Line, Two screens, 2nd 7" down from 1st,
Data collected 3/24/99, Position 4, Augmenter at 6"
IScreens: 015" mesh, 0.062" wire sens: 015" mesh, 0.062" wire
dB 98.1 dB
10 16 31.5 63 125 250 500 1000 2000 4000 8000 16000 1/3 Octave Band Center Frequencies, Hz
Figure 34(b). The effect of screens on sound emitted by the NFESC jet engine test cell model.
35

Rectifier Tubes
Two different rectifier tube bundles were tested on the NFESC JETC physical model. The concept of these tubes is to limit the wavelength of the sound, thus suppressing the low frequency noise. The first tube bundle was about 16 inches in length and was composed of 1.5- inch diameter tubes. This bundle was scaled from the NAF Atsugi rectifier tubes. The second tube bundle was the same length but was composed of 0.75-inch tubes. Figure 35(a) is a photograph of the two tube bundles. Figure 35(b) shows a tube bundle installed in the end of the augmenter tube of the NFESC model.
Figures 36(a) and (b) are 1/3 octave spectra of sound measured at Position #8 when the large and then the small diameter tubes were installed. Position #8 is about 25 feet directly aft of the exhaust stack (see Figure 23). Forward refers to the direction closest to the jet. Neither bundle was effective at shifting frequencies or at reducing test cell sound emissions. Rather than limiting wavelength, the small sound attenuation these tubes do induce is probably the result of some "core busting" plus some interference as the sound waves reflect off the tube walls. All configurations reduced noise slightly at the higher frequencies, 3,000 Hz and higher. The 1/3 octave spectra was similar to the spectra measured when core busters were installed. The small tubes placed at the beginning of the augmenter tube, in particular, showed this characteristic.
A tube would be more effective at reducing jet noise if it were placed closer to the jet nozzle. The generation of the turbulence in the jet mixing region, and thus the aerodynamic jet noise, is then inhibited by the walls of the single tube. The jet exiting the tube is much slower. In addition, noise is decreased by sound wave interference as the jet exhaust flows down the tube. Figure 37 is a 1/3 octave spectra plot showing the acoustic effectiveness of a tube added to the NFESC T-10 test facility. The tube is 2.5 inches in diameter and extends about half way down the augmenter tube. Recall that the jet nozzle is 1.37 inches in diameter. The inlet to this tube is about half a nozzle diameter downstream. Overall, the tube decreases test cell noise emissions by 5 dB measured at Position #8. It reduces noise by about 10 dB in the 1- to 8-kHz frequency range.
There are operational disadvantages to the single tube, however. The tube partially blocks the secondary air intake. It also delays mixing of the jet and augmentation air; high ramp temperatures may result. To avoid requiring a cooling water system, it must be wide enough to ingest a sufficient quantity of cool augmentation air. Thus, it will be sized for the most powerful engine being tested. If, in the future, larger engines are tested, a different tube will have to be installed. The concept is not practical for hush houses where the jet nozzle may be located at any of a number of positions. The single tube cannot be used with vector nozzles. If the tube is placed too close to the jet nozzle, high engine back pressures may be a problem.
Exhaust Stack Height
Increasing the height of the exhaust stack is a straightforward but not inexpensive method of decreasing test cell noise emissions. The decrease in noise is attributable to several phenomena: attenuation by the acoustic panels in the stack extension, changing the directivity of the noise from 45 degrees to a vertical direction, increasing the distance to the noise source, attenuation by wind at the higher altitude, and increasing the ground effects.
36

*m.
Figure 35(a). Two different rectifier tube bundles were tested using the NFESC model.
Figure 35(b). Rectifier tubes installed in the downstream end of the augmenter tube of the NFESC test cell model.
37

63 125 250 500 1000 2000 4000 8000 16000 1/3 Octave Band Center Frequencies, Hz
Figure 36(a). The effect of rectifier tubes and their location on sound emissions from the NFESC test cell. Large diameter tubes are used.
63 125 250 500 1000 2000 4000 8000 16000 1/3 Octave Band Center Frequencies, Hz
Figure 36(b). The effect of rectifier tubes and their location on sound emissions from the NFESC test cell. Small diameter tubes are used.
38

120
110 a
Q. I
§ g100
50
fleactor Tube, Position 8,2/15/00
Tube Diameter = 11.82 x Jet Diameter ; Tube Length ?= 28 x Jet Diameter
10 16 31.5 63 125 250 500 1000 2000 4000 8000 16000 1/3 Octave Band Center Frequencies, Hz
Figure 37. The effect of a single tube placed at the engine nozzle on Sound emissions from the NFESC test cell.
The computer program TCNOISE predicts a 7-dB decrease in far-field noise generated by an afterburning F414 in the T-10 JETC when the height of the stack is increased by 15 feet (Lancey, 1988; 1997).
The old "A" type test cells at MCAS Miramar and NAS Oceana were retrofitted with the T-10 secondary air intake, augmenter tube, and exhaust stack. Acoustic panels were then mounted around the top of the ramp to increase the height of the exhaust stack by 25 feet. These facilities are quieter than the T-10 test cells, as much as 10dBA far field when testing an afterburning TF30 engine (Fadeley, 1994). Although these retrofits do not exactly duplicate the T-10 test cells, the hot sections are the same. Figure 38 compares the far-field sound pressure levels measured behind the T-10 and the retrofitted "A" cell at MCAS Miramar. The total flow through the retrofit is slightly greater, 2,187 lb/sec compared with 2,012 lb/sec, when testing the afterburning TF30. These two facilities are located alongside each other so ground effects are identical. The data, however, were not taken at the same time. Note that the high exhaust stack is quieter at all frequencies, suggesting that the gain is attributable to more than attenuation by the additional acoustic insulation.
This concept was further examined using the NFESC test facility. Figure 39 is a photograph of the rig with a high exhaust stack installed. The extension was constructed of 12- inch long, 1-inch thick rigid mineral wool acoustic insulation board mounted around the top of the exhaust stack; this is equivalent to a 20-foot increase in the T-10 exhaust stack height. Figure 40 is a 1/3 octave plot comparing sound pressure levels measured 25 feet behind the rig with and without the high exhaust stack. The difference is significant, a 9 CIBL overall decrease in noise. The sound reduction is over both middle and high frequencies, from 250 Hz to 10 kHz, and maximum between 2 and 8 kHz.
39

120
110
100 CD •D
LU 90 > LU _l LU 80 CC
§70 LU CC
a 60 z
I50
40 -
30
T-10 TEST CELL (114 dBL, 93 dBA)
RETROFIT "A" CELL
WITH HIGH EXHAUST
STACK (108 dBL; 82 dBA)
NOTES: (1) AFTERBURNING TF30 ENGINE
(2) MEASURED 250 FT BEHIND CELL
102 103
1/3 OCTAVE BAND CENTER FREQUENCY
104
Figure 38. Effect of high exhaust stack on sound emissions from MCAS Miramar test facilities.
A comparison study was conducted using the rig to determine the importance of two of the mechanisms postulated for the effectiveness of the high exhaust stack, directivity and the additional sound insulation. Sound pressure levels were measured at four different locations with the exhaust stack configuration as a parameter. First, a baseline was established with the existing stack configuration. Then, a 1-foot insulated extension, a 1/2-foot insulated extension, similar uninsulated extensions, and finally, uninsulated extensions to the ramp, i.e., a vertical wall mounted at the top of the ramp, were added. The results are summarized in Table 3.
These tests suggest that the noise reduction is at least partially attributable to the extra acoustic insulation. It should be emphasized that the augmenter tube and ramp are not insulated; thus, acoustic insulation in the high stack has more effect than it would in an actual test cell. Directing the flow to a more vertical direction by adding an extension to the ramp had little effect. The rig tests show only the influence of the sound absorbing material and of directivity. A 1-foot stack extension cannot change the ground effects or the effect of the wind, both tending to influence lower frequency sound.
40

Figure 39. High exhaust stack added to NFESC test cell physical model.
120
110 to 0.
I 2 •§100 o CM
£ € 90 ,c "55 s
80 £ 3
Q- 70 c o W
60
50
—
| I | I | ! |
! !
! r-j—
i ! ■
: Low Stack : : : : : : 108.3dBL X I
=b
J-' ; : Lined:High Stack
Da ;a colle Cted 4/14/99 :
10 16 31.5 63 125 250 500 1000 2000 4000 8000 16000 1/3 Octave Band Center Frequencies, Hz
Figure 40. Effect of high exhaust stack on sound pressure levels measured 25 feet directly behind the NFESC test cell model.
41

Table 3. Noise (dBL) Measured in the Vicinity of the NFESC Emissions Test Rig While Varying the Exhaust Stack Configuration and Simulating
a TF30 Being Tested at Military Power
Exhaust Stack Configuration Location of Sound Measurement
#2 #4 #5 #8
Baseline 107.3 106.6 110.5 107.7 1 Ft Insulated Extension 102 97.8 101.5 99.2 V2 Ft Insulated Extension 104 100.3 104.8 102.6 1 Ft Uninsulated Extension 107.9 104.5 108.2 105.3 Vi Ft Uninsulated Extension 108.7 105.6 108.7 106.1 1 Ft Uninsul. Ramp Extension 107.8 105.1 108.6 106.2 V2 Ft Uninsul. Ramp Extension 108.3 105.3 109.4 106.8
Exhaust Stack Configuration
There is evidence that some low frequency sound is generated by the ramp in the test cell exhaust stack (Glass, 1986a: Schmidt, 1987; Fadeley, 1989; 1991). An obvious solution to test cell noise emissions problems, then, is to replace the ramp with a different configuration for diverting the flow to a vertical direction. Two alternative configurations are in common use. The first alternative to the exhaust stack ramp is the use of vanes, prevalent in European test facilities and common in Asia and among non-DoD test cells in the United States. There is conflicting test cell data substantiating the effectiveness of this configuration, however. Glass (1986a) measured the sound below and above the turning vanes in the exhaust stack of the hush house at NAF Atsugi, detecting an increase in noise at the lower frequencies. His measurements are presented as Figure 41. Conversely, a comparison of Figure 6 (the T-10 test cell has a ramp) and Figure 7 (the T-16 test cell has vanes) suggests that vanes do decrease the low frequency sound.
The second common alternative is the colander. Also referred to as a basket diffuser or a perforated basket, the colander is a perforated cylinder mounted on the end of the augmenter tube. The end of the colander is solid. The exhaust impinges on the solid end of the colander, exits through the holes in the sides, and then passes up and out the stack. This device was prevalent in the old water-cooled test cells (Robson, 1973). Using specially designed high temperature acoustic probes, Glass and MacCormack (1986) measured the SPL entering and then just above a colander installed in an early air-cooled test cell at MCAS El Toro. This facility is small, the augmenter tube is only 14 feet in length, but the data are pertinent. One set of these measurements is included here as Figure 42. A J79 engine is being tested at 90 percent power. Note the noise reduction is significant at the lower and middle frequencies. The overall sound reduction is about 6 dB. Glass concludes, "the Navy should consider the colander for the benefits associated with reducing lower frequency noise." A colander is currently being used in air-cooled facilities in Germany and Australia (Glass, 1986a). The acoustic performances of these facilities are not documented.
42

140 -
8 120
ft lit
5 8
100
EXHAUST STACK - ABOVE THE LOWER PORTION OF TURNING VANES AND AGAINST SIDE WALL (A? MIL)
SO 100 200 600 FREQUENCY (Hz)
IK 2K 5K 10K
Figure 41. Sound measured below and above the turning vanes in the exhaust stack of the hush house at NAF Atsugi (Glass, 1986a).
150 r
m 140
LLi > HI
130 UJ cr CO ffi'20 DC D. Q Z 2 no o 00
100 -
90
NOTES:
(1) TESTING THE J79 AT 90% POWER
(2) COLANDER WITH 1.25 INCH HOLES ON 1.5 INCH CENTERS
(3) CURVES ARE BEST FIT POLYNOMIALS
(4) REFERENCE: GLASS & MacCORMACK. 1986
_L
10' 102
FREQUENCY, HZ 103
Figure 42. Acoustic performance of a colander diffuser used in the exhaust stack of the jet engine test cell at MCAS El Toro.
43

In order to assess the performance of these configurations relative to the ramp, a series of comparisons was made using the NFESC physical model of the T-10 test cell and simulating a TF30 test at military power. First, the ramp was removed. The discharge from the augmenter tube thus impinged directly on the back wall of the exhaust stack. The 45-degree ramp was then replaced with six guide vanes, with a curved ramp, and finally with a colander. Both the high and low exhaust stacks were employed with each configuration.
The acoustic performance of the exhaust stack without a ramp or any device for diverting the flow upward is shown in Figure 43(a). There is no acoustic insulation and the low exhaust stack is used. The performance of the ramp is also included for comparison. Surprisingly, there is almost no difference at any frequency. Figure 43(b) makes the same comparison when the ramp and the back wall of the stack are insulated. Again, there is almost no difference at any frequency. At the key frequencies in the 1- to 2-kHz range, the exhaust stack performs slightly better with the ramp. There is about 40 percent more acoustic insulation on the ramp than on the back wall. The acoustic performance of the exhaust stack without a ramp is summarized in Table 4 as measured at various locations in the vicinity of the NFESC rig.
Table 4. Noise (dBL) Measured in the Vicinity of the NFESC Test Cell Emissions Test Rig While Varying the Exhaust Stack Configuration. A TF30 Test at
Military Power is Being Simulated.
Exhaust Stack Configuration Location of Sound Measurement
Pos 2 Pos 3 Pos 4 Pos 5 Pos 8 Pos 10
Insulated Ramp Bare Ramp No Ramp, Bare Wall No Ramp, Insulated Wall
103.9 106.3 105.5 104.6
109 112.4 110.8 109.8
102.1 105.4 106.4 104
106.7 109.7 109.3 107.5
103.8 107
107.4 105.1
96.3
The exhaust stack guide vanes were six 90-degree segments sized to cover, with no overlap, the exit to the augmenter tube. Figure 44 shows the vanes installed in the NFESC test cell. The acoustic performance of the exhaust stack vanes is compared with the ramp in Figure 45. For this comparison, the ramp was not insulated. The overall sound pressure level and the 1/3 octave spectrum are almost identical. It follows that the vanes would also generate low frequency sound as shown for the 45-degree straight ramp in Figure 16.
44

100
a a.
i
| E
8 s m ■o
90
80
3 £ 70 3 in ID & a. •o 3 O
CO 60
50
Rarnp: Thick Line: Bare
Thin Lihe:No:Ramp;
107.0 dB;
Bare Back Wall, 107.4 dB!
Position 8, Data Qollecteld 4/11 slion 8, Data O 1>O0
10 16 31.5 63 125 250 500 1000 2000 4000 8000 16000 1/3 Octave Band Center Frequencies, Hz
Figure 43(a). Comparison of the acoustic performance of the NFESC model exhaust stack with 45-degree ramp and the exhaust stack without the ramp. The augmenter tube
thus discharges against the back wall of the exhaust stack. Neither the ramp nor walls of the stack are insulated.
100
a a.
i
i E
£ m ■o c
1
90
80
£ 70
£ Q. T> c 3 o w 60
50
Thick
Thin
Line: Insulated Ramp;, 103.8
Line: No; Ramp; Insulated
dB
Wall, 105: 1dB
Position 8, Data collected 4/11/00
10 16 31.5 63 125 250 500 1000 2000 4000 8000 16000 1/3 Octave Band Center Frequencies, Hz
Figure 43(b). Comparison of the acoustic performance of the NFESC model exhaust stack with 45-degree ramp and the exhaust stack without the ramp. Both the
ramp and walls of the stack are insulated.
45

Figure 44. Turning vanes tested in the exhaust stack of the NFESC test cell.
The curved ramp was a 90-degree segment with a radius of curvature equal to the height of the stack as shown in Figure 46. The acoustic performance of the curved ramp is compared with the 45-degree ramp in Figure 47. Neither ramp was insulated. The curved ramp performed somewhat better in the key 1- to 2-kHz frequency range and overall was about 2 dB quieter.
Three different colanders were assessed. They were all identical except for the size and spacing of the holes: 0.078 inches, 36 percent open; 0.125 inches, 40 percent open; 0.25 inches, 58 percent open. The colanders were the same diameter as the augmenter tube and as long as the axial length of the exhaust stack as shown in Figure 48. Even with the smallest holes, the open area through the sides of the colander was several times the cross-sectional area of the augmenter tube.
The acoustic performance of the three colanders is compared in Figure 49. There is not much difference, less than a dB between any of them. The smaller holes are more effective. Comparisons between the acoustic performance of the small and large hole colanders and the ramp are made in Figures 50(a) and (b). The ramp was not insulated. Overall, the colanders are quieter, by about 2 dB. The difference occurs at the lower and middle frequencies, from 300 Hz to about 2,000 Hz. The colander in the test cell at El Toro reduced sound primarily at these same frequencies (see Figure 42).
The three alternative exhaust stack configurations are compared in Figure 51. For this comparison, the high exhaust stack was added. The superiority of the colander is apparent, primarily in the frequency range from 125 to about 1,000 Hz. The effectiveness of the high stack is also evident by comparing this figure with, for example, Figure 50.
46

10 16 31.5 63 125 250 500 1000 2000 4000 8000 16000 1/3 Octave Band Center Frequencies, Hz
Figure 45. Comparison of the acoustic performance of the NFESC model exhaust stack 45-degree flat ramp and six turning vanes.
Figure 46. Curved ramp tested in the exhaust stack of the NFESC test cell.
47

10 16 31.5 63 125 250 500 1000 2000 4000 8000 16000 1/3 Octave Band Center Frequencies, Hz
Figure 47. Comparison of the acoustic performance of the NFESC test cell model 45-degree exhaust stack ramp and the curved ramp.
Figure 48. Colander installed at the end of the augmenter tube of the NFESC test cell.
48

100
a a. i
g
95
90 E 8 g 85 00
i 80
75 (0 p
"g 70 3 fi
65
60
i Position8.2/15/00 ^«
! ! ! J t IT %
*fi ;
1 ■F :
J~ Small Hole Colander, Thick, 104.5 dB Medium Hole Colander, Medium, 105.1 dB
r tf
T\ Large Hole Colander, Thin, :105.3 dB
u j j | | j j | | j
10 16 31.5 63 125 250 500 1000 2000 4000 8000 16000 1/3 Octave Band Center Frequencies, Hz
Figure 49. Effect of hole size and spacing on the acoustic performance of colanders installed in the exhaust stack of the NFESC test cell.
49

100
10 16 31.5 63 125 250 500 1000 2000 4000 8000 16000 1/3 Octave Band Center Frequencies, Hz
Figure 50(a). Comparison of the acoustic performance of the NFESC model exhaust stack 45-degree flat ramp and the small hole colander.
100
10 16 31.5 63 125 250 500 1000 2000 4000 8000 16000 1/3 Octave Band Center Frequencies, Hz
Figure 50(b). Comparison of the acoustic performance of the NFESC model exhaust stack 45-degree flat ramp and the large hole colander.
50

90
a o.
i. o CM
ffl •D = 80
1 |75 fft
C? 70
65
High! Stack; Position 8,2/15/00
rae Vanes! Ramp,: Thick; 98.3 dB
Curved Ramp, Medium, 98;0 dB : SmaH Hole Colander, Thin, 97.0 dB
10 16 31.5 63 125 250 500 1000 2000 4000 8000 16000 1/3 Octave Band Center Frequencies, Hz
Figure 51. Comparison of the acoustic performance of different NFESC test cell exhaust stack configurations. The high stack is installed.
SUMMARY
Natural barriers such as trees provide only a small attenuation of sound generated by test cells, typically a few dB per 100 feet of woods. All jet engine test facilities should be surrounded with vegetation if the space is available, but trees are not a solution to jet noise problems.
Artificial barriers provide a moderate attenuation of sound generated by jet engines. An acoustic wall built around a T-64 test stand decreased far-field noise by about 6 dB. Regardless, artificial barriers are not practical for any facilities other than test stands. They could not realistically be constructed to shield a test cell or hush house. At distances between source and receiver greater than a few hundred feet, it will be very difficult to provide man-made barriers large enough to provide any noticeable attenuation.
Core busters were shown to be an effective passive method of decreasing rig sound emissions. Using screens, more than a 10-dB reduction was achieved far field in the 1- to 2-kHz frequency range. If the Strouhal number indeed remains constant in this application, the screens would be equally effective decreasing 100-Hz noise emitted by a jet engine test cell. Scaling from the configuration most effective on the rig, the screens on the T-10 JETC would have a "wire" diameter of about 1.25 inches with a 1-foot spacing. The Concorde style core buster did not perform quite as well but still achieved a 3-dB reduction in this same frequency range. Core busters are relatively inexpensive. To be effective, however, they must be placed near the jet nozzle. All obstructions that close to the engine must be cooled, i.e., made from tubing filled
51

with a circulating fluid. The Concorde style device would be much easier to cool than a configuration as complicated as a screen.
A single tube installed close to the engine nozzle effectively decreases aerodynamic noise. A 5-dB overall reduction, 10 dB in the 1- to 8-kHz range, was achieved far field by installing a 2.5-inch diameter tube in the NFESC model test cell. If correctly sized, augmentation air can be used to cool the walls of the tube. The tube does, however, affect the aerothermal performance of the test cell. High ramp temperatures may be a problem. The tube cannot be used in hush houses where the jet nozzle may be located at any of a number of positions.
The other internal modifications examined did not attenuate jet noise nearly as well as the screen or single tube. The sawtooth should be studied further. Although none of the rig sawtooth configurations reduced noise by much more than 1 dB, the full size device decreased far-field noise by 7 dB at NAS Lemoore. Rectifier tubes had little effect on sound emitted by the NFESC test facility.
Increasing the height of the exhaust stack is a very effective method of decreasing test cell noise emissions. A 9-dBL overall decrease in far-field noise was achieved on the NFESC test cell emissions test facility by doubling the height of the exhaust stack. The sound reduction was over both middle and high frequencies, from 250 Hz to 10 kHz, and maximum between 2 and 8 kHz. The concept has already been demonstrated on a full size facility. A reduction of more than 10 dBA far field was achieved on the T-10 by adding a 25-foot extension to the exhaust stack. The noise was reduced across the entire frequency band.
The T-10 exhaust stack ramp does not perform very well acoustically, and several alternatives were tested on the NFESC model. Removing the ramp and thus allowing the jet to impinge on the back wall of the stack had little effect on the acoustic performance of the NFESC test cell rig — no better but no worse. The ramp is the major component of the $300,000 T-10 exhaust stack. The acoustic performance of turning vanes was also very similar to the performance of the ramp. The colander performed best of the alternate configurations tested on the rig, both overall and in the key 1- to 2-kHz frequency range. Switching to a colander in the T-10 JETC will decrease 100-Hz sound emissions by 3 to 5 dB far field. The SPL was measured both at the augmenter tube exit and just outside a colander used in an old air-cooled test cell. The overall sound reduction through the colander was 6 dB, primarily at the lower frequencies. The colander is an alternative that should be studied further.
CONCLUSIONS
A quick fix to a noisy jet engine test cell is to add a core buster across the inlet to the augmenter tube. The screen is the most effective configuration. The screens used on the T-10 should have a "wire" diameter on the order of 1.25 inches with about a 1-foot spacing. The screen must, of course, be cooled. The system required to circulate a cooling fluid through the wires is the major expense.
Although initially more expensive, an equally effective method of reducing test cell noise emissions is to increase the height of the exhaust stack. Without the need for cooling, the high stack is more reliable, less vulnerable, and cheaper to operate and maintain. The stack extension must be acoustically lines; baffles should be considered.
52

ACKNOWLEDGMENT
This project was funded by the Pollution Abatement Ashore Program managed by Naval Facilities Engineering Command and sponsored by the Environmental Protection, Safety and Occupational Health Division (N45) of the Chief of Naval Operations.
REFERENCES
Aylor, D., 1971, "Noise Reduction By Vegetation and Ground," Journal of the Acoustical Society of America, Vol. 51, No. 1 (Part 2), pp. 197-205.
Battis, J.C., 1987, Environmental Research Papers, No. 990: Hush House Induced Vibrations at the Arkansas Air National Guard Facility, Fort Smith, Arkansas, Air Force Geophysics Laboratory, Hanscom AFB, MA.
Becker, E., 1993, Naval Civil Engineering Laboratory Technical Memorandum 72-93-03: Active Noise Control Demonstration at NAS Lemoore T10 Test Cell, Project Report, Port Hueneme, CA.
Bies, D.A. and Hansen, C.H., 1988, Engineering Noise Control, 1st ed., Unwin Hyman, London, Chapter 11.
Callaghan, E.E. and Coles, W.D., 1955, National Advisory Committee for Aeronautics Technical Note 3452: Investigation of Jet-Engine Noise Reduction By Screens Located Transversely Across the Jet, Washington, DC.
Cohen, S., et al., 1980, "Physiological, Motivational, and Cognitive Effects of Aircraft Noise on Children: Moving From the Laboratory to the Field," American Psychologist, Vol. 35, pp 231- 243.
Cooper, E.E., 1996, Naval Facilities Engineering Service Center Technical Report TR-2065- SHR: Development And Analysis of the Naval Facilities Engineering Service Center Aviation Engine Simulation Facility, Port Hueneme, CA.
Croce, D., 1990, Naval Air Engineering Center Design Data Report: Feasibility Study For Utilizing Sawtooth Noise Reduction Device With Type T-10 Turbofan/Jet Engine Test Cells, Lakehurst, NJ.
Dickman, R.A., et al., 1984, "A Solution for Aero-Acoustic Induced Vibrations Originating in a Turbofan Engine Test Cell," AIAA Paper No. 84-0594, AIAA 13th Aerodynamic Testing Conference, San Diego, CA.
Doelling, N., 1961, Wright Air Development Center Technical Report 58-202: Noise Control for Aircraft Engine Test Cells and Ground Run-Up Suppressors, Volume 1: Measurement and Analysis of Acoustical Performance, Wright-Patterson AFB, OH.
53

Ellis, J.C. and Shaffer, W.J., 1989, Air Force Occupational and Environmental Health Laboratory Report AFOEHL-89-040EH0101FNA: Community Noise Survey ofAF37/T-10 Hush Houses, LangleyAFB, Virginia, Brooks Air Force Base, TX.
EPA, 1994, Environmental Protection Agency Report EPA-453/R-94-068: Nitrogen Oxide Emissions and Their Control From Uninstalled Aircraft Engines in Enclosed Test Cells, Washington, DC.
Evans, G.W., Hygge, S. And Bullinger, M., 1995, "Chronic Noise and Psychological Stress," Psychological Sciences, Vol. 6, pp 333-338.
Fadeley, C, 1989, Naval Air Test Center Technical Report SY50-89-031: TECHEVAL of the A/F32T-10 Turbofan/Jet Engine Test Facility, P/N 1226AS100-1, at NAS, Miramar, San Diego, California, Patuxent River, MD.
Fadeley, C, 1991, Naval Air Test Center Technical Report SY50-90-042: TECHEVAL of the A/F32T-10 Turbofan/Jet Engine Test Facility, P/N 1226AS100-1, at NAS, Oceana, Virginia, Patuxent River, MD.
Fadeley, C, 1994, Naval Air Test Center Technical Report SY50-94-012: TECHEVAL of the Retrofit A/F32T-6A Turbofan/Jet Engine Test Facility at NAS Miramar, California, Patuxent River, MD.
Ference, E., 1995, Naval Facilities Engineering Command Contract Report: Next Generation Jet Engine Test Cell Improvement Criteria, Pacific Environmental Services, Norfolk, VA.
Fricke, F., 1984, "Sound Attenuation in Forests," Journal of Sound and Vibration, Vol. 92, No. l,pp 149-158.
Glass, R.E., 1985a, Naval Ocean Systems Center Technical Document 775: Noise Levels of the Modified Arched Structure Hush House, Grumman Facility, Calverton, NY, San Diego, CA.
Glass, R.E., 1985b, Naval Ocean Systems Center Technical Document 836: Noise Levels of the NAS Lemoore Round Augmenter Test Cell (No.3) During TF30, F404, And TF41 Engine Operation, San Diego, CA.
Glass, R.E., 1986a, Naval Ocean Systems Center Technical Report 1142: Acoustic Performance of Air-Cooled Jet Engine Test Facilities, San Diego, CA.
Glass, R.E., 1986b, Naval Ocean Systems Center Technical Note 1452: Noise Levels of the NARF Jacksonville, Florida Arched Structure Hush House During Operation ofA-7andF/A-18 Aircraft, San Diego, CA.
Glass, RE. and MacCormack, D.R., 1986, Naval Ocean Systems Center Technical Note 1440: Acoustic Performance of a Colander-Type Diffuser, San Diego, CA.
54

Glass, R., Castile, B. and Gary, D., 1986, Naval Ocean Systems Center Technical Document 979: Noise Radiation from Jet Engine Test Cells at Patuxent River, Dallas, and Lemoore, San Diego, CA.
Hironaka, M.C. and Malvar, L.J., 1996, Naval Facilities Engineering Service Center Technical Report TR-2045-SHR: F/A-18 Auxiliary Power Unit (APU) Resistant Pavement Systems, Port Hueneme, CA.
Howe, M.S. and Baumann, H.D., 1992, "Noise of Gas Flows," Noise and Vibration Control Engineering, ed. by L.L. Beranek and I.L. Ver, 1st ed., John Wiley, New York, NY.
Klingner, R.E., et al., 1996, Center for Transportation Research Report CTR 0-1471-1: Effective Noise Barrier Solutions for TxDOT, University of Texas, Austin, TX.
Kobayashi, H., Nakano, A., and Kushiraha, Y., 1975, "Run Up Silencer For F-4EJ Phantom," Proceedings of Inter-Noise 75, August 27-29, pp. 171-174.
Kodres, CA. and Murphy, G.L., 1996, Naval Facilities Engineering Service Center Technical Memorandum TM-2236-ENV: Aerothermal Performance of the Navy T-10 Jet Engine Test Cell When Constructed With a Rectangular Augmenter Tube, Port Hueneme, CA.
Lancey, T.W., 1988, California State University Technical Report ME-88-1002: Acoustical Postprocessor Program For Analysis of Jet Noise in Hush Houses Using PHOENICS CFD Program, Fullerton, CA.
Lancey, T.W. and Kodres, CA., 1997, Naval Facilities Engineering Service Center Technical Report TR-2085-ENV: TCNOISE: A Computer Program to Calculate Noise Levels and Directivity From a Jet Engine Test Cell, Port Hueneme, CA.
NEMA, 1964, National Electrical Manufacturers Association Standards Publication SM-33-64: Gas Turbine Sound and Its Reduction, New York, NY.
Piercy, J.E. and Embleton, T.F.W., 1979, "Sound Propagation in the Open Air," Handbook of Noise Control, ed. by CM. Harris, McGraw-Hill, NY, Chapter 3.
Piercy, J.E. and Daigle, G.A., 1991, "Sound Propagation in the Open Air," Handbook of Acoustical Measurements and Noise Control, ed. by CM. Harris, McGraw-Hill, NY.
Piersol, A.G., 1985, BBN Laboratories Inc. Report No. 5836: Evaluation of Vibration Environment of El Toro MCASJet Engine Test Cell, Cambridge, MA.
Porges, G., 1987, Applied Acoustics, Peninsula Press, Los Altos, CA.
55

Rishel, J., 1997, Naval Air Warfare Center (Aircraft Division) Technical Report 48L-96-023: TECHEVAL of the A/F37T-16(v)2, T64-GE-416, Turboshaß Engine Test Facility, P/N 156AS100, MCAS Tustin, California, Patuxent River, MD.
Robson, F.L., Kesten, A.S. and Lessard, R.D., 1973, Air Force Weapons Laboratory Technical Report AFWL TR-73-18: Analysis of Jet Engine Test Cell Pollution Abatement Methods, Kirtland Air Force Base, NM.
Schmidt, D.R., 1987, Naval Ocean Systems Center Technical Note 1501: Noise Levels of the NAS Cubi Point, R.P., T10 Test Cell During J52, J52/P408, F404, TF30/P414, and TF41 Engine Runups, San Diego, CA.
Silbernagel, MA., Kingery, D.L. and Major, W.R., 1986, Naval Civil Engineering Laboratory Technical Memorandum 73-86-21(CR): Technology Assessment of Acoustic Materials and Noise Attenuation Concepts for Aviation Engine Test Facilities, Port Hueneme, CA.
Smith, J.P., et al., 1996, "Active Control of Low Frequency Broadband Jet Engine Exhaust Noise," Noise Control Engineering Journal, Vol. 44, No. 1, pp. 45-52.
Sule, W.P. and VanSuetendael, 1985a, Naval Air Engineering Center Design Data Report 92- 638: Development Testing of Experimental Portable Noise Suppression Equipment for Turboshaft Engine Test Stands, Lakehurst, NJ.
Sule, W.P. and VanSuetendael, 1985b, Naval Air Engineering Center Design Data Report 92- 639: Development of Concept Configurations of Portable Noise Suppression Equipment for Turboshaft Engine Test Stands, Lakehurst, NJ.
Sullivan, J.W. and Crocker, M.J., 1978, "Analysis of Concentric-Tube Resonators Having Unpartitioned Cavities," Journal of the Acoustical Society of America, Vol. 64, No. 1, pp. 207- 215.
Sutherland, L.C. and Daigle, G.A., 1998, "Atmospheric Sound Propagation," Handbook of Acoustics, ed. by M.J. Crocker, Wiley, NY.
Tocci, G.C., 1998, "Ratings and Descriptors for the Building Acoustical Environment," Handbook of Acoustics, ed. by M.J. Crocker, John Wiley, NY.
Ver, I.L. and Dignan, M., 1994, Armstrong Laboratories, Occupational & Environmental Health Directorate Technical Report AL/OE-TR-1994-0130: An Active Liner System for Jet Engine Exhaust Silencers, Wright-Patterson AFB, Ohio.
Ver, I.L. and Ungar, E.E., 1985, BBN Laboratories Inc. Technical Note: Acoustical Loading of Aviation Engine Test Facilities, Cambridge, MA.
VSE, 1985, VSE Corporation Technology Assessment: Acoustic Materials and Noise Attenuation Concepts for Aviation Engine Test Facilities, Camarillo, CA.
56

Von Gierke, H.E., 1957, "Aircraft Noise Sources," Handbook of Noise Control, ed. by CM. Harris, McGraw-Hill, New York, NY.
Von Gierke, H.E. and Nixon, C.W., 1992, "Damage Risk Criteria for Hearing and Human Body Vibration," Noise and Vibration Control Engineering, ed. by L.L. Beranek and I.L. Ver, 1st ed., John Wiley, New York, NY.
57

APPENDIX
JET ENGINE TEST CELL EMISSIONS TEST FACILITY
SUMMARY
The Naval Facilities Engineering Service Center's Jet Engine Test Cell Emissions Test Facility is a 1/20* scale model of the Navy's standard T-10 test cell. This test facility is made up of three major components: the jet engine simulator, the test cell simulator, and the instrumentation system. The hot engine exhaust is supplied by burning a mixture of compressed air and natural gas in a special combustor. The combustor and nozzle assembly is designed to duplicate gas velocities and temperatures of a jet engine operating at up to military power. The test cell simulator consists of scale models of the T-10 engine test bay, the air augmenter tube, and the exhaust stack. These three components are bolted together and mounted on a movable undercarriage. The facility is equipped with instrumentation sufficient for the complete mapping of gas velocity, temperature, and composition.
The Test Cell Emissions Test Facility is used to experimentally assess candidate control technologies for the reduction of noise, oxides of nitrogen, and particulate emissions. It also provides a cost-effective means of determining what effects these technologies have on the performance of an actual jet engine test cell.
A schematic drawing of the entire test facility is presented as Figure A-l. Figures A-2(a) and A-2(b) are photographs of the test cell simulator.
JET ENGINE SIMULATOR
The jet engine simulator is composed of an air compressor, natural gas compressor, combustor assembly, and a specially designed nozzle. The system produces conditions that duplicate the gas velocity and temperature of the exhaust of the jet engine operating at up to military power. Discharge temperature and mass flow rate can be independently adjusted over a wide range of operating conditions. Typical operating conditions are:
Jet temperature = 1,160°F Jet velocity = 2,000 ft/sec Mass flow rate = 0.54 lb/sec
Under these operating conditions, the flow is choked; the Mach number at the exit of the nozzle is equal to 1.0.
Air Compressor
A high-pressure industrial blower powered by a 50-horsepower electric motor supplies pressurized air to the combustor assembly. The blower output is approximately 550-CFM air at 17 psig.
A-l

Natural Gas Compressor
Natural gas is supplied to the jet engine simulator by a natural gas compressor.
Combustor
The combustor was designed by NFESC for use in the study of jet exhaust resistant airfield pavements (Hironaka and Malvar, 1996). The compressed air and compressed natural gas are mixed in the combustor and ignited. A section view of the combustor is shown in Figure A-3(a). Figure A-3(b) is a photograph of the burner. The dimensions of the combustor are 12 inches in diameter by 36 inches high. The upper 12-inch section of the combustor is primarily an inlet and swirl chamber for the air. Air is injected tangentially into the upper chamber of the combustor. The air passes through a hole in a baffle, then through a 5-inch diameter hole into the lower, or combustion, chamber. Natural gas enters the combustor through a 1-inch vertical pipe, which extends from the top of the combustor, through the center of the upper chamber, to near the top of the combustion chamber. The natural gas supply pipe terminates with an injector. The injector has a complex pattern of 1/8-inch diameter holes. The hole pattern enhances the mixing of the air and natural gas prior to ignition.
The igniter is inserted into the upper part of the combustion chamber. The combustion chamber is lined with silica-alumina refractory material. The refractory surrounding the interior volume is an effective insulator for the steel shell of the burner. A 3-inch diameter, 5-foot long pipe directs the burner discharge flow to the nozzle as shown in Figure A-4. The discharge pipe bends gradually through 90 degrees to change the flow from a vertical to a horizontal direction. The gradual bend ensures a symmetric jet and decreases flow losses. The pipe is insulated with 2 inches of mineral wool.
Nozzle
The nozzle was designed to achieve sonic gas velocity at the temperature of a TF30 engine running at military power. The nozzle is welded to the end of the 3-inch burner discharge pipe and tapers to a 1.375-inch diameter jet over a length of approximately 10 inches. Figure A- 5 shows the nozzle, held in position by a 1/8-inch steel cable to prevent it from becoming misaligned when heated.
Control
A single operator controls the jet engine simulator. The operator varies the pressure and temperature of the burner by adjusting air and natural gas flow to obtain the desired nozzle discharge temperature and mass flow rate. Figure A-6 is a photograph of the control room.
TEST CELL SIMULATOR
Like the Navy T-10 jet engine test cell, the test cell simulator consists of a test bay/run room, augmenter tube, and exhaust stack. Figure A-7 identifies these three components. The
A-2

components bolt together and can be easily disassembled to install internal components such as rectifier tubes and core busters to reduce noise.
Engine Test Bay (Run Room)
The engine test bay portion of the emissions test facility is a 1/20* scale model of a T-10 test bay. In a T-10 test cell, the test bay houses the engine being tested. In the test facility, the test bay encloses the discharge pipe from the combustor and the nozzle. The front of the test bay is open. The secondary air intake, located at the back of the test bay, provides additional air to cool the hot engine exhaust. The test bay and secondary intake are lined with rigid mineral wool acoustic insulation board.
Augmenter Tube
Hot engine exhaust is mixed with cool outside ambient air in the augmenter tube to decrease temperature and momentum of the jet before discharge to the atmosphere. In the test facility, a 43-inch long piece of 8-inch diameter pipe is used to simulate the augmenter tube. Flanges attach a 6-inch long pipe to the "upstream" end of the 8-inch pipe. This short length of pipe simulates the obround to round transition from the test bay to the augmenter tube in a T-10 test cell. The augmenter tube is drilled, bossed, and threaded along its length for the insertion of instruments to measure pressure and temperature. The augmenter tube is not insulated.
An undercarriage, as shown in Figure A-2, supports the augmenter tube. The undercarriage rolls on 4-inch diameter grooved wheels. The wheels roll on angle plate, giving the flexibility to easily change the distance between the nozzle and the augmenter tube. The axles are 5/8-inch diameter and are threaded to simplify changing the distance between two opposite wheels. This adjustment makes it possible to align the augmenter tube with the jet by independently changing the height of each end of the tube.
Exhaust Stack
The exhaust stack is a 1/20* scale model of the exhaust stack of the T-10 test cell. It is constructed of 1/8-inch steel plate welded together to form the ramp and walls of the stack. Several alternative exhaust stack configurations have been designed and built to facilitate study of emissions reduction technologies. The exhaust stack is not insulated.
INSTRUMENTATION
The emissions test facility is equipped with instrumentation for measuring gas temperatures and velocities. Sampling ports are provided at four locations along the augmenter tube. Thermocouples and phot tubes are inserted into these ports to measure gas temperature and dynamic pressure. By changing the radial and axial positions of the probes, temperature and velocity can be mapped throughout the augmenter tube.
The flow field across the top of the exhaust stack is measured with the automated sampling system shown in Figure A-8. Computer controlled stepper motors move a thermocouple and pitot tube in a very precise pattern that covers the exit plane of the exhaust
A-3

ramp. From these data, a detailed three-dimensional map of the temperature and velocity distribution is obtained.
Data from thermocouples and dynamic pressure sensors are recorded at 1-second intervals using a 2IX® data logger from Campbell Scientific, Inc., Logan, Utah. The data logger to a desktop computer transmits real time data where the data are displayed as plots of temperature and dynamic pressure as a function of time. Data from the 21X are periodically downloaded to the computer and stored on floppy disks for subsequent processing.
Computer software was written to process the data files. Programs calculate and plot temperature and velocity profiles and mass flow rates such as shown on Figure A-9. The programs include statistical error analyses.
Programs were also written to format the data for use in advanced data presentation programs, such as TECPLOT ® by Amtec, Inc. Figure A-10 is a three-dimensional TECPLOT of the gas velocity at the top of the exhaust stack.
A-4

a* o O-P
o
-P
I/O
Ld
0« -P to a z o u
o u
Ö £ a; u
c/o
I <
3
ll
A-5

Figure A-2(a). Rear view of Jet Engine Test Cell Emissions Test Facility.
Figure A-2(b). Forward view of the Jet Engine Test Cell Emissions Test Facility.
A-6

AIR IN.
-AIR INLET CHAMBER AIR DIFFUSER
■ FUEL NOZZLE
KSNITOR SYSTEM
BURNER CASING
PRESSURE RELIEF SPRING
Figure A-3(a). Section view of the combustor showing the general flow pattern.
A-7

Figure A-3(b). The combustor viewed from inside the control room.
A-8

Figure A-4. A 3-inch diameter, 5-foot long pipe directs the burner discharge flow to the nozzle.
A-9
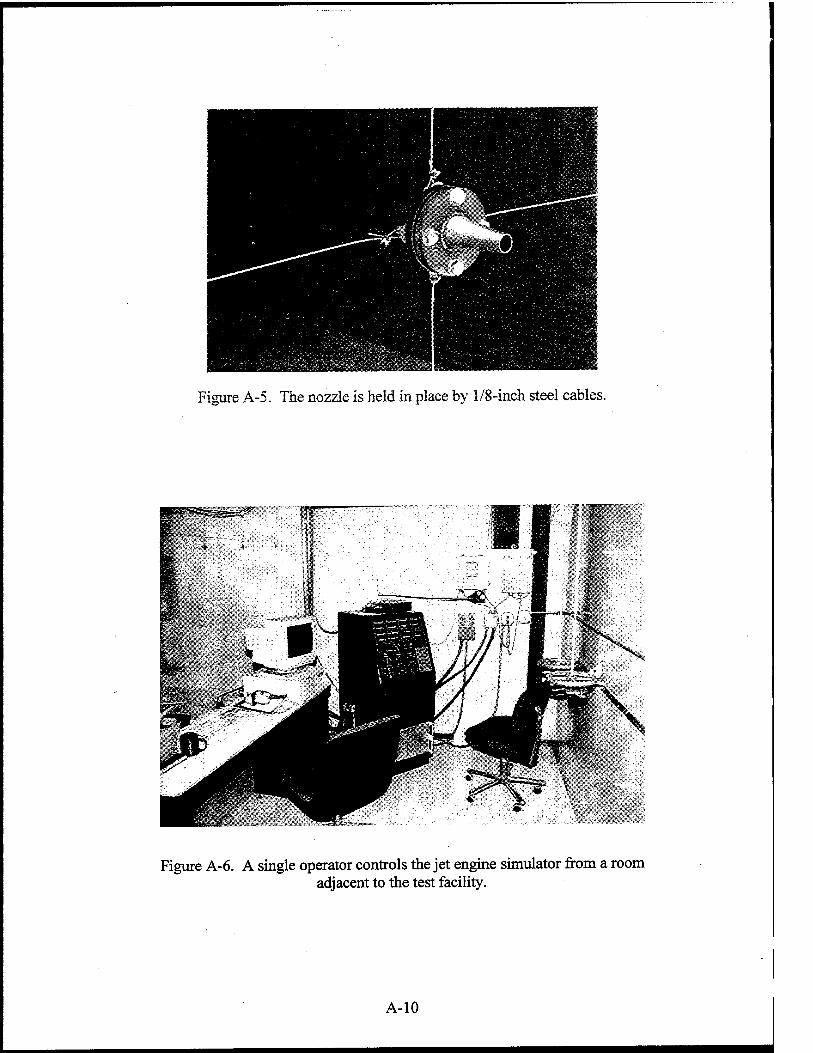
Figure A-5. The nozzle is held in place by 1/8-inch steel cables.
Figure A-6. A single operator controls the jet engine simulator from a room adjacent to the test facility.
A-10

Jet
Test Bay
TOP VIEW
Air Augmenter Tube
SIDE VIEW
Exhaust Ramp
1 foot
Figure A-7. Schematic of the NFESC test cell physical model of the Navy standard T-10 jet engine test cell.
A-ll

Figure A-8. Flow field across the top of the exhaust stack mapped with an automated sampling system.
A-12

* c o % u o
o o I 0
s 3
£ -*-» <4H o
<L> Ä a *-i D -y a <D
3 • eS <u Cfl -o C/3
O o
CO »—H
CO <L> £ Q CJ
«
I 2 5 Cu,
1) 4-»
£ .s 00 O c o 4)
> o r—(
§ 1
H g U •g a> O
^ w H
ON
< 9>
09S/U *Awoo|9A
A-13

2 S, tu
VELOCITY (FT/SEC)
A-14