Embed Size (px)
DESCRIPTION
NOISE REDUCTION & STUDY OF NOISE MEASURING EQUIPMENTS for Noise Pollution
Citation preview

Presented By :-
SATPALEnvironmental Engineering Government Engineering College2011-2012
Noise POLLUTION
Noise pollution is the unwanted or disturbing sound which are produced by human activities.
Sound becomes unwanted when it either interferes with normal activity such as sleeping , conversation or disrupts or diminishes one’s quality of life .
INTRODUCTION
NOISE REDUCTION
&
STUDY OF
NOISE MEASURING EQUIPMENTS
AIM
What is noise reduction ?
Noise reduction is the process of removing noise from a signal

Hard rigid non-porous surfaces like glass, marble or concrete, provide the least absorption and are thus the best reflectors.
Soft porous surfaces and those which can vibrate absorb more of the sound
ABSORPTIVE MATERIAL

The amount of sound absorbed is proportional to the area of the material concerned
If we say
A= Area of exposed material
S = sound absorbed
then equation of sound absorbed is
S = aA
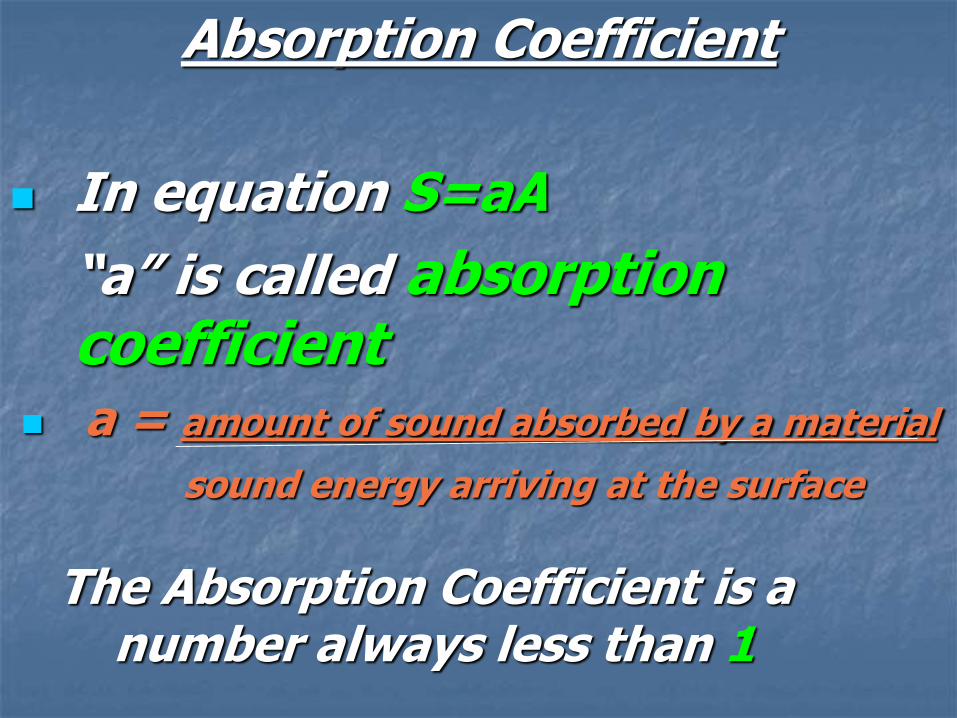
Absorption Coefficient
In equation S=aA
“a” is called absorption coefficient
a = amount of sound absorbed by a material
sound energy arriving at the surface
The Absorption Coefficient is a number always less than 1
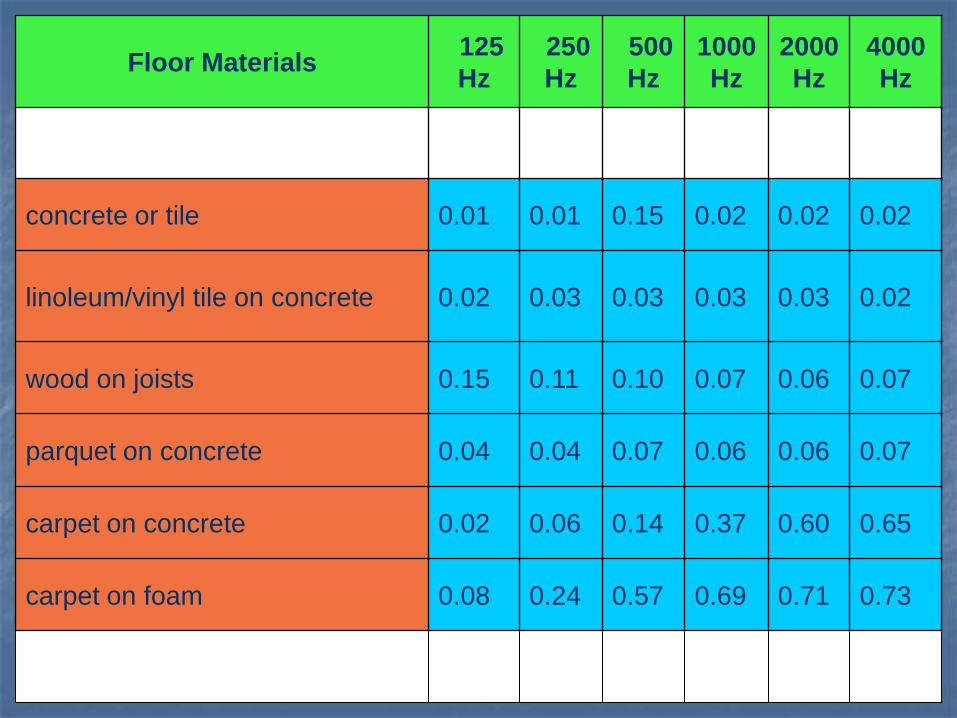
Floor Materials125
Hz
250
Hz
500
Hz
1000
Hz
2000
Hz
4000
Hz
concrete or tile 0.01 0.01 0.15 0.02 0.02 0.02
linoleum/vinyl tile on concrete 0.02 0.03 0.03 0.03 0.03 0.02
wood on joists 0.15 0.11 0.10 0.07 0.06 0.07
parquet on concrete 0.04 0.04 0.07 0.06 0.06 0.07
carpet on concrete 0.02 0.06 0.14 0.37 0.60 0.65
carpet on foam 0.08 0.24 0.57 0.69 0.71 0.73

Seating Materials125
Hz
250
Hz
500
Hz
1000
Hz
2000
Hz
4000
Hz
fully occupied - fabric upholstered 0.60 0.74 0.88 0.96 0.93 0.85
occupied wooden pews 0.57 0.61 0.75 0.86 0.91 0.86
empty - fabric upholstered 0.49 0.66 0.80 0.88 0.82 0.70
empty metal/wood seats 0.15 0.19 0.22 0.39 0.38 0.30
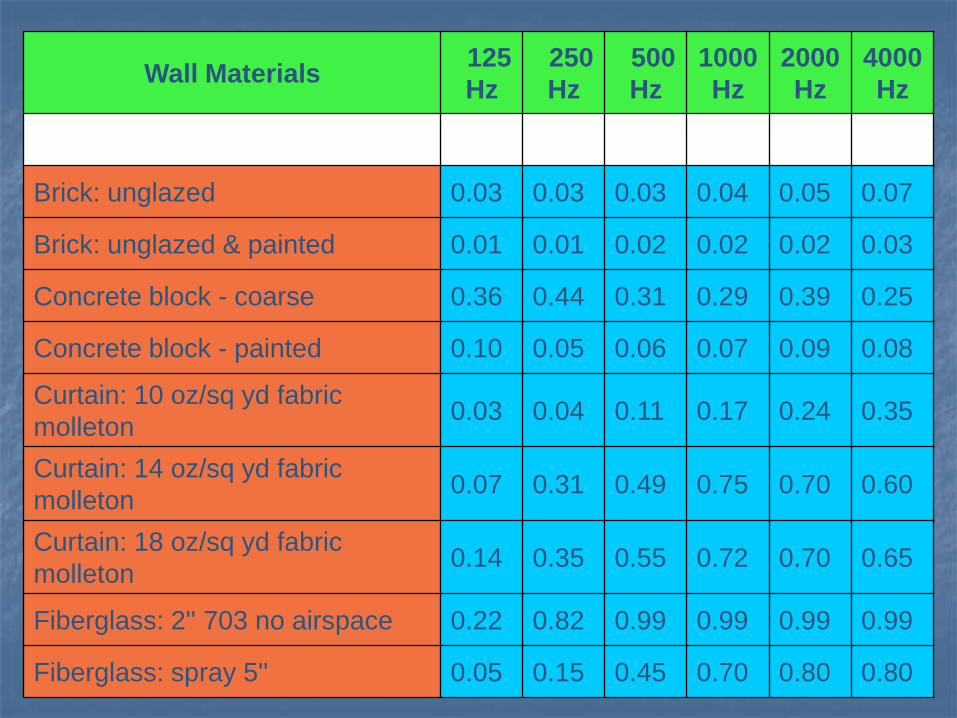
Wall Materials125
Hz
250
Hz
500
Hz
1000
Hz
2000
Hz
4000
Hz
Brick: unglazed 0.03 0.03 0.03 0.04 0.05 0.07
Brick: unglazed & painted 0.01 0.01 0.02 0.02 0.02 0.03
Concrete block - coarse 0.36 0.44 0.31 0.29 0.39 0.25
Concrete block - painted 0.10 0.05 0.06 0.07 0.09 0.08
Curtain: 10 oz/sq yd fabric
molleton0.03 0.04 0.11 0.17 0.24 0.35
Curtain: 14 oz/sq yd fabric
molleton0.07 0.31 0.49 0.75 0.70 0.60
Curtain: 18 oz/sq yd fabric
molleton0.14 0.35 0.55 0.72 0.70 0.65
Fiberglass: 2'' 703 no airspace 0.22 0.82 0.99 0.99 0.99 0.99
Fiberglass: spray 5'' 0.05 0.15 0.45 0.70 0.80 0.80
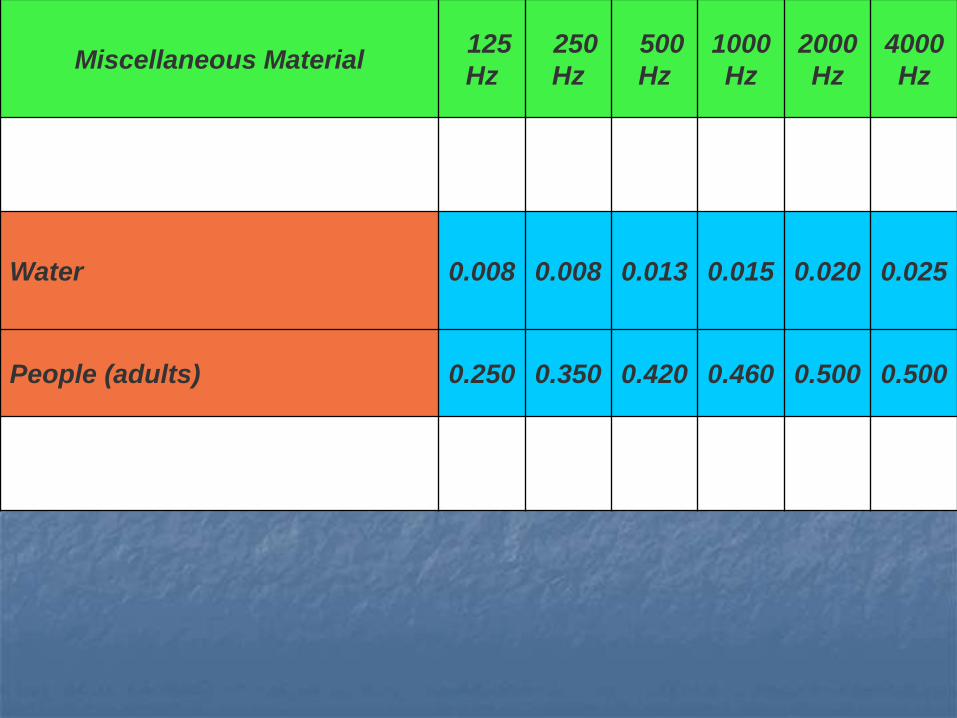
Miscellaneous Material125
Hz
250
Hz
500
Hz
1000
Hz
2000
Hz
4000
Hz
Water 0.008 0.008 0.013 0.015 0.020 0.025
People (adults) 0.250 0.350 0.420 0.460 0.500 0.500

Transmission Loss (TL) measures the performance of a building material (or construction assembly) in preventing airborne sound transmission. This measure VARIES when tested at different frequencies, shown over 1/3 octave intervals.
TRANSMISSION LOSS
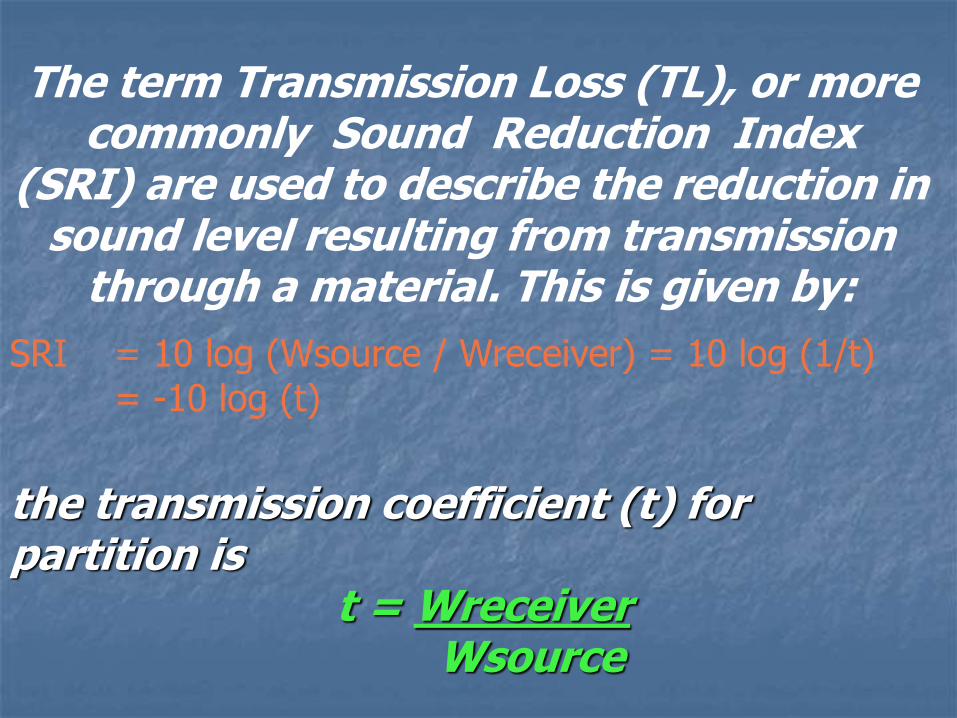
The term Transmission Loss (TL), or more commonly Sound Reduction Index
(SRI) are used to describe the reduction in sound level resulting from transmission
through a material. This is given by:
SRI = 10 log (Wsource / Wreceiver) = 10 log (1/t) = -10 log (t)
the transmission coefficient (t) for partition is
t = WreceiverWsource
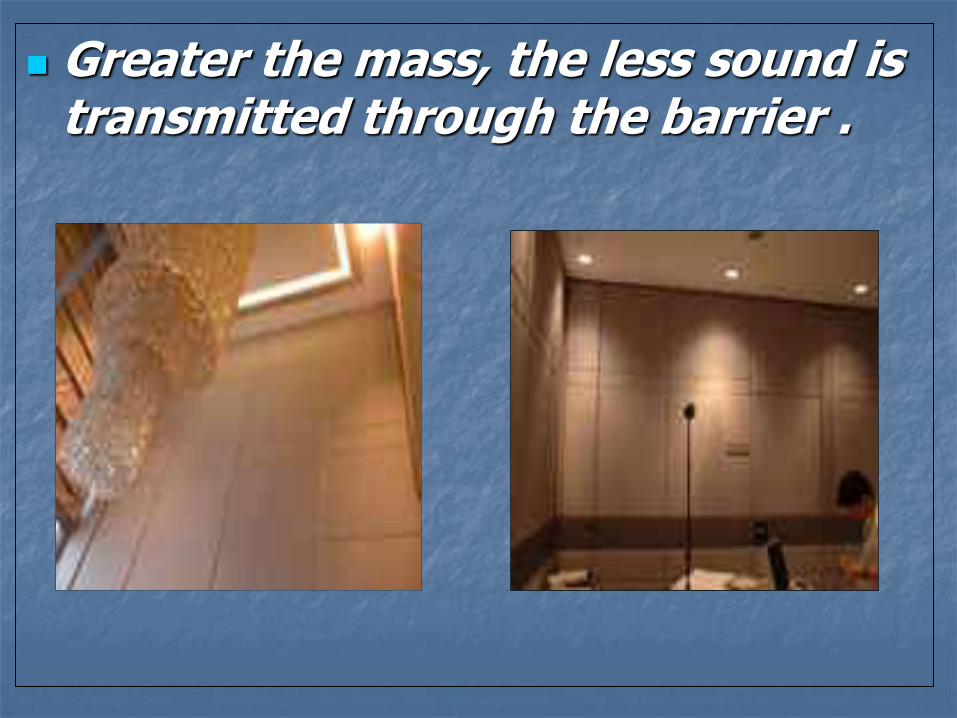
Greater the mass, the less sound is transmitted through the barrier .
The Noise Isolation Class (NIC) measurement was carried out according to ASTM E-336 'Testing Method for Measurement of Airborne Sound Insulation in Buildings' and the calculation was carried out according to ASTM E-413.
NOISE ISOLATION CLASS
NIC of the test specimen was determined by comparing the noise levels sampled inside the source and receiving rooms between which the test specimen separating them .
The NIC rating of an element is determined by plotting the 1/3 octave band of the element and comparing it with the NIC contour.
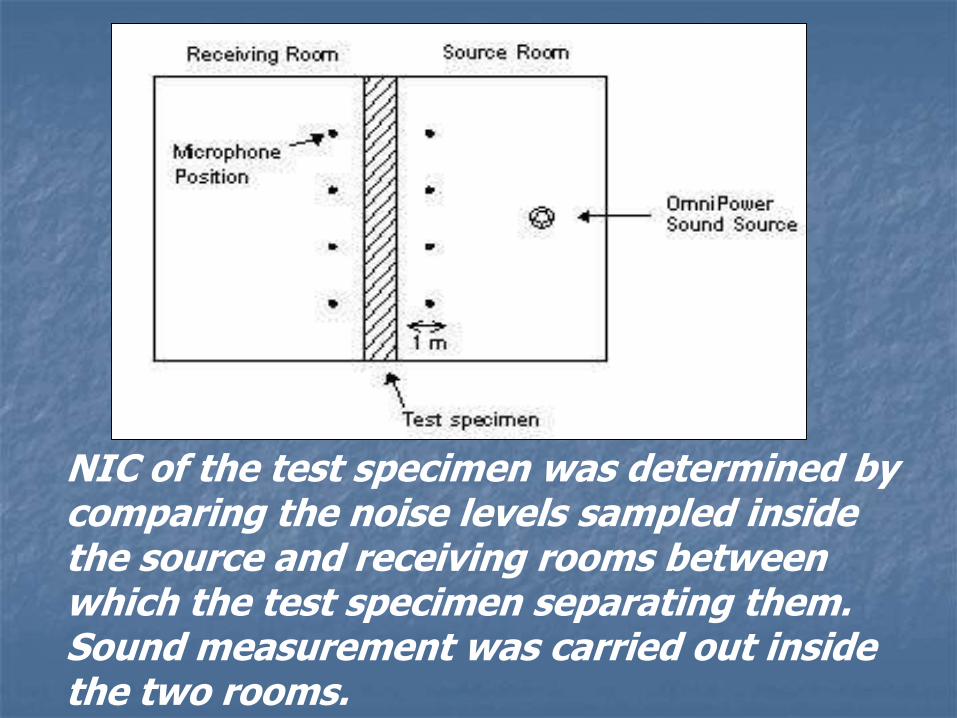
NIC of the test specimen was determined by comparing the noise levels sampled inside the source and receiving rooms between which the test specimen separating them. Sound measurement was carried out inside the two rooms.
Vibration isolation is the process of isolating an object, such as a piece of equipment, from the source of vibrations.
VIBRATION ISOLATION

VIBRATIONISOLATION
ACTIVE ISOLATION
PASSIVE ISOLATION
Passive vibration isolation systems consist essentially of a mass, spring and damper (dash-pot )
Active vibration isolation systems contain, along with the spring, a feedback circuit which consists of a piezoelectric accelerometer, a controller, and an electromagnetic transducer.
The acceleration (vibration) signal is processed by a control circuit and amplifier. Then it feeds the electromagnetic actuator, which amplifies the signal.
As a result of such a feedback system, a considerably stronger suppression of vibrations is achieved compared to ordinary damping
Also known as Noise cancellation or Active noise reduction.
Method of reducing unwanted sound .
ACTIVE NOISE CONTROL

Noise Source
Anti Noise
Resulting Noise
source
1. Sound Level Meter
2. Octave Band Analyzer
3. Statistical Analyzer
4. Noise Average Meter
NOISE MEASURING EQUIPMENTS

SoundLevelMeter
Sound level meter measure sound pressure level .
The standard SLM is more correctly called an exponentially averaging sound level meter as the AC signal from the microphone is converted to DC by root mean square (RMS)
Sound Level Meter (SLM)
The SLM consists of a microphone, electronic circuits and a readout display.
In the beginning sound level meters were very expensive, heavy and didn't do very much
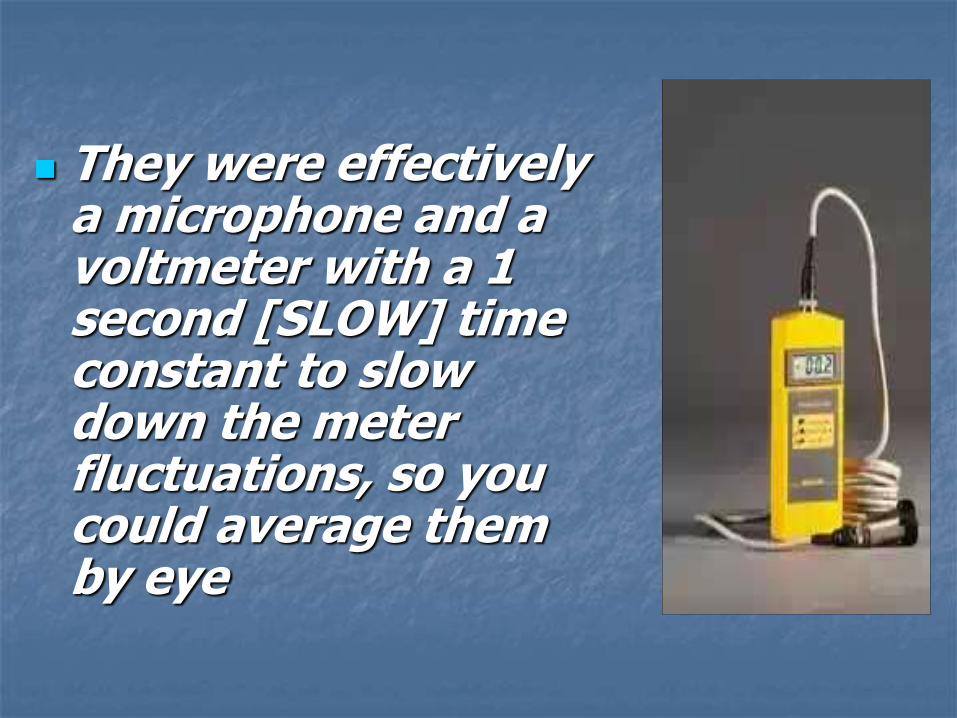
They were effectively a microphone and a voltmeter with a 1 second [SLOW] time constant to slow down the meter fluctuations, so you could average them by eye
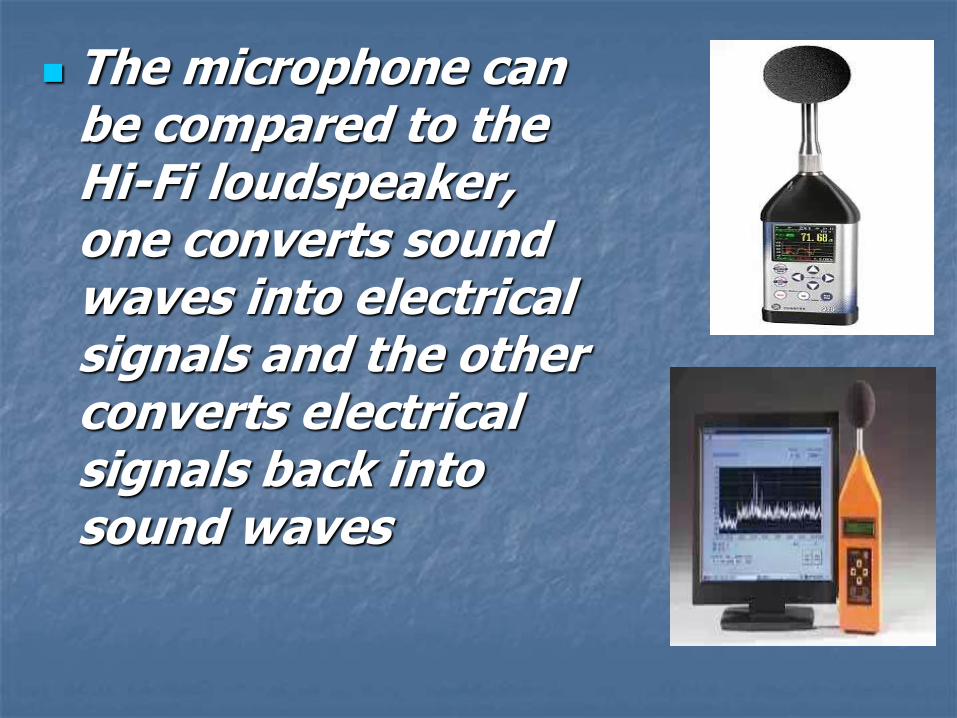
The microphone can be compared to the Hi-Fi loudspeaker, one converts sound waves into electrical signals and the other converts electrical signals back into sound waves
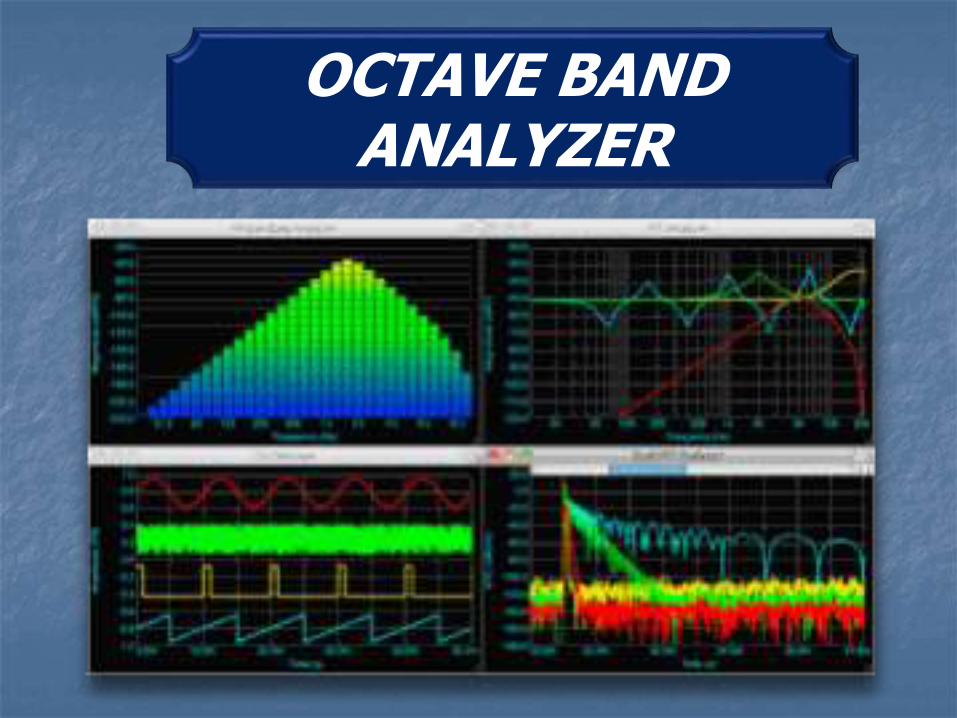
OCTAVE BAND ANALYZER
It determine the adequacy of various types of frequency-dependant noise controls.
Octave band measurement is used when the frequency composition of a sound field is needed to be determined
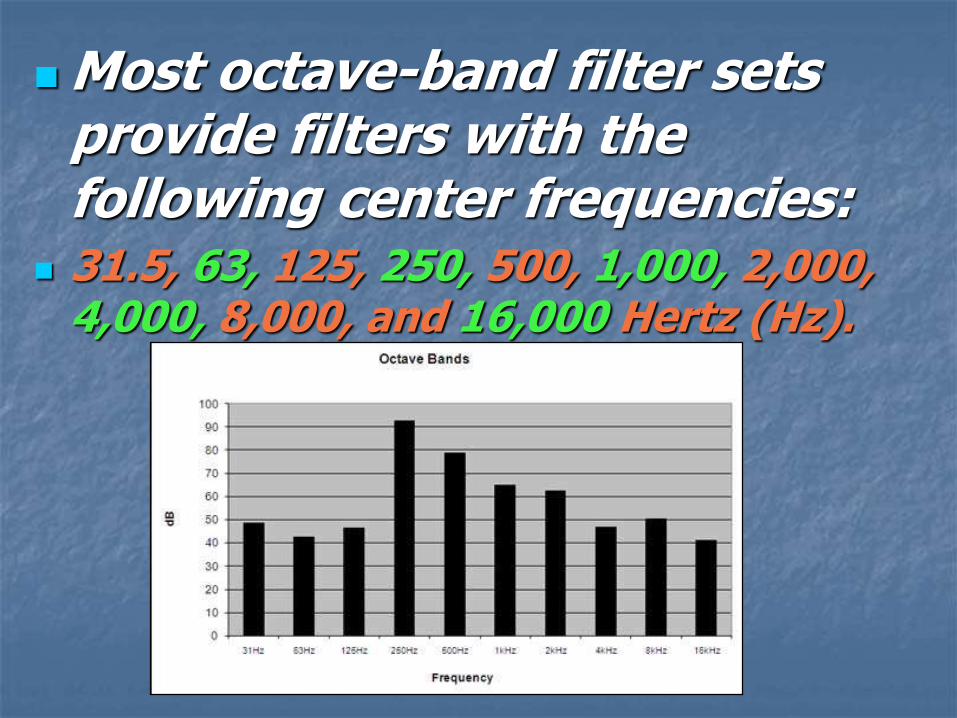
Most octave-band filter sets provide filters with the following center frequencies:
31.5, 63, 125, 250, 500, 1,000, 2,000, 4,000, 8,000, and 16,000 Hertz (Hz).
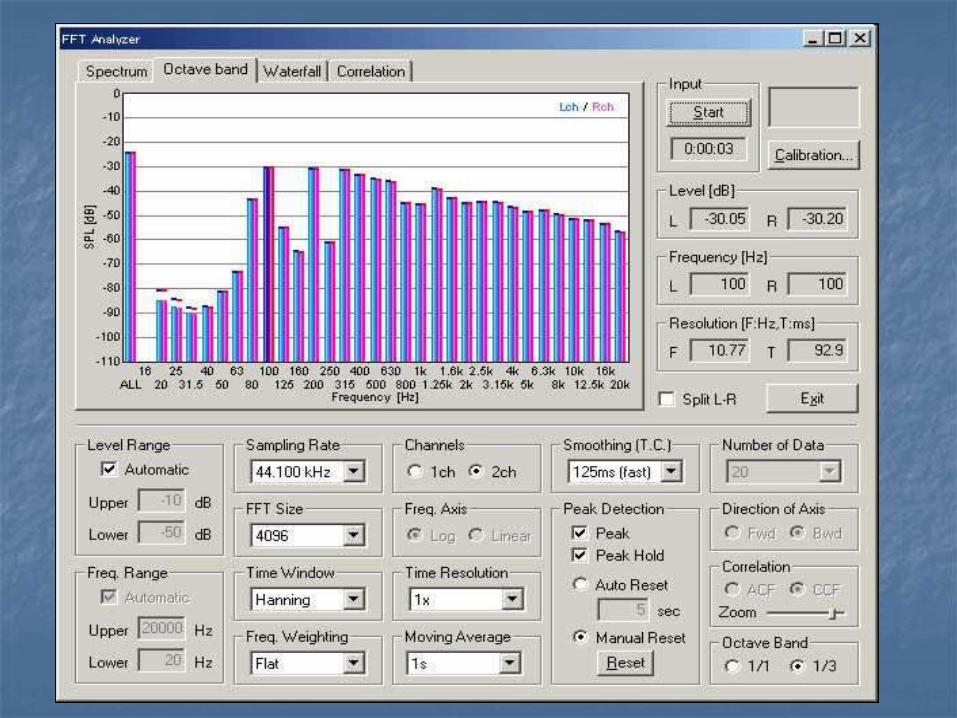


Octave band analyzer can be used to analyze the AC analog output of the sound level meter.
STATISTICAL ANALYLYZER
The statistical noise analyzer (SNA) was designed to analyze very-low-frequency (VLF)/low-frequency (LF) highly impulsive atmospheric electromagnetic noise, which is largely produced by lightning discharges .
A noise Dosimeter is a specialized sound level meter intended specifically to measure the noise.
The Dosimeter store the noise level information and carries out an averaging process
Noise Dosimeter
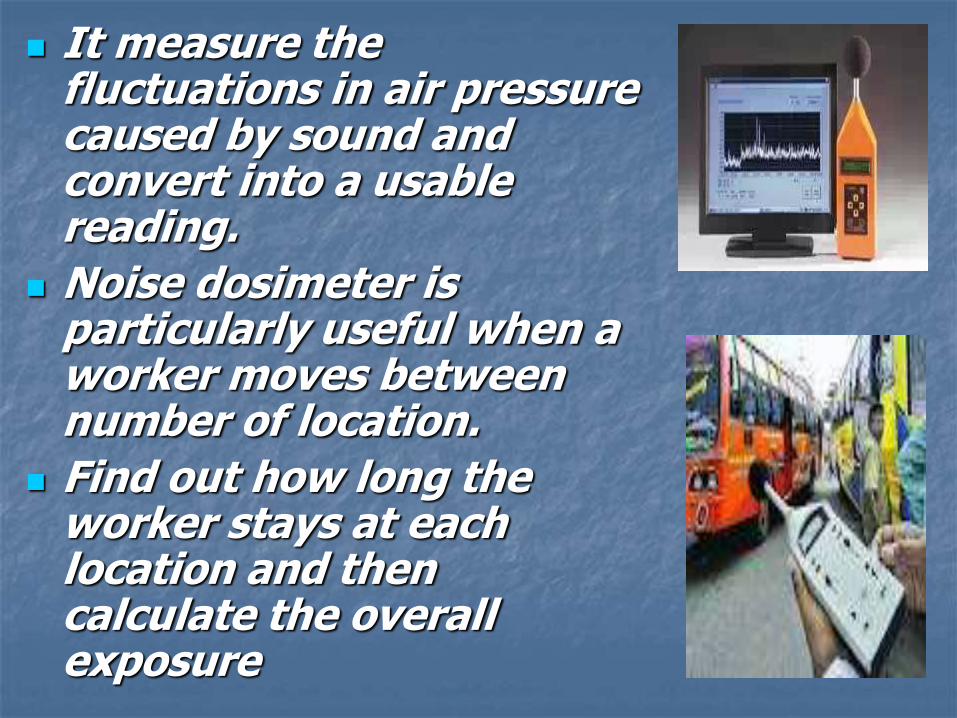
It measure the fluctuations in air pressure caused by sound and convert into a usable reading.
Noise dosimeter is particularly useful when a worker moves between number of location.
Find out how long the worker stays at each location and then calculate the overall exposure

THANK YOU