Embed Size (px)
Citation preview
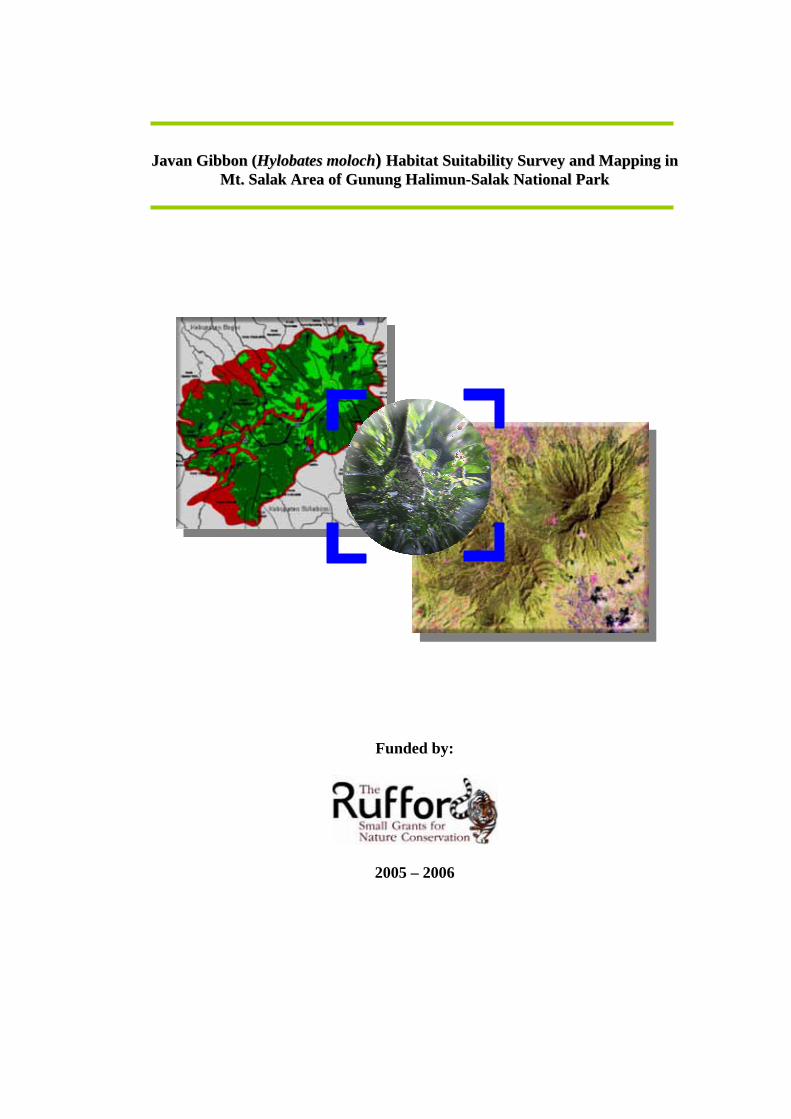
JJaavvaann GGiibbbboonn ((HHyylloobbaatteess mmoolloocchh)) HHaabbiittaatt SSuuiittaabbiilliittyy SSuurrvveeyy aanndd MMaappppiinngg iinn
MMtt.. SSaallaakk AArreeaa ooff GGuunnuunngg HHaalliimmuunn--SSaallaakk NNaattiioonnaall PPaarrkk
Funded by:
2005 – 2006
[ i ]
EXECUTIVE SUMMARY
The objectives of this project are to provide spatial information on javan
gibbon habitat suitability and distribution in Mt. Salak area for Management
Authority of Mt. Halimun-Salak National Park. This information will be useful
for developing new park zonation since the extension of the former Mt. Halimun
National into Mt. Salak area, and as a scientific basis for implementation of
strategic action plan for javan gibbon conservation.
The information on javan gibbon distribution was collected through a
number of survey during December 2005 to June 2006 in three places of Mt Salak
area, i.e.: Kawah Ratu (Parakan Salak, Sukabumi) and Pondok Wisata Cangkuang
– (Cidahu, Sukabumi) and Bobojong village (Bogor). There are 22 groups were
identified using direct counting and triangle count method from over 47 identified
positions. This survey is also proved that both methods were very useful and
flexible to be used concurrently when the observer is moving.
There were ten variables (criterion) used to formulate habitat suitability
model, i.e. the area of primary forest, the area of low-land forest, the area of
submontane forest, the area of slope 0-15%, the area of slope 15-45%, the area of
slope > 45 %, distance to river/water body, distance to settlement, and distance to
road. GIS-based SAW technique combining with Principal Component Analysis,
were used to construct the model. Based on the suitability model (grouped by 5
classes), Mt. Salak area consists of 59.10% (7,847.65 ha) and 23.03% (3,058.69)
for high-suitable and suitable level subsequently, from total area of 13279.55 ha.
It is larger than the less and low suitable level which have a portion of 16.81% and
0.11% subsequently from the whole area.
Based on the superimposition of 29 javan gibbon distinct groups upon
habitat suitability map, it is shown that 10 groups are located on low suitable
habitat, and 4 groups in suitable habitat and 15 groups are living in high suitable
habitat. This information can be used as preliminary warning to immediately
develop monitoring plan for gibbon groups which living in the low suitable
habitat.
[ ii ]
TABLE OF CONTENTS
EXECUTIVE SUMMARY...................................................................................... i
TABLE OF CONTENTS........................................................................................ ii
LIST OF TABLES ................................................................................................. iii
LIST OF APPENDICES........................................................................................ iv
LIST OF FIGURES ................................................................................................ v
I. INTRODUCTION ......................................................................................... 1
A. Background .......................................................................................... 1 B. Objectives............................................................................................. 2
II. METHODOLOGY ........................................................................................ 3
A. Time and Location ............................................................................... 3 B. Human Resources................................................................................. 4 C. Data Requirement................................................................................. 4 D. Field Data Collection Method.............................................................. 4 E. Data Preparation................................................................................... 5 F. Data Analysis and Model Formulation ................................................ 6
III. RESULT AND DISCUSSION...................................................................... 8
A. Javan Gibbon Distribution ................................................................... 8 B. Suitable Habitat of Javan Gibbon ...................................................... 11 C. Conservation Setback and Recommendation..................................... 15
IV. FINANCIAL REPORT ............................................................................... 19
ACKNOWLEDGEMENT .................................................................................... 23
BIBLIOGRAPHY................................................................................................. 24
APPENDICES ...................................................................................................... 26
[ iii ]
LIST OF TABLES Table 1. The Nature of Geographic Distribution of Javan Gibbon in Mt. Salak
Based on 29 Observation Points ............................................................ 10
Table 2. Principal Component Loadings for Each Spatial Variable .................... 11
Table 3. Calculated Weight of Each Habitat Factors........................................... 12
Table 4. Habitat Suitability Classes for Javan Gibbon in Mt. Salak.................... 12
Table 5. Fund Utilization ..................................................................................... 20

[ iv ]
LIST OF APPENDICES Appendix 1. Tally Sheet for Gibbon Survey........................................................ 27
Appendix 2. Javan Gibbon Distribution Data in Mt. Salak Used in the Analysis ............................................................................................28
Appendix 3. Javan Gibbon Distribution Survey Map.......................................... 29
Appendix 4. Accessibility (road and track) in Mt. Salak..................................... 30
Appendix 5. Land Cover of Mt. Salak ................................................................. 31
Appendix 6. Forest Ecosystem (Elevation Based) in Mt. Salak .......................... 32
Appendix 7. Rivers in Mt. Salak Map ................................................................. 33
[ v ]
LIST OF FIGURES Figure 1. The Study Area, Mt Salak in West Java (bounded by green curve)....... 3
Figure 2. Data Preparation Work Flow.................................................................. 5
Figure 3. GIS-Based Analysis with PCA and SAW Method................................. 7
Figure 4. Degraded Forest in Kawah Ratu: (a) forest condition near to the base camp, (b) forest condition along tracks .................................................. 9
Figure 5. Primary Forest at Mt. Salak (viewed from Cangkuang)....................... 10
Figure 6. A Male Gibbon Which Living in the Low-Suitable Habitat ................ 13
Figure 7. Map of Javan Gibbon Habitat Suitability in Mt. Salak ........................ 14
Figure 8. One of Isolated Javan Gibbon Group near Cangkuang Base ............... 15
Figure 9. Opened Land in the Ex-operational Area of Power Plant Private Company inside Mt. Salak Area........................................................... 16
Figure 10. Fern Extraction ................................................................................... 17
[ 1 ]
I. INTRODUCTION
A. Background
The consciousness of the importance and values of biodiversity has been
used as a motive to find out the way to conserve the remaining land in the earth,
especially of that containing high biodiversity. One well-known approach is
through the conservation area establishment (Primack et al., 1998).
Wildlife information, constitutes of habitat and population aspects, is often
used as standard criteria to select the certain land to be assigned as conservation
areas. Some area is established as wildlife sanctuary (suaka margasatwa) based
on the uniqueness wildlife community within and/or its capability to support the
survivalness of this wildlife (Republik Indonesia, 1998). In an established park,
such as Gunung Halimun National Park (recently expanded and renamed as
Gunung Halimun-Salak National Park), it has been used to formulate action plan
(LIPI et al., 2003).
In the park management which primarily focused on keystone species
management approach, the accumulated information on wildlife-habitat
relationship probably the most important wildlife information to be considered
into management practices. Wildlife-habitat relationship is alleged by many
ecologists in providing scientific basis and framework for conservation area
management to formulate management plan and make decision (De La Ville et
al., 1998; Morrison et al., 1992). Although it has not been applied yet, every park
in Indonesia has to complementarily acquire this framework for determining
management zonation (Republik Indonesia, 1998).
This research took javan gibbon (Hylobates moloch) in Gunung (Mt.) Salak
as a case study or an assessment. The conservation status of javan gibbon is
critically endangered (Eudey and MPSG2000, 2004). It means that this species
will extinct in the immediate times and require urgent actions to inhibit extinction
process and promote its survivalness. Reintroduction was arising for one option
and hence need assessment to the relatively large habitat, where Mt. Salak is
included in the list (Supriatna et al., 1994; LIPI et al., 2003). Besides having
large natural areas, this area still has been connected by a corridor to mountainous
[ 2 ]
landscape of Mt Halimun and commend as the extended area for Gunung Halimun
National Park. Hence, it is urgent to provide information for developing new park
zonation.
B. Objectives
The objectives of this project are to provide the spatial information on javan
gibbon distribution and suitable habitat in Gunung Salak area. The information
obtained by this project is intended to be used further by Management Authority
of Gunung Halimun-Salak National Park as the complementary information for
park zonation development. It will also beneficial for the strategic action
implementation recommended by The Working Group of Javan Gibbon and
Langur Population in The Habitat Viability Analysis Workshop (1994) and The
Action Plan for the Endangered Species Conservation in Gunung Halimun-Salak
National Park (2003).
[ 3 ]
II. METHODOLOGY
A. Time and Location
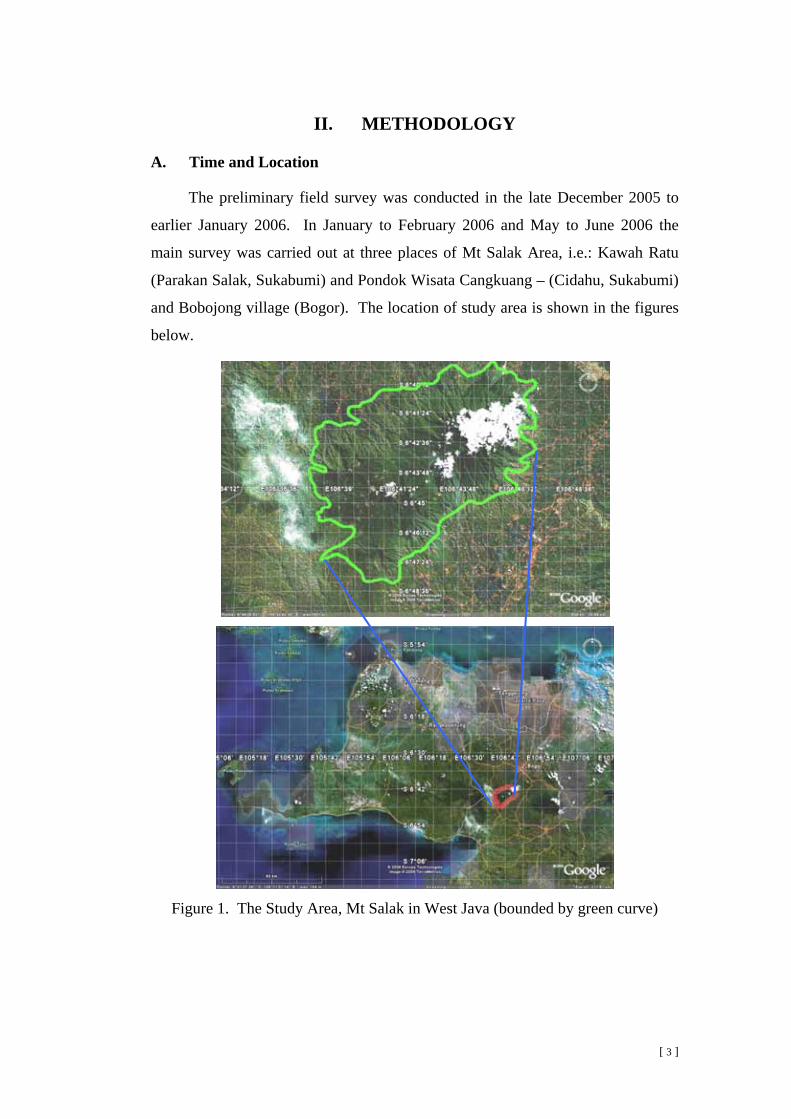
The preliminary field survey was conducted in the late December 2005 to
earlier January 2006. In January to February 2006 and May to June 2006 the
main survey was carried out at three places of Mt Salak Area, i.e.: Kawah Ratu
(Parakan Salak, Sukabumi) and Pondok Wisata Cangkuang – (Cidahu, Sukabumi)
and Bobojong village (Bogor). The location of study area is shown in the figures
below.
Figure 1. The Study Area, Mt Salak in West Java (bounded by green curve)
[ 4 ]
B. Human Resources
Beside the main researcher and field assistant, this project involved diploma
student from Bogor Agricultural University (1 person), local people (2 persons)
for field guide and porter as a part of survey team.
C. Data Requirement
The required data to construct habitat suitability model is described in the
following:
1) Digital topographic map (topomap) on Mt Halimun Salak National Park scale
1:25.000. This map is the special and newest version of topographical
situation on Mt Halimun Salak National Park, produced by the National
Coordinator Agency on Survey and Mapping (BAKOSURTANAL) consultant
for Mt Halimun Salak National Park Management. Landsat ETM+ year 2003
was used to describe the latest land cover condition. The other topographic
features (such as road, river, settlement, countur lines) were already extracted
(in the self-theme). These features will be further processed by this system to
derive the ecological geographical (ecogeographical) factor and to determine
habitat suitability.
2) Javan gibbon distribution data in Mt Salak. This data were collected during
field survey and some data came from previous research (Djanubudiman et al.,
2003). This data was also used by SUITSTAT system (special GIS
application) to determine javan gibbon habitat suitability.
D. Field Data Collection Method
Javan gibbon distribution data were collected by using triangle count and
direct count along the available track in the study area. This method is
appropriate to be applied on gibbon population counting and positioning (Rinaldi,
1992). The method is working based on the intersection between two (imaginary)
lines, which each line was created by observer position (measured by GPS) and
the measured compass bearing (azimuth) of observer to the source of sound.
These two points should be in a quite distant to prevent the occurrence of parallel
lines. After the species position was determined by drawing lines upon the map,
the observer went to that position to verify the species existence. Some record list
[ 5 ]
DEM
countur
landcover rivers settlement
road
forest extraction
elevation class
forest ecosystem
attribute adjustment
slope class
SUITSTAT system
species distribution
in the tally sheet were marked, when the species was found. The design of the
tally sheet can be seen in the Appendix 1.
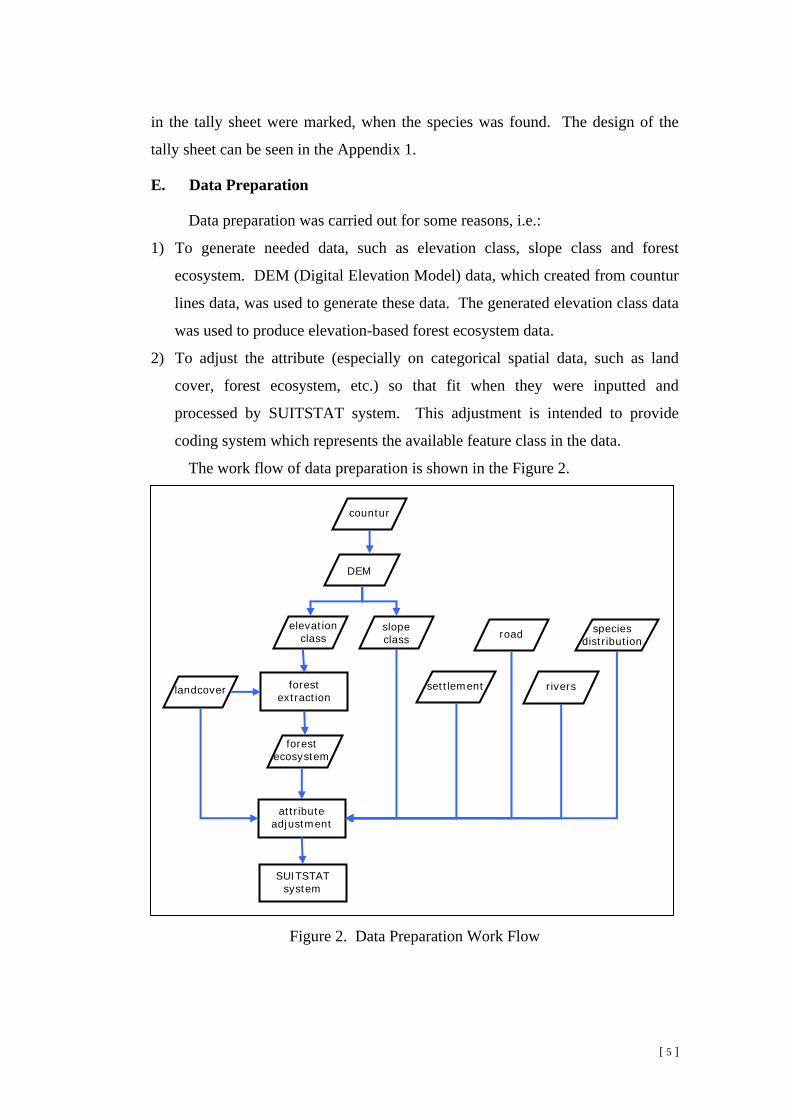
E. Data Preparation
Data preparation was carried out for some reasons, i.e.:
1) To generate needed data, such as elevation class, slope class and forest
ecosystem. DEM (Digital Elevation Model) data, which created from countur
lines data, was used to generate these data. The generated elevation class data
was used to produce elevation-based forest ecosystem data.
2) To adjust the attribute (especially on categorical spatial data, such as land
cover, forest ecosystem, etc.) so that fit when they were inputted and
processed by SUITSTAT system. This adjustment is intended to provide
coding system which represents the available feature class in the data.
The work flow of data preparation is shown in the Figure 2.
Figure 2. Data Preparation Work Flow
[ 6 ]
F. Data Analysis and Model Formulation
There two types of analysis method were used, i.e. descriptive statistics and
GIS-based Simple Additive Weighting (SAW) method. The distribution data was
statistically described to see the general pattern of gibbon distribution to habitat
factor. The second analysis method is used to determine the habitat suitability of
Mt Salak area for javan gibbon.
Suitability model is approximate using GIS-based decision rules, i.e.:
Simple Additive Weighting (SAW) method. The suitability model outcome
(decision outcome) is represented by suitability score which reflects the suitability
level (the higher score, the higher suitability level). The model considers habitat
factors, such as biotic, abiotic and human factor as decision criteria. Habitat
factors are represented by available spatial data, such as land cover, river/water
body, roads, settlement, slopes, and elevation-based forest ecosystem. From
these factor, ten eco-geographic (spatial) variables were ‘extracted’, i.e.: the area
of primary forest; the area of low-land forest; the area of submontane forest; the
area of slope 0-15%, the area of slope 15-45%, the area of slope > 45 %, distance
to river/water body; distance to settlement, and distance to road.
Almost of all variables are related to gibbon behavior and hence its survival.
The variables were selected through rationalizing knowledge specifically on javan
gibbon and generally on wildlife. Javan gibbon is a brachiated monkey which
primarily depends on the forest structure (Napier and Napier, 1985; Kappeler,
1984a). Therefore, forest maturity (which derived from land cover data) should
be considered as a cue to habitat suitability. The existing of built area (such as
road/track and settlement) gives influence to the health of habitat which discussed
in the concept of edge effect and fragmentation (Morrison et. al., 1992; Primack et
al., 1998). Tobing (1999) noted this factor influence to javan gibbon alert
behavior. The existence of rivers or water body is vital for wildlife survival.
Seeing that javan gibbon rarely came down from top forest canopy, this factor
seems unimportant. However, this factor was included into the model consider to
the possible relationship of this factor to community structures in javan gibbon
habitat.
[ 7 ]
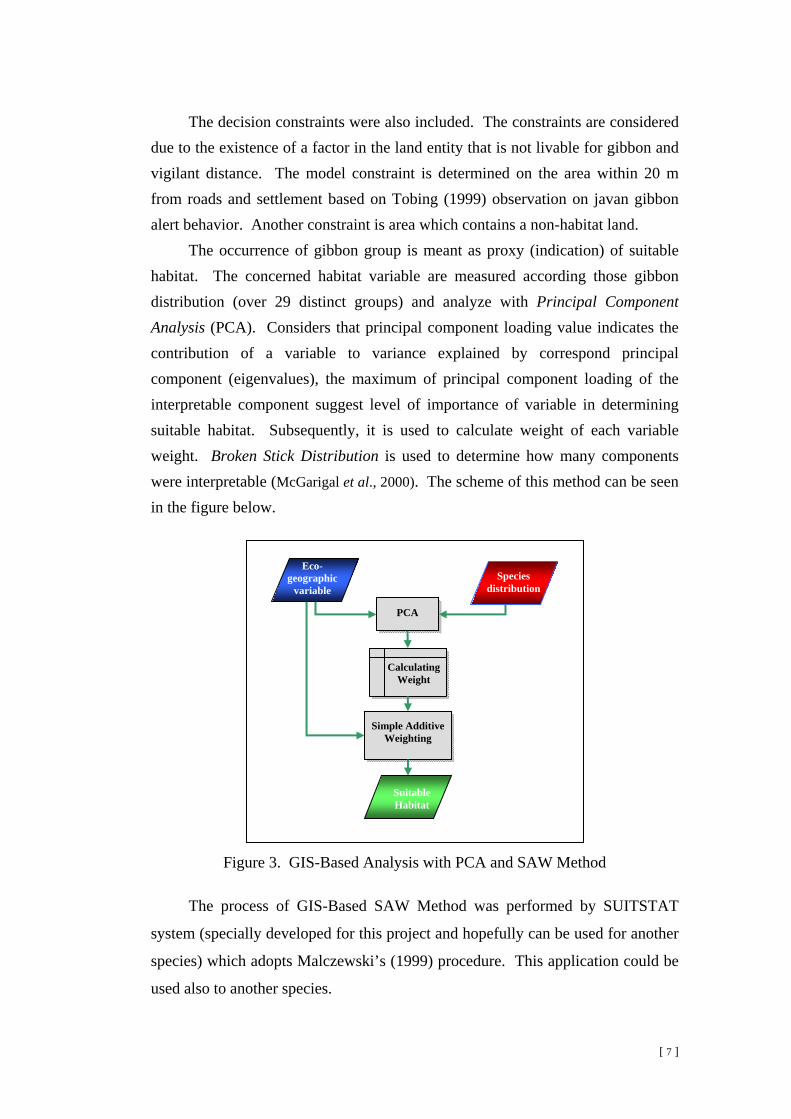
The decision constraints were also included. The constraints are considered due to the existence of a factor in the land entity that is not livable for gibbon and vigilant distance. The model constraint is determined on the area within 20 m from roads and settlement based on Tobing (1999) observation on javan gibbon alert behavior. Another constraint is area which contains a non-habitat land.
The occurrence of gibbon group is meant as proxy (indication) of suitable habitat. The concerned habitat variable are measured according those gibbon distribution (over 29 distinct groups) and analyze with Principal Component Analysis (PCA). Considers that principal component loading value indicates the contribution of a variable to variance explained by correspond principal component (eigenvalues), the maximum of principal component loading of the interpretable component suggest level of importance of variable in determining suitable habitat. Subsequently, it is used to calculate weight of each variable weight. Broken Stick Distribution is used to determine how many components were interpretable (McGarigal et al., 2000). The scheme of this method can be seen in the figure below.
Figure 3. GIS-Based Analysis with PCA and SAW Method
The process of GIS-Based SAW Method was performed by SUITSTAT
system (specially developed for this project and hopefully can be used for another
species) which adopts Malczewski’s (1999) procedure. This application could be
used also to another species.
Species distribution
Eco-geographic
variable
PCA
Simple Additive Weighting
CalculatingWeight
Suitable Habitat
[ 8 ]
III. RESULT AND DISCUSSION
A. Javan Gibbon Distribution
Field survey was successful to record over 47 positions of identified javan
gibbon through direct count method (visually) and triangle count method from
whole study location. In each location, the measurement was conducted several
times to ensure the distinction of java gibbon group to another. From these
recorded locations, only 22 groups were identified as distinct groups. Specifically
10, 8, and 4 distinct groups were found in Bobojong, Cangkuang, and Kawah
Ratu. Notes that only five groups from total of ten gibbons group at Bobojong
site were included into analysis since there is no data on land cover type (covered
up by cloud) in topographic map 2003 over these groups.
For the analysis purpose, the distribution data was enriched by previous
research. Hence, there are 29 groups were used for analysis. The distribution data
from field survey for analysis is provided in Appendix 2 (tabular format) and
Appendix 3 (spatial format).
Most of the distinct groups were recorded through visual count method.
However, triangle count method is helpful to be applied in gibbon count, which
13 points were recorded, and the rest was recorded visually. The extreme
topographic condition is very challenging for verification of some positions which
identified by triangle count method. Nevertheless, both methods were useful to be
used concurrently by moving observer.
The number of groups identified through this survey is quite small, but it
was successful to identified distinct group. Through SUISTAT system (special
GIS Application which helping to map javan gibbon distribution using their
positional data and construct habitat suitability) the distinct group could be
checked and determined. Some positions which relatively close to its nearest
position were determined as similar group. By using this procedure, distinct
group misinterpretation is found to the previous study (Djanubudiman et al.,
2003). Additionally, consider to the forest damage around Kawah Ratu and
extreme topographical condition which limiting the forest exploration in
[ 9 ]
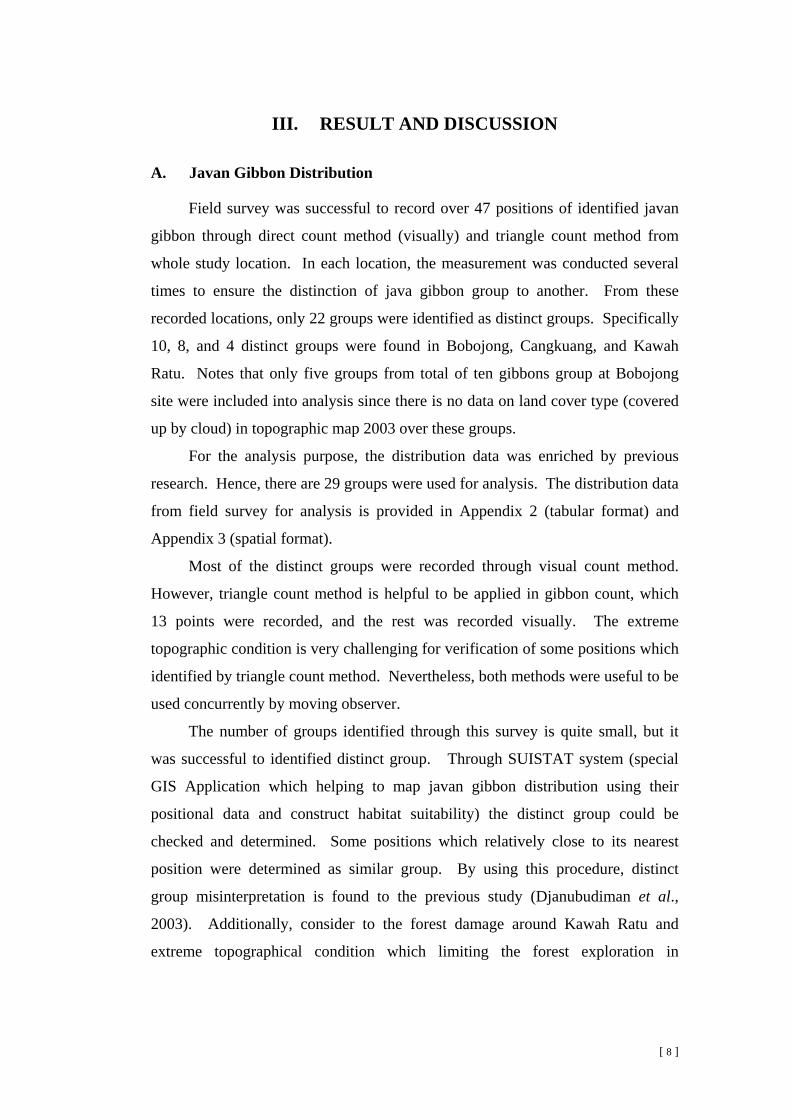
Bobojong, the number of identified groups was optimal. The forest condition in
Kawah Ratu study site can be seen in the figures below.
(a) (b) Figure 4. Degraded Forest in Kawah Ratu: (a) forest condition near to the base camp, (b) forest condition along tracks
The distribution data obtained by this survey enrich the information of javan
gibbon distribution data upon Mt. Salak. Previous research conducted by
Djanubudiman et al. (2003) was focusing in western part of Mt. Salak, whereas
this survey provides relatively in the central and north-eastern parts.
The general geographical pattern of distribution data is elucidated by
summarizing the distribution data with the eco-geographic variables concerned,
i.e. forest ecosystem (elevation based), land cover types, slopes, nearest distance
to settlement, river (water body), and road. Since javan gibbons establish their
exploiting area in the certain space as so called home range and/or territory, their
position is represented with regular polygon (grid) as their home range entity.
The summary is provided in the Table 1.
According to the summary, in the forest ecosystem, the data was distributed
mostly in submontane forest and lowland forest. In average, gibbon range
contains more submontane forest than lowland forest. The total area of
submontane forest contained in the range is also higher than of lowland forest. In
contrast, there is no any group found in montane forest. It is sensible because
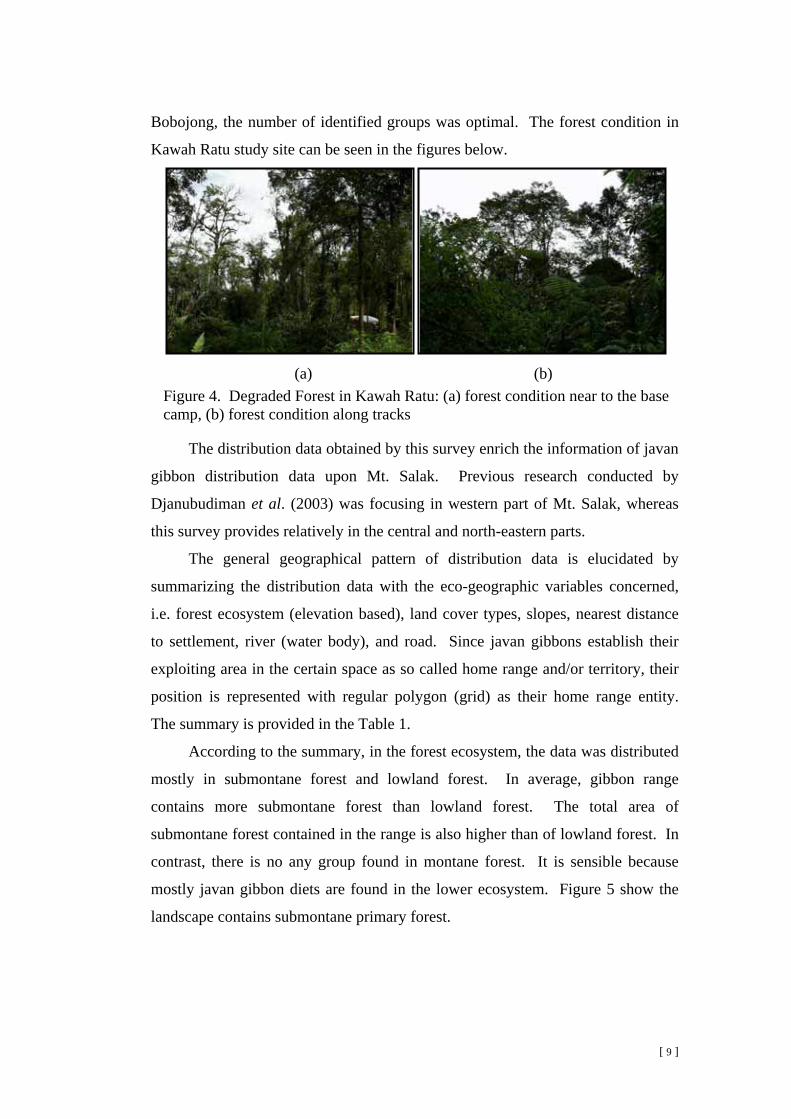
mostly javan gibbon diets are found in the lower ecosystem. Figure 5 show the
landscape contains submontane primary forest.
[ 10 ]
Table 1. The Nature of Geographic Distribution of Javan Gibbon in Mt. Salak Based on 29 Observation Points
Variable Freq Total Area Min Max Average Std.Var. HPR (ha) 28 423.423 0 16.646 14.600 4.503HSE (ha) 9 52.787 0 15.960 1.820 4.400HDR (ha) 18 229.629 0 16.646 7.919 7.947HGB (ha) 19 252.411 0 16.646 8.704 7.973HGA (ha) 0 0 0 0 0 0SL1 (ha) 25 163.474 0 14.515 5.637 4.700SL2 (ha) 28 291.050 0 16.002 10.036 4.700SL3(ha) 8 9.185 0 3.301 0.317 0.813RIV (m)* 28 - 0 2,747.617 979.488 826.489PMK (m) 0 - 7.601 5,747.397 2531.521 1389.75JL (m)* 12 - 0 2,153.779 428.919 567.654
Note: HPR=the area of primary forest; HSE=the area of low-land forest; HGB=the area of submontane forest contained in; SL1=The area of slope 0-15%; SL2=The area of slope 15-45%; SL3=The area of slope > 45 %; RIV=distance to river/waterbody; PMK=distance to settlement; JL=distance to road/tracks.
The geographical characteristic of the data is also examined based the forest maturity stage, i.e. primary forest and secondary forest, which shown that mostly they are distributed in primary forest, in number of occurrences or area possession in average. The gibbon distribution seems mostly spread to the area that has a low (0-15%) and medium slope area (15 – 45%). Even then, in average portion of area with the medium slope within gibbon’s range is the highest. Almost all observations are distributed close to the river /small streams/ water body. This is related to the geographic situation in Mt Salak where river systems are so complex and closed to each other.
Figure 5. Primary Forest at Mt. Salak (viewed from Cangkuang)
[ 11 ]
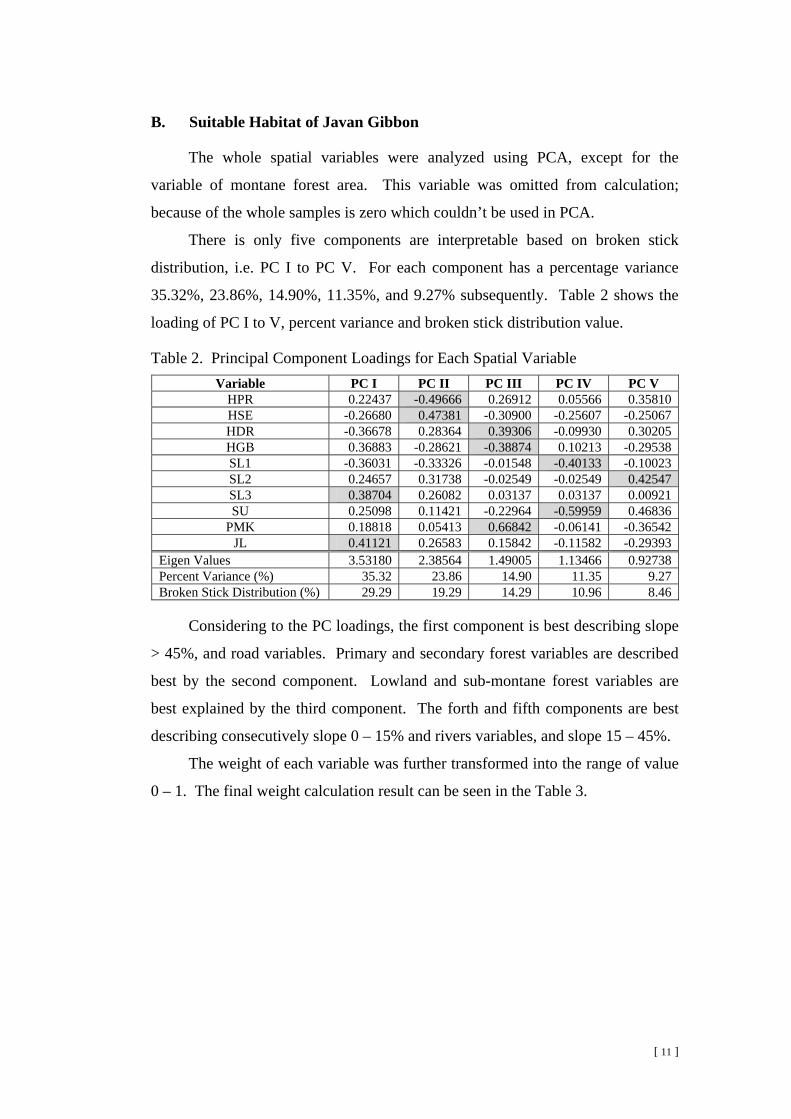
B. Suitable Habitat of Javan Gibbon
The whole spatial variables were analyzed using PCA, except for the
variable of montane forest area. This variable was omitted from calculation;
because of the whole samples is zero which couldn’t be used in PCA.
There is only five components are interpretable based on broken stick
distribution, i.e. PC I to PC V. For each component has a percentage variance
35.32%, 23.86%, 14.90%, 11.35%, and 9.27% subsequently. Table 2 shows the
loading of PC I to V, percent variance and broken stick distribution value.
Table 2. Principal Component Loadings for Each Spatial Variable Variable PC I PC II PC III PC IV PC V
HPR 0.22437 -0.49666 0.26912 0.05566 0.35810 HSE -0.26680 0.47381 -0.30900 -0.25607 -0.25067 HDR -0.36678 0.28364 0.39306 -0.09930 0.30205 HGB 0.36883 -0.28621 -0.38874 0.10213 -0.29538 SL1 -0.36031 -0.33326 -0.01548 -0.40133 -0.10023 SL2 0.24657 0.31738 -0.02549 -0.02549 0.42547 SL3 0.38704 0.26082 0.03137 0.03137 0.00921 SU 0.25098 0.11421 -0.22964 -0.59959 0.46836
PMK 0.18818 0.05413 0.66842 -0.06141 -0.36542 JL 0.41121 0.26583 0.15842 -0.11582 -0.29393
Eigen Values 3.53180 2.38564 1.49005 1.13466 0.92738 Percent Variance (%) 35.32 23.86 14.90 11.35 9.27 Broken Stick Distribution (%) 29.29 19.29 14.29 10.96 8.46
Considering to the PC loadings, the first component is best describing slope
> 45%, and road variables. Primary and secondary forest variables are described
best by the second component. Lowland and sub-montane forest variables are
best explained by the third component. The forth and fifth components are best
describing consecutively slope 0 – 15% and rivers variables, and slope 15 – 45%.
The weight of each variable was further transformed into the range of value
0 – 1. The final weight calculation result can be seen in the Table 3.
[ 12 ]
Table 3. Calculated Weight of Each Habitat Factors Variables Maximum PC Loading Weight
HPR 0.49666 0.104 HSE 0.47381 0.100 HDR 0.39306 0.083 HGB 0.38874 0.082 SL1 0.40133 0.084 SL2 0.42547 0.110 SL3 0.38704 0.084 SU 0.59959 0.126 PMK 0.66842 0.140 JL 0.41121 0.086
The weight of each variable given by the PCA shows the influence level to
determine habitat suitability. From the table above, the subsequent highest weight
is corresponding to the distance to settlement, distance to river/water body, slope,
forest maturity, and so forth.
Analyzing this weight based on the variable family group seems to follow
the ecological sense. For example, the weight of forest maturity is highest on
primary forest, which is already known that primary forest is containing richer
gibbon diets, providing more cover than secondary forest. The direct influence of
water supply to the gibbons is questionable, since this species is very rare to come
down from the tree canopy. The explanation of this fact might be put on the
relation between the plant communities to the river, which has different
composition and structure.
Based on the calculation and considered habitat factors, habitat with a low
suitability shares fairly extent of whole area of Mt Salak. The largest portion of
Mt Salak is dominated by high suitable and suitable level. The size of each
suitability class area is provided in the Table 4 and Figure 7 (spatial format).
Table 4. Habitat Suitability Classes for Javan Gibbon in Mt. Salak
Area Suitability Class Class Name ( Ha) (%)
Class 1 Low Suitable 2231.892 16.807Class 2 Less Suitable 14.718 0.111Class 3 Moderate Suitable 126.606 0.953Class 4 Suitable 3058.689 23.033Class 5 High Suitable 7847.647 59.096
[ 13 ]
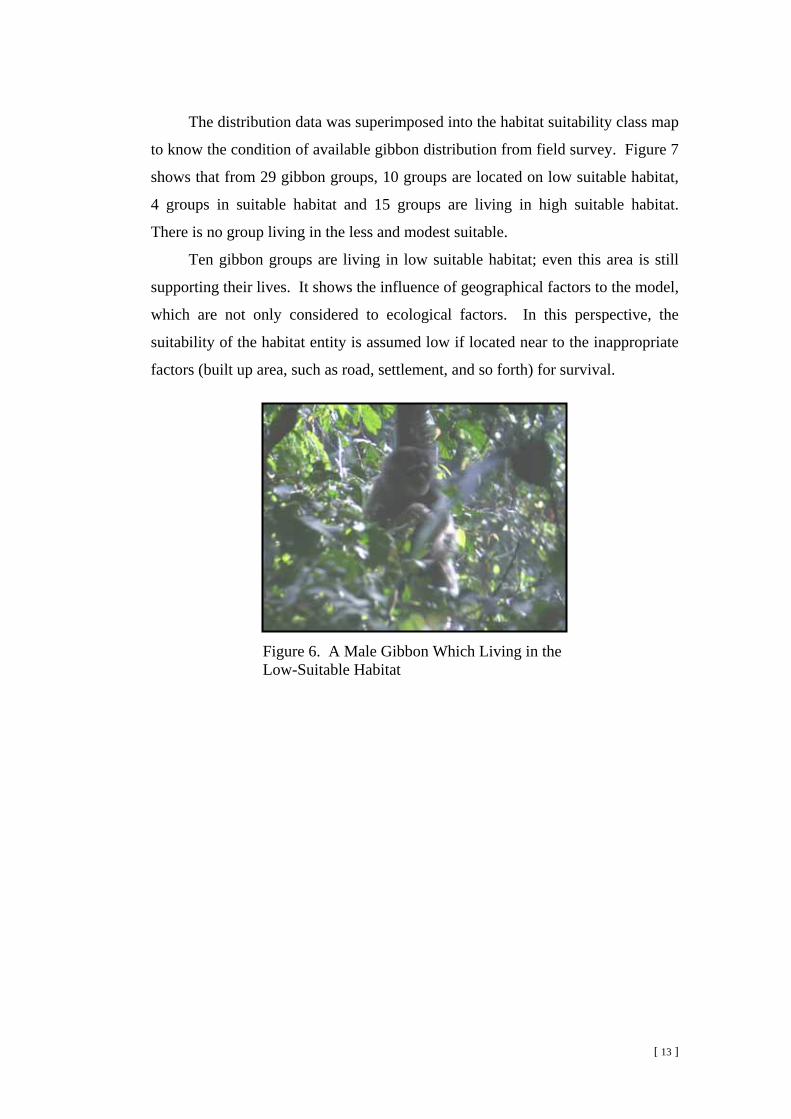
The distribution data was superimposed into the habitat suitability class map
to know the condition of available gibbon distribution from field survey. Figure 7
shows that from 29 gibbon groups, 10 groups are located on low suitable habitat,
4 groups in suitable habitat and 15 groups are living in high suitable habitat.
There is no group living in the less and modest suitable.
Ten gibbon groups are living in low suitable habitat; even this area is still
supporting their lives. It shows the influence of geographical factors to the model,
which are not only considered to ecological factors. In this perspective, the
suitability of the habitat entity is assumed low if located near to the inappropriate
factors (built up area, such as road, settlement, and so forth) for survival.
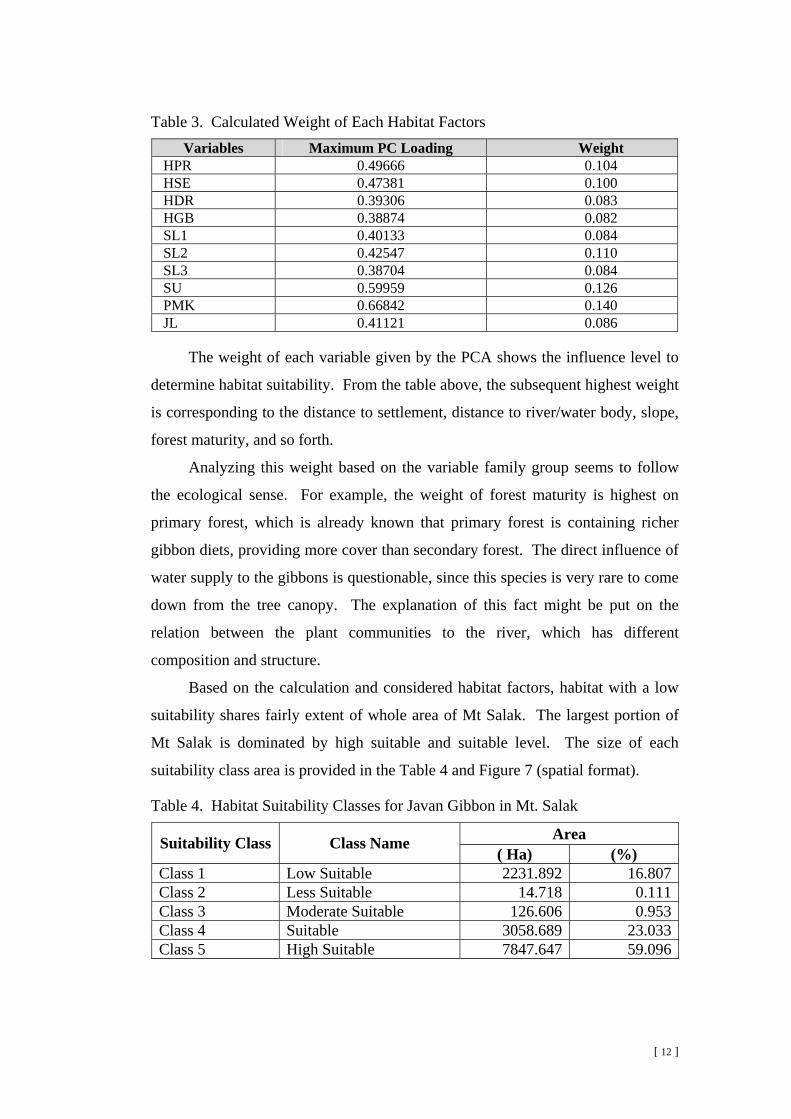
Figure 6. A Male Gibbon Which Living in the Low-Suitable Habitat
[ 14 ]
Figure 7. Map of Javan Gibbon Habitat Suitability in Mt. Salak
[ 15 ]
C. Conservation Setback and Recommendation
Based on the field observation, there is some disturbance facts to javan
gibbon habitat were observed, such as: poaching, forest and non-forest extraction
(such as fern, bamboos, etc.), encroachment, and so forth. Examining the current
situation, we listed some possible problems through identifying the causes and
symptoms, i.e.:
1) Lack of conservation management capability. There are some indications of
this problem which are still occurred today:
• Less coordination between adviser (Ministry of Forestry, Directorate
General for Forest Protection and Nature Conservation) and the executor
(Mt Halimun National Park Management Authority) which have made less
responsibilities and less creativity atmosphere to take immediate action,
and produced inefficient and ineffective area surveillance and control. The
exposing of park enlargement issue has been very slow and grew the
uncertainties among local peoples up. This condition has been motivated
some irresponsible persons to take self-advantage by cutting down trees in
the protected zones of PT Perhutani area.
Figure 8. One of Isolated Javan Gibbon Group near Cangkuang Base
[ 16 ]
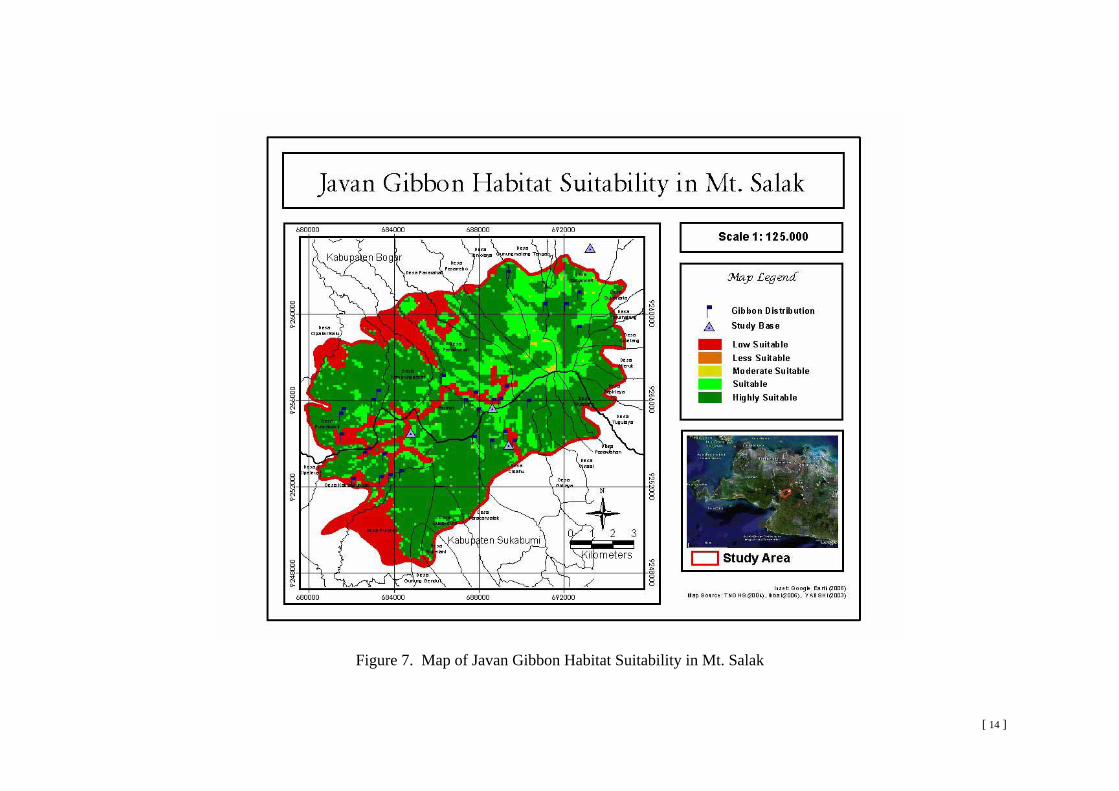
• Lack of information and methodology to manage the integration of the
habitat landscape. A fact that one group of javan gibbon (shown in the
Figure 8) was isolated in small fragment of forest indicates that the
integratedness of landscape habitat has not been considered in habitat
management.
2) Lack of conservation enforcement and support. There is utilization (through
concession scheme) other than conservation purpose (private company) inside
Mt. Salak protected areas. Fragmentation inside Mt. Salak is not avoidable
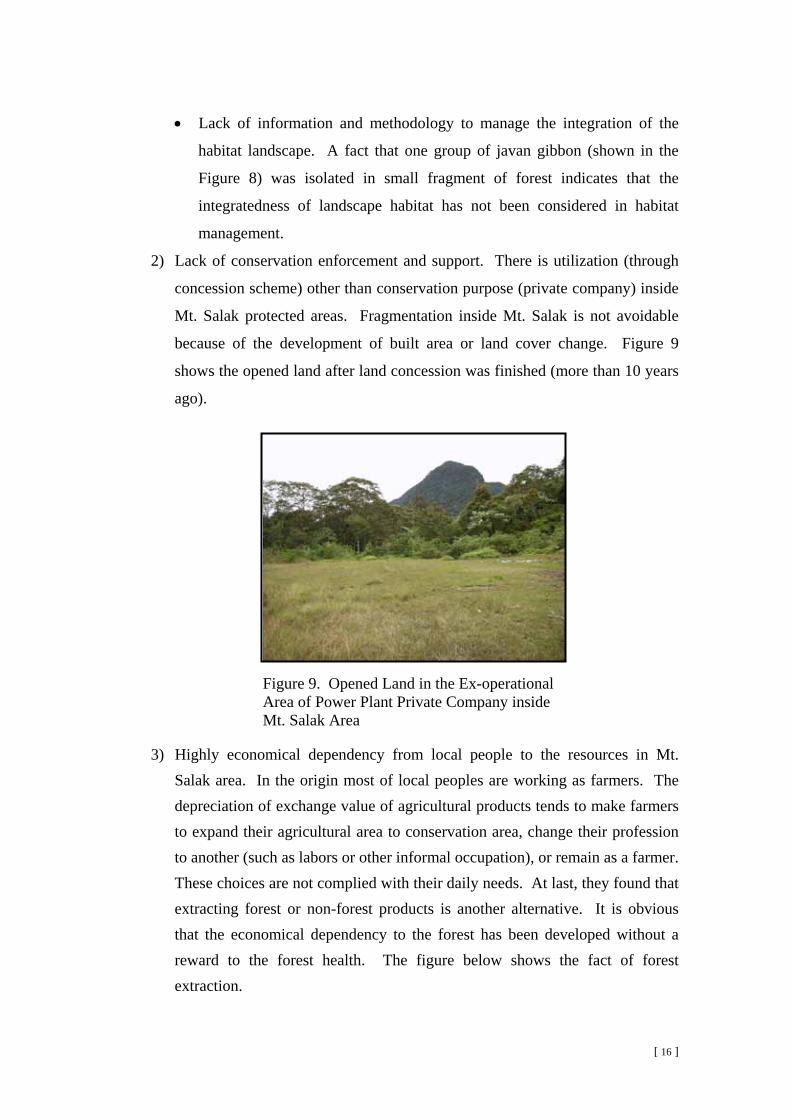
because of the development of built area or land cover change. Figure 9
shows the opened land after land concession was finished (more than 10 years
ago).
Figure 9. Opened Land in the Ex-operational Area of Power Plant Private Company inside Mt. Salak Area
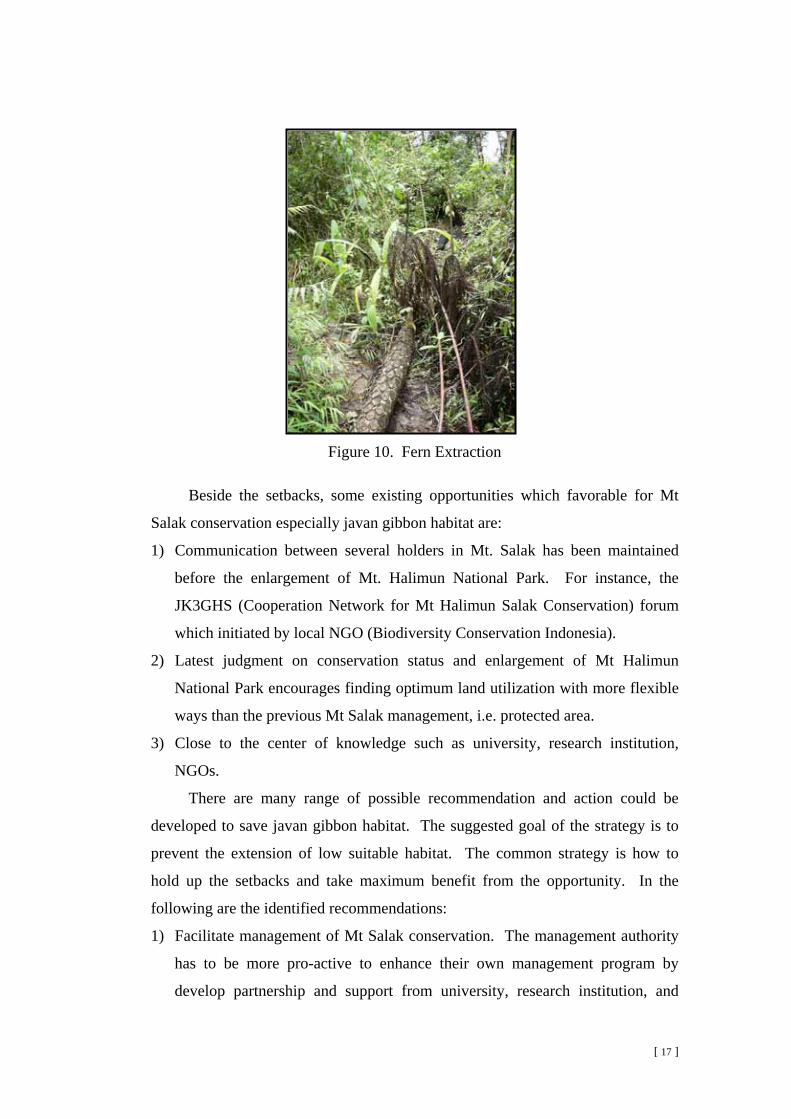
3) Highly economical dependency from local people to the resources in Mt. Salak area. In the origin most of local peoples are working as farmers. The depreciation of exchange value of agricultural products tends to make farmers to expand their agricultural area to conservation area, change their profession to another (such as labors or other informal occupation), or remain as a farmer. These choices are not complied with their daily needs. At last, they found that extracting forest or non-forest products is another alternative. It is obvious that the economical dependency to the forest has been developed without a reward to the forest health. The figure below shows the fact of forest extraction.
[ 17 ]
Figure 10. Fern Extraction
Beside the setbacks, some existing opportunities which favorable for Mt
Salak conservation especially javan gibbon habitat are:
1) Communication between several holders in Mt. Salak has been maintained
before the enlargement of Mt. Halimun National Park. For instance, the
JK3GHS (Cooperation Network for Mt Halimun Salak Conservation) forum
which initiated by local NGO (Biodiversity Conservation Indonesia).
2) Latest judgment on conservation status and enlargement of Mt Halimun
National Park encourages finding optimum land utilization with more flexible
ways than the previous Mt Salak management, i.e. protected area.
3) Close to the center of knowledge such as university, research institution,
NGOs.
There are many range of possible recommendation and action could be
developed to save javan gibbon habitat. The suggested goal of the strategy is to
prevent the extension of low suitable habitat. The common strategy is how to
hold up the setbacks and take maximum benefit from the opportunity. In the
following are the identified recommendations:
1) Facilitate management of Mt Salak conservation. The management authority
has to be more pro-active to enhance their own management program by
develop partnership and support from university, research institution, and

[ 18 ]
NGOs, including program for technical practice in wildlife-habitat
conservation, critical areas surveillance, and develop landscape rehabilitation.
At the same time, they have to resolve their vertically internal problem.
2) Reducing fragmentation inside Mt. Salak area by developing well designed
spatial-land utilization considering the linkage of javan gibbon habitat and
habitat suitability.
3) Provide information on critical area by considering socio-economical factor
and disturbances distribution in analysis. The result of this research could be
used to develop this critical area information.
4) Intensify and revitalize the forum of communication or initiative of all holders
in Mt. Salak, including local people, government (local and central
government), private company, and so forth.
5) Promote and/or institutionalize the integrated natural resources management
by establishing coordination among government department. This judgment is
potential to resolve the overlapped or natural resources management conflicts
and find the optimum land utilization for each natural resources management
entity and increase the bargaining position of conservation areas over other
type of land utilizations.
[ 19 ]
IV. FINANCIAL REPORT
This financial report used IDR (Indonesian Rupiah) currency since the
exchange rate has been fluctuating. The fund is classified into two groups, i.e.
administrative fund (used to manage or administer project, including management
salaries, communication, and administration) and operational fund (used in real
activities, such observation and data collection, data analysis, and reporting;
including rent and purchasing equipment, field labor honor, rations and medicines,
and transportation).
The total of fund given was Rp 87.235.819,- (eighty seven millions, two
hundred and thirty five thousands, eight hundreds and nineteen rupiahs); almost
80% was used, i.e. 69.274.750,- (sixty nine millions, two hundreds and seventy
four thousands, seven hundreds and fifty rupiahs) and remaining fund is Rp
17.961.069,- (seventeen millions, nine hundred and sixty one thousands, sixty nine
rupiahs). In summary, the fund was used to rent and purchase equipment
(35.90%), field labor honor/fee (15.48%), rations and medicines (14.78%),
transportation (3.82%), salaries (24.68%), communication (4.33%), and
administration (1.00%). More general, the fund was used to operational fund and
administrative for 69.99% and 30.01% subsequently. More detailed of the fund
utilization is provided in the table below on the next page.
[ 20 ]
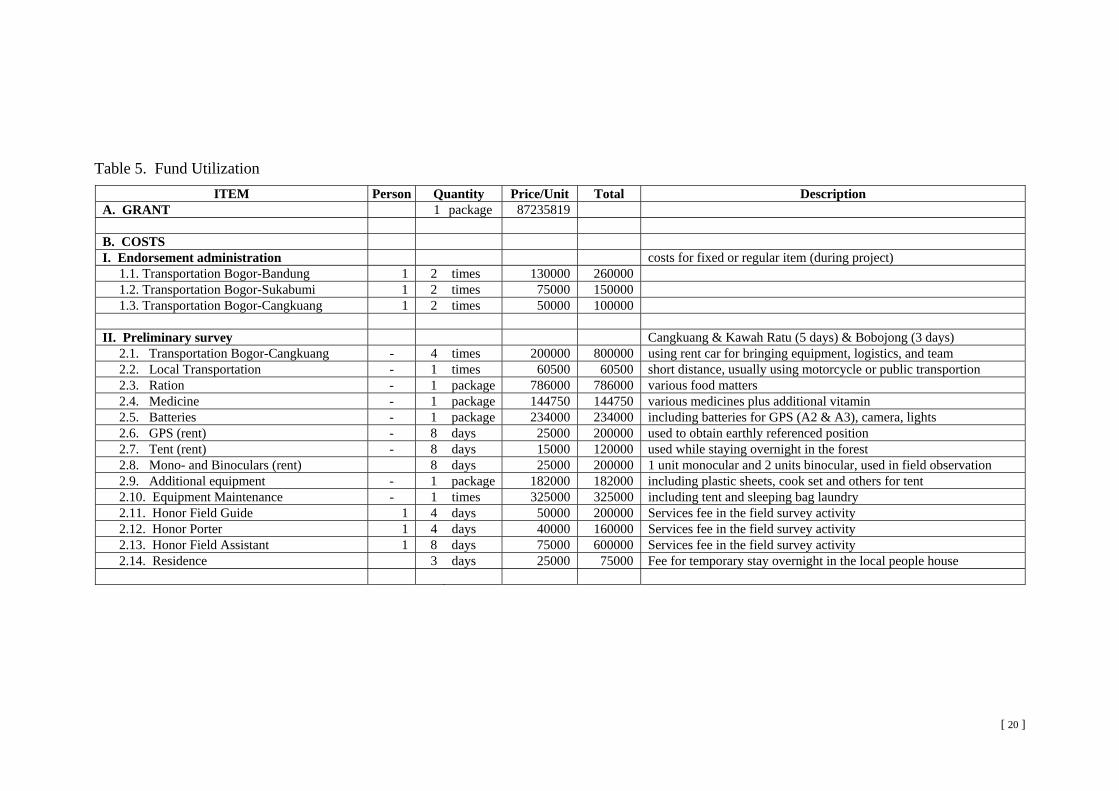
Table 5. Fund Utilization ITEM Person Quantity Price/Unit Total Description
A. GRANT 1 package 87235819 B. COSTS I. Endorsement administration costs for fixed or regular item (during project) 1.1. Transportation Bogor-Bandung 1 2 times 130000 260000 1.2. Transportation Bogor-Sukabumi 1 2 times 75000 150000 1.3. Transportation Bogor-Cangkuang 1 2 times 50000 100000 II. Preliminary survey Cangkuang & Kawah Ratu (5 days) & Bobojong (3 days) 2.1. Transportation Bogor-Cangkuang - 4 times 200000 800000 using rent car for bringing equipment, logistics, and team 2.2. Local Transportation - 1 times 60500 60500 short distance, usually using motorcycle or public transportion 2.3. Ration - 1 package 786000 786000 various food matters 2.4. Medicine - 1 package 144750 144750 various medicines plus additional vitamin 2.5. Batteries - 1 package 234000 234000 including batteries for GPS (A2 & A3), camera, lights 2.6. GPS (rent) - 8 days 25000 200000 used to obtain earthly referenced position 2.7. Tent (rent) - 8 days 15000 120000 used while staying overnight in the forest 2.8. Mono- and Binoculars (rent) 8 days 25000 200000 1 unit monocular and 2 units binocular, used in field observation 2.9. Additional equipment - 1 package 182000 182000 including plastic sheets, cook set and others for tent 2.10. Equipment Maintenance - 1 times 325000 325000 including tent and sleeping bag laundry 2.11. Honor Field Guide 1 4 days 50000 200000 Services fee in the field survey activity 2.12. Honor Porter 1 4 days 40000 160000 Services fee in the field survey activity 2.13. Honor Field Assistant 1 8 days 75000 600000 Services fee in the field survey activity 2.14. Residence 3 days 25000 75000 Fee for temporary stay overnight in the local people house
[ 21 ]
Table 5. Continued III. Main Survey 3.1. Transportation - 6 times 200000 1200000 3.2. Local Transportation - 1 package 79000 79000 3.3. Ration - 1 package 8707000 8707000 3.4. Medicine - 1 package 604500 604500 3.5. Batteries - 1 pairs 3539000 3539000 3.6. GPS Rent - 62 days 25000 1550000 3.7. Tent Rent - 62 days 15000 930000 3.8. Mono- and Binoculars (rent) 62 days 25000 1550000 3.9. Additional equipment - 1 package 288000 288000 3.10. Equipment Maintenance - 3 times 185000 555000 3.11. Honor Field Guide 1 56 days 50000 2800000 3.12. Honor Porter 1 56 days 40000 2240000 3.13. Honor Field Assistant 1 62 days 75000 4650000 IV. Stationary 4.1. Stationery 1 1 package 250000 250000 Materials and equipment used for writing and documenting 4.2. Analog Map (original and duplication) 1 5 sheets 35000 175000 Base map used in the field observation 4.3. Map container 1 1 unit 150000 150000 Map case for protecting maps from hazardous condition 4.4. Communication 1 12 months 250000 3000000 maintaining communication between team and related official 4.5. Day packs - 2 units 275000 550000 complementary field equipment, especially used during observation 4.6. Sleeping bag 2 1 unit 150000 300000 complementary field equipment, especially used for tent 4.7. Rain coat - 3 unit 75000 225000 complementary field equipment, especially used during observation 4.8. Flying sheet - 2 unit 350000 700000 complementary field equipment, especially used for tent 4.9. Lights - 2 units 35000 70000 complementary field equipment, especially used for tent 4.10. Notebook (secondhand) - 1 unit 8500000 8500000 data storage, processing and analysis, data preparation 4.11. Printer - 1 unit 400000 400000 Printing endorsement letters, report, references. 4.12. Print-cartridge - 2 unit 200000 400000 printing equipment 4.13. External Hardisk (30 GB) - 1 unit 950000 950000 portable storage 4.14. Flash Disk (256 MB) - 1 unit 300000 300000 portable storage 4.15. Notebook peripherals - 1 unit 75000 75000 including USB port extension and cables
[ 22 ]
Table 5. Continued 4.16. Digital Cammera (7 MB Resolution) - 1 unit 2000000 2000000 used for documenting 4.17. Memory card (128 MB) - 1 unit 150000 150000 used to store camera images V. Salaries 5.1. Project coordinator salary 1 12 months 700000 8400000 coordinating, liason, report preparation 5.2. Project assistant salary 1 12 months 600000 7200000 survey logistic, field data collection and data entry 5.1. GIS Application Developer Assistant 1 1 package 1500000 1500000 GIS application development for dynamic data processing VI. Report distribution 6.1. Report duplication - 9 copies 35000 315000 6.2. Report distribution/post delivery - 5 units 75000 375000 C. TOTAL COST (I – VI) 69274750 D. REMAINING FUND (GRANT – TOTAL COST) 17961069
[ 23 ]
ACKNOWLEDGEMENT
We are very grateful to Rufford Small Grant for Nature Conservation for
supporting these activities under grant agreement number: 153.01.05. In this
opportunity, we would like express our gratitude for the support from three
referees (Dr Lilik B. Prasetyo, Dr. Tania June, and Mr. Kanenori Miura) since in
the beginning of the project formulation. We are also addressing thanks to
technical members in the field, Biodiversity Conservation Indonesia for
supporting some equipments, and official from PT Perhutani and Mt Halimun
Salak National Park for project administration and data sharing.
[ 24 ]
BIBLIOGRAPHY
August, P., C. Baker, C. LaBash, and C. Smith. 1996. The geographic information system for storage and analysis of biodiversity data. In: Measuring and Monitoring Biological Diversity: A standard methods for mammals. D.E. Wilson, F.R. Cole, J.D. Nichols, R. Rudran, and M.S. Foster (Eds.). Smithsonian Institution Press. Washington.
Bailey, J. A. 1984. The Principles of Wildlife Management. John Wiley & Sons. New York. Burrough, P.A. and R.A. McDonnell. 1998. Principles of Geographical Information Systems.
Oxford University Press. Oxford. De Leeuw, J., W.K. Ottichilo, A.G. Toxopeus, and H.H.T. Prins. 2002. Application of remote
sensing and geographic information systems in wildlife mapping and modeling. In: Environmental Modelling with GIS and Remote Sensing. A. Skidmore (ed.). Taylor and Francis. London and New York.
De By, R.A. and W. Kainz. 2000. Geographic information and spatial data types. In: Principles
of Geographic Information Systems: An introductory textbook. R.A. de By (Ed.). The International Institute for Aerospace Survey and Earth Sciences (ITC). Enschede.
Djanubudiman, G., M.I. Setiadi, F. Wibisono, J. Arisona, G. Mulcahy, and M. Indrawan. 2003.
Current distribution and conservation priorities for the javan-gibbon (Hylobates moloch). The Indonesian Foundation for the Advancement of Biological Sciences (YABSHI) and Center for Biodiversity Conservation Studies (CBCS) – University of Indonesia (PSBK-UI). Project Report. Jakarta.
Eudey, A. and Members of the Primate Specialist Group 2000 (MPSG2000). 2004. Hylobates
moloch. In: IUCN Red List of Threatened Species. URL: http://www.redlist.org. Accessed: December 17th, 2004.
Kainz, W., R.A. de By, and M.C. Ellis. 2000. Data processing systems. In: Principles of
Geographic Information Systems: An introductory textbook. R.A. de By (Ed.). The International Institute for Aerospace Survey and Earth Sciences (ITC). Enschede.
Kappeler, M. 1984. Diet and Feeding Behaviour of the Moloch Gibbon. Edinburgh University
Press. Ladjar, L.N. 1996. Aktivitas harian dan penggunaan habitat pada keluarga owa jawa (Hylobates
moloch audebert) liar di Cikaniki, Taman Nasional Gunung Halimun, Jawa Barat. Bachelor Degree Thesis. Faculty of Biology, National University. Jakarta.
Ludwig, J.A. and J.F. Reynolds. 1988. Statistical Ecology: A primer on methods and computing.
John Wiley & Sons. New York. Lembaga Ilmu Pengetahuan Indonesia (LIPI), Biodiversity Conservation Programme - Japan
International Cooperation Agency (BCP-JICA), and Balai Taman Nasional Gunung Halimun (BTNGH). 2003. Action Plan for Endangered Species in Gunung Halimun National Park. BCP-JICA. Bogor.
Malczewski, J. 1999. GIS and Multicriteria Decision Analysis. John Wiley and Sons. New York. McGarigal, K., S. Cushman, and S. Stafford. 2000. Multivariate Statistics for Wildlife and
Ecological Research. Springer. New York. Morrison, M.L., B.G. Marcott and R.W. Mannan. 1992. Wildlife Habitat Relationship. The
University of Wisconsin Press. Wisconsin.
[ 25 ]
Napier, J.R. 1972. Primates and Their Adaptions. Oxford University Press. London. Prastyono. 1999. Variasi aktivitas harian owa jawa, Hylobates moloch (Audebert, 1798) menurut
kelas umur di Taman Nasional Gunung Halimun, Jawa Barat. Bachelor Degree Thesis. Forest Resources Conservation Department, Faculty of Forestry, Bogor University of Agriculture. Bogor.
Press, W.H., S.A. Teukolsky, W.T. Vetterling, and B.P. Flannery. 1992. Numerical Recipes in C:
The art of scientific computing. 2nd Edition. Cambridge University Press. Cambridge. Primack, R., J. Supriatna, M. Indrawan, dan P. Kramadibrata. 1998. Biologi Konservasi. Yayasan
Obor Indonesia. Jakarta. Republik Indonesia. 1998. Peraturan Pemerintah No. 68 Tahun 1998 tentang Kawasan Suaka
Alam dan Kawasan Pelestarian Alam. Lembaran Negara Republik Indonesia Tahun 1998, No. 132. Sekretariat Kabinet RI. Jakarta.
Rahayu, N. 2002. Variasi perilaku makan dan pemilihan jenis pakan owa jawa (Hylobates
moloch audebert, 1798) berdasarkan beberapa struktur populasinya di Cikaniki, Taman Nasional Gunung Halimun. Bachelor Degree Thesis. Forest Resources Conservation Department, Faculty of Forestry, Bogor University of Agriculture. Bogor.
Skidmore, A. 2002. Taxonomy of environmental models in the spatial sciences. In:
Environmental Modelling with GIS and Remote Sensing. A. Skidmore (ed.). Taylor and Francis. London and New York.
Sun, Y., C.J. van Westen, E.J. Sides. 2000. Spatial data analysis. In: Principles of Geographic
Information Systems: An introductory textbook. R.A. de By (Ed.). The International Institute for Aerospace Survey and Earth Sciences (ITC). Enschede.
Supriatna, J., Tilson, R., Gurmaya, K.J., Manansang, J., Wardojo, W., Sriyanto, A., Teare, A.,
Castle, K. & Seal, U. (eds.). 1994. Javan gibbon and javan langur: population and habitat viability analysis report. IUCN/SSC Conservation Breeding Specialist Group. Minnesota.
Tobing, I.S.L. 1999. Pengaruh perbedaan kualitas habitat terhadap perilaku dan populasi primata
di kawasan Cukaniki, Taman Nasional Gunung Halimun, Jawa Barat. Master Degree Thesis. Graduate Program, Bogor Agriculture University.

[ 26 ]
APPENDICES

[ 27 ]
Appendix 1. Tally Sheet for Gibbon Survey
Date Base: Team Started/Ended Time:
Age Classes Ind. Pos. Ctc.Type Time Observer Lat/Long Az. Dist. Behav.
AM AF SM SF J I 1 1a (V,A) (F,S,M,R) 1b
2 2a 2b
3 3x 4 5
Coding details:
Ind.= gibbon individual code Pos.= observer position code Ctc.type= contact type (V: visual, A: audio) Time= time of contact Az.= azimuth/direction to source Dist.= distance Behav= behavior (F: feeding, S: socializing, M: moving, R: resting) Age classes: individual found
[ 28 ]
Appendix 2. Javan Gibbon Distribution Data in Mt. Salak Used in the Analysis Age Classes
No Date Time X Y Contact Type AM AF SM SF J I
1 13/06/06 10.45 689374.143 9261919.566 A 1
2 02/06/06 14.14 691088.992 9260387.148 A 1
3 03/06/06 10.15 692092.361 9260387.148 A 1
4 29/05/06 09.09 692712.625 9260934.441 V 1 1
5 07/06/06 11.09 692712.625 9259329.050 A 1
6 31/01/06 12.47 690341.026 9255844.624 V 1
7 01/02/06 8.3 689301.171 9256519.617 A 1
8 01/02/06 12.02 689009.282 9255935.839 V 1
9 31/01/06 8 688699.149 9255881.110 A 1
10 25/02/06 8.3 687987.670 9255461.519 A 1
11 08/04/03 09.52 687385.648 9255899.353 A 1
12 26/02/06 11.03 687841.725 9256227.728 V 1 1
13 08/04/03 09.52 686309.307 9257012.180 A 1
14 12/03/06 09.50 689209.955 9254385.178 V 1 1
15 03/02/06 15.3 689666.032 9253965.587 V 1 1 1 1
16 28/01/06 7.15 688607.934 9253983.830 A 1 1
17 24/02/06 7.45 687768.753 9254148.018 A 1
18 07/04/03 12.35 683262.714 9256300.700 V 1
19 07/04/03 13.05 683025.554 9255899.353 V 1
20 09/04/03 14.50 683536.360 9253345.323 V 1
21 13/04/03 08.10 684339.055 9252524.384 A 1
22 05/04/03 08.30 683810.006 9252341.954 V 1 1
23 13/04/03 10.50 683408.658 9252250.738 V 1
24 11/04/03 14.49 682095.157 9252177.766 V 1 1 1
25 11/04/03 07.35 682642.449 9253436.538 V 1 1 1
26 04/04/03 11.11 682824.880 9253618.969 V 1 1
27 12/04/03 10.30 681547.865 9254275.719 V 1
28 04/04/03 16.50 681511.379 9255242.602 V 1 1 1
29 04/04/03 15.08 681620.837 9255461.519 A 1

[ 29 ]
Appendix 3. Javan Gibbon Distribution Survey Map

[ 30 ]
Appendix 4. Accessibility (road and track) in Mt. Salak
[ 31 ]
Appendix 5. Land Cover of Mt. Salak
[ 32 ]
Appendix 6. Forest Ecosystem (Elevation Based) in Mt. Salak

[ 33 ]
Appendix 7. Rivers in Mt. Salak Map